
Abstract
An individual’s activity space reflects their physical movement through and exposure to environments, including potentially risky settings. Historically, women’s and men’s activity spaces differed as a function of gendered household responsibilities. There are also gendered dynamics of place including experiences of victimisation, women’s heightened perceptions of victimisation risk, and perceived gendered threat for women that influence gendered spatial mobility patterns. Victimisation, risk and threat are known to have distinct spatial and temporal rhythms, which may lead women to withdraw from public spaces. This paper considers the intersection of all these factors and their relationship to women’s and men’s neighbourhood activity spaces. Drawing on individual global positioning system data for 365 participants living in Brisbane Australia over a seven-day period and using structural equation modelling, we seek to understand the predictors of activity space characteristics for women and men across day and night. We operationalise activity spaces through potential neighbourhood street networks (potential entropy), users’ actual movement (user entropy), and duration of time spent in the neighbourhood. Our findings reveal that women’s victimisation experiences and perceptions of community action are important predictors of time spent in the neighbourhood. Furthermore, street network configuration (potential entropy) is associated with actual user movement (user entropy). The findings have implications for gender-sensitive design in urban neighbourhood settings, in highlighting the interaction between social environments and physical environments in women’s and men’s daily mobility.
Introduction
The features and characteristics of geographical spaces are important for understanding social life and the social meanings attributed to spaces and places (Gieryn, 2000; Urry, 2001). The social sciences have sought to conceptualise and operationalise space, place and their associated social meanings through studying cities, neighbourhoods, and street segments (Jacobs, 1961; Park, 1915; Sampson, 2012; Weisburd et al., 2012), with few scholars focussing on the spatial patterns and routines of an individual’s daily activities and the temporality of these activity spaces (Golledge and Stimson, 1997; Horton and Reynolds, 1971). The concept of activity spaces provides a useful approach to understanding how people move through their environment, when individuals access certain places or engage in daily activities, and how this movement may then connect to their experiences of space and place.
Geographical spaces also shape women’s and men’s spatial mobility. Scholars theorise that public spaces are patriarchal arenas that are not always welcoming to women and can be the sites for experiences of harassment and other forms of violence against women (Kalms, 2024; Kern, 2021; Massey, 1994; Valentine, 1990). Studies that provide rich descriptions of women’s experiences of urban spaces reveal that women avoid specific locations or specific places at certain times due to safety concerns (Cobbina et al., 2008; Kern, 2021; Mason-Bish and Zempi, 2018), which may result in fragmented or less physically extensive activity spaces. The complexities of women’s experiences in urban spaces are clear, as detailed portrayals reveal women moving confidently through public spaces when they believe themselves to have self-efficacy, belonging, and agency (Kern, 2005, 2021; Koskela, 1997).
Women’s lived experiences of risk in urban areas have largely been examined through qualitative interviews and self-report surveys. Yet recent research on gendered social relations in public places presents opportunities for the development of new insights. Emerging technologies and granular locational data have expanded the ways in which mobility and movement are conceptualised and operationalised (Cagney et al., 2020). These developments provide an opportunity to compare women’s and men’s use and understanding of space and place. Where previous studies point to women’s and men’s different spatial mobility patterns (Altintas and Sullivan, 2016, 2017; Fan, 2017; Kwan, 1999a, 1999b; Sayer, 2016; Scheiner et al., 2011; Schwanen et al., 2008), these new technologies allow us to more closely examine the relationship between mobility and the local gendered dynamics of place by exploring victimisation, perceptions of risk, and gendered threat (Jackson et al., 2017; Keel et al., 2024b).
The present study considers the individual and neighbourhood factors that shape the activity spaces of women and men. Activity spaces are operationalised using a measurement framework that captures an individual’s time spent in the neighbourhood, their actual spatial movement (where they specifically travelled over a period of seven days), and the potential neighbourhood street networks (where they could have potentially travelled during this same time period; Corcoran et al., 2024). The current study draws on 365 participants’ individual global positioning system (GPS) locational data alongside a cross-sectional survey capturing individual demographics, perceptions of crime, and experiences of victimisation. This study integrates several data sources to innovatively explore the spatiotemporal activity spaces of women and men in urban neighbourhoods.
A gendered social constructionof crime and risk
The fear of crime literature has identified core differences between how women and men perceive risk in public spaces (Farrall et al., 2009; Jackson, 2009; Snedker, 2012, 2015), which may explain possible differences in men’s and women’s mobility patterns. For example, a behavioural consequence of women’s heightened perceived risk of victimisation and the harassment of women by men in public spaces is a withdrawal from public spaces and constrained behaviours (Fileborn and O’Neill, 2023; Kalms, 2024; Mason-Bish and Zempi, 2018; Pain, 2001; Zhang et al., 2022). However, it is unclear how this behavioural modification in response to gendered crime and risk influences women’s daily activity spaces and spatial mobility patterns.
Gendered dynamics embedded in the structural characteristics of some neighbourhoods also shape women’s and men’s experiences of their local environment (Jackson, 2016; Jackson et al., 2017; Jackson-Soller and Coleman, 2024; Keel et al., 2024b; Soller and Jackson, 2018), which could influence their mobility patterns. Integrating administrative data with survey data, Jackson points to the importance of gendered informal social control in shaping perceptions of community problems (Jackson et al., 2017) and gendered violence (Jackson, 2016). This research by Jackson and colleagues emphasised the stratification of economic resources between women and men as a driving mechanism of place-based gendered relations (Jackson, 2016; Jackson et al., 2017; Jackson-Soller and Coleman, 2024; Soller and Jackson, 2018). In neighbourhoods with higher female economic resources, young girls reported higher self-efficacy (Soller and Jackson, 2018). Using similar survey and administrative data, an Australian study by Keel et al. (2024b) found that although the stratification of economic resources did not influence women’s and men’s experiences of their local environment, the concentration of crime differentially influenced the way in which women and men perceived their vulnerability to victimisation. These prior studies, while not focussed on mobility, provide insights into how the gendered context of the neighbourhood might differentially influence women’s and men’s mobility choices.
The presence or perception of gendered threats in the neighbourhood is also important for women’s experiences of place (Cobbina et al., 2008; Keel and Lee, 2025; Mason-Bish and Zempi, 2018). Using interview data from 24 women, Keel and Lee’s (2025) study of gendered neighbourhood dynamics in high-crime neighbourhoods highlighted women’s experiences of harassment and community responses to the same. Gendered threat in public spaces manifesting as street harassment sent a message to women that not only did they not belong in public spaces, but their community would also not effectively intervene to support them if harassment occurred (Keel and Lee, 2025; Mason-Bish and Zempi, 2018). Keel and Lee’s (2025) study also found that the extent to which women perceive threat, their efficacy to respond to threat and the broader community’s prevention of threat shaped women’s sense of safety and may also explain differences in women’s and men’s mobility patterns.
Emerging research with an explicit focus on spatial patterns has revealed that the variations in crime across space and time create different victimisation contexts for women and men (Moreira and Ceccato, 2021; Savard, 2018; Savard et al., 2017). Moreira and Ceccato’s (2021) study examined trips taken on public transport in São Paulo, Brazil, alongside exposure to violent victimisation. They found that women travelled more frequently on public transport and spent longer periods of time on public transport to carry out daily activities when compared to men. Furthermore, there was an increase in men’s victimisation occurring at the end of a metro line that was not present for women. In contrast, at central stations at night, women’s risk of experiencing violence was greater (Moreira and Ceccato, 2021). Overall, Moreira and Ceccato’s study highlighted that the spatiotemporal settings where women and men experienced violence were not the same. Again, while their research did not expressly consider gendered differences in mobility patterns, it pointed to the reasons behind the differences in women’s and men’s activity spaces.
Activity spaces, gender roles, and routine activities
While the criminological scholarship has considered women’s movement through narratives of constrained behaviour due to crime risk, the transport scholarship provides an account of women’s and men’s spatial mobility patterns that are often not considered. From this body of work, we know that in general women travel shorter distances at different times of the day with more frequent stops compared to men, and women are more likely to use different modes of transport, such as public transport, while men are more likely to use private vehicles (Altintas and Sullivan, 2016, 2017; Fan, 2017; Sayer, 2016; Scheiner et al., 2011). Within the transport scholarship, researchers tend to agree that the differences between women’s and men’s mobility patterns are largely due to gendered dynamics in the household, including those related to household structure and childcare arrangements (Craig and van Tienoven, 2019; Fan, 2017; Hanson, 2010; Kwan, 1999a, 1999b; Schwanen et al., 2008; Solà, 2016). These include women working part time, being more likely to pick children up from childcare or school and carrying the responsibility for household tasks such as cooking dinner and cleaning. Such factors constrain women’s time more consistently than men’s, thereby shaping women’s spatial and temporal mobility patterns throughout their everyday lives (Kwan, 1999a, 1999b; Schwanen et al., 2008). There are also differences in the travel modes used by women and men, such as public transport and private vehicle, that in part influence gendered spatial mobility (Craig and van Tienoven, 2019; Fan, 2017; Hanson, 2010; Schwanen et al., 2008), although these differences have reduced over time, particularly among younger cohorts (Borgato et al., 2021; Susilo et al., 2019; Viry and Kaufmann, 2015). Viry and Kaufmann (2015) found that the changing structures of families and labour markets have reduced gender differences in mobility patterns, suggesting that structural factors rather than gender itself may drive observed differences in particular contexts.
Activity spaces encapsulate the places that people visit and the pathways they take throughout their daily routines (Hägerstrand, 1970; Lenntorp, 1976). The concept of activity spaces has been used in geography and spatially integrated social science (Hägerstrand, 1970; Lenntorp, 1976) to develop insights into racial and ethnic segregation of daily activities (Wong and Shaw, 2011), social networks, community cohesion (Browning et al., 2017), health-related risks and behaviours (Mason et al., 2015; Tamura et al., 2017), and crime (Brantingham and Brantingham, 1981; Simons et al., 2014; Wikström et al., 2010, 2012). As it relates to crime, victimisation and safety, activity space research often focuses on the interaction between criminogenic environments and offenders to understand the spatial patterns of crime (Brantingham and Brantingham, 1981; Simons et al., 2014; Wikström et al., 2010, 2012). This literature has revealed a complex relationship between offending and the home neighbourhood. While some studies have found that offenders are more likely to commit crimes closer to their home neighbourhood or that of a family member (Bernasco, 2010; Menting et al., 2016), others have found that offenders travel much further from their home neighbourhood (Bichler et al., 2011). Regarding the activity spaces of victims or potential victims, studies show that victimisation risk varies across different parts of an individual’s activity space (Brantingham and Brantingham, 1995), and further, victims experience crime in familiar areas within their routine activity spaces rather than in completely unknown locations (Fisher and Wilkes, 2003). This points to the importance of examining an individual’s mobility space within their neighbourhood.
The mobility snowflake: Using potential entropy and user entropy to measure activity spaces
Activity spaces are often measured using trip frequencies and travel distances to different activities (Corcoran et al., 2024; Scheiner et al., 2011). Through the 1990s and early 2000s, scholars expanded on the original theorisations of activity spaces to consider street networks and land parcels (Kwan, 1998) in addition to the temporal dimensions of activity spaces such as timing and duration of movement (Mokhtarian et al., 2006). The emergence of smartphone use in research has created an opportunity to gather trace data that was not previously possible (Cagney et al., 2020). As a result, theoretical and methodological approaches to capturing activity spaces are rapidly developing to better understand the ways in which mobility and space shape urban social life (see Cagney et al., 2020, for a full review).
The mobility snowflake’s visual analytic and associated measurement framework offers an empirical measure of the directionality of activity spaces that provides insights into the spatial flows of individuals in everyday neighbourhood life (Corcoran et al., 2024). The mobility snowflake is a polar histogram visualisation that broadly resembles a snowflake comprised of 36 bars radiating from a central locus, where each bar represents movement in a specific compass direction, and the length of each bar indicates the frequency of movement in that direction. Empirically, the mobility snowflake uses Shannon entropy (a mathematical concept) to measure how evenly movement is distributed across different directions. This approach quantifies the complexity of both street patterns and observed mobility patterns. These two concepts are directly relevant to the current study. Potential entropy captures the street patterns and represents the theoretical maximum movement opportunities available within a given neighbourhood’s street network configuration. This includes all possible directions in which an individual resident of that neighbourhood could travel if they fully utilised the entirety of their local street network. Actual user entropy represents the observed mobility patterns of residents. It reveals the parts of the neighbourhood street network that individuals actually use. Higher entropy scores indicate more diverse directional movement, while lower scores suggest movement concentrated along fewer axes. By comparing the entropy values of potential street networks with actual movement patterns, the mobility snowflake framework permits examination of how neighbourhood street network design influences women’s and men’s mobility patterns. For example, a lower entropy score may indicate restricted mobility and in turn potential avoidance behaviours that may or may not be in response to gendered dynamics around risk and crime. The current study draws on both potential entropy and actual user entropy as a novel methodological approach to quantify directional mobility patterns that traditional activity space measures often miss. By integrating the mobility snowflake metrics (potential and actual user entropy) with demographic, temporal, and experiential and perceptual information, we can examine how neighbourhood street network design intersects with individual and neighbourhood characteristics to shape gendered spatial mobility patterns.
The study
A key objective of this research is to test the associations between the primary theorised mechanisms underpinning women’s spatial mobility patterns with women’s observed movements in the neighbourhood and then to contrast these relationships with the dynamics shaping men’s spatial mobility patterns. Our focus is deliberately confined to neighbourhood-level movements for several theoretical and methodological reasons. First, previous research indicates that residents perceive crime and safety differently within their neighbourhood boundaries compared to areas beyond those boundaries (Sampson, 2012). Second, the majority of daily activities–particularly those involving household responsibilities and routine care work–occur within residential neighbourhoods rather than in employment centres. In the Australian context, suburbs function like census tracts in the United States, though they may occasionally encompass larger areas as their delineation is not population dependent. Throughout this analysis, we employ the term ‘neighbourhood’ for clarity. This study asks if experiences of victimisation, perceptions of risk, and gendered threat influence the patterns of women’s and men’s actual daily movements in their neighbourhoods. Using the mobility snowflake–a novel measurement of neighbourhood mobility–and drawing on a comprehensive analysis of the various factors that might influence gendered mobility patterns, we consider the gendered dynamics of household responsibilities, experiences of victimisation, perceptions of risk, and gendered threat. We also incorporate the neighbourhood conditions that either directly or indirectly influence spatial patterns, such as crime and disadvantage (Corcoran et al., 2024). Finally, this study explores the temporal nature of these relationships, which determines the variation of spatial mobility across day and night (Moreira and Ceccato, 2021; Zhang et al., 2022).
A schematic framework of gendered spatial mobilities
The schematic framework outlined in Figure 1 includes the key factors that are theorised to influence the spatial mobilities of women and men in urban neighbourhoods.
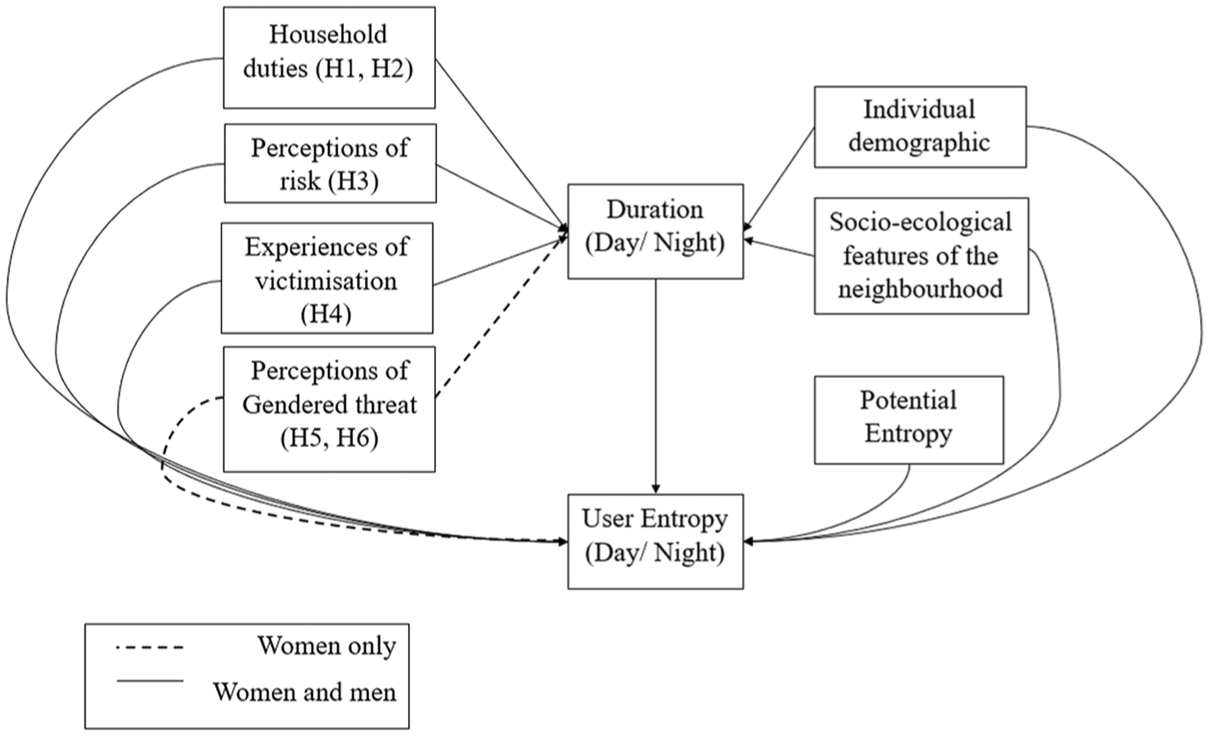
Schematic framework of key factors that influence the spatial mobilities of women and men.
The schematic framework outlined above translates into specific, measurable predictions about both the duration of time spent in neighbourhoods and the complexity of movement patterns, captured through entropy measures. Duration reflects the total time individuals spend within their residential neighbourhood boundaries, whilst entropy measures the randomness and complexity of spatial patterns–higher entropy indicating more varied, unpredictable movement routes and destinations within the neighbourhood space.
Neighbourhood space–time use for women is thought to be influenced by women’s greater responsibilities for household duties (Kwan, 1999a, 1999b; Schwanen et al., 2008). Working part time and having dependent children is understood to be a key measure of the household structures that shape women’s space–time use (Craig and van Tienoven, 2019; Fan, 2017; Hanson, 2010; Kwan, 1999a, 1999b; Schwanen et al., 2008; Solà, 2016). These household responsibilities necessitate more frequent and varied trips within the neighbourhood, school drop-offs, local shopping, accessing services, which should manifest as both longer durations spent in the neighbourhood and more complex, entropy-rich movement patterns as women navigate between multiple local destinations. Drawing on the research on the gendered nature of household duties and spatial mobility patterns, we hypothesise that:
H1: Working part time will increase duration of time spent and increase actual user entropy in the neighbourhood and the association will be stronger for women’s models.
H2: Having dependent children will increase duration of time spent and increase actual user entropy in the neighbourhood and the association will be stronger for women’s models.
Crime and risk may influence the way in which women and men move through their neighbourhood. In particular, avoidance behaviours result in less time spent in the neighbourhood and less complex spatial mobility patterns, which are measured in this study through user entropy. Fear and risk perceptions theoretically translate into spatial avoidance behaviours, choosing familiar, well-lit routes, avoiding certain areas entirely, and reducing overall time spent in public neighbourhood spaces. These behaviours should manifest as reduced duration in neighbourhood spaces and lower entropy values, as movement patterns become more constrained, predictable, and route-repetitive. The following four hypotheses draw on the four key factors associated with gendered dynamics of crime and risk identified in the literature.
A higher perception of risk of victimisation is associated with a higher likelihood to report avoidance behaviours. As women have heightened perceptions of risk of victimisation when compared to men, avoidance behaviours would be higher for women (Farrall et al., 2009; Jackson, 2009; Snedker, 2012, 2015). Therefore, Hypothesis 3 states:
H3: Heightened risk perceptions will reduce duration of time spent in the neighbourhood, and compared to men, women will display less actual user entropy than what is possible in the neighbourhood.
Neighbourhood victimisation is associated with avoidance behaviours and a withdrawal from neighbourhood life (Cobbina et al., 2008; Mason-Bish and Zempi, 2018). It is argued that women who have experienced victimisation may be more likely than men to demonstrate these behaviours (Snedker, 2012). Therefore, Hypothesis 4 stipulates:
H4: Experiencing victimisation will reduce duration of time spent in the neighbourhood and reduce actual user entropy. Further, this association will be stronger for women.
Women experience threats that are rarely present in men’s lived experience of the neighbourhood (Fileborn and O’Neill, 2023; Keel and Lee, 2025). For example, street harassment sends a message from the community to women that they are unsafe (Keel and Lee, 2025). Conversely, when women perceive community support or feel empowered to respond to threats, this should theoretically enable more confident navigation of neighbourhood spaces, translating into increased time spent locally and more varied, entropy-rich movement patterns as spatial constraints are reduced. The following two hypotheses relate to the gendered threat represented by street harassment–the first in relation to perceived community action in response to gendered threat and the second in relation to individual action in response to such threat.
H5: For women, perceptions that the community will intervene in threats against women’s safety will be associated with women’s increased duration of time spent in the neighbourhood and increased actual user entropy in the neighbourhood.
H6: Women who feel able to take action in response to specific threats posed to them will increase the duration of time spent and actual user entropy in the neighbourhood.
Finally, Hypothesis 7 relates to the argument that women’s and men’s movements are temporally distinct. These temporal differences should be particularly pronounced at night, when safety concerns intensify and the theoretical mechanisms outlined above–household responsibilities, risk perceptions, and gendered threats–interact with darkness to create distinct gendered patterns in both duration and entropy measures. This is particularly true of nighttime mobility.
H7: The relationship outlined in H1–H6 will differ according to the time of day, and these differences will be more marked for women.
Study site, data, and variables
This study utilises data from the Perceptions and Experiences of Place (PEP) project (2023) combined with administrative data to examine place-based perceptions and experiences in Brisbane, Australia. The research design incorporates baseline survey data, mobility tracking, and ecological momentary assessment (EMA) of a representative population sample.
Urban context: Brisbane, Australia
Brisbane’s urban morphology is characterised by low-density suburban development radiating from a central business district (CBD), running along either side of the Brisbane River. Transportation patterns in Brisbane reveal significant automobile dependence (74% of commuter trips), with public transit usage at approximately 14% (primarily via buses and trains) and cycling constituting only 2% of commuter journeys. In general, spatial movement within Brisbane follows a distinct pattern shaped by its radial road network and the river’s natural division of the city. Employment is predominantly concentrated in the CBD and inner-ring suburbs, generating predictable commuting flows from outer areas. Mobility patterns exhibit notable variation across neighbourhoods. Inner- and middle-ring suburbs with high walkability indices and robust local amenities demonstrate higher rates of active transportation for proximate destinations. Despite this, inter-neighbourhood travel and journeys to major activity nodes remain predominantly car based, consistent with the city’s overall automobile dependency.
Data collection
The PEP project investigated the spatial and temporal dimensions of social and physical environments and their relationship to residents’ perceptions and experiences of place. A third-party research organisation was commissioned to randomly sample participants from representative panels. 1 The baseline survey was administered between 12 October and 24 November 2022, targeting residents of Greater Brisbane aged 18 and above. There was a response rate of 10% from initial contact to completion of the entrance survey. Of the 1613 residents who responded to the entrance survey, 365 went on to complete the full study, representing a completion rate of 22.6% from the entrance survey to end of the GPS tracking phase. The entrance survey sample was largely representative of the broader population of Greater Brisbane. The full study sample had a slightly greater portion of women compared to men due to non-completion. This study has a similar completion rate to previous studies that have used a mobile phone application to gather trace data and EMAs. For example, Browning et al.’s (2024) research on spatial mobility among young people obtained a response rate of 21.3%.
Following completion of a 20-minute entrance survey, the participants engaged in a seven-day study utilising smartphone technology to respond to Experience Sampling Assessments (ESAs) and collect Global Positioning System (GPS) trace data. Participants were informed that they needed to have locational services on to allow passive collection of location data throughout the day in addition to responding to ESAs.
Data
Four sources of administrative data were also used in this study. We integrated sunrise and sunset temporal data sourced from Geoscience Australia to temporally code GPS points as day or night. Crime incident data from Queensland Police Service for the year 2021–2022 was used to capture levels of crime in the home neighbourhood. Population and land use data from the 2021 Census of Population and Housing (Australian Bureau of Statistics (ABS), 2021a, 2021b) were integrated to measure land use mix and concentrated disadvantage. Finally, spatial street network data were extracted from OpenStreetMap and used to develop the activity space measures. All variables constructed from these data are discussed in the next section.
Study variables
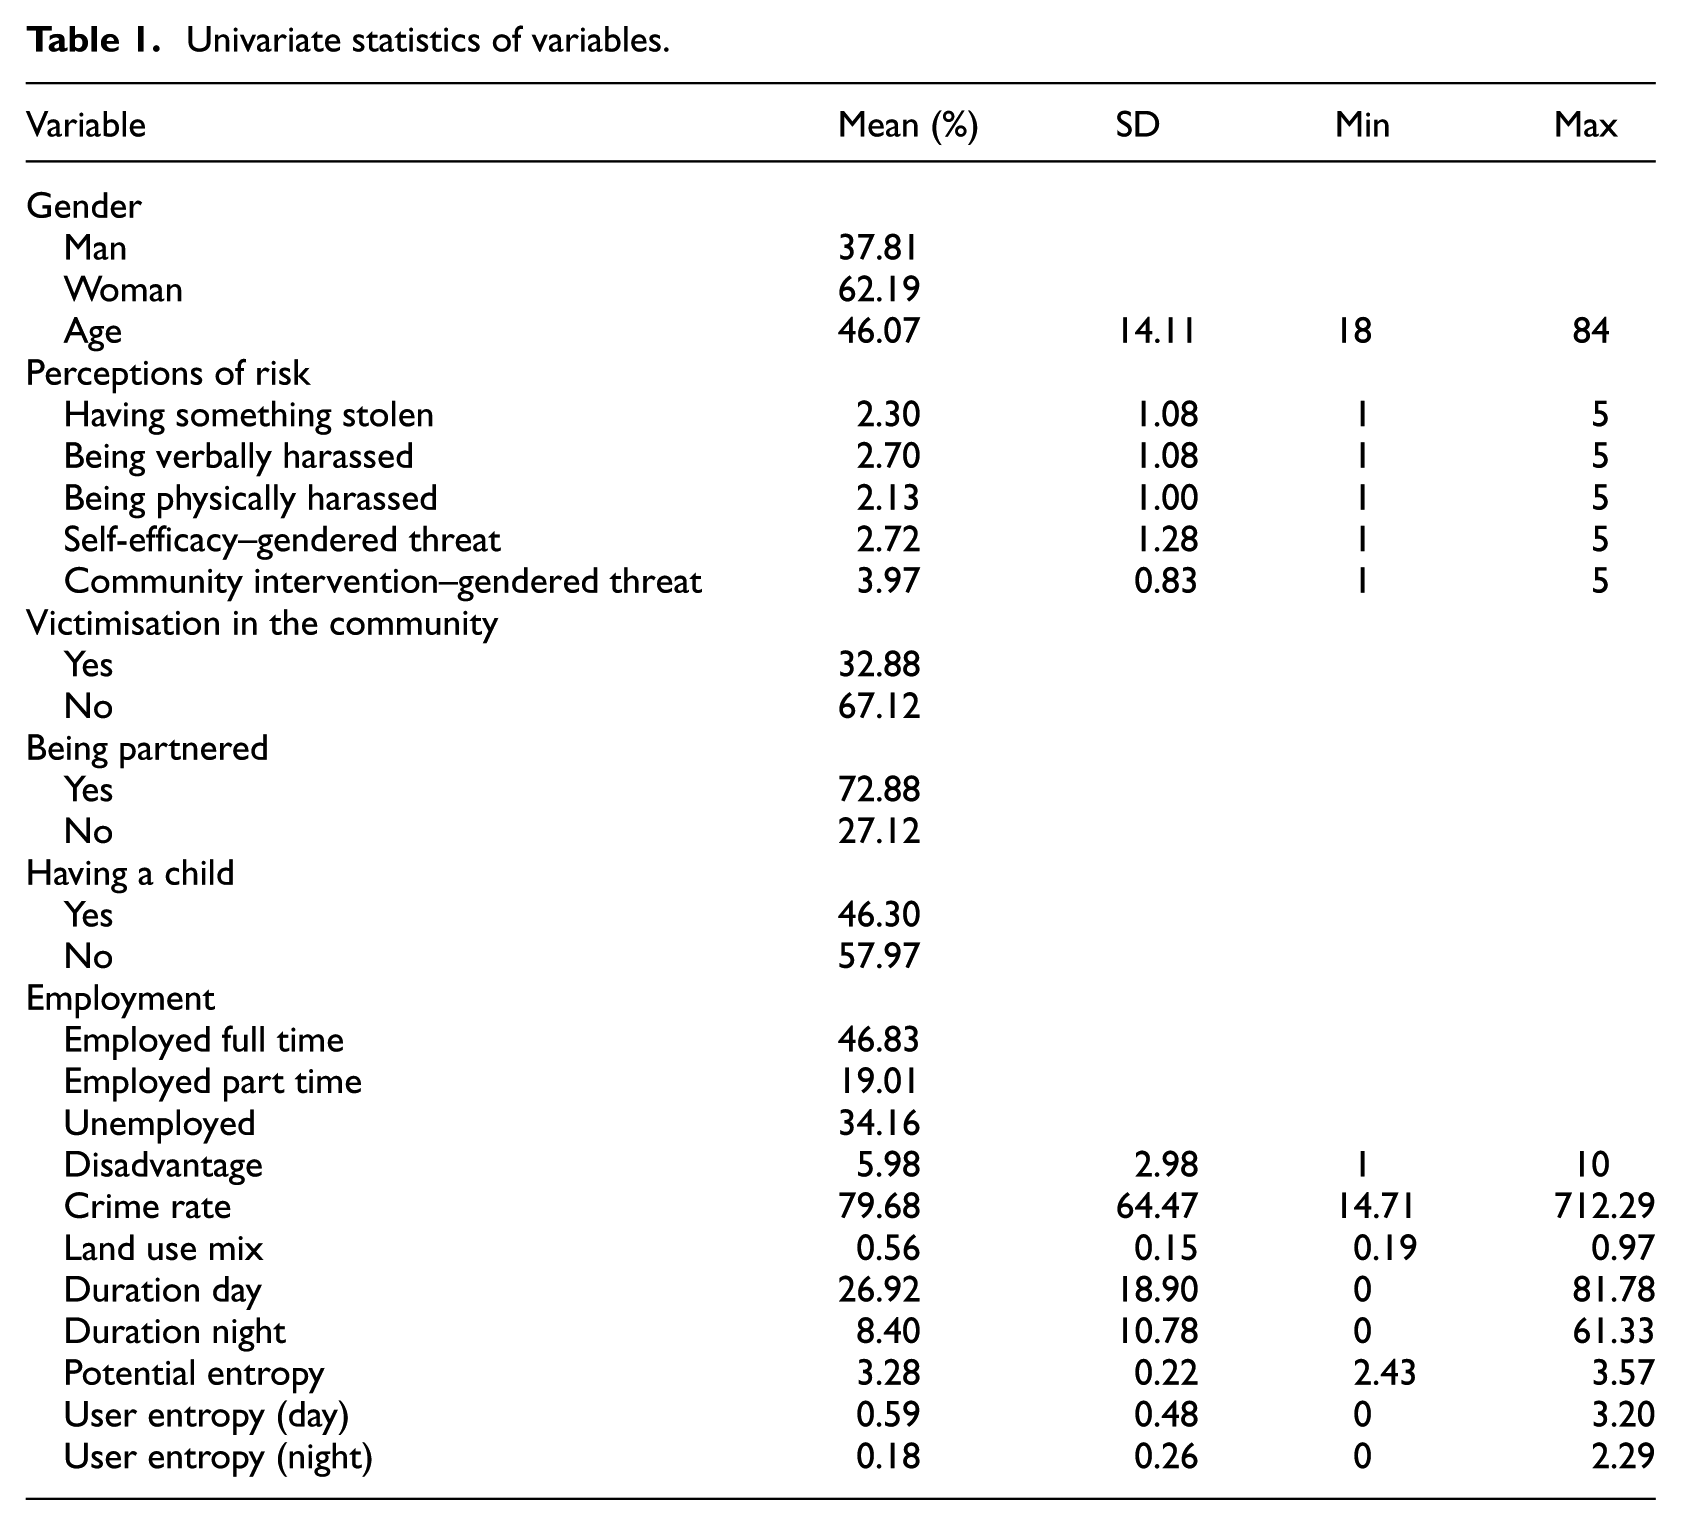
The variables we employ in this study are outlined below. See Table 1 for summary statistics.
Univariate statistics of variables.
Measuring activity spaces
This study measures three key elements of activity spaces: duration of time spent within their own neighbourhood but outside their home, potential neighbourhood entropy (determined by neighbourhood street network configurations) and actual entropy (based on the participants’ observed movement patterns). All measurements derive from GPS points classified as ‘movement’, which captures the participants’ outdoor activities within their residential neighbourhoods while excluding time spent at home and indoors. The measurements span a complete 24-hour time cycle, divided into daytime and nighttime periods.
Duration measures the average time spent (in minutes) within one’s home neighbourhood (excluding their home), calculated separately for daytime and nighttime periods. These two distinct variables (daytime duration and nighttime duration) represent the mean amount of time the participants spent in active movement throughout their neighbourhoods, averaged across the entire seven-day tracking period.
Neighbourhood street networks and users’ actual movement: Potential and actual entropy
Building on our previous discussion of the mobility snowflake framework, we now detail how both potential and actual mobility patterns were measured.
Each participant’s movement data were captured through GPS trajectories comprising sequences of geographic coordinates (latitude, longitude, and timestamp) recorded over the seven-day observation period. These trajectories provide the foundation for measuring spatial mobility patterns within each participant’s home neighbourhood (Statistical Area 2).
To analyse mobility patterns, we processed the street network data from OpenStreetMap using the python package OSMnx (Boeing, 2017). Street bearings (that refer to the compass directions of individual road segments in a given neighbourhood) were divided into 36 equal-sized bins, with each bin representing 10°. To minimise edge effects at common values like 0° and 90°, and following Boeing (2019), we shifted bins by −5°. This ensured that similar values (like 359.9° and 0.1°) fell within the same bin. Once the bearings were binned, we employed Shannon entropy to measure the complexity and diversity of directional distributions (Shannon, 1948).
In the current study, we compute two key metrics: (1) potential neighbourhood entropy and (2) user entropy (actual movement). Potential neighbourhood entropy (representing the theoretical street network configuration available to residents) was calculated using the following equation for computing Shannon entropy:

where
User entropy (which measures how the participants actually moved through their neighbourhoods during the daytime and nighttime) was calculated using the following equations:


where
Individual demographics, perceptions, and experiences
Gender was captured in the survey by asking participants: ‘with which gender do you identify?’ Response categories included ‘man’, ‘woman’, ‘other,’ and ‘transgender’. Only two participants identified as non-binary or transgender and thus these categories could not be used in the models. The analyses therefore use data only from participants who identified as women or men.
Age is a continuous variable capturing the age of the participant at the time of the study. 2
Household structure has been found to place constraints on women’s time and influence their mobility patterns (Kwan, 1999a, 1999b; Schwanen et al., 2008), dependent on childcare arrangements and working arrangements. These two variables are used in the models to capture the factors arising from household responsibility structure that can shape mobility in the neighbourhood. They are captured as follows:
Dependent children are measured as a binary variable, according to whether or not the respondent has dependent children.
Employment status is captured via three categories: employed full time, employed part time and not currently employed in the labour market (student/unemployed/retired/on a pension/home duties).
Victimisation is associated with social withdrawal or avoidance behaviour (Pain, 2001). Victimisation that occurred in the community is a binary variable that captures whether a respondent has ever experienced violence, sexual harassment, property damage, or burglary within their community.
One’s self-efficacy to respond to gendered threat in the form of neighbourhood street harassment may influence duration of time spent in the neighbourhood and actual movement. Given that women are more likely to experience harassment in public, we included a measure of self-efficacy to capture an individual’s own perceived control in response to a man harassing a woman. Respondents were asked: ‘how likely is it that you would do something’ about each this scenario using a 5-point Likert scale from ‘very likely’ to ‘very unlikely’.
The willingness of others to intervene when women are experiencing harassment might also influence actual movement and duration of movement. Here we assess how likely community intervention is in response to a gendered threat. Respondents were asked: ‘how likely is it that people in your community would act in response to a man harassing a woman?’ This was measured using a 5-point Likert scale from ‘very likely’ to ‘very unlikely’.
Perceptions of risk have been employed in victimisation surveys to represent the cognitive judgement of victimisation likelihood (Jackson, 2009). Perception of risk 3 is a latent variable that captures a baseline perception of safety in relation to the following three observed variables: being pickpocketed or having something stolen in a non-violent manner; being verbally harassed; or being physically harassed. Respondents were asked on a scale from 1 (very unlikely) to 5 (very likely): ‘how likely or unlikely do you think it is that you will experience the following crimes in the next twelve months?’ All items load heavily on one factor with loadings from 0.64 to 0.84. Given the scale reliability was α = 0.82, a mean scale with these items is included as a general measure of risk.
Socio-ecological features of the home neighbourhood
Consistent with established neighbourhood research methodologies in Australia, this study employs Statistical Area 2 (SA2) designations as administrative boundaries from the 2021 Australian Statistical Geography Standard (ASGS). In Greater Brisbane, the total number of neighbourhoods (SA2s) as of the 2021 ABS Census was 298, with a residential population ranging from 0 to 24,911 per neighbourhood.
Home neighbourhood disadvantage is measured using the Index of Relative Socio-Economic Disadvantage (ABS, 2021a). This index captures socio-economic characterises of an area to measure disadvantage. A higher score indicates less socio-economic disadvantage in the home neighbourhood.
Home neighbourhood crime is included in the analysis to capture the total amount of officially recorded crime. A 2022 neighbourhood crime rate per 1000 of the population was calculated at the SA2 level using the count of overall crime from Queensland Police Service and the population of the SA2 from the 2021 Census. This includes all crime types, including crimes against the person, crimes against property, and other offences.
Land use mix captures the diversity of land use categories (residential, commercial, industrial, parkland, education, hospital/medical, transport, primary production (i.e. agriculture), water, and other) within a mesh block. 4 The measure ranges from 0 to 1, with a larger value indicating a more diverse land use mix within the spatial unit (Christian et al., 2011). We control for land use mix as previous research has found that this indirectly influences users’ actual movement through the neighbourhood (Corcoran et al., 2024).
Analytical strategy
This study explores the association between duration of time spent in the neighbourhood, user actual entropy and potential entropy, alongside a suite of gendered predictors that are well established in the literature. We ask whether household responsibilities, experiences of victimisation, perceptions of risk, and gendered threat are associated with women’s and men’s mobility patterns. This question is answered by testing the seven hypotheses outlined earlier and represented in Figure 1. Prior to the main models, the analysis visualises women’s and men’s actual entropy across three neighbourhood types. Next, using a two-group structural equation model (SEM) in STATA version 17, we test how the relationships differ between women and men. 5 The first two-group SEM examines activity spaces during the day, while the second examines activity spaces at night. 6
Results
Prior to testing the hypothesised gendered predictors of spatial mobilities, the analysis visualises women’s and men’s actual entropy across three neighbourhood types, as presented in Figure 2.
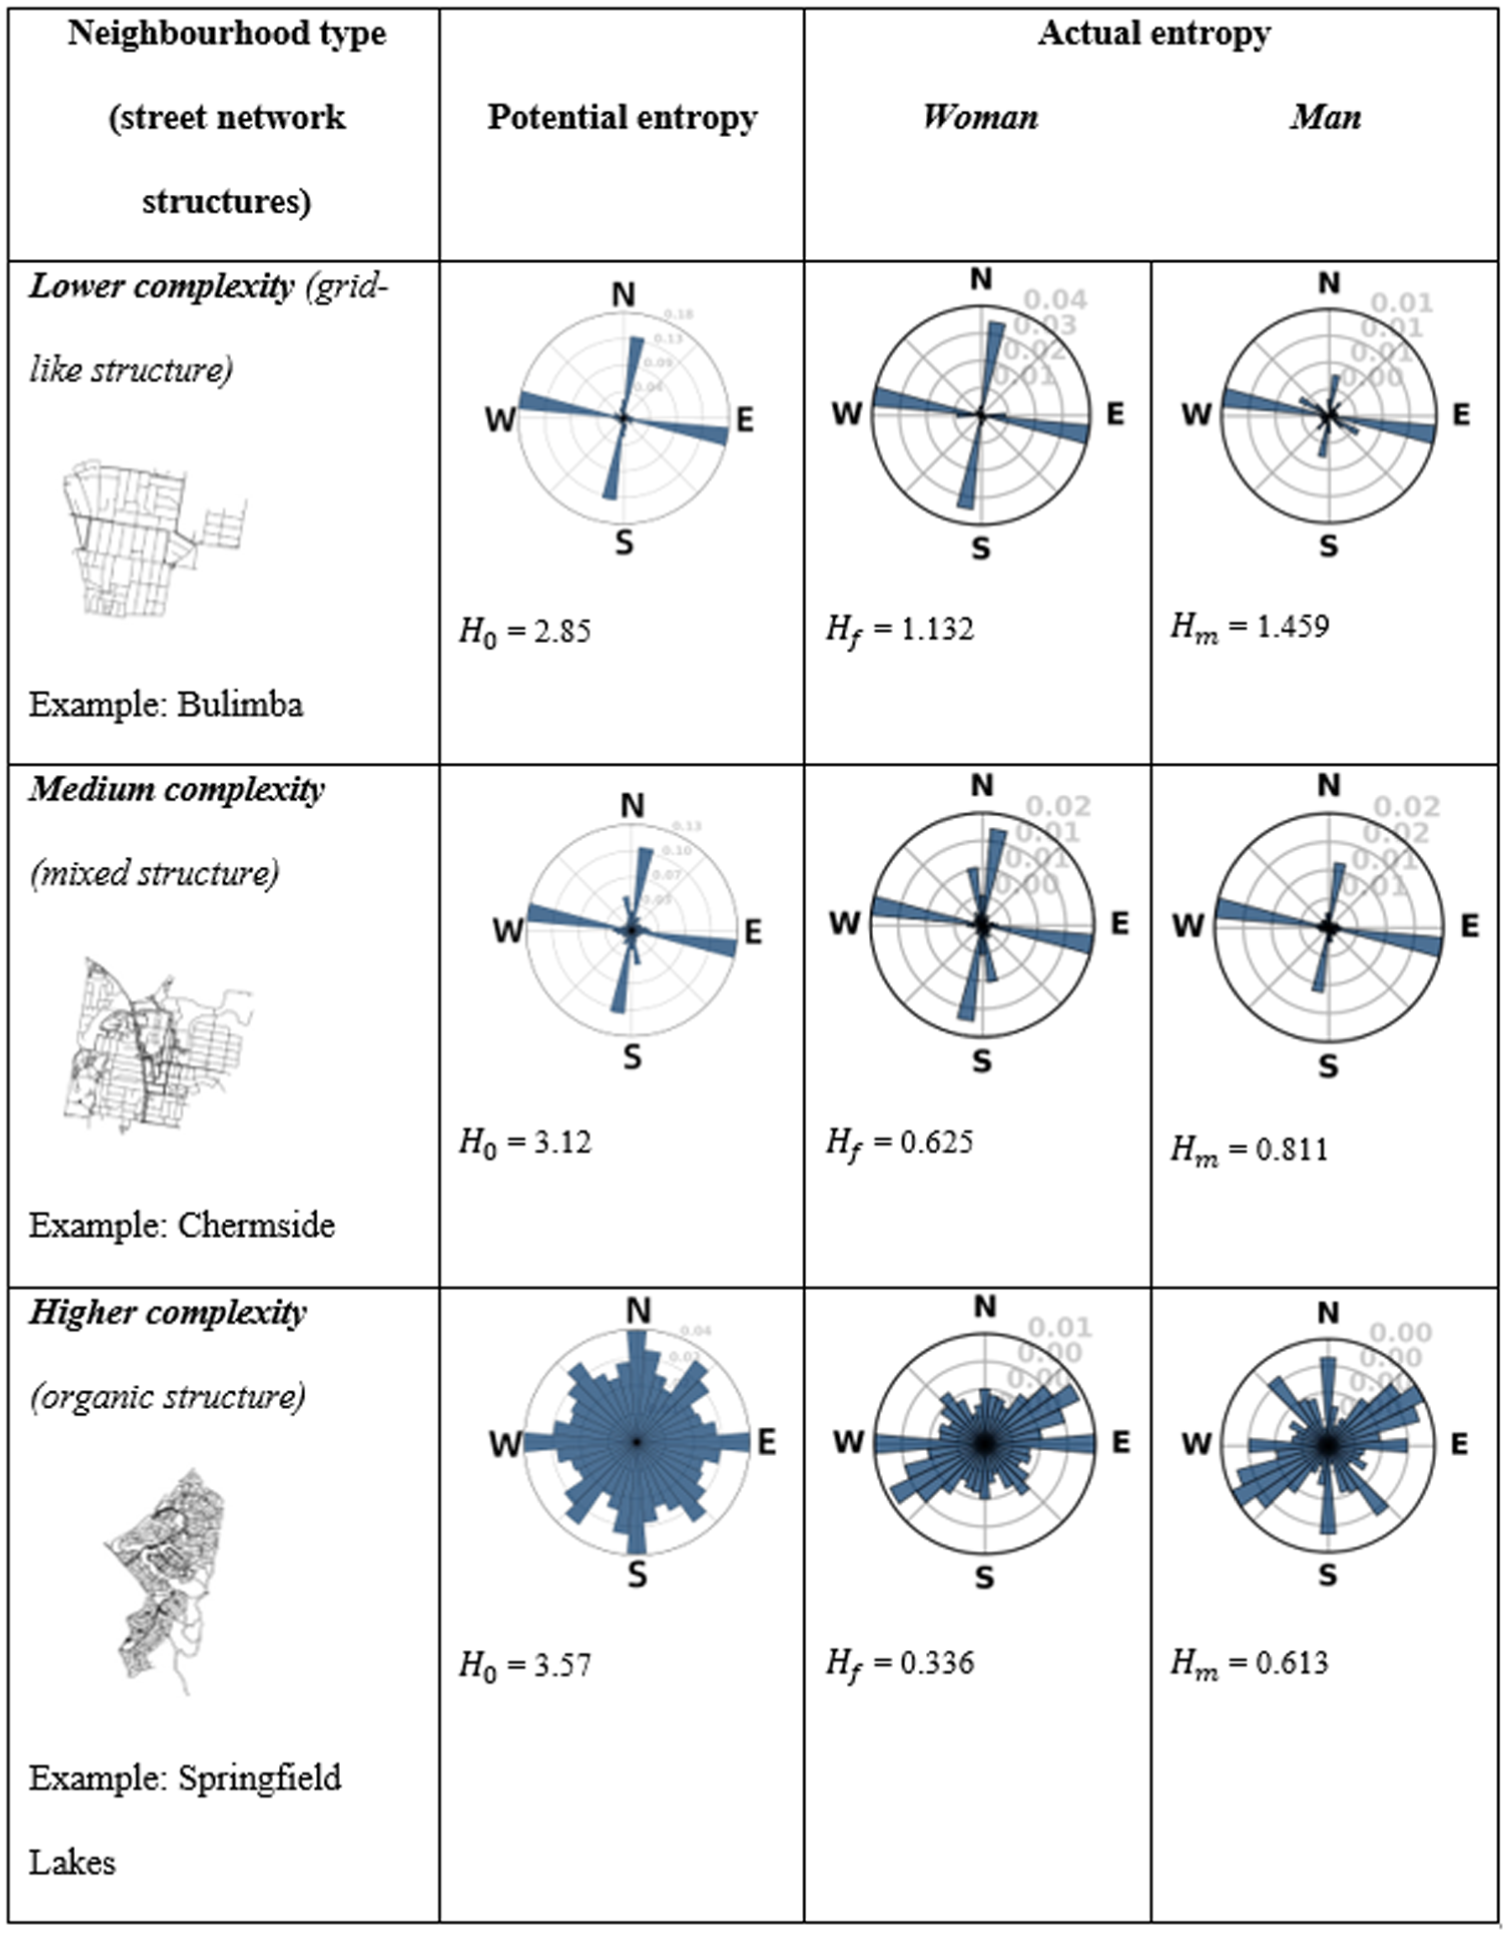
Street networks and entropy for six participants (three women and three men) living in three different neighbourhoods with varying street complexity.
Figure 2 illustrates the two concepts of potential and actual entropy using the mobility snowflake visualisation for three different types of neighbourhoods: one characterised by a simple grid-like street network (low potential entropy), one with moderate levels of complexity (medium potential entropy), and one defined by a complex street network configuration (high potential entropy). The figure highlights different patterns in women’s and men’s mobility across the three neighbourhood types. The full set of women’s and men’s mobility entropy values for each neighbourhood are provided in the Online Supplemental Appendix.
The analysis then shifts to test different predictors of women’s and men’s neighbourhood spatial mobility.
Our first model examines our hypothesised relationships during the day. The model that examines predictors of women’s and men’s time spent in the neighbourhood and users’ actual entropy during the day revealed a good fit based on fit indices and their accepted thresholds. The Root Mean Square Error of Approximation (RMSEA) was a good fit (less than 0.05), and the comparative fit index (CFI) and Tucker–Lewis index (TLI) were at acceptable levels (between 0.90 and 0.95). The results of these models are presented in Table 2.
Two-group structural equation model–spatial mobility during the day.
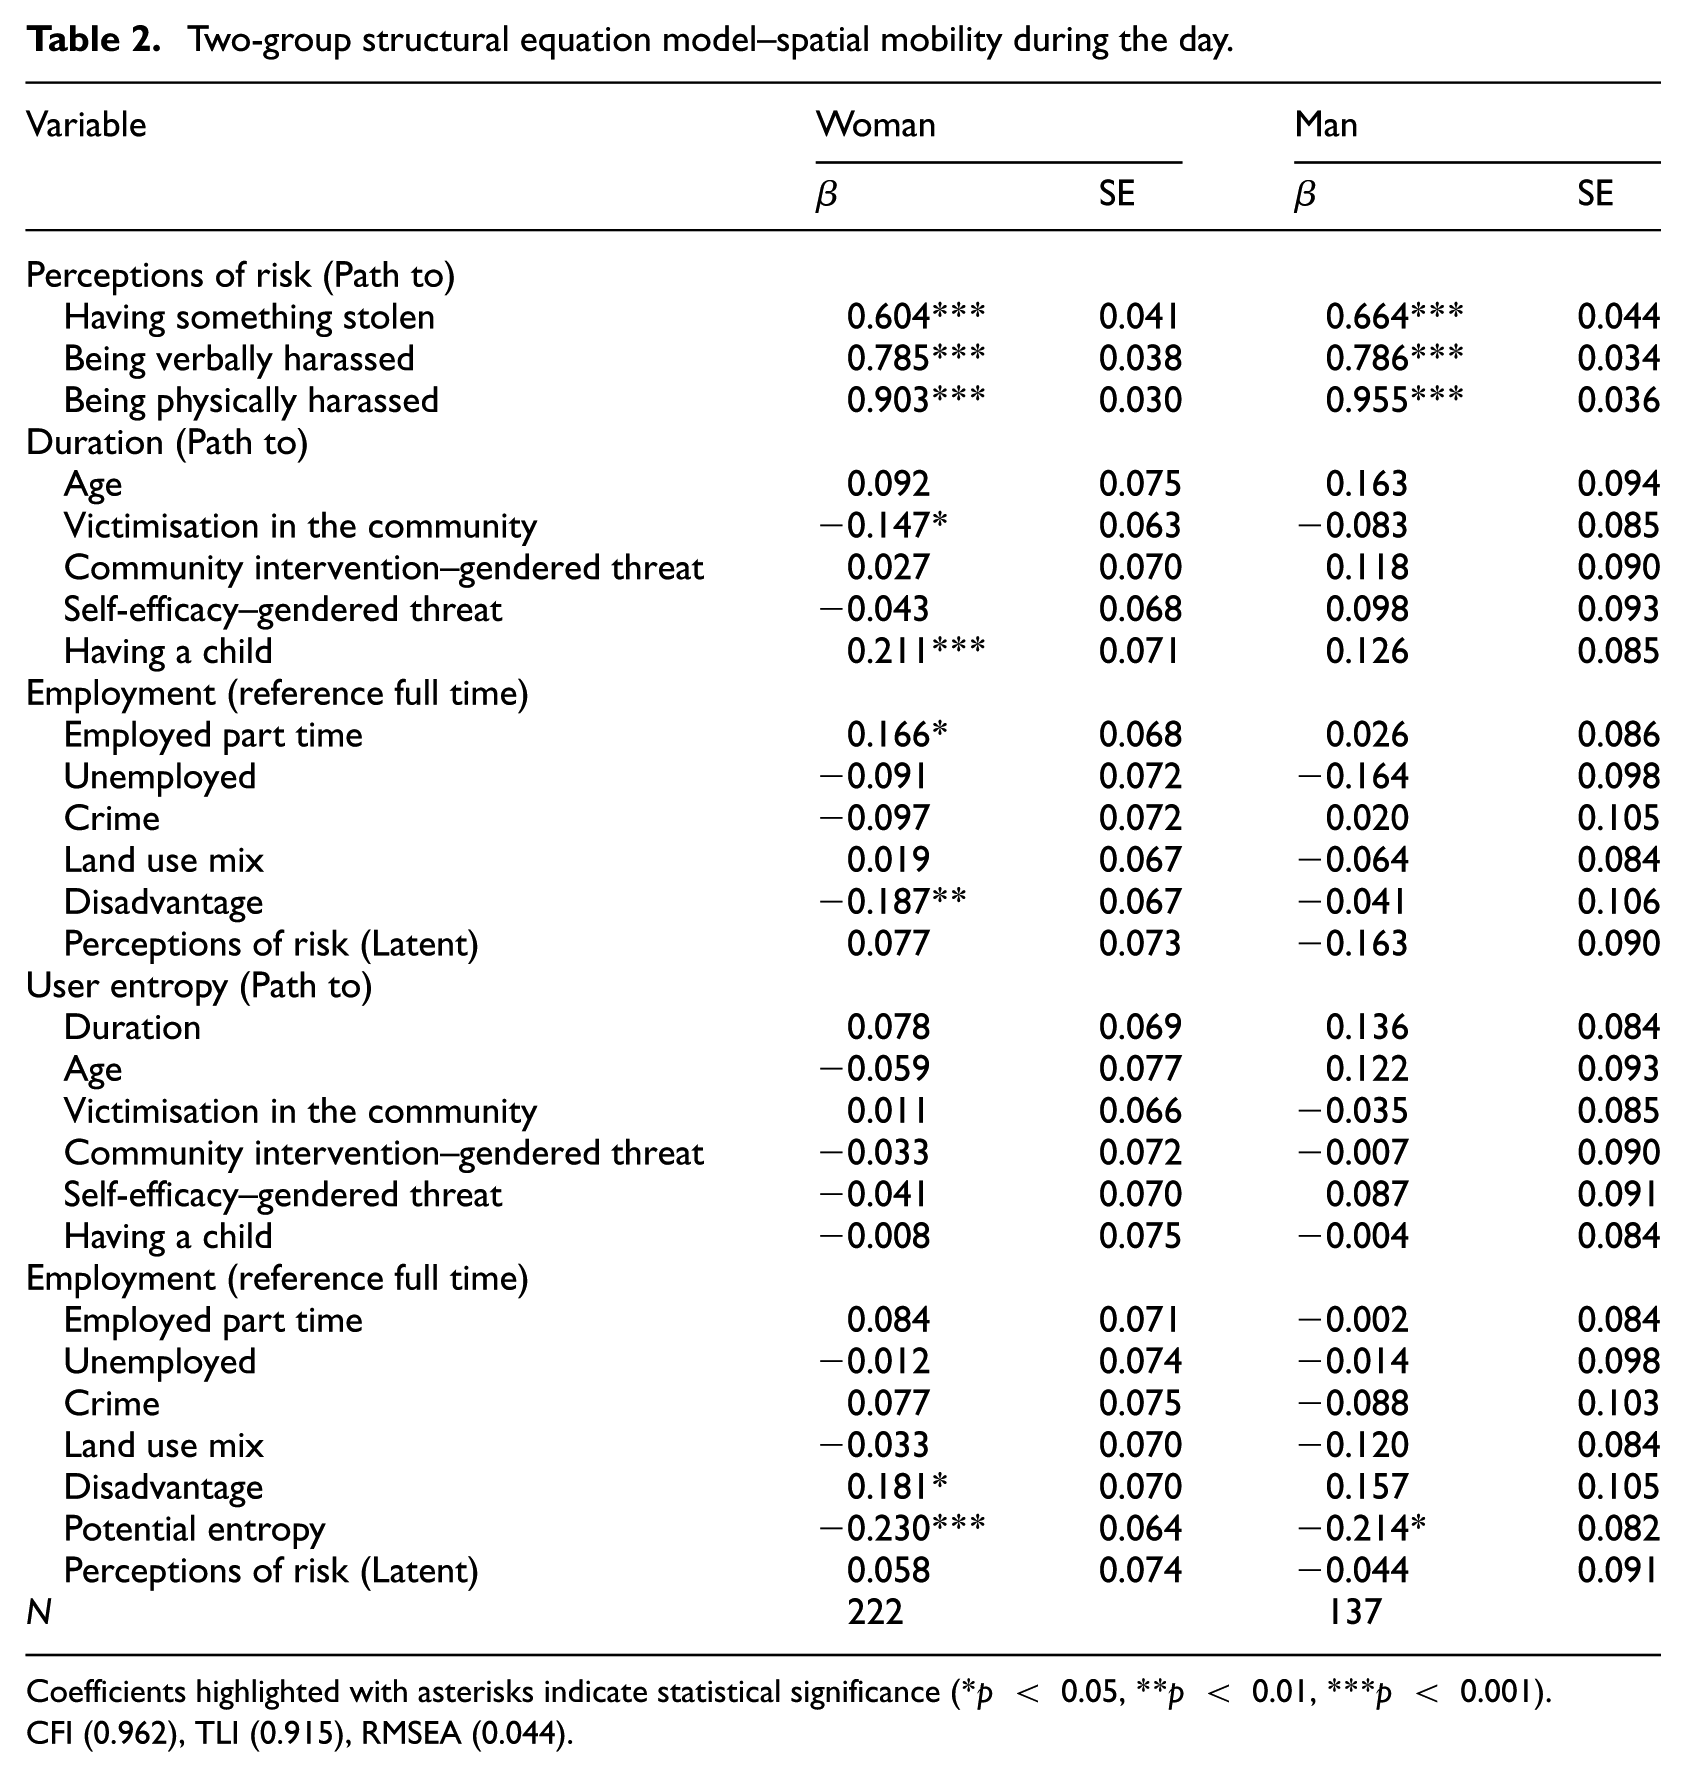
Coefficients highlighted with asterisks indicate statistical significance (*p < 0.05, **p < 0.01, ***p < 0.001).CFI (0.962), TLI (0.915), RMSEA (0.044).
In the women’s daytime model, prior victimisation experience significantly reduced the amount of time women spent in the neighbourhood during the day compared to women who had not experienced victimisation (β = −0.147, p < 0.05), which supports Hypothesis 4. Additionally, in support of Hypotheses 1 and 2, women who worked part time (β = 0.166, p < 0.05) and had children (β = 0.211, p < 0.001) were more likely to spend more time in their neighbourhood during the day, compared to women who worked full time and women who did not have children. A lack of socio-economic disadvantage was associated with less time spent in the neighbourhood (β=−0.187, p < 0.001). Neighbourhood crime levels did not impact the time spent in the neighbourhood during the day for women or men. Interestingly, women’s actual entropy was not influenced by the amount of time spent in their neighbourhood. Women’s higher actual entropy (representing women with more complex movements) during the day was associated with living in neighbourhoods with lower potential entropy (simpler neighbourhood street networks; β = 0.181, p < 0.05) and a lack of neighbourhood socio-economic disadvantage (β = −0.230, p < 0.001).
When examining the model of men’s duration of time spent in the neighbourhood and users’ actual entropy, none of the hypotheses were supported. For this model, the only predictor of more complex movement (higher entropy; β=−0.214, p < 0.05) is the time men spent in the neighbourhood, as we would expect based on the previous research (Corcoran et al., 2024).
The next model focuses on duration and users’ actual entropy at nighttime for men and women (see Table 3). The RMSEA (less than 0.05), CFI and TLI (greater than 0.95) were at good levels, indicating the nighttime model exhibits good fit statistics.
Two-group structural equation model–spatial mobility during the night.
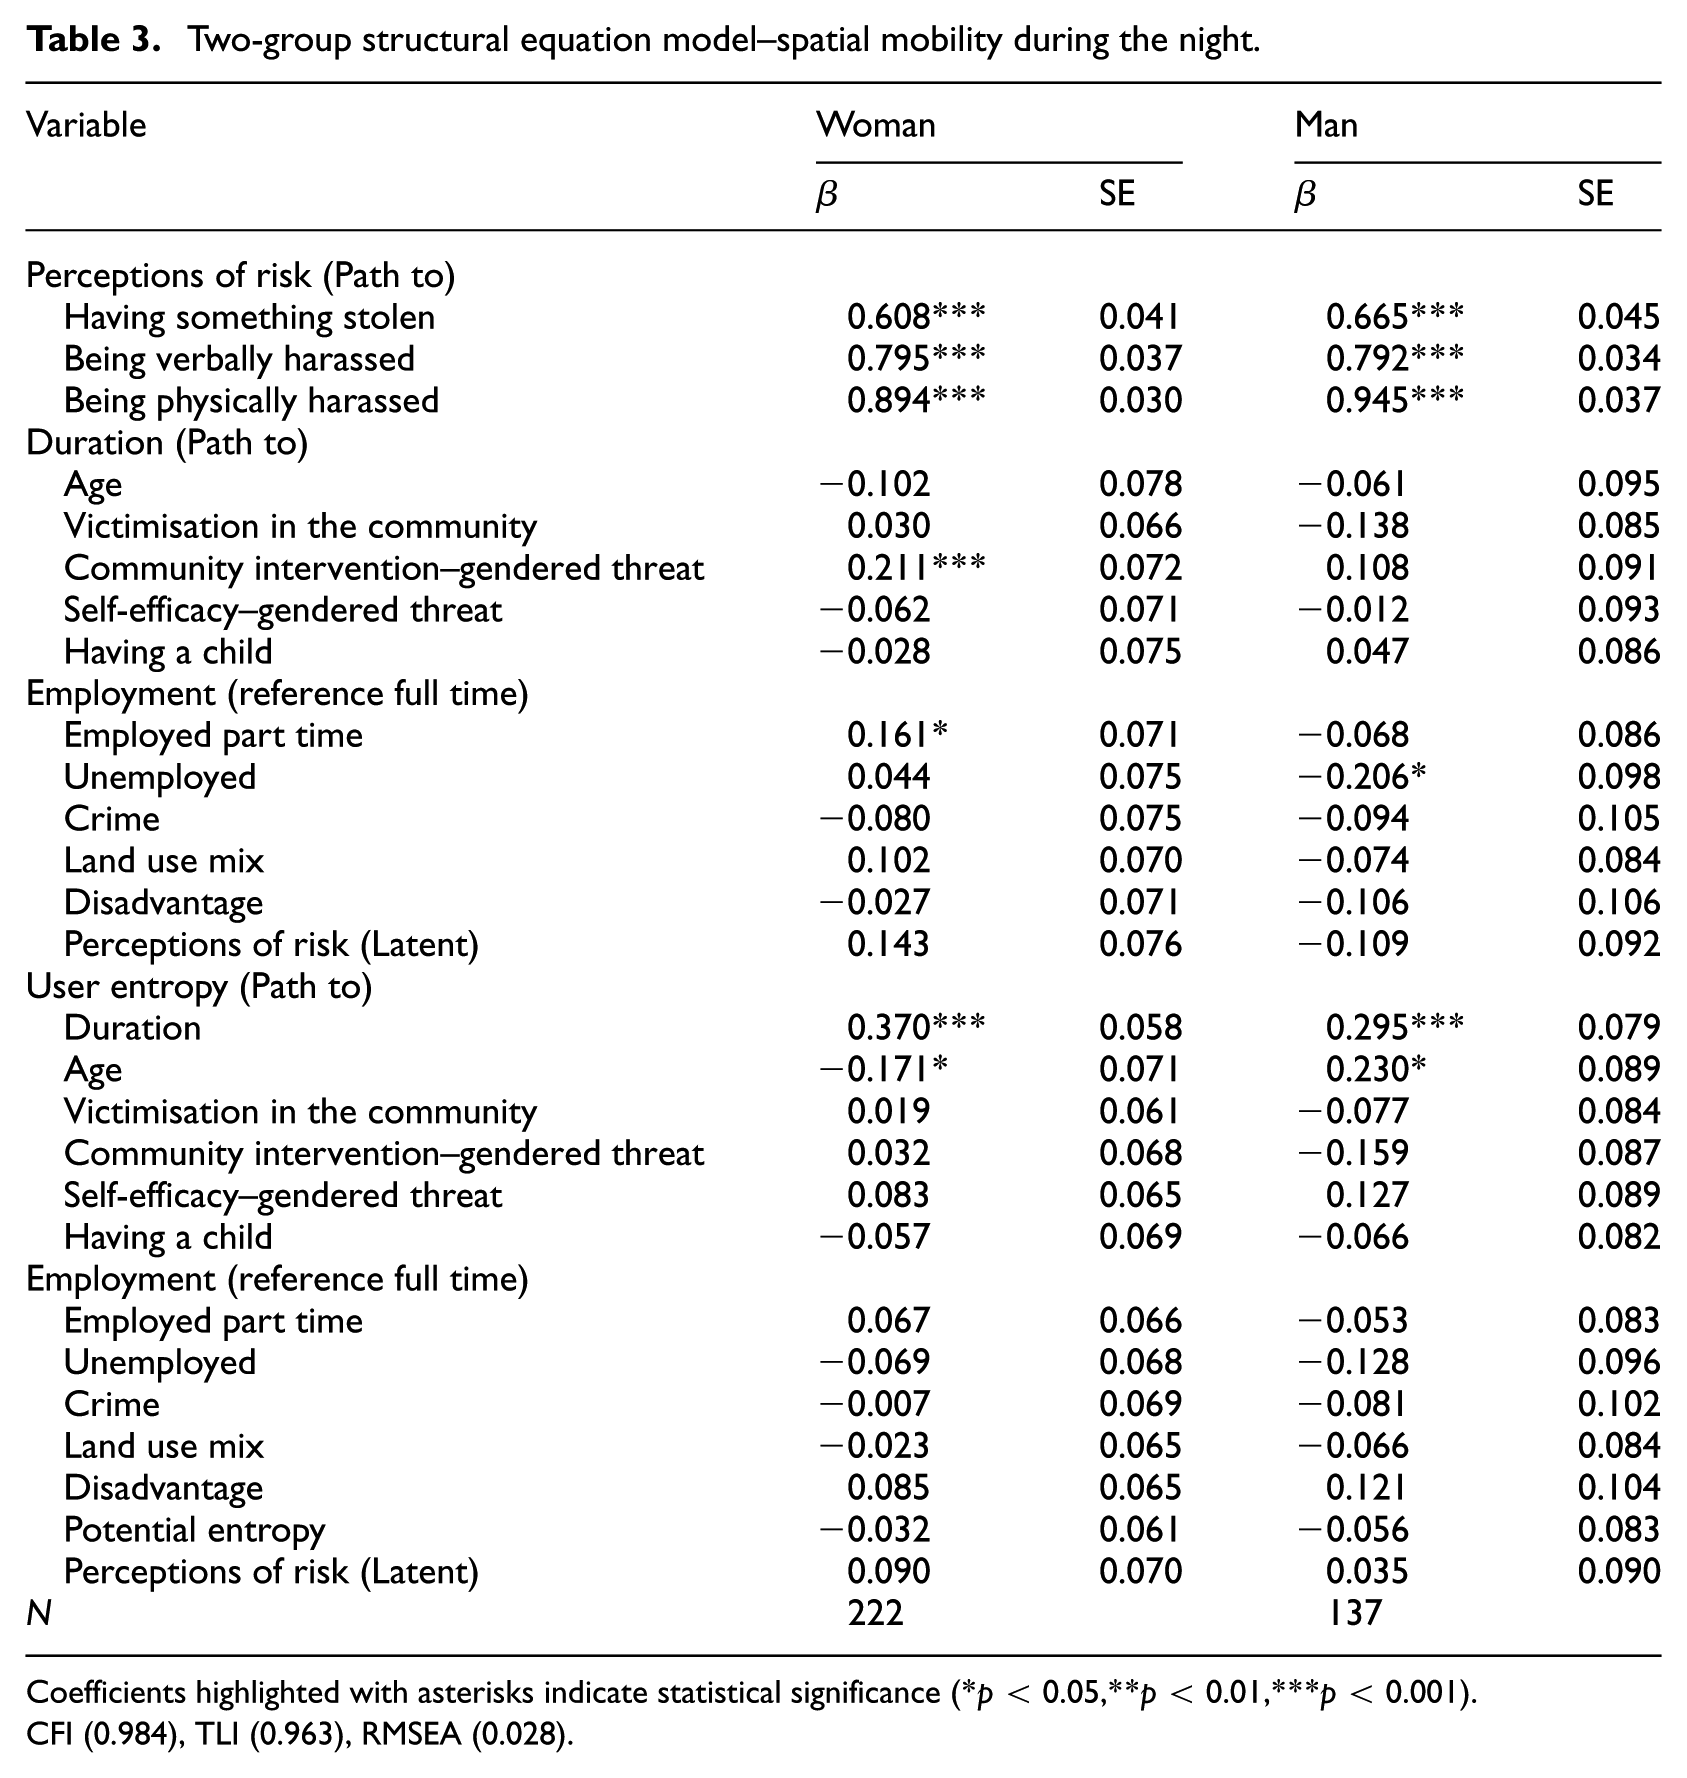
Coefficients highlighted with asterisks indicate statistical significance (*p < 0.05,**p < 0.01,***p < 0.001).CFI (0.984), TLI (0.963), RMSEA (0.028).
In the nighttime model for women, the perception that others in the community would intervene if a man was harassing a woman in the neighbourhood significantly increased the time spent in the neighbourhood at night (β = 0.211, p < 0.001). When women believed that people in their neighbourhood would act to prevent the harassment of women, they spent more time in the places where they live. This provides partial support for Hypothesis 5. Women who worked part time also spent more time in their neighbourhood at night compared to those who worked full time (β = 0.161, p < 0.05; Hypothesis 1). There was a negative relationship between age and entropy (β = −0.171, p < 0.05), indicating that younger women demonstrated more complex spatial patterns of movement at night. There was a reciprocal relationship between women’s nighttime user actual entropy and the duration of time they spent in the neighbourhood at night (β=0.370, p < 0.001). In other words, when women spent more time in their neighbourhood at night, they were more likely to move through a larger portion of the available street networks in their neighbourhoods.
Like the daytime men’s model, none of the hypothesised factors (household duties, experiences of crime and perceptions of crime) were significantly associated with either duration or user actual entropy for men at nighttime. As shown in Table 2, there was a negative relationship between unemployment and time spent in the neighbourhood, as men who were unemployed spent less time in their neighbourhood compared to those working full time (β=−0.206, p<0.05). Older men demonstrated more complex movement in their neighbourhood at night than younger men (β=0.230, p<0.05). Spending more time in the neighbourhood at night was strongly associated with men’s actual entropy at night (β=0.230, p<0.05).
Gender differences in covariate effects were formally tested using Wald tests to determine whether effects differed significantly between men and women. In the daytime model, only one significant gender difference emerged: risk perception’s effect on daily duration (χ2 = 4.11, p = 0.043), with opposing directional effects between genders. The nighttime model revealed substantially more gender moderation, with three significant differences: risk perception on nighttime duration (χ2 = 4.30, p = 0.038), employment status on nighttime duration (χ2 = 4.25, p=0.039), and age on nighttime entropy (χ2=11.14, p < 0.001). The age-entropy interaction was particularly strong, showing opposite effects where older age increased spatial diversity for one gender while decreasing it for the other. These results indicate that gender moderates mobility patterns approximately three times more frequently during nighttime hours compared to daytime.
Discussion
This study sought to understand the spatiotemporal dynamics shaping the activity spaces of women and men in urban neighbourhoods. The study draws on the mobility snowflake measurement framework that offers a novel approach to conceptualising and visualising how street network design influences everyday spatial mobility patterns (Corcoran et al., 2024). This framework advances our understanding of space through granular analysis that captures mobility dynamics not readily accessible through existing approaches, while embedding an examination of the gendered dynamics of safety considerations and neighbourhood effects. It brought together empirical measures of activity spaces–potential entropy and actual user entropy–to examine the factors that might influence mobility such as experiences of victimisation, perceptions of risk, gendered threat, and household structure. Additionally, we included neighbourhood-level controls, such as neighbourhood disadvantage and crime rates, that might influence time spent at home or outside the neighbourhood. Our analyses provided partial support for five of the seven hypotheses represented in Figure 2. These findings are discussed below.
Scholars have long argued that women’s heightened perceptions of the risk of victimisation can lead to withdrawal from their communities; however, our results did not support Hypothesis 3, that for women, perceived risk reduces actual entropy and duration of time spent in the neighbourhood (Massey, 1994; Valentine, 1990). Although risk perception did not reach statistical significance as a predictor of daily duration in either gender group individually, formal Wald tests revealed that these effects differed significantly between genders, suggesting that risk perception operates in opposing directions for men and women, with one group showing a negative association and the other a positive association with daily duration. The SEM models did reveal that previous experiences of victimisation reduced women’s time spent locally (supporting Hypothesis 4), while perceived willingness of residents to intervene when witnessing harassment of women increased women’s neighbourhood presence at night (supporting Hypothesis 5). Surprisingly, there was no support for Hypothesis 6, that women who feel able to act in response to street harassment spend more time in the neighbourhood. This supports the claim that incidents of harassment for women in their neighbourhood may be perceived as a message from their community that they do not belong in public places, pointing to the importance of community action in response to street harassment of women (Keel and Lee, 2025; Kern, 2021). While harassment of women in public places is a recurring theme in qualitative research on place, very few quantitative studies have explored this phenomenon (Keel et al., 2024a). Our research, therefore, represents a valuable contribution in providing insights using a different suite of tools to gendered spatial mobilities and safety. Consistent with the previous literature that identified that women who work part time and are responsible for childcare face constraints on their time (Kwan, 1999a), our models revealed that these factors lead women to spend more time in the neighbourhood, supporting Hypotheses 1 and 2.
It was anticipated that the spatiotemporal dimensions of men’s activity spaces would be influenced by household structural factors, as they are for women; however our data did not reveal these patterns (Borgato et al., 2021; Susilo et al., 2019; Viry and Kaufmann, 2015). Since emerging evidence on the impact of household structural factors on men’s mobility has predominately come from Europe (Borgato et al., 2021; Susilo et al., 2019; Viry and Kaufmann, 2015), this finding may indicate different patterns in Australia. It was also expected that perceived risk and experiences of victimisation would be lower for men, but would remain important in shaping their time spent in the neighbourhood and actual entropy; however, this expectation was not supported. Keel et al. (2025) suggest that neighbourhood conditions play a weaker role in shaping men’s perceptions of crime compared to women, who demonstrate greater context-sensitivity to environmental cues of safety and threat (Keel et al., 2025). Additionally, research has suggested that men are less attuned to environmental cues of safety and threat (Snedker, 2015), and therefore men’s spatial behaviour may be less responsive to experiences of victimisation and perceptions of risk.
Our results showed that simpler neighbourhood street networks lead to greater movement within the neighbourhood, echoing the findings of Corcoran et al. (2024). The results also revealed a stronger association between potential neighbourhood street networks and users’ actual movement for women than for men. A possible explanation for this finding is that increased street network complexity may require more regular scanning of the physical environment for potential unwelcoming and welcoming pathways. Although the data used in this study did not capture whether streets were welcoming or unwelcoming for women, the broader literature shows that the built environment can produce physical isolation, which some people may wish to avoid, and this may be particularly important for women (Jacobs, 1961; Kalms, 2024). In this regard, a simpler street network configuration provides clearer pathways for individuals to move through, which aligns with research on gender-sensitive design (Kalms, 2024). Initiatives to enhance spatial mobility in urban neighbourhoods should therefore focus on enhancing gender-sensitive design in neighbourhoods with complex street networks, where the built environment might otherwise reduce mobility among women.
It would be valuable for future research to capture who is present in urban places by integrating additional information on the hourly ambient population. However, it is important to note that, due to privacy reasons, mobile phone data cannot be accessed at the granular level required to obtain such information. Mobile phone data are typically limited to neighbourhood-level aggregate counts, which does not allow for a distinction to be drawn between temporary ambient populations in public spaces (such as streets) and people in private realms. Furthermore, privacy restrictions on mobile phone data currently prevent identification of the demographic characteristics of temporary populations (such as gender and age), which are known to be important factors shaping perceptions of victimisation risk (Farrall et al., 2009; Snedker, 2012, 2015). That said, a valuable direction for future research would be to include a baseline measure of the relationship between street network configuration and an individual’s actual entropy in the neighbourhood across a temporary population.
This study contributes to a growing body of evidence on the relationship between the built urban environment and the gendered use of space. While it advances the scholarship on gendered spatial mobilities, our study does have some limitations. The duration variable was averaged across the seven-day period, which may have influenced the findings. Perceptions of risk varied across the week, and there may be differences between weekdays and weekends that were not captured. A study period beyond seven days would enable a more granular analysis of such variations. Furthermore, this study did not capture a sufficiently large sample to model gender diversity. In this regard, there are challenges with capturing diverse gender identities using surveys, as discussed in Cameron and Stinson (2019).
Conclusion
Spatial mobilities are shaped by individual routines, the socio-ecological characteristics of place and the design of the built environment, in addition to gendered dynamics. The results of this study demonstrate the importance of temporal context (day and night) and the gendered dynamics that shape activity spaces within the neighbourhood. This study provides further evidence that the gender-sensitive design of urban neighbourhoods must consider this interplay of physical and social dynamics in seeking to create welcoming spaces for both women and men.
Supplemental Material
sj-docx-1-usj-10.1177_00420980251381149 – Supplemental material for Gendered spatial mobilities in urban neighbourhoods: Women’s and men’s victimisation, perceptions of risk, and gendered threat in their neighbourhood activity space
Supplemental material, sj-docx-1-usj-10.1177_00420980251381149 for Gendered spatial mobilities in urban neighbourhoods: Women’s and men’s victimisation, perceptions of risk, and gendered threat in their neighbourhood activity space by Chloe Keel, Rebecca Wickes, Danielle Reynald, Christopher Browning, Ying Lu and Jonathan Corcoran in Urban Studies
Footnotes
Acknowledgements
We would like to thank Professor Dietrich Oberwittler for his feedback on this manuscript.
Ethical considerations
This research received ethical approval from Griffith University Human Research Ethics Committee (2022/042).
Author contributions
Chloe Keel: Writing – original draft. Writing – review & editing. Conceptualisation. Rebecca Wickes: Writing – review & editing, Writing – original draft. Danielle Reynald: Writing – review & editing. Christopher Browning: Writing – review & editing. Ying Lu: Writing – review & editing. Jonathan Corcoran: Writing – review & editing.
Funding
The authors disclosed receipt of the following financial support for the research, authorship, and/or publication of this article: This research was funded by the Australian Research Council’s Discovery Programme (DP200100830).
Declaration of conflicting interests
The authors declared no potential conflicts of interest with respect to the research, authorship, and/or publication of this article.
Supplemental material
Supplemental material for this article is available online.
Notes
References
Supplementary Material
Please find the following supplemental material available below.
For Open Access articles published under a Creative Commons License, all supplemental material carries the same license as the article it is associated with.
For non-Open Access articles published, all supplemental material carries a non-exclusive license, and permission requests for re-use of supplemental material or any part of supplemental material shall be sent directly to the copyright owner as specified in the copyright notice associated with the article.