
Abstract
This article explores the role of land cover in relation to housing type and tenure in shaping exposure to extreme urban heat, focusing on residents of mobile and manufactured housing (MH). We hypothesize that MH residents will experience greater exposure to extreme heat than those living in other housing types due to lower levels of proximate vegetation. This hypothesis is based on the unique property relations and tenure regimes that characterize MH, which may disincentivize investments in planting and maintaining trees and vegetation in arid environments. To test this hypothesis, we compare the amount of vegetation on properties across housing types, within-type tenure arrangements and between three urbanized areas in Arizona with different levels of exposure to extreme heat. To conduct this comparison, we combine multispectral land cover data for 1.7 million parcels with tax assessor data and building footprints to measure land cover at a high resolution. We find that MH units have significantly less vegetation than single-family residential properties, and that MH units in MH parks have less vegetation than those on individual lots. We conclude that municipalities should promote (e.g. through incentives or other policy interventions) the planting of more vegetation around MH units where there is a risk of extreme heat exposure. Future research can expand this analysis with a closer examination of how municipal ordinances and policies affect land cover by housing type and tenure.
Introduction
The Intergovernmental Panel on Climate Change (IPCC) Sixth Assessment Report (AR6) indicates that global surface temperatures reached ∼1.1°C above pre-industrial levels between 2011 and 2020. This warming is driven by increased atmospheric greenhouse gases such as CO2 and CH4 to concentrations 47% and 156% above pre-industrial levels. Rising temperatures are already having significant impacts on human health and mortality. Model-based estimates (Andrews et al., 2018) predict that approximately 1 billion people will experience heat stress if global temperatures rise by ∼2.5°C above pre-industrial levels. The health impacts of heat exposure can range from discomfort to fainting, exhaustion, heat stroke, and even death. Heat impacts are unevenly experienced across space and populations, with some places and people far more vulnerable to the negative effects of rising temperatures (Oppermann et al., 2021).
Housing conditions play a key role in mediating the relationship between heat and health. Housing and neighborhood conditions influence quality of life and public health, and, following Gibson et al. (2011), operate through three key pathways: (1) internal housing conditions, (2) area conditions, and (3) housing tenure. Rising temperatures and extreme heat events affect each of these pathways in a variety of ways. For example, in the context of internal housing conditions, increased temperatures can contribute to what Kear et al. (2023b) (see also Hamstead, 2024) call home thermal (in)security (HTS)—the (in)ability to maintain a home thermal environment consistent with residents’ health, social and financial needs. These concerns are particularly pronounced for those living in structures with poor insulation, that lack effective cooling devices, are designed inefficiently, and/or are structurally inadequate in other ways (e.g. with holes in walls, etc.). Neighborhood conditions also impact the transmission of heat hazards (e.g. urban heat anomalies, heat waves or other extreme heat events) to housing, especially in areas that lack shade, green spaces and vegetation, or are surrounded by pavement that radiates heat even through the night. Third, the effects of extreme heat differ by housing tenure. Renters, and other residents who do not own their property, may be limited (e.g. by lease conditions, or access to financing) in their capacity to make adaptive investments to improve thermal conditions (e.g. additional insulation, window coverings, installation of efficient cooling devices, etc.), and landlords may not have an incentive to devote resources to heat mitigation. Finally, these pathways often overlap and reinforce each other. For example, a lack of nearby vegetation increases radiative forcing on structures making it more difficult for residents to maintain comfortable indoor thermal environments (more costly in both energy and monetary terms), which they may or may not have the capacity or permission to effectively mitigate based on the property and tenure relations. Through these, and other potential pathways, heat and housing interact to shape quality of life and public health.
Mobile and manufactured housing (MH) 1 , in general, is more exposed to climate-linked hazards, including floods, wildfires, and hurricanes (Kusenbach et al., 2010; Pierce et al., 2022), than other housing types, and is also more likely to be structurally inadequate (Wedeen, 2022), making it more sensitive to hazard impacts. In the case of extreme heat, MH is particularly vulnerable, especially in hot climates like Arizona’s. Climate models predict increased temperatures and extreme heat events across western North America with increasing numbers of summer days over 35°C (95°F; Intergovernmental Panel on Climate Change [IPCC], 2021). Arizona is already living with extreme heat. During the summer of 2023, for example, daily highs in Tucson exceeded 37.8 °C (100°F) for a record 53 consecutive days and both Tucson and Phoenix set records for consecutive days above 43.3°C (110°F). Such projected, and extant temperature extremes are likely to be most intensely experienced in urban areas, home to 90% of the state’s population, where heat island effects are the most pronounced.
The effects of heat can be especially pernicious in MH communities. MH households tend to be low-income and older, financially limiting the scale and scope of heat-mitigating upgrades (Phillips et al., 2021) for those most susceptible to heat-related health impacts. MH, especially older, pre-1976 units, often lack adequate insulation, and are structurally deficient in other ways that make them harder to keep cool (e.g. having an electrical system capacity too low to support adequate air conditioning). Without sufficient ventilation, cooling devices, or shaded and vegetated outdoor spaces, MH residents are at greater risk for poor indoor air quality and health issues linked to extreme heat events and chronic heat exposure. Such considerations, combined with “gaps in research, markets, landlord–tenant law, policy, and specific government programs,” overlap (Kear et al., 2023b) to produce MH as a site of thermal insecurity where residents are systematically excluded from many tools US households typically use to mitigate and adapt to climate risk.
This article contributes to efforts to better understand the role of land cover in shaping the differential vulnerably of MH relative to other housing types. Here we address three central questions: (i) how does vegetative land cover vary by housing type; (ii) how does vegetated land cover differ across threeMH tenure arrangements (e.g. land-lease communities/parks versus individual lots); and (iii) how does MH land cover vary among urbanized areas?
To answer these questions, we develop a dataset of 1.7 million property parcels across three urbanized areas in Arizona. We assess land cover characteristics for each parcel to measure the amount of vegetation present and compare results across MH, single-family residential, condos/townhomes, and multi-family residential properties as well as within-type variation across MH tenure arrangements to identify differences in heat mitigating (vegetation) and aggravating (heat-trapping) land cover by both housing type and tenure arrangement.
With the methodology we describe below, we aim to test whether hypothesized differences in vegetation across housing types and MH tenure arrangements can be detected at the parcel level by combining county tax assessor data and remotely sensed land-cover data. The identification of expected vegetation differences by housing type and tenure provides clarifying insight into the disproportionate impact of heat-related health effects on MH residents. These disproportionate impacts are dramatic and of urgent concern in our study area.
Measuring land cover and vegetation
Urban heat anomalies or “islands” (UHI) refer to the phenomenon in which urbanized areas experience higher temperatures due to human activities and the built environment (Memon et al., 2008). Vegetation can play a role in regulating UHI through the cooling effect of evapotranspiration and shading (Peng et al., 2012). Impervious surfaces, such as roads and buildings, are positively associated with higher surface temperatures, while vegetated areas, particularly trees, are negatively associated with surface temperature (Jenerette et al., 2016). Moreover, Jenerette et al. (2016) show that neighborhoods with a higher percentage of impervious surfaces and a lower percentage of tree canopy have a higher risk of heat-related illness, particularly for older adults and low-income residents.
Remotely sensed land cover data that is multispectral is a key component of our research approach. Multispectral imagery contains information about wavelengths of light, that is, red, green, blue, and near infrared. Because healthy vegetation strongly reflects the near infrared wavelengths of light, multispectral imagery has proven to be effective in measuring land cover in urban areas, especially when differentiating between vegetation, and impervious surfaces. Land use classifications with multispectral imagery rely on researchers to “train” and prepare the models to identify how patterns of wavelengths in pixels correspond to objects in the real world. These pixel-based classifications can produce highly accurate (∼80% accuracy across studies) land cover classifications (Maxwell et al., 2017).
Li et al. (2014) applied this approach in the Phoenix metropolitan area using 2010 National Agriculture Imagery Program (NAIP) imagery. A classification scheme was used consisting of 10 classes. Similarly, Nagel and Yuan (2016) classified land use and impervious surfaces for seven counties in the Twin Cities metropolitan area of Minnesota. The authors used 2010 NAIP orthoimagery and six classification classes. Both studies suggest that using NAIP multispectral imagery is a reliable way to achieve accurate land cover classification in complex urban landscapes but other researchers have combined data sources to further improve land cover analysis. Qiu et al. (2014) demonstrated the successful application of object-based land cover classification combined with multiple data sources in their mapping of Nixa, Missouri. The authors combined multispectral imagery with vector data such as roads, sidewalks and parcel data to increase the accuracy of their land cover classifications to just over 90%.
Importantly, researchers using high-resolution multispectral imagery have found relationships between vegetated land cover and surface temperatures. This relationship is shown in a study of land cover and surface urban heat in Baltimore, Maryland (Zhou et al., 2014). Their data indicated that land cover, particularly vegetation cover, has a significant impact on the spatial and seasonal variability of surface UHI. The findings revealed that the relationship between land cover and UHI was scale dependent. The cooling effects of vegetation are most significant at extremely local levels. Intuitively, if a house is shaded by a tree the cooling effects will be greater than if there is not a tree shading the house. Accordingly, land cover data is classified into smaller and more detailed categories (such as distinguishing between different types of vegetation, impervious surfaces, etc.), and when the resolution of the data is higher, the relationship between land cover and surface heat becomes stronger.
Data and analytical approach
Our study focuses on three urbanized areas in Arizona: Phoenix-Mesa in Maricopa County, Tucson in Pima county, and Flagstaff in Coconino County (Figure 1). Within each urbanized area we gathered and analyzed publicly available data on property characteristics and land cover to answer the following research questions:
(i) How does vegetated land cover within parcels vary by housing type?
(ii) How does vegetated land cover differ across different MH tenure arrangements (e.g. land-lease communities/parks versus individual lots)?
(iii) How does land cover vary across housing types among the three study areas?
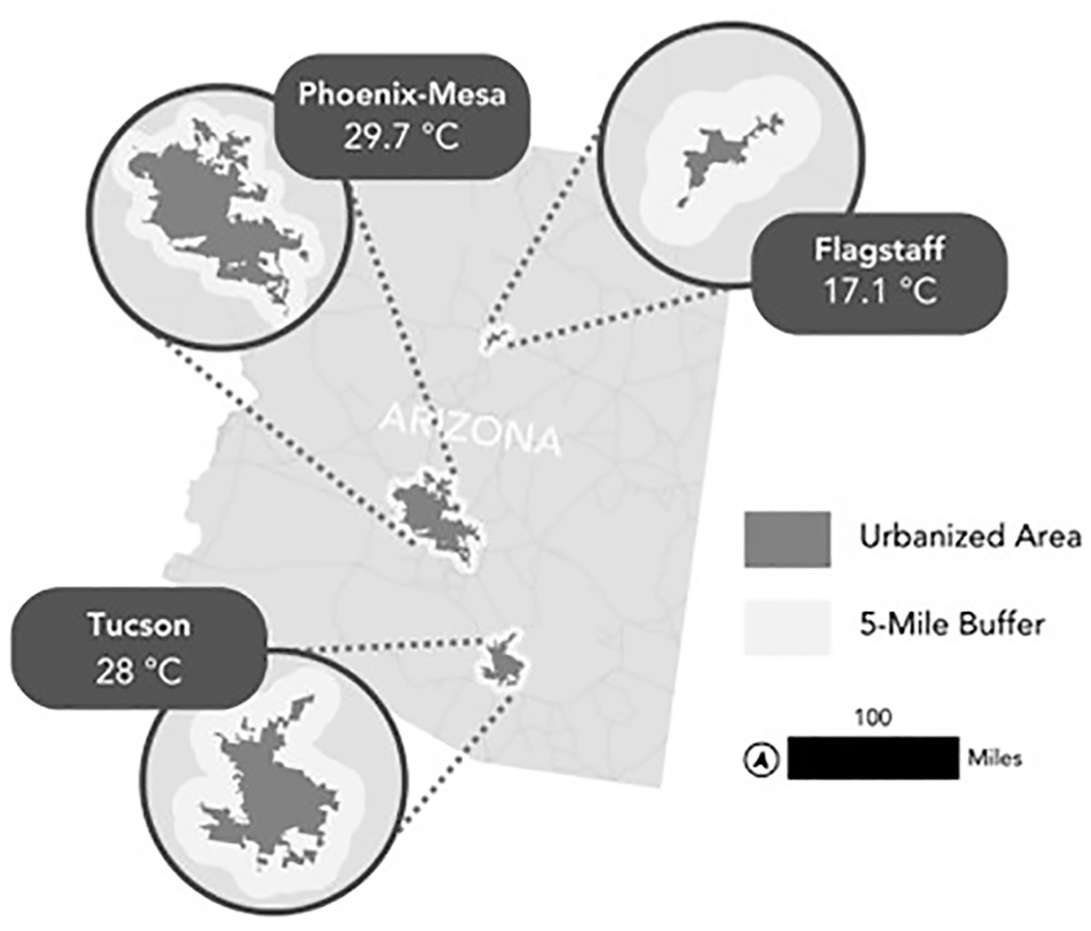
Map of study area highlighting the annual 30-year normal maximum temperature (1991–2020) for each urbanized area.
The differences between the three urbanized areas provide an opportunity to examine the variability of land cover by housing type and MH tenure arrangement across several dimensions. In 2018, the Phoenix-Mesa urbanized area had the largest population with 4,845,832 residents and also the fastest-growing population, growing 15.6% between 2010 and 2020. Similarly, the Phoenix-Mesa urbanized area has the highest number of total housing units with 1,943,813. Flagstaff has the smallest population with 145,101 residents, but has the highest percentage of MH units, accounting for 12.7% of the total occupied housing stock.
The three urbanized areas contain over 10 distinct municipalities, and each municipality has ordinances and policies that govern development and land cover. As one example, the city of Tucson has enacted local ordinances that prohibit turf grass on new development for residential properties. A policy like this may result in all properties having less vegetation compared to the other cities. The effect of all the various ordinances and policies across all municipalities is not examined in this present study, but may help account for observed differences presented here.
The temperature in these three urbanized areas varies significantly, with Flagstaff having the lowest normal maximum temperature of 17.1°C (PRISM Climate Group, n.d.). This temperature difference can have a significant impact on the potential vulnerabilities of each region. For example, the hot climate in Phoenix-Mesa may lead to increased demand for energy to maintain comfortable indoor temperatures. Meanwhile the cooler climate in Flagstaff may lead to an increased risk of heat-related illnesses during extreme heat events due to the lack of experience and infrastructure necessary to cope with such conditions.
For each urbanized area, we obtained three datasets: county tax assessor datasets, the National NAIP data (USDA, 2018), and building locations and footprints (Microsoft, n.d.). The county tax assessor datasets contained property boundaries and parcel use information for over 1.7 million parcels within the urbanized areas. Different housing types and within-housing-type arrangements have unique parcel use codes. These parcel use codes are used to differentiate MH tenure arrangements (e.g. parks, subdivisions and cooperatives) as well as all other property types (Table 1).
Manufactured housing categories, parcel use codes, and terminology.
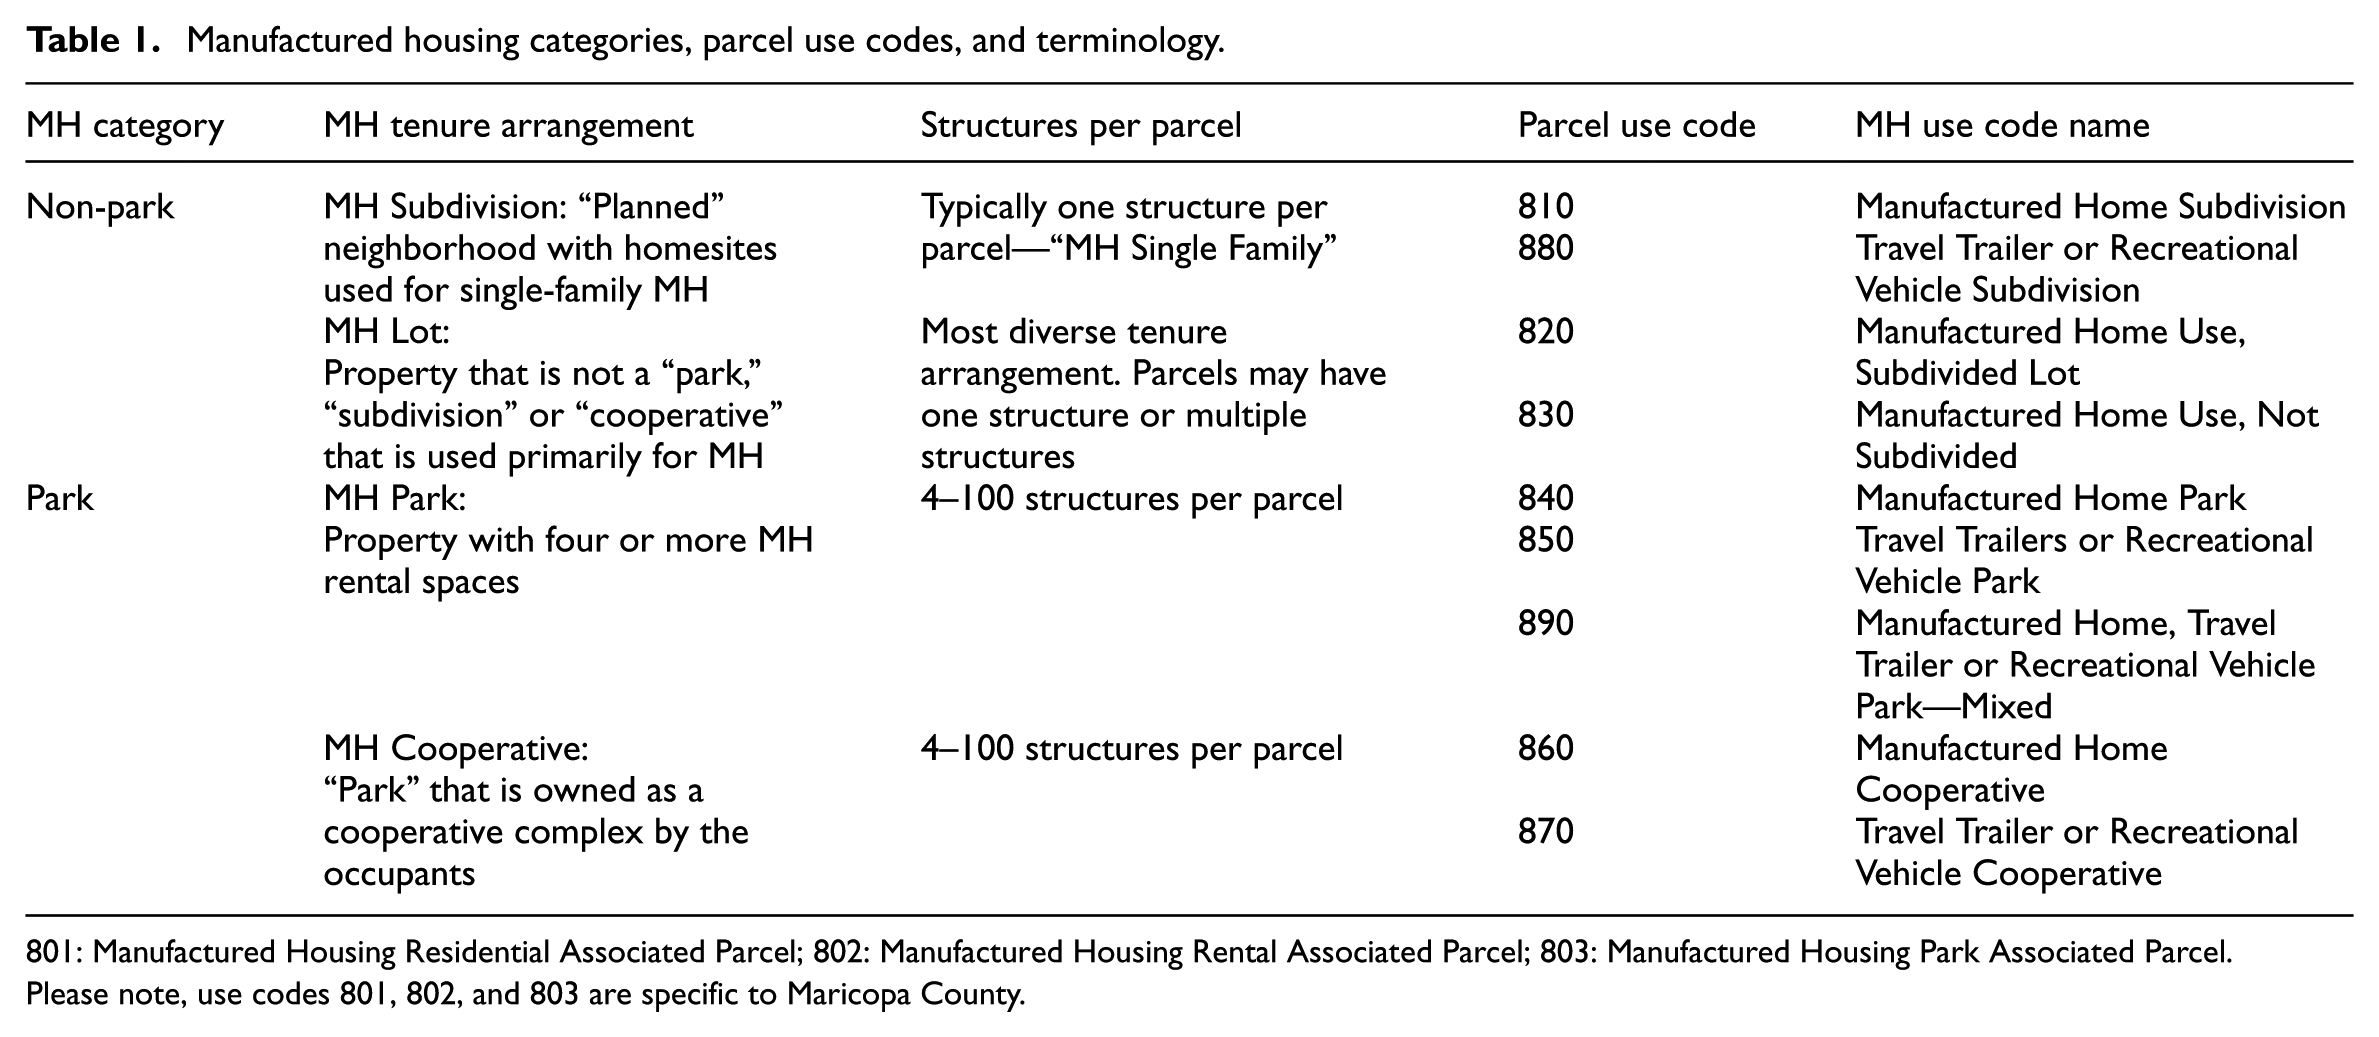
801: Manufactured Housing Residential Associated Parcel; 802: Manufactured Housing Rental Associated Parcel; 803: Manufactured Housing Park Associated Parcel.
Please note, use codes 801, 802, and 803 are specific to Maricopa County.
The NAIP imagery used in this study is four-band multispectral and covers over 11,371,515,904 m2 (2.8 million acres) at a 1 m resolution. For each urbanized area, the NAIP tiles were combined into a single raster image for analysis and image classification. To determine the amount of vegetative land cover per parcel in our study areas, we performed land cover classifications (LCCs) for each study area using four classes: water, impervious, dirt, and vegetation. In ArcGIS Pro, we then used zonal statistics to determine the average acreage of vegetation per building within each parcel. To better visualize vegetation, we adjusted the imagery’s red, green, blue, and near infrared (RGB-N) display to highlight the near infrared wavelengths as bright green. Next, we used the “classification wizard” tool to perform a supervised image classification of each raster image. Within this tool, training samples (polygons) were manually drawn for each of our four predetermined land cover classes: dirt, impervious, vegetation and water. As a result, the pixels in each image were categorized into the four land cover classes, using the support vector machine (SVM) algorithm. The resulting products were three LCCs, one for each urbanized area. To assess the overall accuracy of each LCC, we compared the classifications with a ground reference using random sampling. Fifty accuracy points were randomly generated across the Phoenix-Mesa and Flagstaff LCCs using a stratified sampling strategy. For the Tucson LCC, 52 accuracy points were randomly generated using an equalized stratified sampling strategy. The classifications were manually compared to the ground reference (respective RGB-N imagery layer) for each accuracy point, resulting in an overall accuracy at least 90% between our LCCs and visual evaluation of the NAIP imagery.
It is important to note that during early attempts generating the LCCs, impervious surfaces were frequently confused with dirt. To address this error, we usedthe building footprint shapefile and converted the data into a raster format using the “polygon to raster” tool. Subsequently, the resulting building footprint raster layer was incorporated into to the LCC using the “raster calculator” tool. Pixels originally classified as “dirt,” “vegetation,” or “water” within the boundaries of the building footprints were reclassified as “impervious.” This method improved the overall accuracy of the LCCs by differentiating impervious and dirt surfaces within the landscape.
We used the “zonal statistics as a table” tool to determine the proportion of each parcel that was vegetation, impervious, dirt, and water. We then applied that proportion to the parcel’s acreage to determine total acreage and acreage per building. Figure 2 illustrates the land cover classification scheme for a residential neighborhood in Tucson. The map displays the parcel boundaries of all properties and highlights two MH parks.
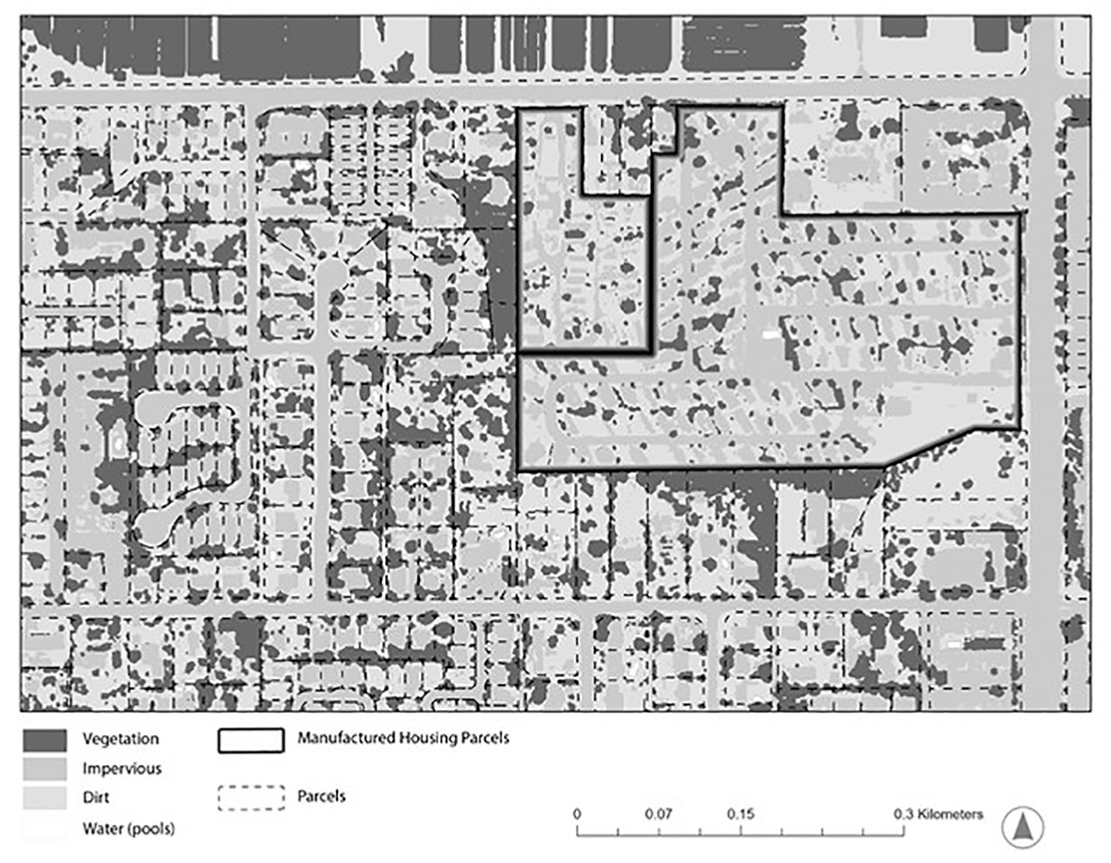
Example of the land cover classification in a neighborhood of mixed housing types.
This dataset allowed us to examine land cover characteristics for 1,724,109 parcels across the three different urbanized areas. We evaluated both parametric and non-parametric tests to determine if the differences between three or more groups are statistically significant. We used Analysis of Variance (ANOVA) tests and statistical significance is indicated by the F statistic and p- values where high F statistics indicate greater variance between groups than within groups, that is, there is a difference (Stoker et al., 2020). To identify the differences between the groups, we used the post hoc tests Tamhane’s T2 and Bonferroni depending on the heterogeneity of the variance. When comparisons were made between only two groups (e.g. “MH parks” and “MH non-parks”), we used an independent sample t-test to identify if differences existed. It is important to note that these analyses tend to produce statistically significant results when applied to such a large dataset. We therefore emphasize differences likely to be meaningful for the local environmental and health conditions of residents.
Comparing the amount of vegetation among housing types
Single family residential properties on average have more vegetation and less impervious surface than other housing types. On average, there are more acres of vegetation on single family residential properties than all other residential housing types. The differences among these averages is statistically significant (F = 48,377, p ≤ 0.01). Post-hoc tests indicate that each category is statistically significantly different from the others. Of all housing types, condos and townhouses on average have the smallest proportion of the property covered in vegetation. 2 MH has a statistically significant difference in vegetation per building compared to all other residential types (Table 2).
Vegetated land cover for residential property types.
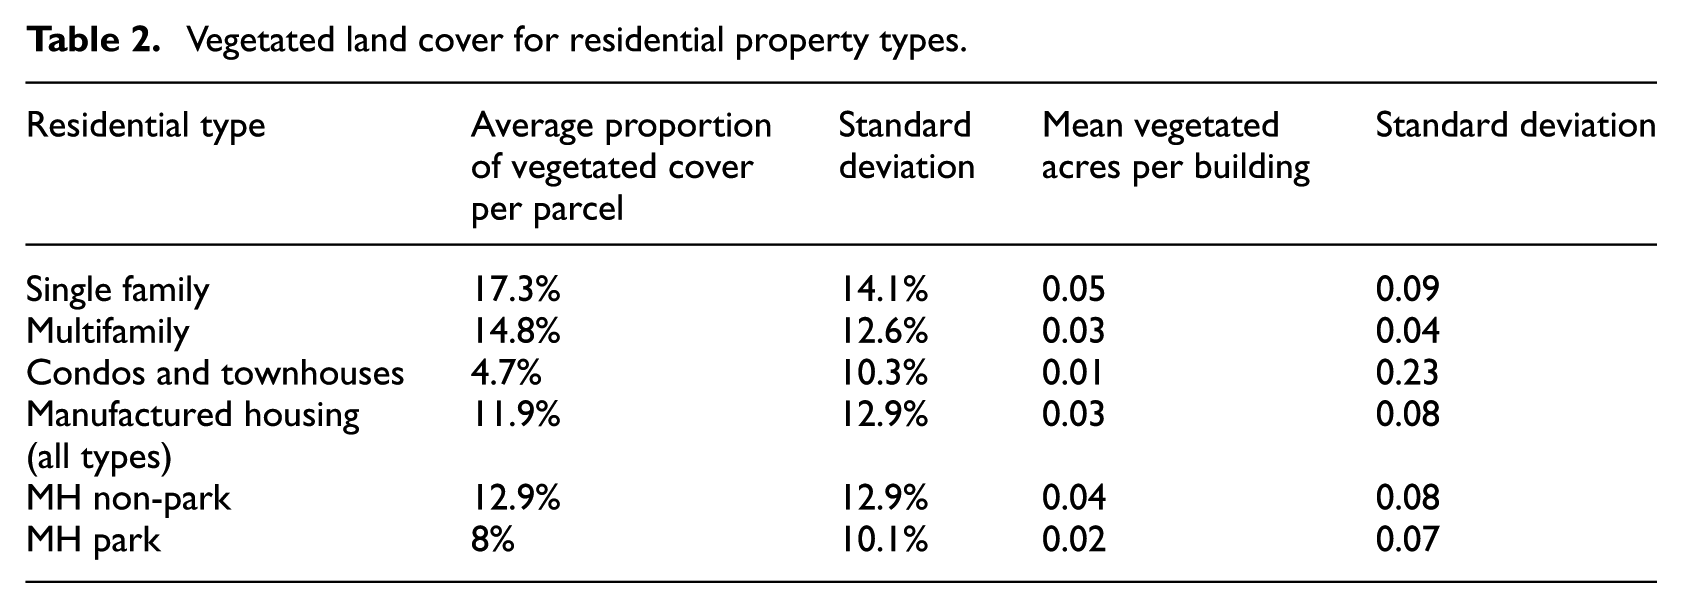
There is a statistically significant difference between the average percentage of vegetation between the MH tenure arrangements as well as differences between the broad categories of parks and non-parks. There is a statistically significant difference between the amount of each measure of vegetation between non-park MH parcels and park MH parcels (p < 0.01). Non-park parcels on average have a higher percentage (12.9% compared to 10.1%) of the parcel covered with vegetation and fewer total vegetated acres (0.05), but twice as many vegetated acres per building (0.04 acres) compared to MH parks (0.02 acres).
Comparing vegetation across the urbanized areas
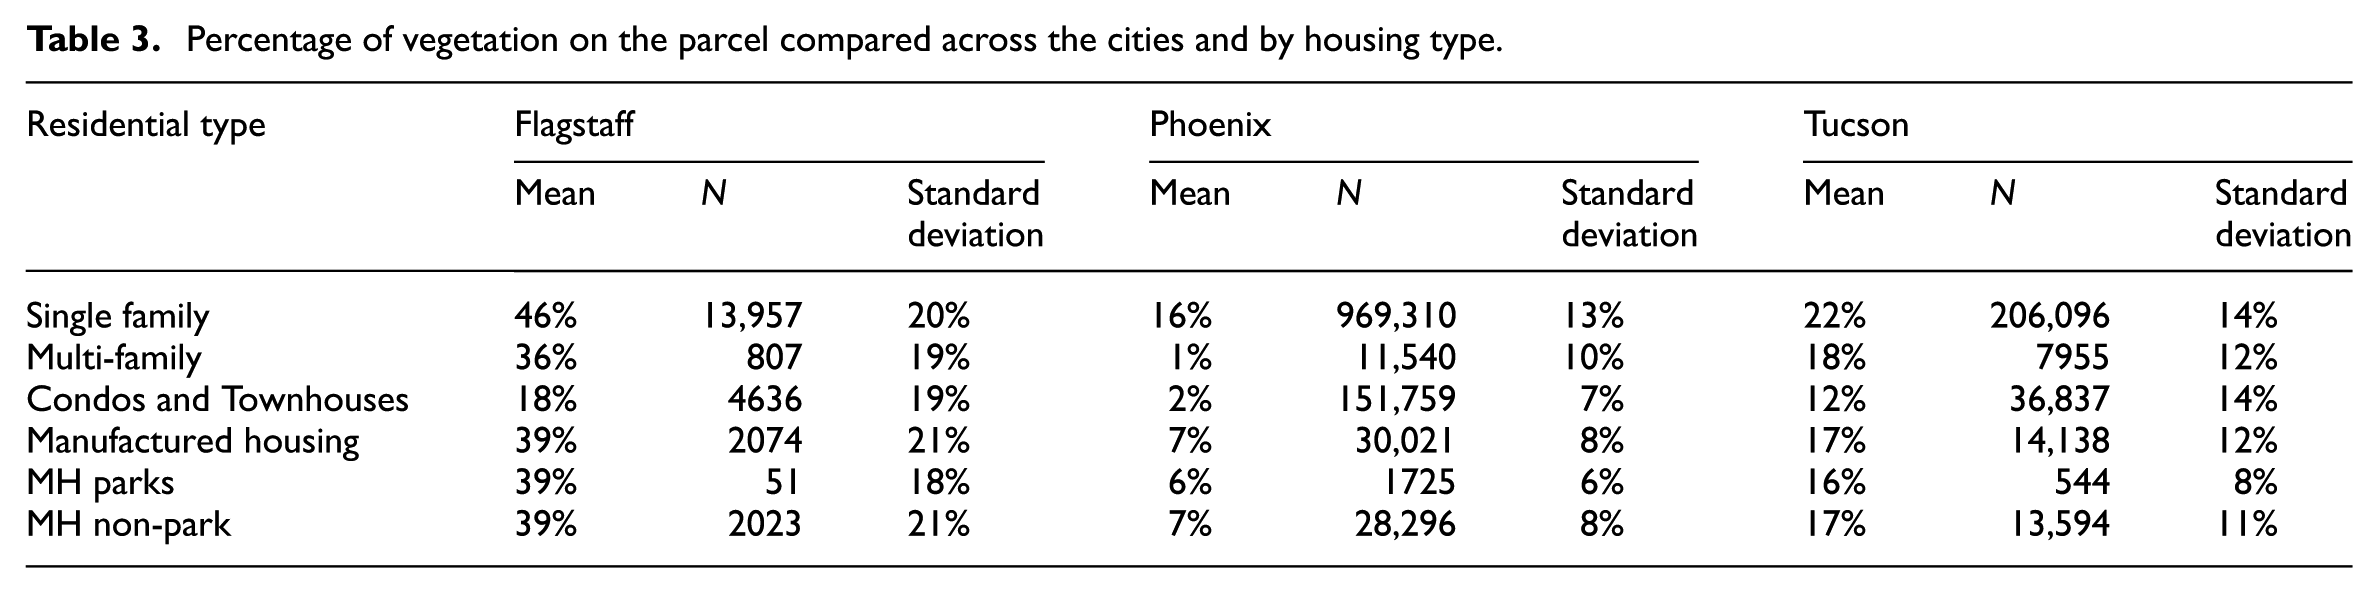
In Flagstaff, all housing types have higher percentages of vegetation than the other two urbanized areas. The difference in the percentage of vegetation per parcel in Flagstaff is also statistically significant across the four housing types (F = 2320, p ≤ 0.01) and post-hoc tests indicate statistically significant differences between each category (Table 3). In Phoenix, we continue to see the same trend where the percentage of vegetation is the highest in single family residential properties and that there are statistically significant differences between all the groups (F = 51,315, n ≤ 0.01). All parcels in Phoenix have lower proportions of vegetation across all residential types compared to Flagstaff. In Tucson, single family housing has the highest proportion of each parcel as vegetation compared to each of the other residential types. There is a statistically significant difference between the groups (F = 6214, p ≤ 0.01) and post-hoc tests revealed statistically significant differences between each group except for multi-family housing and MH, indicating that there is no statistically significant difference in the proportion of the parcel that is vegetated for these two residential types; however, this may be an artifact of differences in the way parcel boundaries are drawn and classified. In the urbanized areas we examined, multi-family parcels are drawn as grids of small parcels instead of three dimensional representations of buildings.
Percentage of vegetation on the parcel compared across the cities and by housing type.
Discussion
There is a growing body of work that highlights the thermal vulnerability of MH residents. This work has highlighted the physical characteristics of MH structures (Government Accountability Office [GAO], 2005; Varfalameyeva et al., 2021) and the socio-demographic characteristics of MH residents (Kear et al., 2025; Phillips et al., 2021) as well as various legal and institutional factors that produce MH as a site of thermal struggle (Kear et al., 2023a; Solís et al., 2023). In this paper, we consider the role of environmental conditions, more specifically land cover and vegetation, in mediating the exposure of MH and its inhabitants to extreme heat. Pierce et al. (2022) document the overrepresentation of MH in hotter census tracts. However, thermal conditions can vary considerably within census tracts. To address this limitation, we built a dataset from publicly available sources that provides parcel level detail on both housing type, and land cover. By carrying out our analysis at the parcel level we are able to more directly estimate heat exposures faced by MH residents and as well as residents of other housing types. Additionally, the parcel scale permits the integration of county-level assessor data and building footprints and within-housing-type use codes, enabling the novel estimation of differences in vegetation per structure and heat risk across a variety of MH tenure arrangements beyond “rent” versus “own”—categories that poorly capture the heterogeneity of this “third housing type” (Rumbach et al., 2020). To our knowledge this is the first study of MH and land cover to use building footprints to support analysis.
The development of this dataset helps to more firmly establish and clarify the pathways that link area conditions and tenure to heat exposure and heat-related health outcomes in MH communities. This is important for a variety of reasons. First, tenure data tailored to the unique characteristics of this housing type is not available from conventional data sources. Second, these unique tenure arrangements have long been identified as a central driver of MH insecurity (Sullivan, 2018). Third, MH is dramatically overrepresented among indoor heat-related deaths but is also a highly heterogeneous housing type with respect to heat vulnerability. These intra housing-type differences are particularly stark with regard to energy and thermal burdens, where MH represents some of the most energy inefficient and thermally insecure housing in the US (i.e. pre-1976 MH; see GAO, 2005), but also some of the most efficient, with models available that meet the EPA’s EnergyStar standard, and qualify for tax credits under the DOE’s new Zero Energy Ready Home (ZERH) program. Regardless, too much of the MH housing stock is a site of extreme energy burden, thermal struggle (Hamstead, 2023, 2024) and heat-associated death. Our analysis can, complemented by other tools, differentiate MH by thermal security—the ability of a household to maintain a home thermal environment consistent with their basic financial, social and health needs (see Kear et al., 2023b)—both on a large scale (e.g. urban and regional scale) with parcel-level precision. Finally, by covering Tucson, Phoenix and Flagstaff, our dataset allows us to test the relationship among heat, housing type and MH tenure arrangement across distinct urban landscapes where home thermal security is a known policy and health concern, reflected, for instance, in the Arizona Governor’s declaration of state-wide Heat State of Emergency in 2023.
Our analysis broadly confirms that single family residential, representing the vast majority of housing across our study region, has more vegetation, and less impervious surface than multifamily or MH. MH has the least vegetation, measured by percentage area covered for the study area as a whole. This pattern reinforces findings from previous research conducted at that tract level in California (Pierce et al., 2022).
There is deviation from this overall pattern across housing types at the city level, however. In Flagstaff, by far the smallest of the three cities and situated within a mixed conifer forest, MH parcels have more vegetation than multifamily parcels. MH also has more vegetation than multifamily in Phoenix, where only 1% of multifamily parcels are vegetated. These higher relative levels of vegetation for MH in Flagstaff and Phoenix persist even after accounting for tenure arrangement. We caution against interpreting this as a reflection of a privileged position for MH. Rather, attention should be focused on the disparity between single family and all other housing types. The gap in vegetation cover between single family and MH is wide in all three cities: 9% in Phoenix, 5% in Tucson, and 7% in Flagstaff. Despite having more vegetation than multifamily in Phoenix, MH parcels have less vegetation in Phoenix than in Tucson or Flagstaff. More generally, land cover inequality varies considerably across cities, with Phoenix the most unequal (excluding condos), and Tucson the least unequal. The contrast between Phoenix and Tucson—both hot, desert cities—reveals a need for deeper policy comparison. Interestingly, Tucson, which has substantially more vegetation across all housing types than Phoenix, has stricter landscaping ordinances that prohibit turf grass.
The hottest and driest places—in greatest need of the heat mitigating effects of vegetation—tend also to be the places where vegetation is the most in deficit and hardest to produce. While our study is limited to three urban centers, our results hint that the compounding effects of heat and aridity feed into inter-housing-type inequalities; that is, where vegetation is the most difficult to produce and sustain, it will be harder for lower socio-economic status groups to access it through their housing options. This could indicate that policies to support heat mitigating land cover are more likely to ameliorate intra-urban inequalities in hot and arid cities.
Access to resources (e.g. credit) and capacity to invest in landscaping are also shaped by property and tenure regimes. Our analysis provides the most insight into the relationship between property/tenure regimes and heat exposure through our within-housing-type comparison of MH tenure arrangements. While we cannot directly compare MH titled as personal property with MH titled as real property—a unique and integral feature of the American MH property regime (Kear et al., 2023a; Sullivan, 2022) likely to influence household capacity to invest in heat mitigation—MH located in park settings is almost exclusively personal property. Accordingly, we assume that levels of personal property are substantially higher in MH park parcels than in non-park parcels. However, it is not clear to what extent the mechanisms that produce land cover differentials between park and non-park parcels can be attributed to differences in personal and real property.
Our analysis shows that non-park MH parcels have more vegetation than park parcels, measured both as a proportion of the parcel that is vegetated and vegetated acres per building. Moreover, these measures likely overestimate access to the heat mitigating effects of vegetation for MH in park parcels due to the uneven distribution of vegetation within parks, where vegetation is commonly used as a visual screen around park peripheries, or centralized around recreational spaces (e.g. clubhouses, pools or dog areas). These results provide qualified support for our hypothesis that park tenure arrangements reduce access to heat mitigating vegetation.
Disparities, both among cities, and between parks and non-parks, widen when land cover is measured by acres per building. In Flagstaff, parks (0.15 acres) have more acres per building than non-parks (0.06 acres). Relative vegetation per building conformed to expectation in Phoenix and Tucson, where non-parks have twice and two-and-a-third times as much acreage per building, respectively. These patterns further imply that where vegetation is scarce it is valued more highly, and less equally distributed, often with MH fairing more poorly than other housing types, and MH parks fairing worse still. This supports the hypothesis that ownership and tenure regimes affect investments in landscaping and vegetation, though our analysis does not control for income and other potential confounding variables.
Additional insight into the relationship between property regime and vegetation can be gleaned by contrasting land cover on single family parcels with land cover on non-park MH parcels. There is now well-established evidence that MH titled as real property appreciates similarly to site-built homes (also titled as real property; Federal Housing and Finance Agency [FHFA], 2020; Herbert, 2023). Such similar patterns in price movements suggest a high relative degree of similarity between site-built single-family housing and MH titled as real property (i.e. compared with the other housing types under investigation). The closest proxy for MH titled as real property in this study is non-park MH. Our analysis shows that, despite the aforementioned similarities, the gap in vegetation cover between single family housing and non-park MH remains high, with single family housing having 18% more vegetation in Flagstaff, 130% more in Phoenix, and 30% more in Tucson. Likely the form of title (personal vs. real property) plays a role, as non-park MH titled as personal property is common in the study area and receives differential (negative) treatment in home lending markets (Kear et al., 2023b; Sullivan, 2022), affecting household capacity and incentive to invest in vegetation.
An obvious extension would be to compare conventional MH parks with cooperatively/resident-owned parks. In other words, is there evidence of resident-owned heat resilience, to paraphrase Lamb et al. (2023). Unfortunately, there are too few resident-owned communities in our study area (12 of 45,000 MH parcels) to make this comparison statistically viable. This is not a limitation of our research design; our approach may be applied to other geographies with better representation of alternative MH park tenure arrangements, including resident-owned and publicly owned communities. Our analysis was further limited with regard to the role of property relations by incompatibilities and inconsistencies in county assessor real and personal property rolls, which in Arizona are recorded separately.
There are other limitations of our study that mark a clear trajectory for future research. First, there are other variables that more accurately represent experienced temperature that are not available in our study area (i.e. land surface temperature, evapotranspiration rates, air temperatures and body heat storage (Chambers et al., 2023)). Moreover, using NAIP imagery to map vegetation does not allow us to identify what kind of vegetation is present, or its effectivenessin reducing air and surface temperatures, and mitigating heat exposure for residents of proximate housing. A more complex mosaic of remotely sensed data may provide deeper insight into the heat risks faced across the housing continuum.
In arid urban environments, access to heat mitigating land cover must be expanded to address both absolute and relative deprivation without substantially increasing water consumption. This highlights the importance of policy to promote water-wise landscaping and xeriscaping combined with better irrigation technology, water reuse, pricing structures and education. As large parcels, public investment, subsidy and/or incentives for landscaping in MH parks could have regional cooling effects and impacts on the overall urban heat island effect, while also materially improving heat resilience in a population with high levels of thermal insecurity.
The policy implications of our results, for Arizona cities and beyond, are potentially broad. But, the fact of MH’s thermal insecurity is already well established by a variety of complementary research studies, and there are many known solutions (Varfalameyeva et al., 2021). What is lacking is an empirical basis to evaluate theories about the structural roots of MH thermal insecurity. The approach that we have developed provides a foundation for future research that tests potential theories of home thermal security, especially with regard to financial, property and tenure relations.
Conclusion
In conclusion, our article explores the role of housing type and tenure in shaping exposure to extreme urban heat, with a focus on mobile and manufactured housing (MH), a heat vulnerable housing type. Our study used publicly available datasets to assess the difference in vegetation present in MH parcels compared to single family and multi-family residential housing types. Our findings revealed that MH parcels have less vegetation than other housing types. MH that is located in parks has on average less vegetation on each property compared to MH units sited on individual lots. Looking forward, our findings suggest a need for policy interventions to improve climate resiliency in MH, as well as the role of property relations and hierarchies in producing differential vulnerability to extreme heat.
Footnotes
Funding
The author(s) disclosed receipt of the following financial support for the research, authorship, and/or publication of this article: This material is based upon work supported by the US Department of Energy, Office of Science, Office of Biological, and Environmental Research’s Urban Integrated Field Laboratories research activity, under Award Number DE-SC0023520.
Declaration of conflicting interests
The author(s) declared no potential conflicts of interest with respect to the research, authorship, and/or publication of this article.