
Abstract
Cities have specialised in particular urban functions throughout history, with consequential implications for urban and regional patterns of economic and social change. This specialisation takes place within overall national city size distributions and is manifest in different but often similarly variegated residential structures. Here we develop a novel and consistent methodological approach for measuring macro-scale city size and micro-scale residential differentiation using individual digital census records for the period 1881–1901. The use of family names and neighbourhood classification of dominant economic and social roles makes it possible to relate the changing city size distribution in Great Britain to patterns of urban growth and residential differentiation within urban areas. Together, we provide an integrated and consistent methodology that links the classification of all major urban area growth in Great Britain to attendant intra-urban geodemographic changes in urban residential structures. We suggest ways in which this manifests social and economic change across the settlement system for both new and long-established residents.
Introduction
Changes within national city size distributions and specialisations in the economic functions of individual settlements have important indicators of the fortunes of city residents at local, regional and national scales. The occupational structures of individual cities, their residential structures and the migration histories of their residents all remain of interest to urban geographers, regional scientists and urban economists (e.g. Daunton, 2001; Dennis, 1984; Storper, 2013). Quantitative measures have been devised to document changes in the morphology and occupational structures of individual city systems (Batty and Longley, 1994), yet rather few historical studies have attempted to relate changes in city population size distributions (Berry, 1961) to relative changes in the functional roles of city labour forces and the mix of existing households and recent occupants that fulfil different occupational roles. We argue here that this is because of the lack of consistent definitions of urban structures and the lack of capacity to precisely attribute populations to their constituent residential areas.
City sizes are nevertheless frequently observed to follow a power-law distribution in which the product of a city’s size and its rank approximates a constant (Auerbach, 1913), as subsequently embodied in Zipf’s Law (Zipf, 1949). With the proliferation of open data in recent decades, empirical evidence of this rank-size regularity has accrued on a global scale as well as for individual countries at various stages of development, including the UK, Germany, Canada, China and the United States (Batty, 2006; Song and Zhang, 2002; Veneri, 2016). Such regularity has also been observed when interpreting the evolution of urban structures and metropolitan changes (Suarez-Villa, 1988). Of particular note is the data-intensive analysis of Jiang and Jia (2011) that bases the definition of city extent upon the results of clustering 25 million US street intersections. Their notion of ‘natural’ cities is a departure from many conventional definitions grounded in arbitrary administrative jurisdictions. Rank-size regularity is also observed in averaged population characteristics such as employment, innovation, education, crime and disease (Gomez-Lievano et al., 2016).
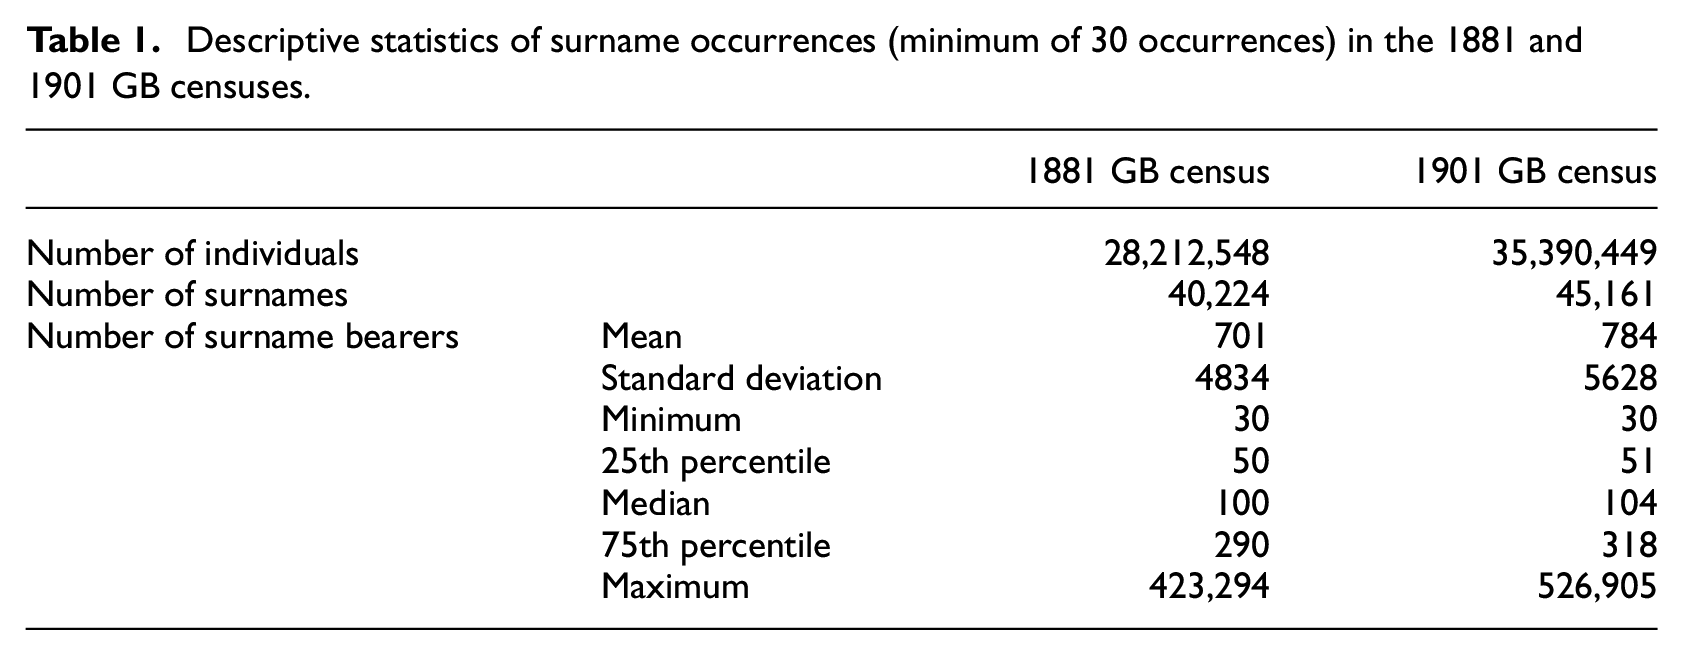
Yet this work is essentially cross-sectional in nature and remains analytically separate from the rich literature on migration history (e.g. Schürer and Day, 2019) and geodemographic structures (e.g. Singleton et al., 2016). In this paper, we deploy onomastics – the history and origins of personal names – to attribute changes in the relative sizes of settlements to the recency of resident migration to them, and use a historical geodemographic classification (Lan and Longley, 2021) to chart functional changes in the characteristics of the residential neighbourhoods in which residents lived. Family names (surnames) are near-universal tokens of identity that are commonly inherited over generations through patrilineal family lines. The value of surname data has been demonstrated in recent work that traces the long-term effects of migration (Pérez, 2019) and attendant social mobility outcomes (Clark, 2015; Connor, 2020). Table 1 presents descriptive statistics of the skewed distribution of surnames and their bearers as recorded in the 1881 and 1901 censuses in Great Britain (Cheshire and Longley, 2012). We remove rare names with fewer than 30 occurrences, as these are likely to be transcription errors prior to or from digital capture. However, we retain slightly different spellings of apparently similar names, as some apparent variants likely have distinctive geographic origins.
Descriptive statistics of surname occurrences (minimum of 30 occurrences) in the 1881 and 1901 GB censuses.
Using Great Britain-wide individual-level data from available censuses, 1881 and 1901, we examine the assimilation of geographically localised Anglo-Saxon names (Kandt et al., 2020; van Dijk and Longley, 2020) and the household characteristics that their bearers bring into the 50 largest settlements in 1881. At a macro level, these changes are related to the GB-wide rank-size distribution, while linked micro-level analysis allows identification of the degree to which new arrivals bear social similarities to existing residents and share newly developed or existing residential areas. The result is an integrated macro–micro analysis of the functional evolution of the Great Britain settlement system over the study period, and a linked methodology that is extendable to other periods subject to data availability.
Here, we describe the following sequence of analytical steps:
We implement a new set of robust and generalised procedures (Lan and Longley, 2019) to georeference the urban residential locations at which almost all individual census returns were completed for the 1881 and 1901 censuses. The historical addresses are georeferenced to exact or most probable locations within the historical parishes using fuzzy string matching. We use the results to consistently define the extents of all urban areas using street segments rather than averaging over historical administrative areas.
We use this infrastructure and individual census data to investigate the rank-size distribution of Great Britain’s settlement system from 1881 to 1901. We use surname diversity alongside other conventional measures to identify changes in the overall distribution. The facility to differentiate between newly-added and more established surnames and to locate the precise residences of their bearers makes possible (a) macro analysis of the relative shares of urban growth that are attributable to family groups that are predominantly established or are recently arrived, and (b) micro-scale analysis of the extent to which new arrivals reside in newly developed parts of growing urban structures.
Using individual-level georeferencing, we append a consistent census-based geodemographic household classification to each record in the periods. This allows us to detect changes in the geodemographic compositions of the 50 largest settlements and to contrast the geodemographic profiles of established and newly-arrived households in each settlement. Using Ward cluster analysis, we devise a GB-wide macro typology of the geodemographic changes that occur in each urban settlement.
We use illustrative case studies to describe how this integrated macro–micro approach crystallises the geodemographic trajectories of particular settlements and how these changes relate to the GB-wide rank-size distribution.
In each stage of the analysis, microdata are contextualised by macro changes, such as the increasing service orientation of towns and cities. As such, this paper builds upon the existing literature on city size distributions, migration and geodemographics by: (a) consistently defining historical residential areas for 1881 and 1901 independent of administrative geographies as the basis of rank-size analysis; (b) establishing that surnames present an appropriate and valid means of representing the rank-size distribution and a useful bridge to micro-scale analysis; (c) charting changes in the numbers and socio-economic roles of new and established family groups in the 50 largest discrete settlements in 1881; and (d) relating these functional changes to the rank-size distribution over the period 1881–1901. This integrated and essentially scale-free analysis thus links macro-state changes in the rank-size distribution of settlements to the changing functions of urban populations as measured by geodemographics and local, regional and national migration histories. Together this provides a GB-wide framework that relates the change in the rank-size distribution to changes in employment, demography, urban form and migration history.
Rank-size distributions and the changing settlement system, 1881–1901
The size distribution of the contemporary British settlement system relates in significant part to urban development and industrial change in the late 19th century, defined here as the period spanning the 1881 and 1901 censuses of population (for which GB-wide digital census records are available). Uneven and differentiated development across the settlement system is both cause and consequence of socio-economic change and is manifest in the evolving morphologies, configurations and extents of urban residential areas. A large body of empirical evidence confirms that residential road networks provide a good proxy for urban form and that use of linked networks of residential street segments frees analysis from artificial aggregations such as administrative jurisdictions (Barrington-Leigh and Millard-Ball, 2015; Jiang and Jia, 2011; Masucci et al., 2013).
The threshold below which a street segment is deemed to be connected to an urban structure influences the measured extent of urban areas. Following Lan and Longley (2021), we adopt 200m as the threshold for contiguous residential street segments in order to define significant urban areas, identified initially as housing at least 10,000 residents. This distance threshold is considered appropriate for a time prior to the advent of car travel and is also sufficient to span physical obstacles within urban areas, such as rivers. Visual inspection of results suggests that known areas of redevelopment and land use change that cannot be georeferenced using contemporary registers, are overwhelmingly internal to urban structures and thus do not affect the bounding envelope of settlements. We estimate that at least 67% of the non-georeferenced historical census records (27% of the total records) in our combined 1881 and 1901 dataset are isolated residences beyond the urban envelopes that bound the 50 largest urban street segment clusters.
Macro analysis of changes
Figure 1 presents the changing GB-wide rank-size distribution of the 200 largest settlements in 1881 and in 1901, defined using four different size metrics: (a) population size, (b) number of households, (c) number of street segments, and (d) number of surnames. Each plot exhibits a slightly curvilinear scaling effect, consistent with observations of Zipf (1949), Batty (2006) and Jiang and Jia (2011). London, with a 1901 population of c. 4.7 million, stands out as the primate city across the four size metrics, being far more than twice the size of second-ranked settlement Manchester with a 1901 population of c. 0.7 million. The classic population size measure in Figure 1(a) is the best behaved of the four plots and shows a shift effect between the start and end of the study period, consistent with accelerating urbanisation throughout the settlement system. The equivalent distributions for households in Figure 1(b) and street segments in Figure 1(c) are similar but slightly convergent towards the smaller end of the size range, indicating, respectively, smaller household numbers and reduction in street density in the smaller settlements.
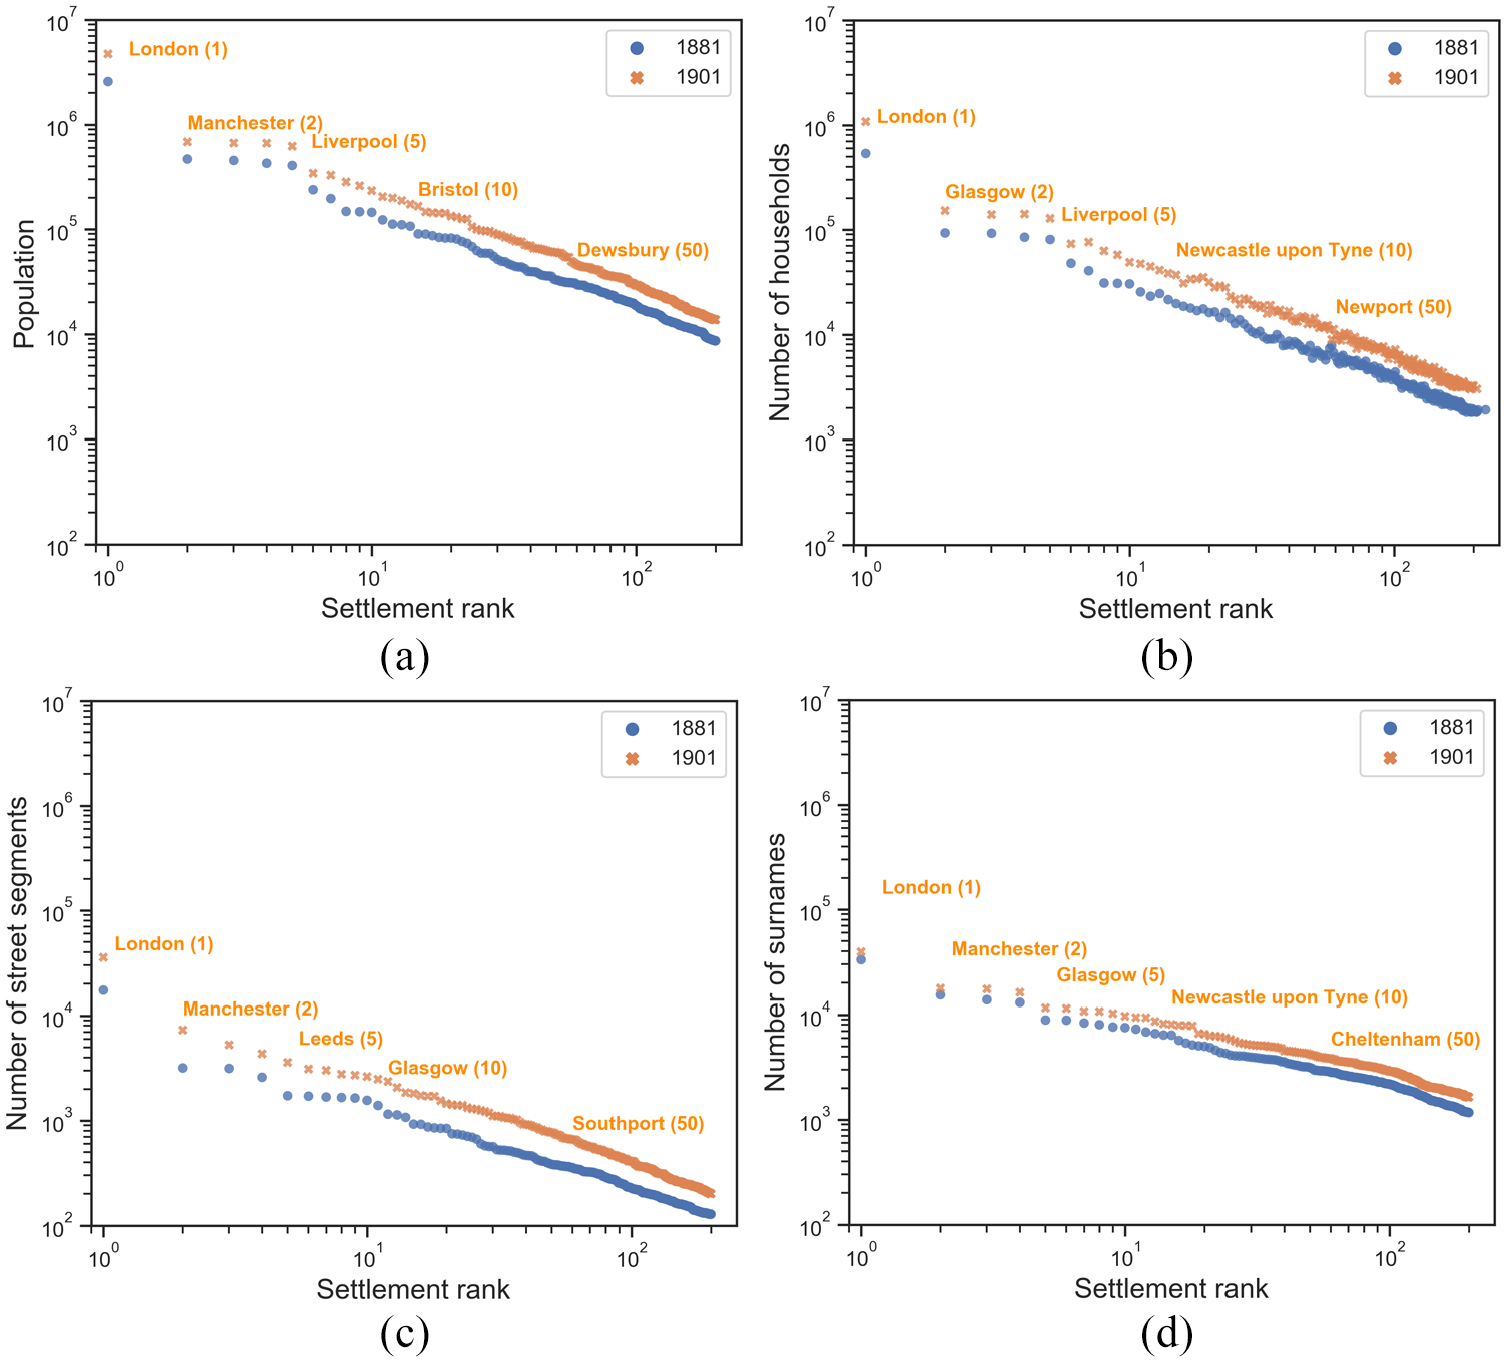
Rank-size distributions of the largest 200 settlements in 1881 and 1901, by (a) population, (b) number of households, (c) number of street segments, and (d) number of surnames.
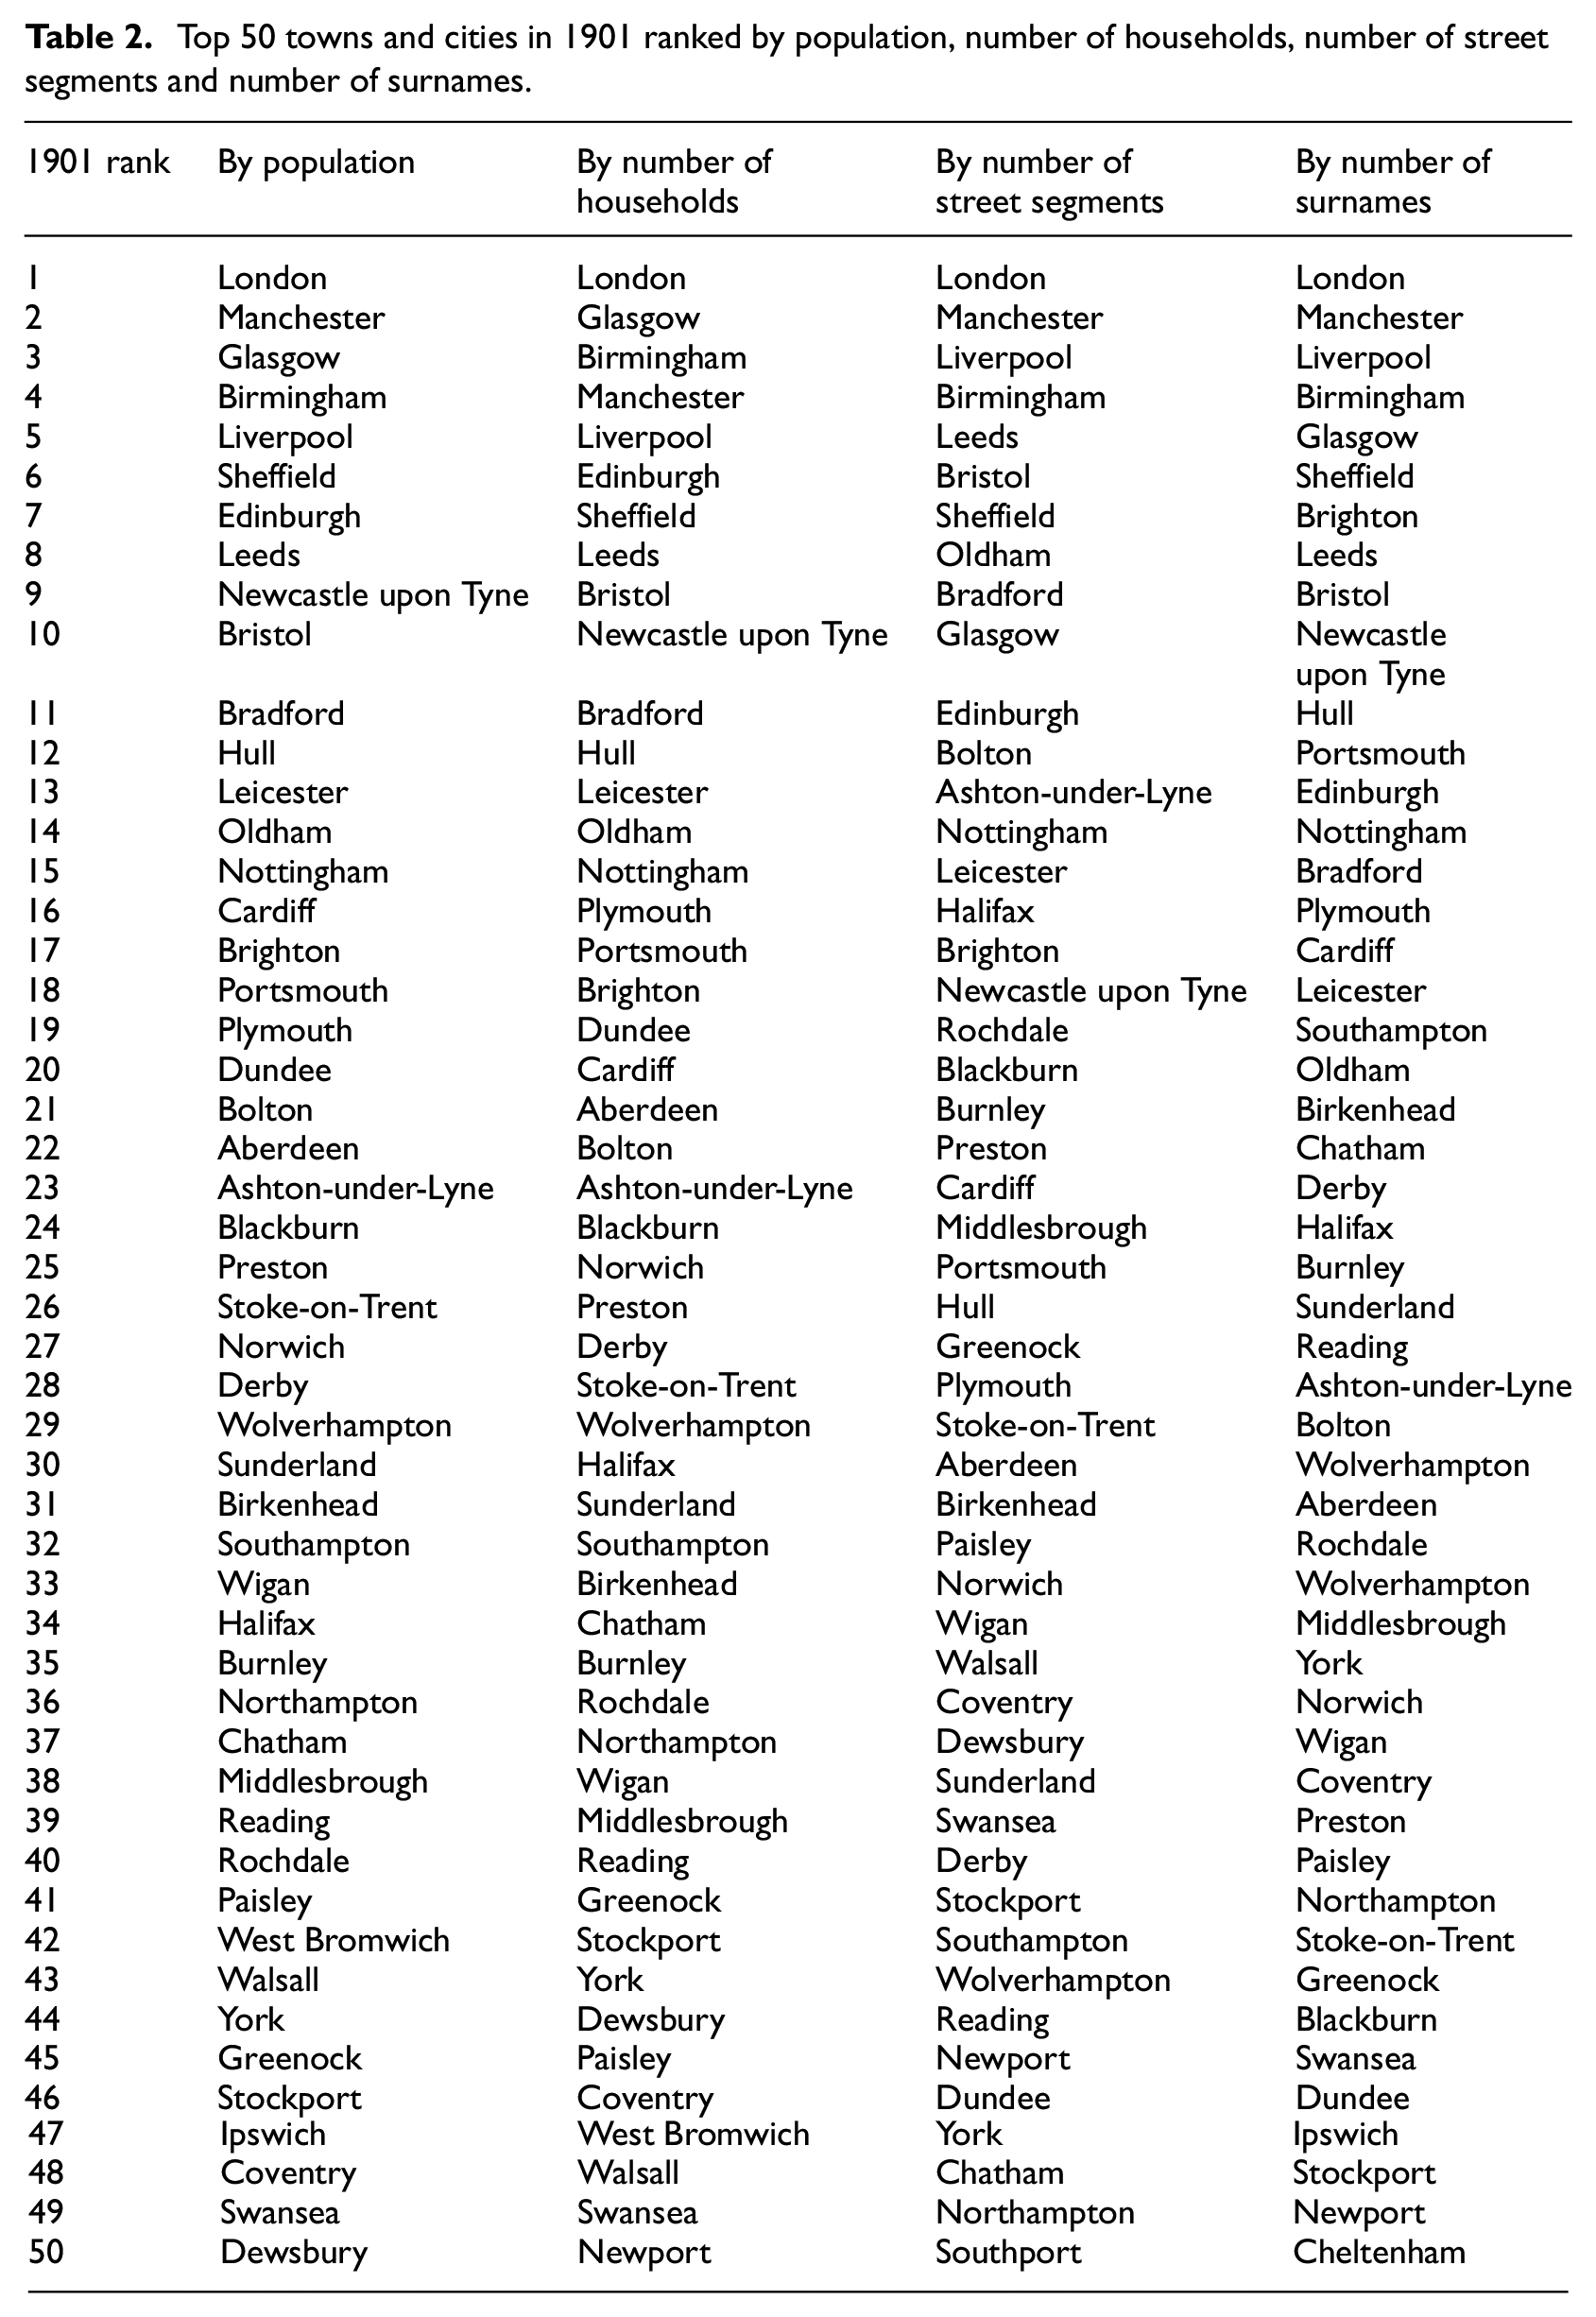
The ranks of the largest settlements as measured by surname diversity are broadly aligned with the other measures and exhibit similar exponents of Zipf’s law (Lan and Longley, 2021). In what follows we will focus upon the 50 largest settlements (see Table 2). However, Glasgow and Edinburgh are ranked lower by their numbers of surnames compared with the corresponding ranks by population in 1901, whereas Liverpool and Brighton have higher ranks by surname diversity. The ranking of settlements in the city systems is otherwise well mirrored by the numbers of surnames. Infusion of new surnames not only indicates increasing cultural diversity through migration but also signifies growing genetic diversity (e.g. Kandt et al., 2016). The rationale behind the alignment of the surname measure with other size metrics is that larger urban settlements such as London draw migrants from a larger hinterland who bear a correspondingly diverse range of localised or regionalised surnames. In the case of the largest settlements, names may be drawn from almost the entirety of Britain and Ireland and from overseas countries. In contrast, smaller settlements are more likely to attract residents from more restricted hinterlands comprising bearers of fewer names. At the level of the settlement system, the rank-size distribution of surnames is consistent with Christaller’s Central Place Theory in which high order settlements host a more diverse range of service functions.
Top 50 towns and cities in 1901 ranked by population, number of households, number of street segments and number of surnames.
New surnames imported into urban areas over the 1881–1901 period tend to have fewer bearers in the smaller urban areas (e.g. Swansea has an average of 1.20 household heads bearing each newly imported names and Preston has 1.22, while in London each newly imported name is borne by 1.33 household heads). Figure 1(d) suggests approximately constant rates of integration for all settlements ranked lower than 10 in the national distribution. This establishes that, notwithstanding evidence of spatial heterogeneity in regional naming practices, surnames provide a comparable indicator of order in the settlement system to conventional population size measures and the street segment measure of infrastructure.
This comparison demonstrates a broad equivalence between surname diversity and other measures of the size of urban settlements in Victorian Britain. Unlike the conventional measures, our ability to georeference the residential locations of incoming residents allows us to differentiate them from bearers of surnames that indicate longer-term (probably inter-generational) residence. Unlike the other measures, this allows us to locate and characterise the diverse residential and occupational milieux of all residents and, through this association, to characterise the micro-scale growth dynamics of each settlement (Suarez-Villa, 1988).
Micro analysis of new and existing urban development
Comparison of the 1901 and 1881 street networks that underpin the system-wide analysis allows us to identify the degree to which newly arrived residents are accommodated in recently-developed residential areas. We identify the proportions of households in these categories that moved into ‘non-core’ residential neighbourhoods constructed between 1881 and 1901. We thus identify the relative magnitude of 1881–1901 population changes within each settlement to street-scale residential geography. ‘Core’ (pre-1881) and ‘non-core’ (1881–1901) neighbourhoods are defined by filtering out the 1901 street segments that fall within the 1881 bounding envelope of each settlement.
The numbers of confirmed incoming households and the proportions of them that settled in new residential areas in each of the 50 largest settlements are shown in Figure 2. The majority of households identified as newly arrived take up residence in pre-existing urban areas, although the share of such residents in newly-developed areas is much higher in urban areas such as Manchester, Sheffield, Newcastle, Cardiff, Plymouth, Chatham and Stoke-on-Trent. By contrast, recent residents are more usually accommodated within the existing urban areas of Edinburgh, Swansea, York, Nottingham, Birkenhead, Hull and Dundee.
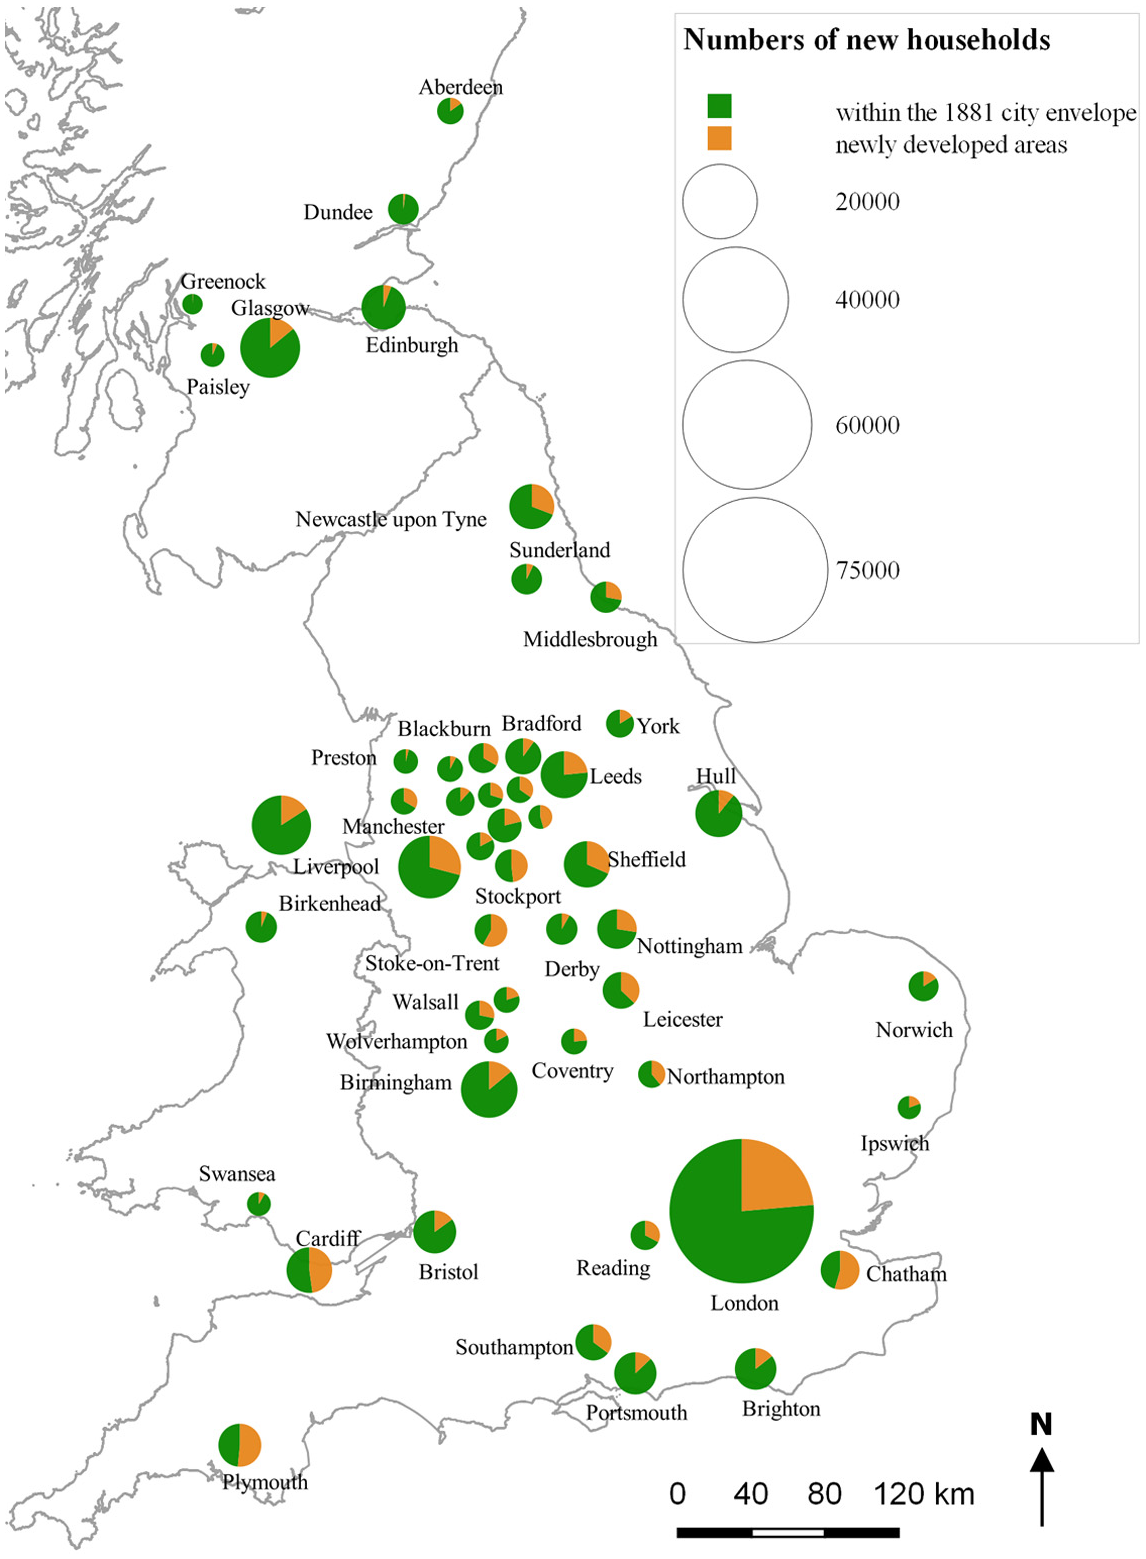
Numbers of 1901 households identified as moving into the 1881 city envelopes and into newly developed neighbourhoods in the 50 urban settlements.
Figure 3 presents an illustrative example of the residential street geography of Manchester in 1901. The ‘core’ neighbourhoods that existed in 1881 lie within the bounding envelope, while most ‘non-core’ neighbourhoods constructed after this date and connected to the urban structure (subject to a distance threshold of 200m) lie beyond the 1881 city boundary. These streets are colour-coded according to resident characteristics discussed below.
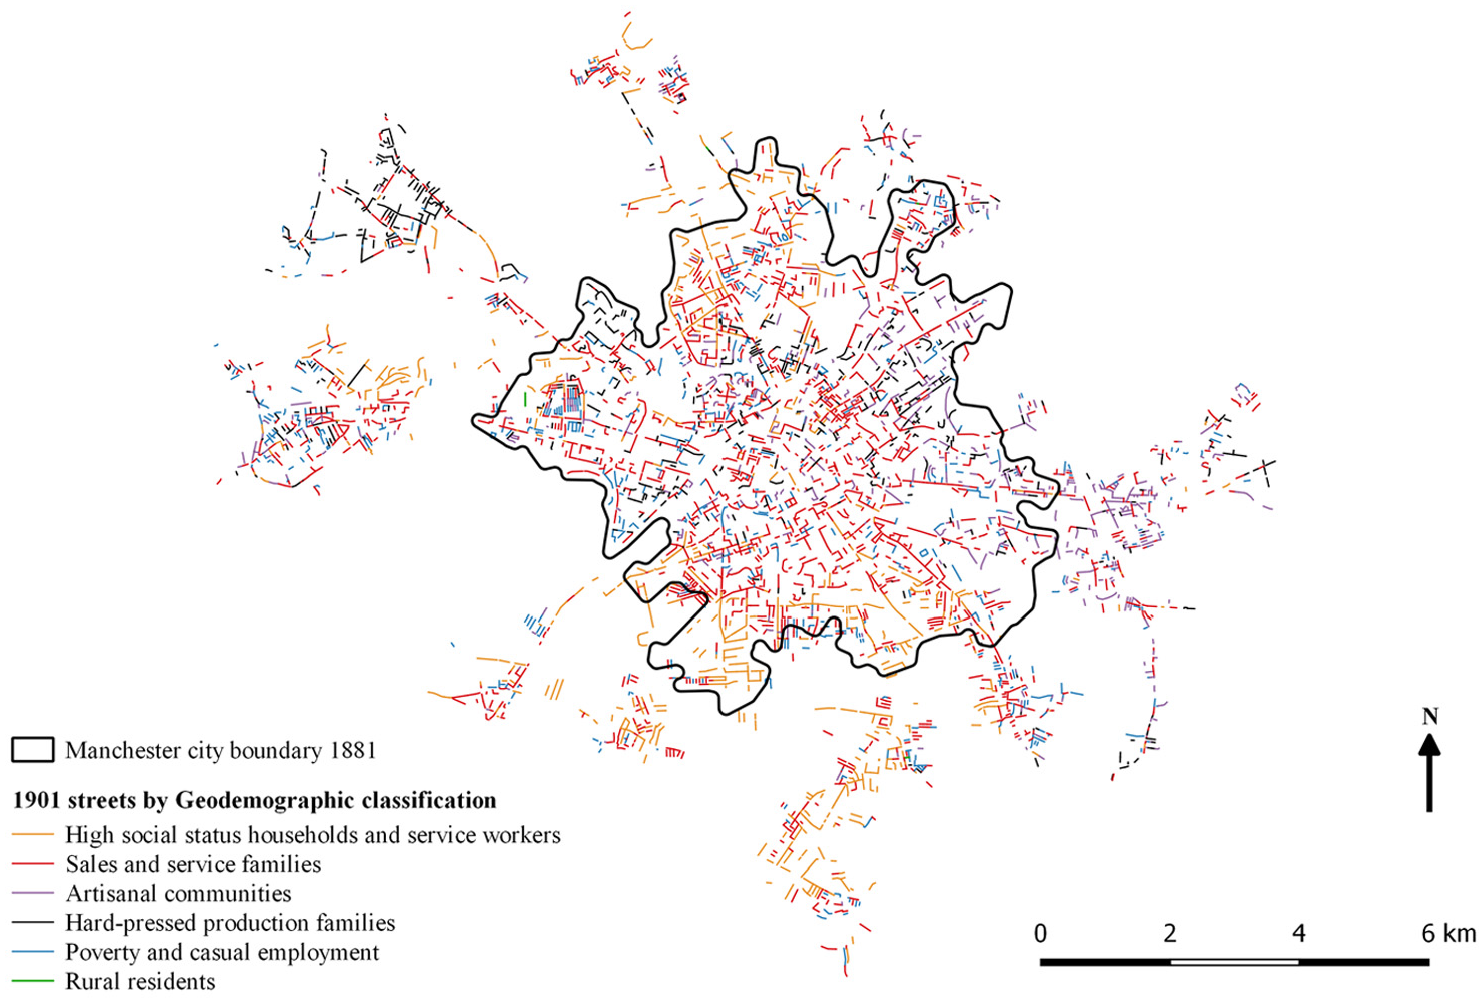
The ‘core’ and ‘non-core’ street geography of Manchester, 1881–1901 and its 1901 neighbourhood structure.
The geodemographics of family groups
Geodemographics is ‘the analysis of people by where they live’ (Harris et al., 2005), developed using neighbourhood typologies to characterise local built environments and social milieux. Here we use the historical temporally consistent geodemographic classification of Great Britain for 1881–1901 developed by Lan and Longley (2021). We compare the neighbourhood circumstances of recent and predominantly longstanding residents to consider types of households that were attracted to urban areas through an examination of the residential milieux in which they were assimilated. We illustrate these ideas with respect to some of the 50 largest settlements of 1881 identified in Table 2 and Figure 2.
Overview of the historical geodemographic classification
Lan and Longley’s (2021) historical street-level geodemographic classification clusters household level 1881–1901 digital census records into six clusters to make possible a GB-wide picture of the social and economic conditions of the late Victorian population, in ways resonant with Charles Booth’s contemporaneous Poverty Maps (https://booth.lse.ac.uk/map) disseminated in digital form by the London School of Economics and subsequently by Orford et al. (2002).
This generalist approach seeks a uniform coverage of society rather than a focus upon the urban poor and comprises six Groups: (1) High Social Status Households and Service Workers; (2) Sales and Service Families; (3) Artisanal Communities; (4) Hard-Pressed Production Families; (5) Poverty and Casual Employment; and (6) Rural Residents. These Groups contribute to and manifest the attraction of cities and urban evolution in very different ways. Group (1) comprises nascent professional occupations along with industries that required managers and clerical workers, while Group (2) includes the many sales workers (such as shop assistants, insurance salesmen and estate agents) that made up the middle class that burgeoned in the study period. Growth in Group (3) household numbers manifests an industrial structure grounded in small enterprises such as shoemakers, blacksmiths, toolmakers and jewellers, in contrast to the factory production, raw material extraction and processing that were undertaken by members of Group (4) households. The occupational structure underpinning Group (5) is different from all of these, being predominantly grounded in casual employment in operating machinery, bricklaying, construction work or dock labour. Employment in agriculture, forestry and fishing underpinned the occupational structure of locales beyond urban areas and dominated by Group (6).
Demographic characteristics of incoming family groups
All 1881 and 1901 georeferenced residents in the 50 urban areas are assigned to one of the six geodemographic Groups used to describe their residential streets. This makes it possible to profile each of the 50 settlements using a series of radial plots for 1881 and 1901, detailing the percentages of household heads assigned to each geodemographic Group in each settlement. (We exclude the Rural Residents Group for the obvious reason that its members are rarely found in urban areas.) Our presumption in so doing is that households recently arrived in 1901 were attracted by employment opportunities arising from the economic trajectories of the destination settlements. The composition of the new workforce both responds to and reinforces the economic trajectories of the destination urban areas reflecting, for example, the relative requirement for casual employment, artisanal occupations or service workers to drive local urban economies.
We do not present the entire set of radial plots here for reasons of space availability. Instead, Figure 4(a) and (b) present illustrative paired examples of four representative settlements, Liverpool, Manchester, Leeds and Bradford, in order to demonstrate the different profiles and trajectories identifiable amongst the 50 settlements. In Figure 4(a), the three polygons in each radial plot identify the geodemographic Group assignments of all household heads that were (1) present in 1881, (2) present in 1901, and (3) newly arrived between 1881 and 1901. It is apparent that Manchester and Leeds began with much more differentiated geodemographic structures and that this diversification accelerated over the study period. Manchester differs from Leeds, however, in the relative share of new residents entering the Sales and Services group compared with the Hard-Pressed Production group, while the relative preponderance of Artisanal Communities in Leeds accelerates over the study period.
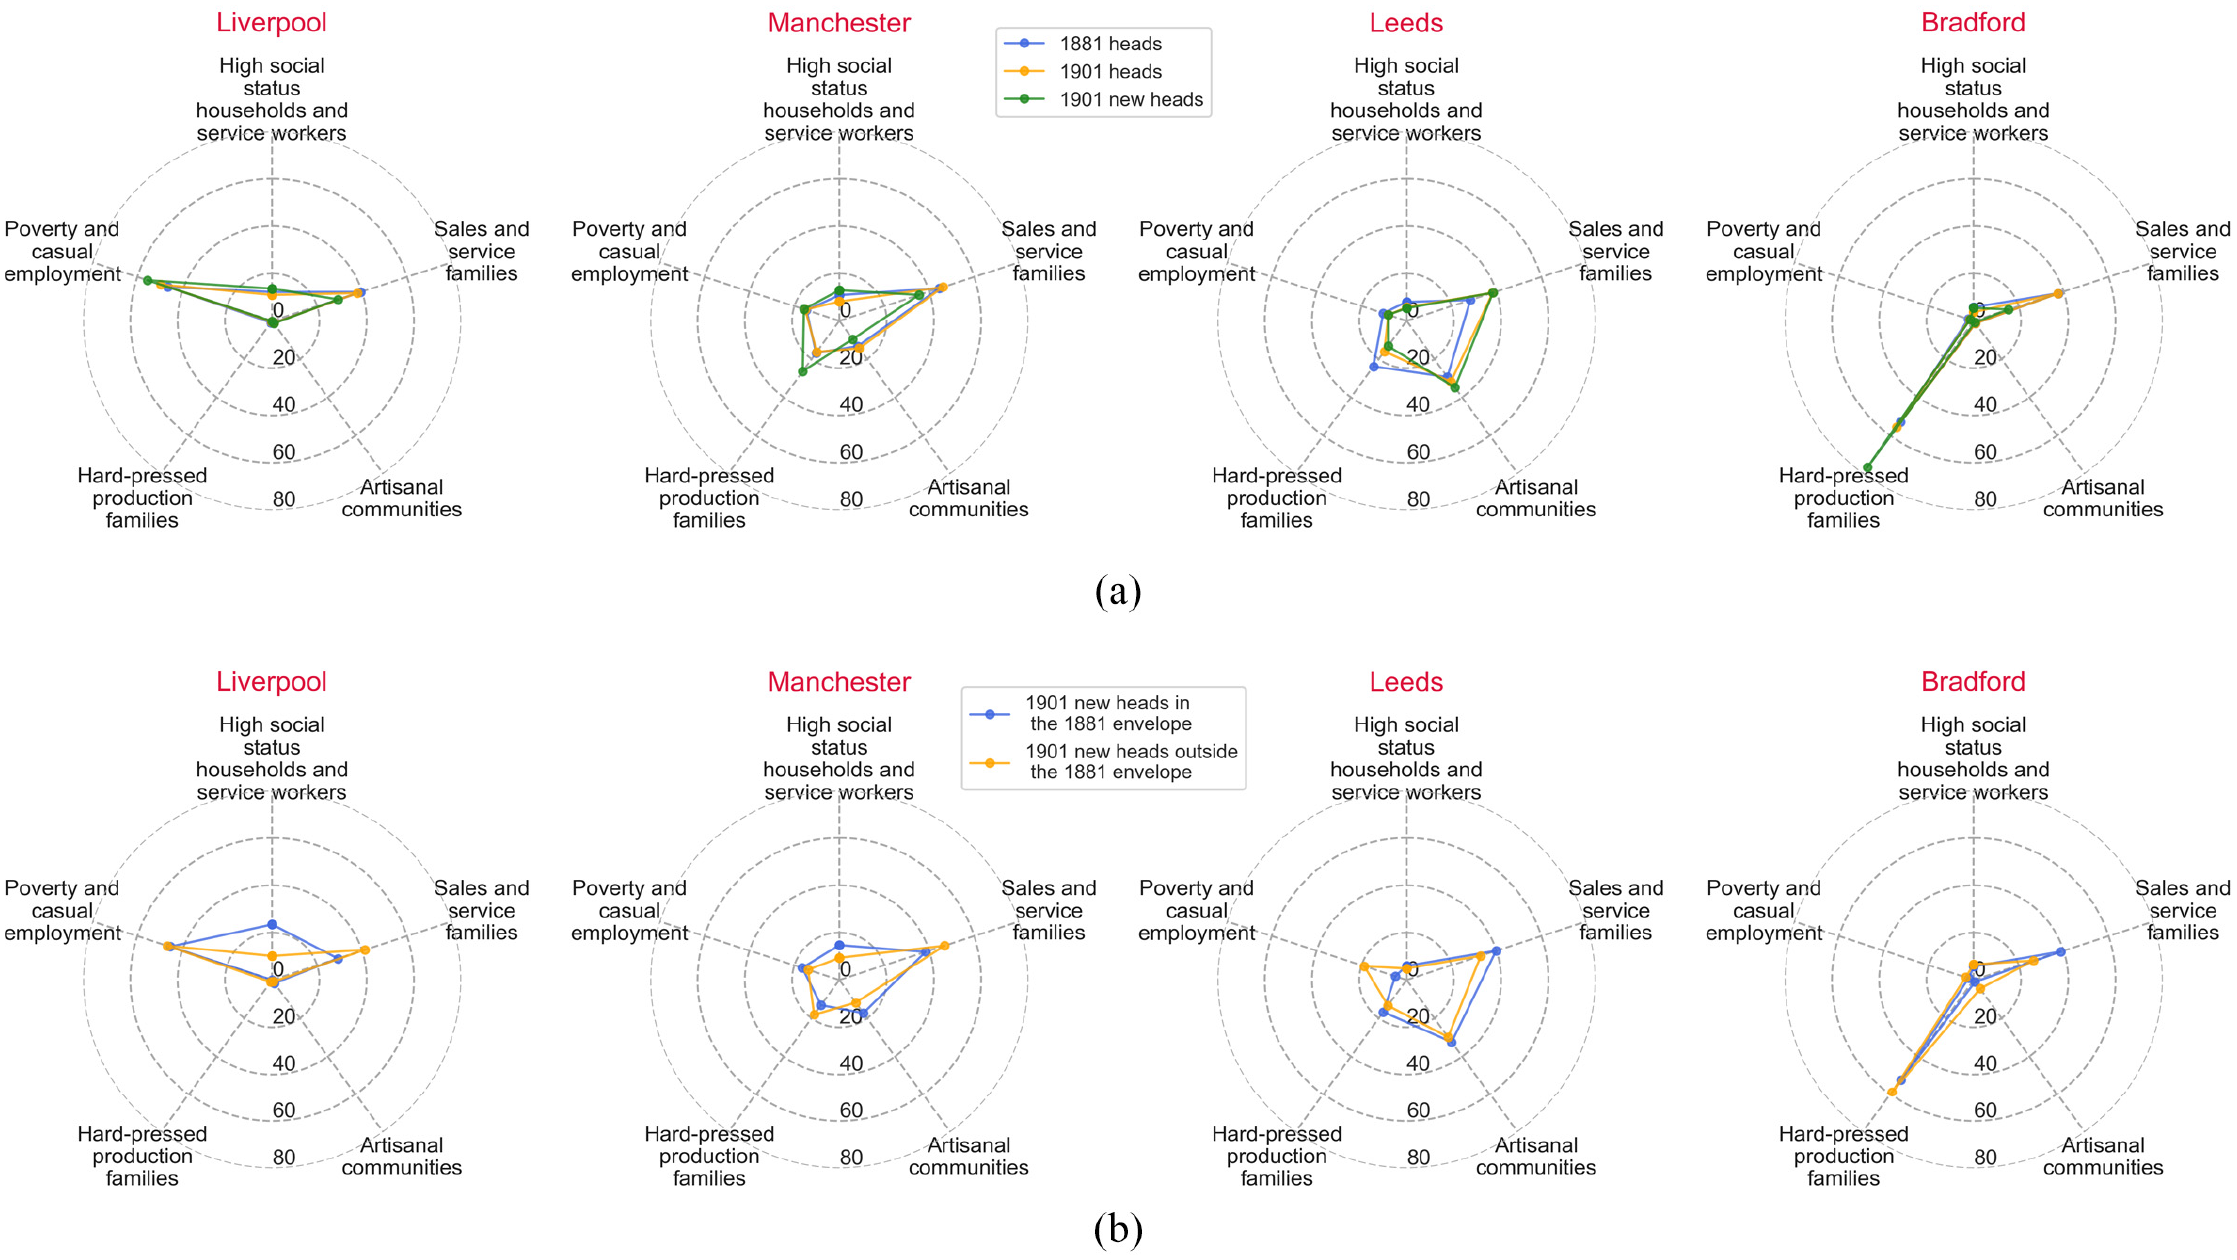
Illustrative radial plots of changes in the geodemographic structure of four cities, showing: (a) geodemographic breakdown of 1881 and 1901 resident household heads and of known arrivals over this period; (b) residential locations of households known to have moved to the settlements over the 1881–1901 period.
Changes in the positioning of the blue and yellow profiles suggest that Leeds offered better opportunity for households to transition from the Hard-Pressed to the Sales and Services or Artisanal groups. Both of these cities share very different profiles from that of Liverpool, where there is actually a relative decline in the Sales and Service group (that is growing right across Great Britain) while the Poverty and Casual Employment group continues to grow. The radial plot for Bradford shows its very different trajectory relative to adjacent Leeds, with few additions to the Sales and Service group and acceleration in levels of the Hard-Pressed Production group: High Social Status and Artisanal groups remain almost entirely absent from this settlement.
These are but four examples of theGB-wide benchmarking of changes in the settlement system that make it possible to compare local changes in urban structure that drive wider changes. The classification is consistent over the periods, and the retention of surnames as markers of geodemographic type allows for the comparison of the generational and inter-generational fortunes of different family groups in future periods, recent and historical, in order to gauge the consequences of migration and residential mobility. The analysis also allows GB-wide comparison of the differing degrees to which urban areas offer platforms for social mobility amongst established family groups.
In most cases, the share of poverty and casual workers declines over time, while the proportions of sales and service workers increase, confirming findings of previously observed secular employment trends in late Victorian society (Crouzet, 2013: 66; Shaw-Taylor and Wrigley, 2014). Settlement-specific changes may be observed against these trends: cities such as Bristol, London, Manchester and Edinburgh exhibit broad-based Group structures, in contrast with settlements such as Bradford, Halifax, Dundee, Blackburn and Stoke-on-Trent, which retain more polarised demographic structures. Emergent specialisation in artisanal occupations is observed in settlements such as Birmingham, while continued assimilation of impoverished and unskilled labour is identified in cities such as Liverpool.
The high precision of our georeferencing makes it possible for the first time to examine the manifestations of settlement specialisation within the GB-wide system in terms of residential structure and differentiation. Figure 4(b) presents corresponding radial plots that identify the degree to which more recent residents are accommodated within existing neighbourhoods or whether they reside in newly-developed parts of town or city structures. This is achieved by comparing the modal ‘recency of arrival’ of households resident in ‘core’ and ‘non-core’ areas of each settlement in 1901.
In all four settlements, recent additions to the High Social Status group are accommodated within the pre-existing envelope. Liverpool’s and Manchester’s development of new residential areas house new entrants to the Sales and Services group, unlike in Leeds or Bradford. Leeds is the only one of the selected areas in which new neighbourhoods are associated with the Poverty and Casual Employment group. These specific findings can also be put in a system-wide context. Higher proportions of low skilled or casual labourers in the Hard-Pressed Production or Poverty and Casual Employment groups are generally more likely to reside in pre-existing urban cores. In contrast, more professionals, service and artisanal workers are found in the new growth areas towards the edges of the growing urban areas.
However, as Figure 4(b) illustrates, exceptions can be identified and their common characteristics noted: for example, in several ports, specifically Liverpool, Birkenhead, Bristol, Brighton, Hull and Cardiff, the Poverty and Casual Employment group is more prevalent in newly developed areas. As with the changing mix of geodemographic Groups illustrated in Figure 4(a), this facilitates analysis of the fortunes of people and places within a consistently generalised representation of the GB-wide settlement system.
A GB-wide typology of migration and urban change
In addition to specific case studies or paired comparisons, the preceding disaggregated analysis of georeferenced data provides the foundations for a GB-wide classification of the composition and change dynamics of the settlement system of late Victorian Britain. Here we crystallise these patterns in a GB-wide typology of residential structure and neighbourhood outcomes that are grounded in the stocks and flows of households ascribed to the different geodemographic Groups described in the previous section for the 1881–1901 period (c.f. Briggs, 1993; Daunton, 2001; Dennis, 1984; Schürer and Penkova, 2015; Simon and Nardinelli, 1996; Smith et al., 2018; Swinney and Thomas, 2015).
We use Ward hierarchical clustering to group the geodemographic compositions of household heads known to be newly migrated to the 50 largest settlements during the period 1881–1901. The resulting dendrogram is shown in Figure 5(a), which we choose to truncate along the dashed line in order to produce a parsimonious five-Group classification. The composition of each Group is shown in Figure 5(b), where the stacked bars detail the numbers of ‘recently arrived’ households drawn from the five geodemographic Groups in each urban area.
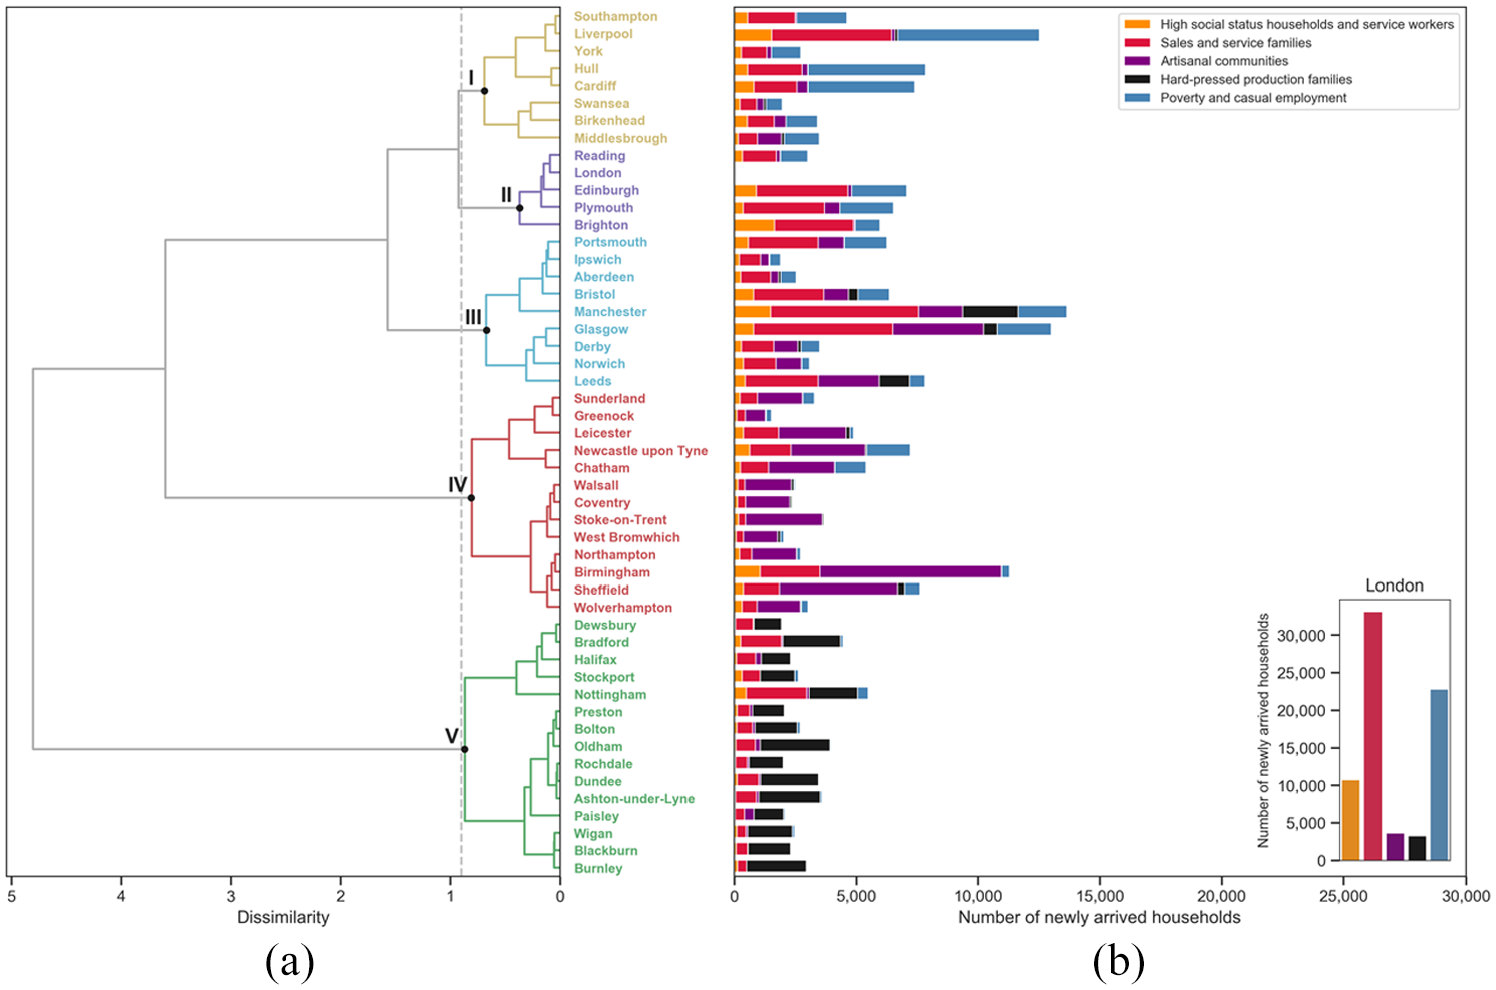
Ward clustering dendrogram of 50 urban settlements and associated numbers of ‘recently arrived’ household heads in each of the five urban geodemographic Groups.
With reference to the full set of radial plots from which Figure 5(b) was extracted, we characterise the resulting Groups as: Type (I) seaport and transport towns in which sustained increases in households in poverty and casual employment supported a less rapidly growing sales and service employment base, such as Liverpool, Cardiff and Hull; Type (II) administrative and commercial centres characterised by distinctive blends of casual, professional and service employment, such as Edinburgh and London; Type (III) emerging service centres such as Manchester, Leeds and Glasgow with a high ratio of sales and service families relative to households based in artisanal occupations; Type (IV) manufacturing towns founded upon artisanal occupations, occurring in some coastal towns and also throughout the Midlands; and Type (V) factory or mill towns in which manufacturing and other production predominates but substantial numbers of sales and service workers are also in evidence, as in Bradford and Dundee. The decision to truncate the dendrogram at five unequally sized classes is, of course, subjective.
The mixes of ‘newly arrived’ geodemographic Groups shown in Figure 5(b) provide very distinctive platforms for economic growth and adaptation to future changes in economic and social conditions relating to government, retailing, manufacturing, transportation, engineering or labouring. These place-specific changes in turn provide different milieux for economic and social mobility of new and long-standing residents. Figure 6 presents the residential footprints of the 50 settlements classified using this typology. Although the basic pattern of regional specialisation in this period is broadly understood, the compositions that underpin these assignments (Figure 5) and the radial plots (Figure 4) make it possible to better understand urban function in a regional context and to anticipate trajectories of individual settlements. The regional concentrations and radial plots together illustrate the social mobility opportunities available to residents across Great Britain.
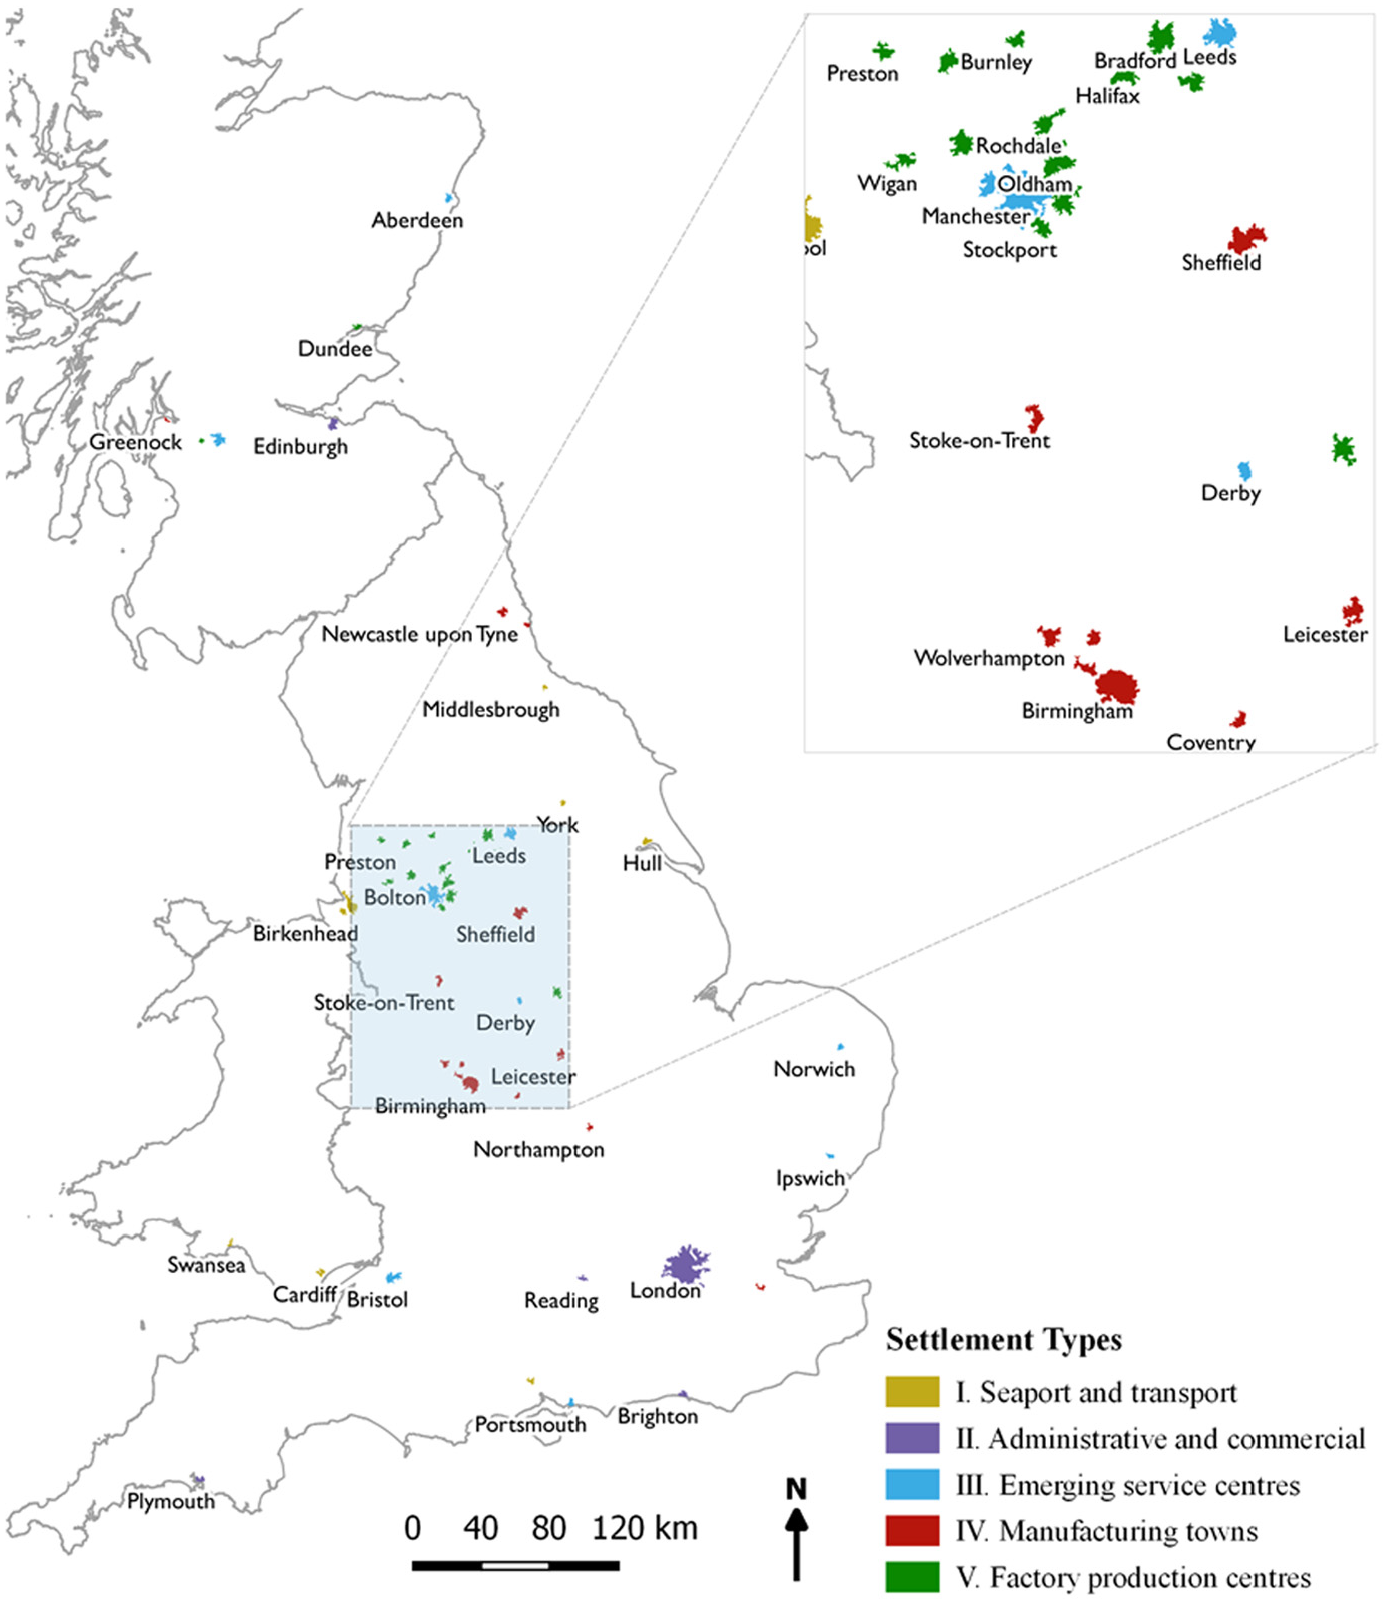
Footprints and functions of the 50 largest urban settlements in 1881.
As a further illustration of this linked analysis, Figure 7(a) and (b) revisit the rank-size distributions for the largest 50 of the 200 settlements in 1881 based upon the surname measure shown in Figure 1(d), with settlements colour-coded according to the outcome of the Ward clustering. While the five types of settlements are spread throughout the rank orders, administrative and commercial centres (Type II) such as London and Edinburgh are small in number yet concentrated amongst the largest settlements. By contrast, factory production centres (Type V) have a restricted size distribution concentrated in the lower part of the rank-size distribution. There are no such apparent restrictions upon the size range of seaport and transport centres, the functioning of which is more closely governed by international trade than by internal urban dynamics. Emergent service centres (Type IV) and manufacturing towns (Type V) occur throughout the size distribution.
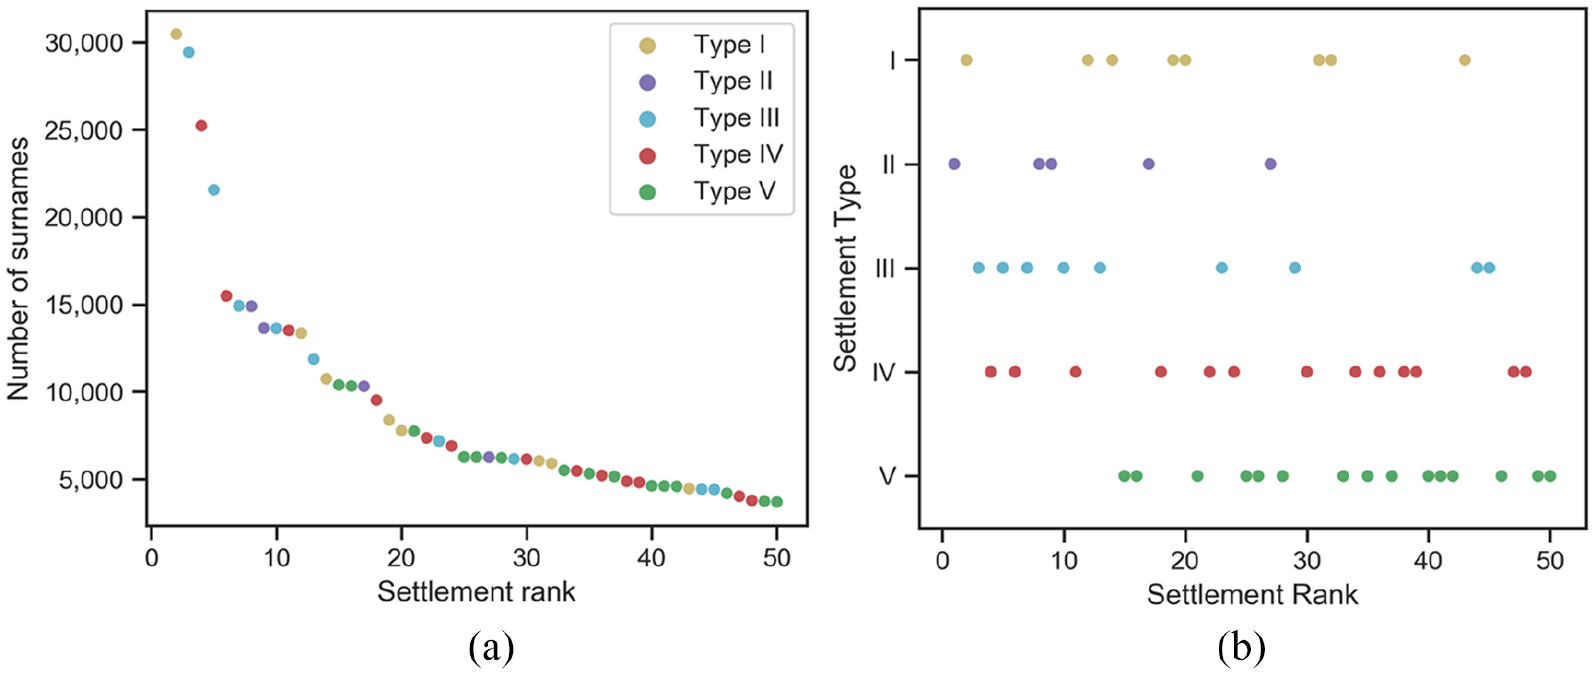
The rank-size distributions of the five types of urban settlements as defined by the number of surnames in 1901. London is excluded from 7(a) only in order to ease interpretation of the distribution.
Discussion and conclusion
Rank size distributions enable convenient aggregate summaries of the evolution of settlement hierarchies, and our analysis has developed and utilised a consistent and essentially scale-free basis to the measurement of the changing extents of British towns and cities. We have used these novel historical ‘framework’ data to implement the use of surname counts as a means of establishing size and rank within the British settlement hierarchy, and have demonstrated their consistency with conventional measures. An advantage of this novel measure is that the underpinning data retain the large majority of household migration ‘events’ that underpin much of the evolution of the rank-size distribution, and that georeferencing of these individual occurrences enables complementary micro analysis of the changing geodemographic compositions and residential structures of individual settlements. Linking location to the geodemographic street milieux in which both incomers and likely longer-term residents resided makes it possible not only to understand the skill sets brought by incomers relative to longer-term residents but also to compare the characteristics of new and established residential areas. Characterisation of neighbourhood dynamics using local mixes of long-settled and recently-arrived population groups also documents the trajectories that individual settlements follow within the changing settlement hierarchy.
This combination of locational analysis, onomastics and geodemographics across a full range of scales relates intra-urban social and residential structure to the development trajectories taken by different settlements. Together this makes it possible to envision rank-size analysis as a macro-state outcome of the kaleidoscope of social change at the micro level. As such, this provides a framework for investigating the attractiveness of different urban areas to migrants, the processes of social and economic change within them and a baseline for tracing inter-generational social mobility as evidenced by the patrilineal lines of different family groups. The relative size of migrant populations and the economic roles that they fulfilled compared with those of existing residents provides measures of the trajectories of each urban area, viewed in relation to existing and nascent functional specialisation. It is also instructive to view the spatial clustering of similar urban functions within and between urban areas, and the development trajectories that were to shape the evolution of the settlement system.
This research provides a fully georeferenced framework for a generalised understanding of how and why cities grow and how they change. It begins to link system-wide analysis of urbanisation to the literature on migration and residential differentiation by assessing the contribution of new residents to urban change. The roles that new migrants fulfilled in towns and cities complemented those of more established family groups and link residential differentiation to the evolution of the settlement system.
Although data availability restricts analysis to 1881 and 1901, omitting 1891, our analytical framework can be extended to other periods. The analysis reported in this paper lays important foundations for an improved understanding of how the subsequent evolution of the British settlement system has advanced (or held back) the life chances of the populations of different settlements. Economic historians have convincingly argued that inter-generational transmission of wealth and opportunity fundamentally creates and perpetuates inequalities (e.g. Clark and Cummins, 2018). Yet the analysis set out here creates a framework for establishing a contrarian position grounded in historical geography. Highly disaggregated measures of the composition and labour market function of established and newly-arrived populations make it possible to link micro-level representations of human capital formation with the collective social capital formation that characterises ‘smart’ cities. It is to the task of measuring the ways that different cities and regions shape inter-generational life chances that our future research will turn. In this endeavour, we will seek to relate the macro structures of urban growth and change to the micro geographies of opportunities to which different long-settled or migrant family groups are able to avail themselves.
Footnotes
Acknowledgements
Historical census data from the I-CeM (Integrated Census Microdata) project were licensed and provided by the UK Data Service.
Declaration of conflicting interests
The author(s) declared no potential conflicts of interest with respect to the research, authorship, and/or publication of this article.
Funding
This work was supported by the Engineering and Physical Sciences Research Council [EP/M023583/1]; Economic and Social Research Council [ES/L011840/1].