
Abstract
Convergence among regions to long-run, non-zero income differentials is predicted by mainstream and alternative spatial theories. A variety of convergence, considered by Sala-i-Martin, focuses on the rank order over time. As some must be growing faster than others, intra-distributional mobility implies convergence of regions. A measure of this from Boyle and McCarthy is the trend in rank concordance. As it is a measure of similarity between a given distribution and other sample periods, we propose that Kendall’s criterion ranking coefficient, combined with concordance, provides better insight into intra-distributional mobility and convergence. Agreement with a distribution can be traced over a series to highlight the mobility over time. This has the advantage of revealing whether mobility entails converging from, reverting to or converging to an order. Although there are phases of sigma-convergence and divergence, what is found in an analysis of regional house prices is that the rank-order is little affected by cycle phase. In trend, the UK price distribution appears to converge to a hierarchy, corresponding better with a very large monocentric urban model or Zipf-type, than a core–periphery-type distribution of prices. The broadening of price spreads is likely to be facilitated by the liberalisation of finance seen elsewhere, and by an appetite for greater mortgage debt.
Introduction
DiPasquale and Wheaton’s (1996) intra-urban house price model projects a stable price hierarchy based on distance to the central business district. At the regional level, multi-nodal hierarchical models, such as central place, posit the larger urban centre has size advantages which result in greater wage and house price levels. Mainstream urban economics’ equilibrating view is that competition for space leads toward the equalisation of utility: urban change is the result of spatial arbitraging among amenities, housing and wages. Dual economy models also project a levels distinction whereby core cities and regions are larger or more concentrated and have higher factor prices. House prices should correspond with the hierarchical nature of economic space.
Among the range of convergence concepts and measures, Sala-i-Martin (1996) emphasises intra-distributional mobility. In this tradition, Boyle and McCarthy (1997) advocate the use of the trend in Kendall’s rank concordance to reveal levels shuffling, or leapfrogging and, in conjunction with the trend in the coefficients of variation, to assess convergence. Adapting Boyle and McCarthy’s methodological innovation, this paper explores the contested terrain of slow regional house price dynamics. Some authors have posited that regional house prices converge into clubs.
The paper is constructed as follows. First, there is a review of price hierarchies and price growth. Next, there is an outline of various relevant concepts of convergence, followed by a consideration of house price convergence and divergence in the literature. A review of the methods and their applicability is undertaken. Two non-parametric techniques are applied to assess price intra-distributional stability. First, to assess intra-group price distributional mobility Kendall’s Measure of Agreement, which is similar to his measure of concordance, is used. Second, his Criterion Ranking coefficient is used to assess mobility relative to a given distribution (Siegel and Castellan, 1988: 281). As it can evaluate the degree to which a distribution corresponds with a prescribed one, it has more affinity with convergence than concordance measures.
The data discussion follows. The agreement coefficients are considered over eras of convergence and divergence revealed by the coefficients of variation. Although there are changes in the rank order what emerges is a highly stable price hierarchy, with what appears to be a more representative distribution at the end than at the beginning of the series. What persistent shuffling there is, is found among the lower-priced regions. The hierarchy found among the higher priced regions resembles a Zipf-type distribution but with a tail. As the groups are conjoined, perhaps the pattern is reflective of an extensive monocentric urban model.
Persistent but dynamic differentials
Although the prices of individual properties are diverse, with those, in general, closer to the central business district (CBD) commanding a greater price, based on their characteristics, DiPasquale and Wheaton (1996) aver that they vary over time in a stable hierarchy. The stability of relative prices is based on ‘spatial arbitrage’; prospective buyers refocus their house-search when affordability at one location is out of line with others.
The spatial general equilibrium framework (Roback, 1982) projects that higher wages and house prices reflect this greater productivity in cities. The presence of a low house price should reflect some combination of low nominal wages and disamenities, while cities with high house prices must be offering some compensating advantage – high nominal wages and/or some bundle of desirable amenities. Agents relocate within and between nodes to maximise their utility.
Central place theory implies that an urban hierarchy evolves, in part, because where services are provided to the local hinterland, there are minimum efficient scales that require demand thresholds for services to be met. Associated with this is Zipf’s law, which asserts that the probability that the size of a city is greater than some size S is proportional to the reciprocal of S. The rank-size rule, sister to Zipf’s law, states that the population size of a given city tends to be equal to the population of the largest city divided by the rank of the given city. Thus, a feature of the nodal region is that population centres are of a variety of sizes, implying that there should be a rank order of average house prices across urban areas. Giesen and Südekum (2011) find that Zipf’s law holds for the national distribution of city sizes but also for regions. Moreover, Partridge et al. (2009) find that, across a variety of densities of populations for both median earnings and housing costs, there are distance penalties. In general, distance from higher tiers in the urban hierarchy has a large penalty on earnings and prices.
A Thirlwall-type regional growth model predicts constrained growth; the periphery has its growth rate constrained by that of the core (McCombie, 1988). Because of the greater productivity and factor concentration, house prices should be higher in the core than the periphery. Quah (1996) argues that a dual economy is to be expected, with the middle-income group disappearing; regions clustering around high and low parts of the (income) distribution.
DiPasquale and Wheaton (1996) predict rapid movement to equilibrium differentials across space. Smith and Tesarek (1991) argue that there is an important distinction between high and low house price locations, which would lead to a convergence-divergence pattern. Stein (1995) posits that some of those who are credit-constrained are favoured by rising prices. As rising price enhances their property equity, buyers of more expensive housing are posited to be in a stronger position in the market to buy their next property. Sensitive to the vagaries of bank lending metrics, this equity enhancement is amplified by banks, fortifying the price rise generally, acting as a financial accelerator (Aoki et al., 2004). As such, price accelerates (decelerates) more in a boom (bust) period where the metrics are more generous (restrictive). However, no dissimilar growth is posited in the long run.
Convergent tendencies
García-Hiernaux et al. (2016) inter alia recognise a divide between methods for what is called ‘steady-state convergence’ and ‘catching-up convergence’. Based on neo-classical growth theory, absolute β-convergence refers to a process where a region with a relatively low average price experiences a faster growth rate than the average of the group of regions and the gap between it and more expensive regions is reduced; low-priced regions have a higher growth rate than high-priced ones. If all regions’ growth rates are related to the price gap, the beta-convergence implies the initial distribution is representative of the set until the differentials are small enough for the order to be shuffled by random growth shocks. Eventually, the law of one price (LOP) in a house price context would apply. This ‘law’, which draws heavily on arbitrage, implies that a common price results from relocating a good from the low- to the high-priced sites, squeezing out differentials.
Rather than common price, Engel and Rogers (2001) introduce the proportional law of one price (PLOP), where the ratio of prices of a good in locations i and j is stable over time. This is because the prices in i and j are roughly proportional or because the growth rates are nearly constant. Conditional convergence predicts this pattern if the regions have dissimilar steady-state levels. If they share a common driver to that equilibrium, a group of regions may approach a particular equilibrium. This produces club-convergence (Quah, 1996). However, these may diverge through time through the dispersion of (undefined) conditioning variables widening.
Alternatives to the neo-classical growth model proffer differing long-run structures. Sala-i-Martin (1996) shows, for example, that endogenous growth theory does not predict convergence. Quah (1996) sees convergence to a set of differentials. Consistent with this in spatial theory, such as core–periphery and central place, are persistent income and productivity differentials. Such models would imply that average regional house prices converge to persistent non-zero differentials. However, there are two clubs: core and periphery. Also, entailing convergence to, a Zipf-type distribution for regions would require a range of prices that follow a power distibution. The uneven size structure, Gabaix (1999) proposes, can be generated by a statistical process, characterised by the law of Gibrat.
Steady-state convergence could be reflected in a cointegrated regional system with a set of long-run constraints (price differentials) that restrict individual growth patterns to maintain common trends among the set in the long run. Here, the differentials should be small and transient. Busetti et al. (2006) use a series of stationarity tests of pairs of regional inflation and consumer prices series. They find the terminal size-order has superior properties when considering convergence in consumer price levels. However, the analysis of price trends and spreads, in a housing context, is complicated if not obscured by house price levels being structurally different, and growth being strongly cyclical but possibly stable. The Busetti et al. check-list is not tailored for divergence or large but stable variations.
Related literature
Both catch-up and steady-state views have been applied to clusters of regions. Beta-convergence has been applied to housing in the UK (inter alia Cook, 2012; Montagnoli and Nagayasu, 2015). Indeed, Montagnoli and Nagayasu (2015) reveal convergence clubs of ‘North’ (NW NO SC YH); ‘Midlands’ (WM EM WA); and ‘South’ (SE SW EA NI). (North – NO: North, NW: North West, SC: Scotland, YH: Yorkshire/Humberside; Midlands – EM, East Midlands; WA, Wales; WM, West Midlands; South – EA: East Anglia, SW: South West, SE: South East; NI: Northern Ireland.)
Many authors find house prices cointegrated. 1 Gray (2018), using the number of cointegrating vectors, tests the degree of integration among clubs similar to Montagnoli and Nagayasu’s, finding the North is more strongly integrated than the South.
Despite the results from multivariate cointegration, Abbott and De Vita (2013), applying a Pesaran pairwise approach, find that there is little evidence for convergence among UK regional house prices. Gallin (2006) finds that there is little evidence for cointegration of house prices and various fundamentals at the national and local levels. Zhang et al. (2016) finds that the logarithms of real house prices are trend stationary with structural breaks, so not cointegrated.
Wood et al. (2016) discuss beta-convergence and price shuffling across 108 submarkets of the Melbourne metropolitan area, in Australia. Plotting growth rates against median prices they generate a positive gradient. Their price time series covering 1990–2009 has peaks in 2007 and 1990 and a trough in 1996, much like the UK. However, rather than a 2007 collapse, there was a pause. Low-priced submarkets, because their rates of appreciation fall short of those at the upper end of the house price distribution, typically remain at the low end of the house price distribution. Among US states across 1975–1990 and 1990–2005, Clark and Coggin (2009) find two groupings, each associated with unobserved components. The low-priced regions grew more slowly across two subperiods, which, like in Melbourne, implies some stratification.
Smith and Tesarek’s (1991) work is suggestive of high house prices in Huston being more volatile, so having a more pronounced boom-bust cycle. Over the cycle large cities’ prices are consistently higher than the ‘pre-acceleration’ price level. Bogin et al. (2019) conclude that the growth acceleration is a signal of a permanent shift in a location’s economic fundamentals. In small cities, real price gains are not so clear.
Using cluster analysis among regional house medium-term price cycles, Gray (2019) finds the British regions can be arranged as a series of arcs around London. Comparing his results with Montagnoli and Nagayasu (2015) and Gray (2018) the South of Britain is more integrated as measured by cycle than by trend. The North is the reverse. The Midlands appear to be a bellwether of national house price activity and a conduit of price information between its two club neighbours, whilst London is distinctive.
Method
Sigma-convergence is a narrowing in the spread of prices from across locations at time t relative to time t−p so divergence implies a broader spread of prices. This says nothing about distributional mobility. Combined with sigma-convergence Boyle and McCarthy (1997), using two variations of Kendall’s W (coefficient of concordance), test for convergence by measuring the level of ‘disagreement’ in the orderings of k markets across T periods.
Here, sigma-convergence is considered with two measures of agreement. The first is Kendall’s u, which can be seen as an index of consistency of price ordering across paired years. The null hypothesis in the test is that the agreement in price order across paired years is by chance. Kendall’s u is defined as
where
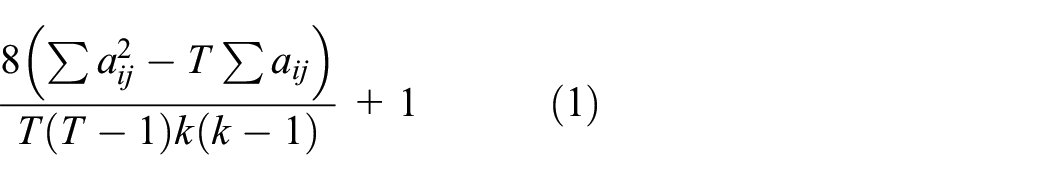
To convert to a concordance index,
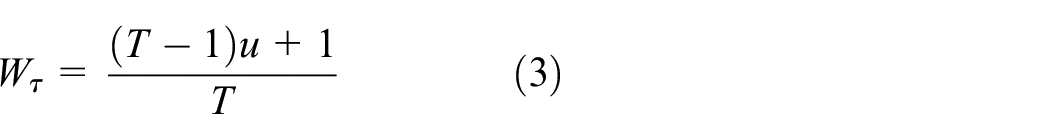
is used when T is even and
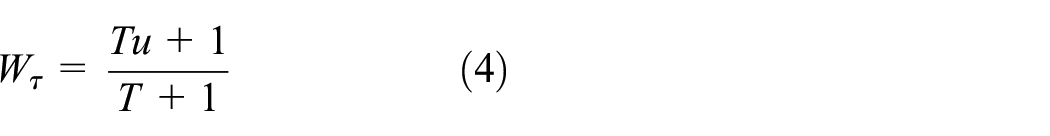
when it is odd. Kendall’s correlation coefficient, τ, reveals the difference between the probability that the observed data of two variables are in the same order versus the probability that the observed data are in a different order. Kendall’s Wτ is an average of τ-values and so can provide an index of distributional stability. Although their adapted concordance provides ‘a snapshot of ordinal ranking over particular interval’ (Boyle and McCarthy, 1997: 258), their pairwise approach is more in keeping with beta-convergence when covering benchmark and terminal periods only. A multiple period analysis combines the pairwise with the distributions in between, which, when containing temporary periods of divergence, could have a very different average concordance value to the pairwise.
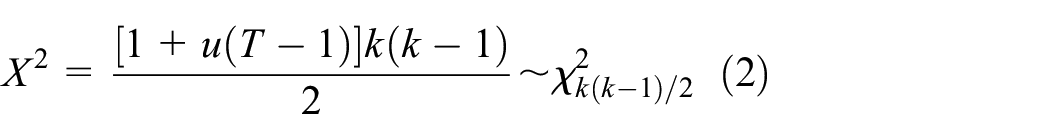
The second measure, Kendall’s criterion ranking coefficient, τC, is an average of τ-values between the expected and the actual rank orders (Siegel and Castellan, 1988: 281). Unlike the other two, the value
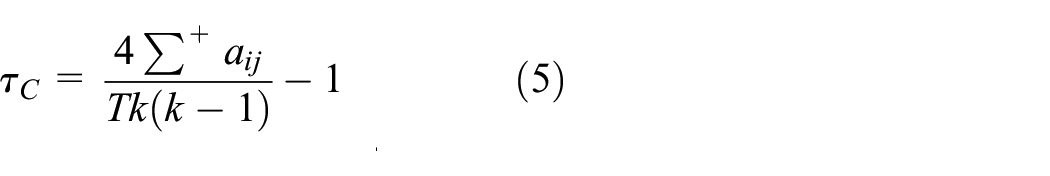
can range between −1 and 1.
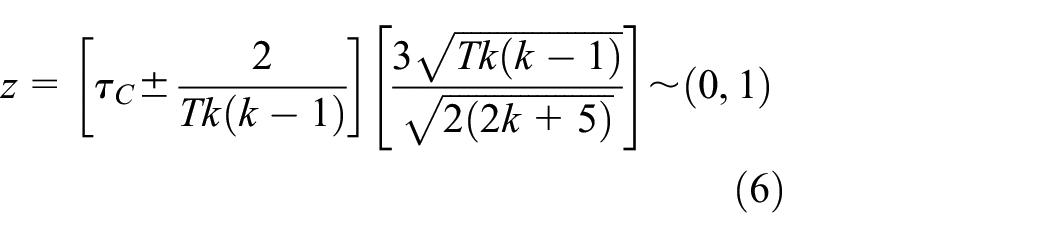
is for a one-tailed test, so the null is rejected when z > 1.645. The obverse is possible with the mean added and z < −1.645. The criterion ranking coefficient τC measures all against a given distribution. If the initial distribution is used, τC can provide an index of distributional mobility, or trace beta-convergence in the distributional sense over any snapshot, ignoring all other periods. To avoid confusion, Wτ will be referred to as the concordance coefficient and, as well as the criterion ranking coefficient, τC is also referred to as the coefficient of agreement (with a given distribution).
Convergence or divergence
As a framework, to distinguish between diverging, converging and converged price distributions we consider cross-sectional spreads as one dimension and distributional mobility as another. Sigma-convergence, divergence and sigma-stability can be put against immobility, constrained and full mobility in a 3 × 3 matrix of distributional convergence-divergence types.
It is proposed that a regional system has converged when there is no trend in the spread of the values. This can be seen in three forms or types. The spread and the rank order of prices are fixed; or the stable spread could be maintained but with persistent shuffling so that there is no stable order. The former type (1) displays no shuffling, so the coefficient of agreement remains at 1, and the latter type (2) features complete order-instability and the coefficient of agreement is zero throughout. Type 2 accords with De la Fuente’s (1997: 36) position that, because of random shocks, ‘we should observe a fluid distribution in which the relative positions … change rapidly’ when at steady state. Type 1 and 2 are logical extremes. In between, the general type 3 is ‘leapfrogging’. Leapfrogging could be seen as a slow version of De la Fuente’s fluid conditions. Although overall there is no drift in sigma, snapshots entail phases of convergence interspersed with divergence, much like a cycle.
A system is said to be converging to a steady-state when there is sigma-convergence. However, with type 4, differentials decline (relative-convergence/catch-up) but there is order-immobility. Agreement levels do not waver from unity. Type 5 is long-run version of convergence where, moving beyond type 4, prices converge on equality. With diminishing stability over time, type 6-convergence to stabilises at type 3, so as with type 5, as stable differentials are approached and random shocks are large relative to differentials, an obvious indicator of relative intra-distributional mobility is in the frequency with which the price order changes over subperiods. As the spread narrows, shuffling should be more evident and a descending degree of agreement towards zero. A distinction between types 2/5 and 3/6 is whether differentials are persistent in the long-term.
With sigma-divergence, extending (1), type 7 has expanding non-zero differentials, but agreement is always equal to unity. Type 8 entails the differentials arising from zero so that shuffling features over time decreasingly and so acquires type 7 characteristics eventually. Type 9 sees the periods or the extent of the divergent snapshots expanding. With the last three, there is an explosive system. With type 9, in this cyclic world it is challenging to establish whether there is a long-run state akin to type 6.
Traditional beta-convergence approaches assess the relevance of the initial period. For type 5, convergence agreement and concordance should trend to zero. Low agreement with high concordance implies internal consistency but the initial or benchmark distribution is a poor choice. If the initial structure is not the best representation of the set, it could be that the system is converging to a hierarchy. A key contribution from Quah (1996) entails a system moving towards a binary divide with middle level regions trending towards the extremes. During the transition phase, there is greater deviation from the mean, so movement to steady-state is associated with system sigma-divergence and decreasing agreement values. Corrado et al. (2005) note that even within the dual economy world, (sigma) convergence may follow divergence as centrifugal outweigh centripetal forces.
Stable non-zero differentials and a high degree of order stability are echoed in PLOP, a series of convergence clubs, a core–periphery divide or a Zipf-type hierarchy. These could result from constrained mobility, preserving a broad hierarchy, where shuffling is limited. Rather than convergence, a system could be reverting to an expected or known order, much like an error correction process. Convergence to the criterion distribution should render that coefficient to be relatively high. Indeed, frequent but temporary aberrations from that hierarchy could result in low concordance and high agreement. Using concordance alone could lead to an inference of convergence when in fact there is reversion.
Having provided alternative schemes, the thesis is that, rather than convergence to a narrower range of prices, possibly in clubs, house prices in Britain converge to a Zipf-type hierarchy, where dissimilarity increases with price level. This convergence is overlaid on strong cyclic motions. Rather than a boom-bust Smith and Tesarek-Stein-type cycle having no persistent effect on price, it is proposed that there is a widening spread in the long-run akin to Bogin-Wood ratchet of type 9 convergence-divergence mobility. This suggests Cook’s (2012) view of beta-convergence in the downswing is expected to be in spreads only and less evident over time.
Data
British regional house price data are drawn from the Nationwide Building Society’s website. These data are for all regional housing from 1973Q4 to 2019Q2. Average house prices are mix-adjusted and based on loan approval data. Price levels are analysed using natural logarithms, whilst growth rates are their quarterly differences.
As is shown in Table 1, rather than convergence, there is broadening of the distribution over the 45 years, which corresponds with higher growth rates among the higher price regions.
Price spreads.
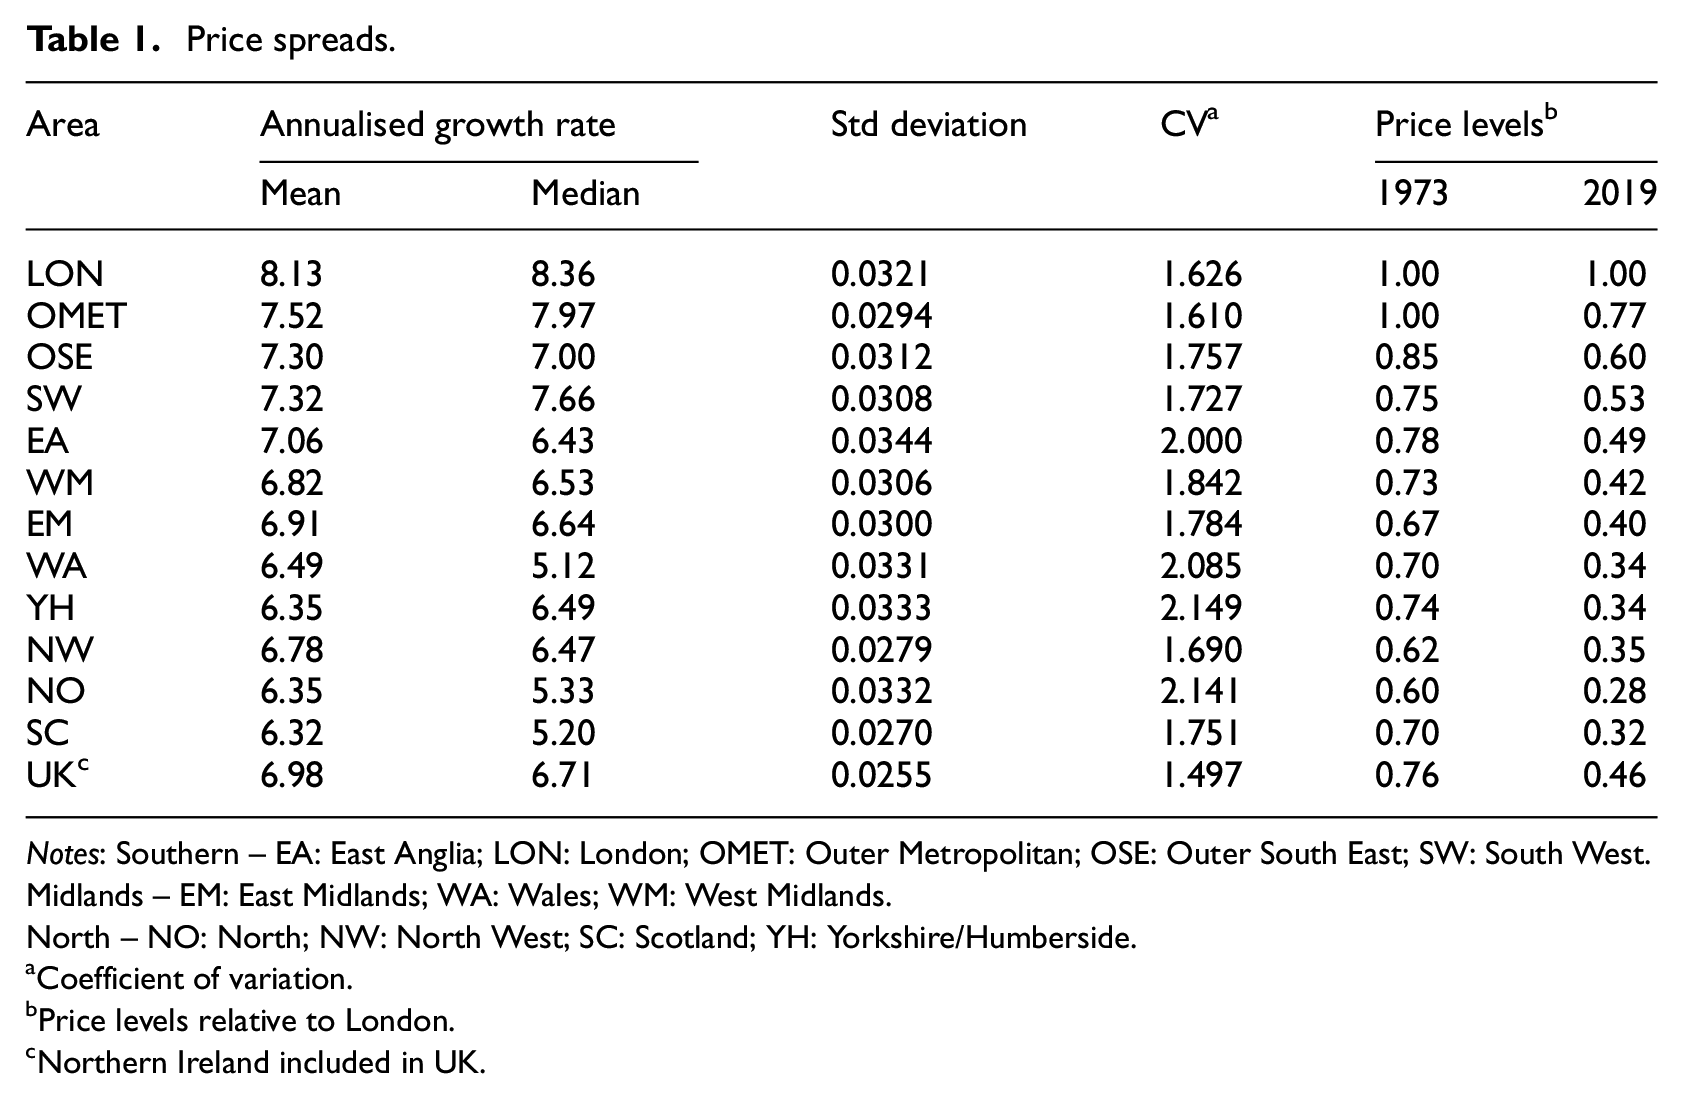
Notes: Southern – EA: East Anglia; LON: London; OMET: Outer Metropolitan; OSE: Outer South East; SW: South West.
Midlands – EM: East Midlands; WA: Wales; WM: West Midlands.
North – NO: North; NW: North West; SC: Scotland; YH: Yorkshire/Humberside.
Coefficient of variation.
Price levels relative to London.
Northern Ireland included in UK.
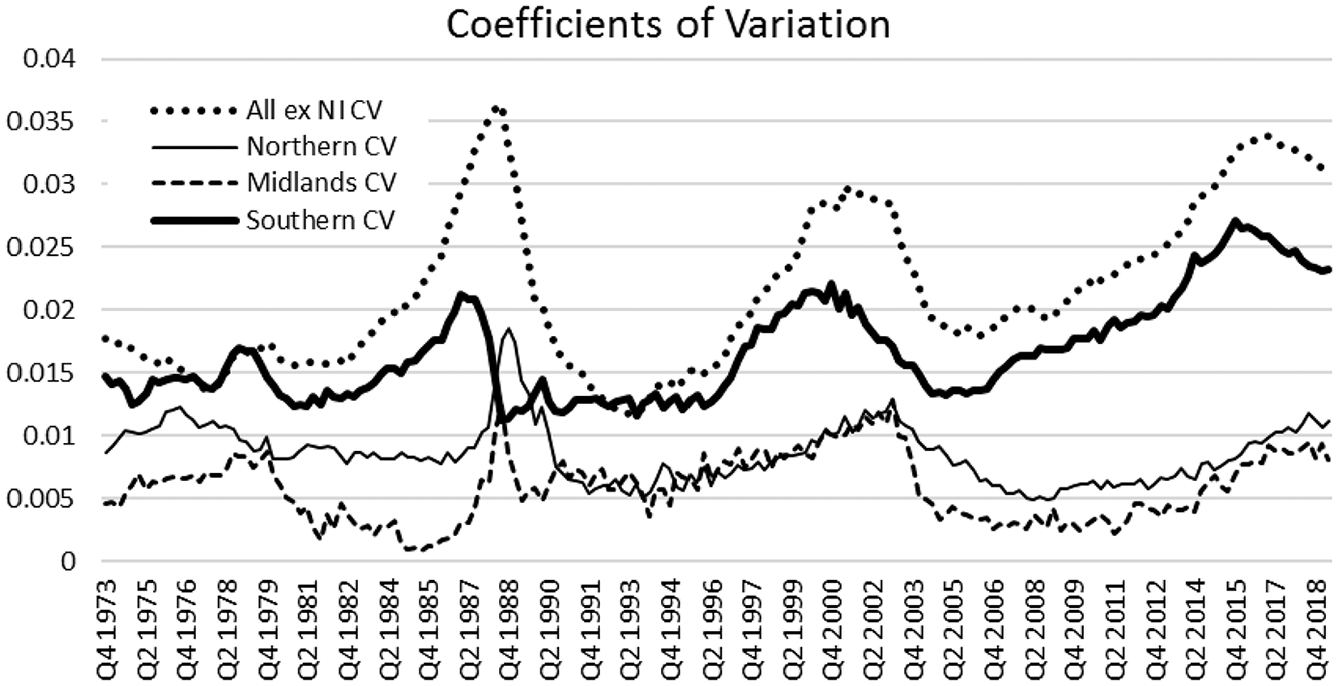
Coefficients of variation are displayed. The standard deviation of house price levels across the j members of each club is divided by the average of price levels to generate the coefficient. In Figure 1, there is what could be regarded as a standard national profile, with price peaks in the late 1980s and mid-2000s. We observe what could be viewed as a cycle, with sigma-divergence in the run up to a price peak and then, following that as Cook (2012) describes, convergence. However, the turning points (peaks 1988Q2, 2001Q2 and 2017Q1; troughs 1993Q2 and 2006Q2) are slightly different to growth inflection points (1989Q3 and 2007Q4; 1996Q2) in Bracke (2013) or in Cook (2012).
Coefficients of variation.
This is supplemented by ‘club’ patterns. A narrowing of the national spread (sigma-convergence) would follow from intra- as well as inter-club convergence. Omitting Northern Ireland, combining Montagnoli and Nagayasu’s (2015) ‘North’ (NW, NO, SC, YH) and ‘Midlands’ (WM, EM, WA) into Northern, which are grouped in Gray (2019), and the remainder into Southern, the intra-Southern club pattern with three protuberances in Figure 1 has the scars of house price bubbles. After 2006, there seems to be a widening of the spread. The Northern club’s coefficients of variation suggest relative internal stability. The coefficients are no larger at the end than the beginning and, even during two bubble eras, the spread does not alter by much: the 1980s upswing does not affect Northern until the very end.
Inter-club variations are important in explaining the national divergence in the 1980s and 2000s. However, the post-2009 deviation, which appears to be a Southern intra-club phenomenon, is consistent with London’s prices dislocating from the rest.
Distributional mobility
The degree of distributional mobility is assessed over the 45 years assuming benchmarks of the beginning (τC (I)) and the end (τC (T)) of the sample. Table 2 reports that switching from the initial to terminal structures does not affect the average levels of agreement (0.744 versus 0.780), intimating a stable order, throughout. These are similar to the concordance value (Wτ = 0.748). The coefficients of variation in Figure 1 indicate Northern has a lower level of price spread than the Southern club. This is reflected in more shuffling at the lower end of the price hierarchy in Table 2 (0.401 versus 0.851). Agreement with initial and terminal distribution for the Northern group is similar to concordance, at around 0.4. These low values are consistent with a shuffling among similarly priced, cointegrated regions, identified by Montagnoli and Nagayasu (2015) and Gray (2018) at the lower end of the hierarchy. However, Southern group concordance is around the mid-point of a broad range (0.695 < 0.901); too broad for a club?
Coefficients of agreement: over phases.
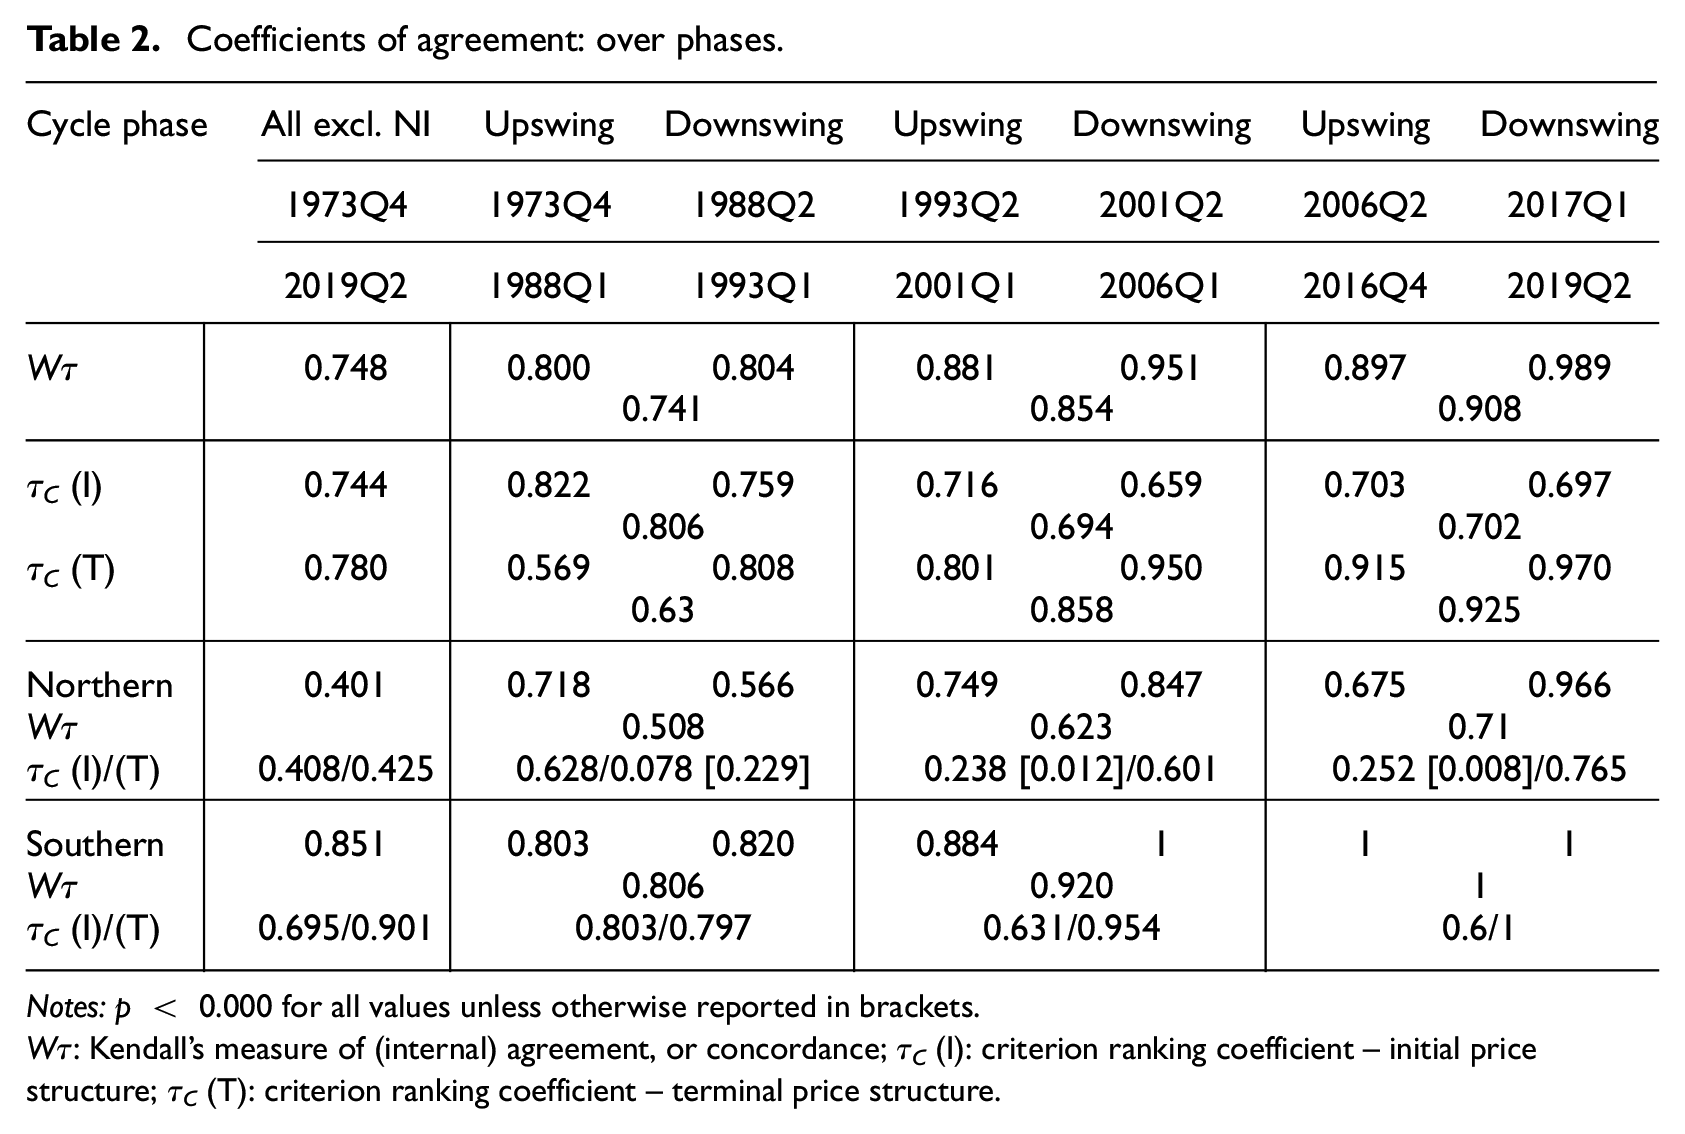
Notes: p < 0.000 for all values unless otherwise reported in brackets.
Wτ: Kendall’s measure of (internal) agreement, or concordance; τC (I): criterion ranking coefficient – initial price structure; τC (T): criterion ranking coefficient – terminal price structure.
Cyclic variations
Cook asserts that there is beta-convergence in the downswing. By construction, the periods in Table 2 feature expansion (sigma-divergence) or contraction in the range seen in Figure 1. Examining the first segment, 1973 to 1988, the upswing concordance (0.8) is mirrored in the downswing to 1993 (0.804). Despite sigma-divergence and convergence, concordance over the 1973–1993 trough-to-trough period (0.741) is only slightly lower than the two phases. The 1993 to 2006 trough-to-trough is characterised by greater internal agreement in the downswing. Over the full cycle, internal consistency is slightly greater than in the previous cycle, suggesting that the price hierarchy, over each phase, became more ossified.
Declining agreement values would signify convergence in a mobility sense. The three full cycle values (0.806, 0.694 and 0.702) point to the initial distribution becoming marginally less representative over time. Misalignment with the initial structure is greater in the downswing than in the up during all three cycles. Although the fall over the two full cycles is significant 2 it fails to decline persistently but quickly plateaus. The inference drawn here is that sigma-convergence and divergence is evident in Figure 1 but the degree of shuffling throughout is affected little by phase. What is interesting is the corresponding rise in τC (T). Rather than a descent towards random shuffling, after 1993 the terminal structure appears a better external guide to any price distribution.
The concordance values for the Southern group rise over every phase so that by the 2000s, the pricing structure in the south is fixed. For the Northern club, there is more shuffling in the downswing than in the up in the first cycle but this is reversed in the second. However, concordance values also appear to rise over time. Consistent with the narrative above, the initial distribution becomes less representative over time for both clubs and the terminal one becomes a better guide.
Timing and previous studies
Table 3 features periods used by other studies. As mentioned above, convergence results can be affected by the initial dates. From Figure 1, the spreads for the three study periods are about the same at the initial stages but end slightly more dispersed, so divergent in the sigma sense. These periods are (re-)examined using two price orders. The first, τC (I), are based on the initial structure at the start date for the relevant study. Second, labelled τC (E), entails the expected price order LON > OMET > OSE > SW > EA; WM > EM > WA; YH > NW> SC > NO which covers Southern, Midlands and the Northern four. As the regional clusters reflect Montagnoli and Nagayasu’s (2015) clubs, this will focus on convergence among convergence-club members in the mobility sense. It constitutes a Zipf-type ranking and it is anticipated that the British order converges to, or deviates temporarily from, this.
Coefficients of agreement: comparisons with other study periods.
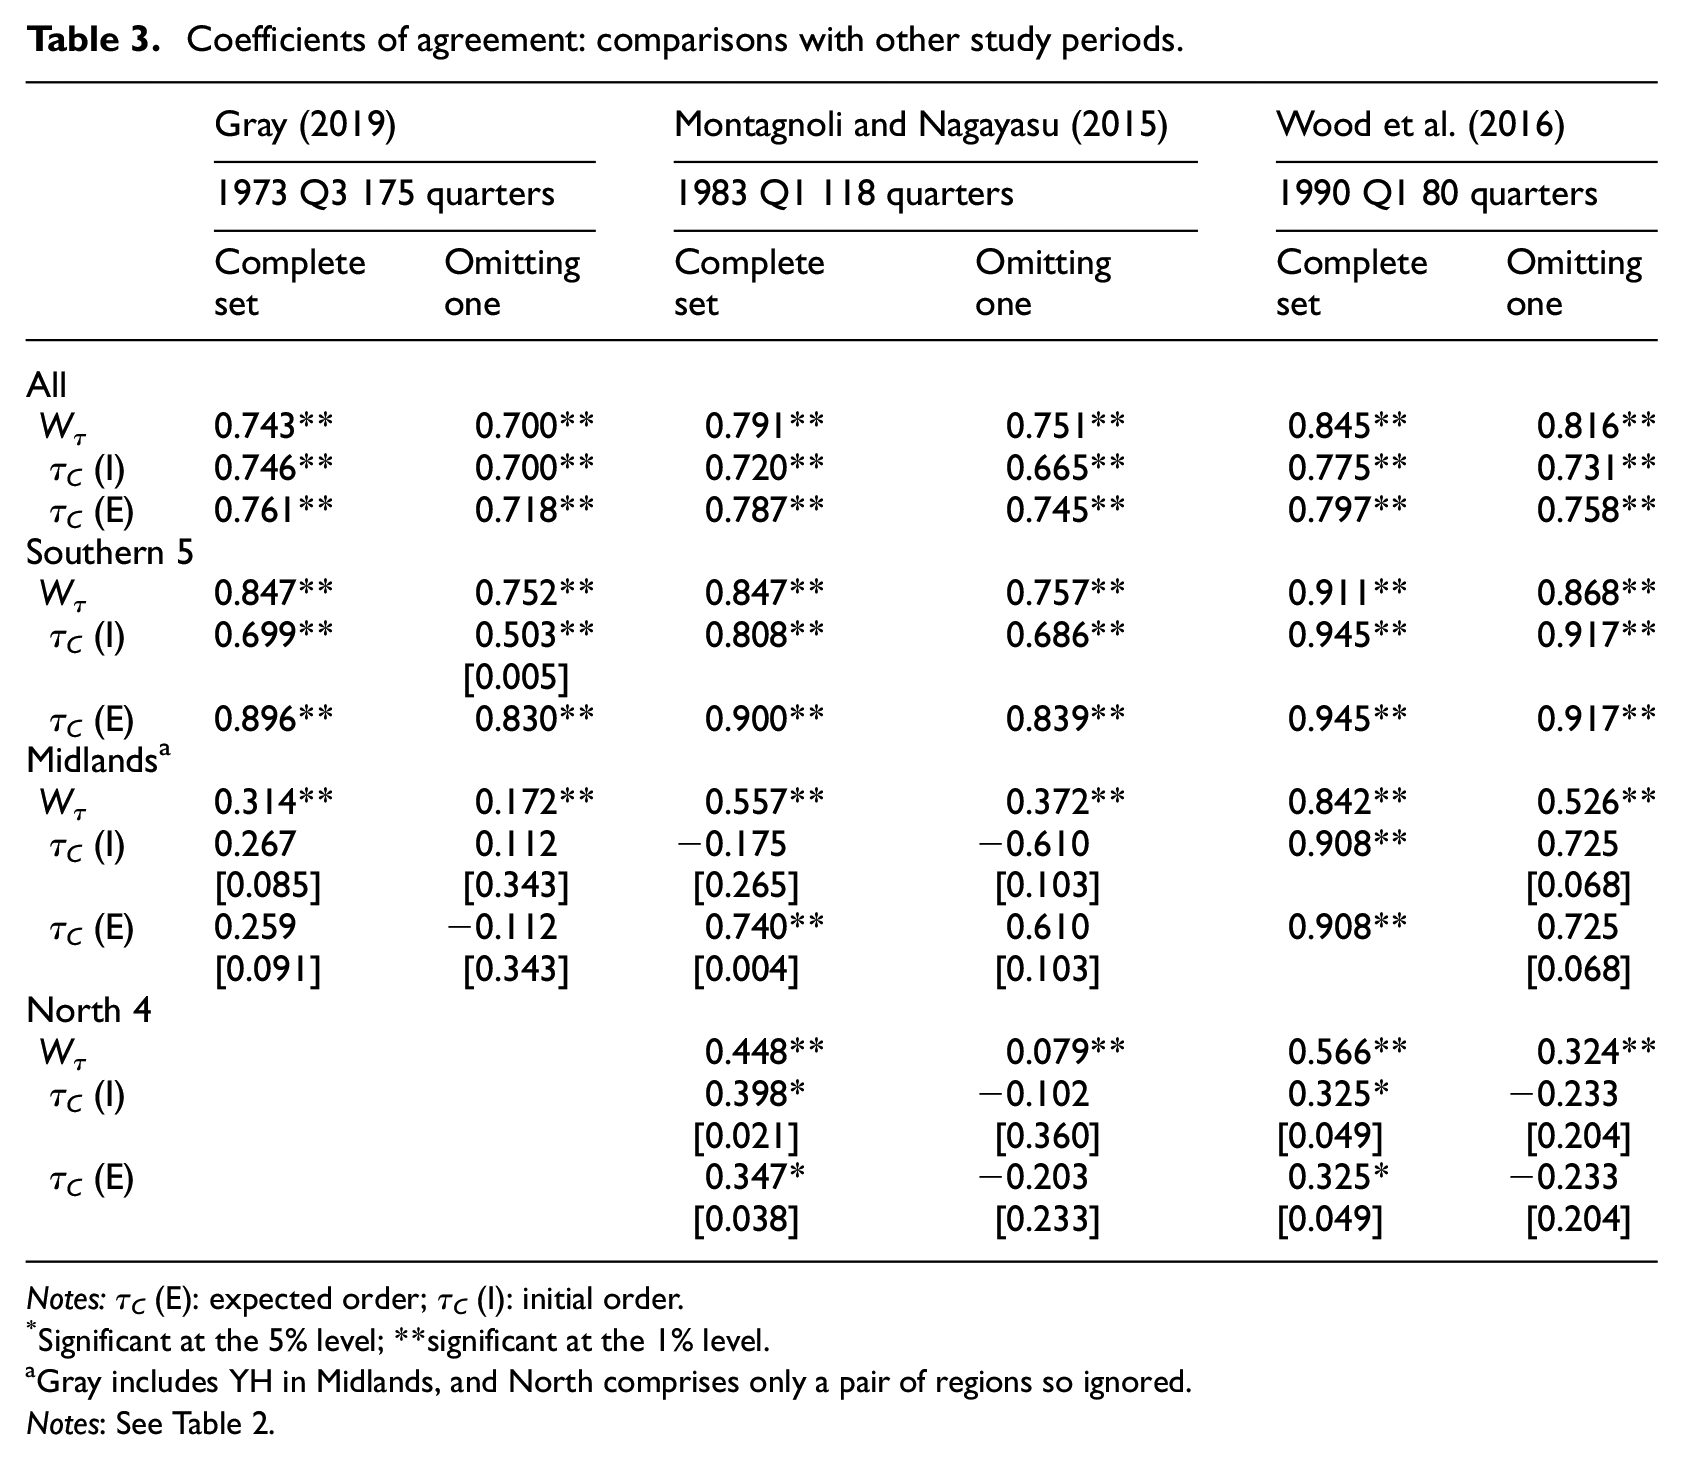
Notes: τC (E): expected order; τC (I): initial order.
Significant at the 5% level; **significant at the 1% level.
Gray includes YH in Midlands, and North comprises only a pair of regions so ignored.
Notes: See Table 2.
For the 12 UK regions considered, there is a decline in agreement with expected order with the length of period but this is marginal, whilst the initial distribution for both the UK12 and the Southern five has greater relevance with time. Tables 2 and 3 and Figure 1 suggest the former period has greater order-stability but sigma convergence. The latter has stable spreads and slightly lower order-stability. Order-stability and spreads increase post-1992. From 2006, the spread seems to undulate around a higher level, which reflects Gray’s (2018) observation that these undulations obscure a divergent trend. This divergence is associated with a better fit with the expected order (0.768 [0.000]). Rather than beta-convergence, this is more like order-reversion over a longer period.
The negative (but insignificant) value for the Midlands is an example of, relative to the initial structure, the order inverting, which could be associated with the collapse of the car industry in the West Midlands in the late 1970s, which would alter its relative standing in the immediate post-collapse period. Moreover, agreement with the expected order across the 118 or the 175 quarters is greater than for either initial dates, pointing to the expected order-reversion. Indeed, with a start date of 1990 (0.842) there is a stable internal order and even greater agreement values.
There is increasing internal concordance among the North4 as the study period shortens whilst the agreement values with both the initial and the expected distributions are broadly the same. It is not clear that there is convergence to or from a given order.
Testing clubs
Although inter-club variations, seen in Figure 1 and echoed in Table 2, are consistent with polarisation, a narrowing of club-spreads should be evident. As an example of Montagnoli and Nagayasu’s (2015) clubs, combined with the coefficients of variation, the North4 appear to have, at best, converged. The club-spreads waver little, which is reflected in the coefficients in Table 3.
The Midlands is similar to the North4 in spread variation. Agreement with the initial distribution, although low, does not imply increasing shuffling. Rather, for both, the concordance increases when analysed from 1990 onwards, suggesting the hierarchies are increasingly sclerotic. Gray’s Midlands has more shuffling, pointing to a superior delineation of the cluster.
With the Southern club, the spreads expand over time so that the coefficients of variation point to divergence. Agreement with the expected and terminal distributions are greater than with the initial, with concordance slightly lower. Again, values for the 80-period study are highest. These are not characteristics of a group of converging regions.
Montagnoli and Nagayasu omit London from their clubs. A further set of results in Table 3 can be viewed, such as Cronbach’s α; reported agreement values are the minimum attained as a result of deleting a region from a club. Three regions emerge as distinct. Rather than London, omitting Outer South East from Southern 5 or from the full set; the West Midlands from the Midlands; or the North from the North4 lowers agreement values the most.
Implications
Quah’s (1996) polarisation thesis implies the Midlands converges with, or is absorbed into, the Northern or Southern groups. This (club-)convergence would imply order-disruption as integration takes place of type 5 mobility. What emerges is a tail issue; regions that never engage in much shuffling, such that the cluster could be classified as type 4. A case in point is Northern. If defined as in Table 1 but omitting West Midlands and North over the full period, the comparable coefficients 3 are far smaller. Northern is a group with type 3 mobility, topped and tailed by a generally expensive West Midlands and an inexpensive North. Although this reveals a more compact group in the shuffling sense, its topography does leave a ‘reverse η-shaped’ cluster.
The Outer South East is the most interesting result. It implies that there is shuffling above and below it, but it does not shuffle with the others. One might posit that it is a ‘transition’ region, sat between higher and lower-priced regions, implying that there are three Southern subsets: Inner South = (LON OMET); Outer South = (SW EA); and Intermediate South (OSE). This subdivides Gray’s (2019) Outer South.
Gray (2019) proposes that the monocentric urban model provides a framework for envisioning regional housing clusters in Britain. His clusters form a series of concentric arcs around London. Subdividing the Southern group into three would chime with this. The distinctive West Midlands fits the arc–price gradient thesis also. One could envisage a conduit of price information cascading down a contiguous set of regions from OMET to OSE to WM to northern and western regions.
The stable order among regions closer to London and the greater distributional mobility towards the north and west of Britain appears consistent with convergence to a Zipf-type hierarchy. Values for the North4 imply more shuffling than elsewhere. The Midlands has prices in between the two other groups, with similar spreads to the North4. However, with the inclusion of the North and West Midlands, respectively, their stability values are inflated. Excluding these outliers leaves a combined Midlands and Northern with a rather narrow price range. Quah’s (1996) binary divide with middle level regions trending towards the extremes does not predict a distinctive Midlands region or a dislocated lower tail (North). The latter is inconsistent with a Zipf-type hierarchy. A different distribution of prices is needed than a bimodal or a Zipf pattern that reflects the tails and the hierarchical nature of prices.
Wood et al. (2016) see the price gradient with respect to distance from the Melbourne CBD as becoming steeper. A steepening price gradient would reduce shuffling. Rather than the Smith and Tesarek-Cook-Stein thesis that implies common regional growth trends over the price cycle, the widening gaps in Figure 1 and decreasing shuffling revealed in Table 2 correspond with a Bogin-Wood view that the high-priced regions of the Southern club exhibit wider internal spreads and dislocate from the low-priced regions – even within the group itself.
Hay (2009) argues that from the early 1990s, greater mortgage debt levels and the liberalisation of finance inflated UK prices propitiously. This would widen differentials in general. Gray (2018) sees the liberalisation of finance and the financial cycle as a key driver in price cycles. He sees that, as asset prices respond to Quantitative Easing, in the post-2008 era there will be weaker convergence among regions. Evidence for these propositions can be found in Figure 1 and Table 2, with growing spreads and stability particularly in the Southern group.
Conclusion
The aim of this paper is to propose that Kendall’s criterion ranking coefficient is a useful additional tool in the analysis of relative spatial slow price dynamics. To illustrate that, British regional house prices are analysed over ‘cycles’, subgroups and periods.
Three types of convergence are considered. With catching-up convergence, it is expected that there will be convergence from a short-run position to a long-run one where differentials among the regions are reduced. Quah (1996) sees convergence to a set of persistent non-zero differentials. Consistent with this in spatial theory, such as core–periphery and central place, are persistent income and productivity differentials. Steady-state convergence can be envisaged as a cointegrated regional system with a set of constraints (price differentials) that restrict individual growth patterns to maintain common trends in the long-run. Cointegration requires the transient deviations to be small. Steady state in house prices is likely to require a long view and a recognition of large fluctuations.
Traditional convergence approaches assess the relevance of the initial period, which could be arbitrary. The criterion ranking coefficient proffers agreement with the initial distribution that can be traced over a series to highlight mobility over time. Rather than just the initial structure, an alternative hierarchy should be selected to which the system could converge. Mismatches between the criterion coefficient and concordance also reveal whether internal order stability is consistent with expectations.
Inferences about distributional cycles and trends are made. Shuffling is little affected by price cycle phase, as such convergence in the downswing is in sigma-convergence only. When an expected structure, reflecting south, midlands and north price order, is used with periods reflecting other works, the criterion ranking coefficient shows, over subperiods, how resilient a ‘north–south’ divide is. In trend, casting doubt on some convergence clubs, after 2000, there is a persistent hierarchy across the south and midlands that is more likely to reflect divergent tendencies, particularly at the top end. What is found is that, although the price distribution decreasingly mirrors the initial period’s, rather than becoming unimportant, reflecting the terminal distribution better, a hierarchy becomes more ossified. The house price distribution appears to converge to a hierarchy, corresponding better with a very large monocentric urban model or Zipf-type distribution but with a dislocated tail, than a core–periphery divide. The broadening of price spreads is likely to be facilitated by the liberalisation of finance seen elsewhere, and by an appetite holding for greater mortgage debt.
Footnotes
Declaration of conflicting interests
The author declared no potential conflicts of interest with respect to the research, authorship, and/or publication of this article.
Funding
The author received no financial support for the research, authorship, and/or publication of this article.