
Abstract
Although there are numerous reasons for real estate analysts to construct spatial housing submarkets, there is little clarity about how this might best be done in practice. The existing literature offers a variety of techniques including those based on principal components analysis, cluster analysis and a range of other statistical procedures. This paper asks whether, given their market expertise and their role in disseminating information, shaping search patterns and informing bid formation, real estate agents might offer an effective but less data intensive method of submarket construction. The empirical research is based on an experiment that compares the predictive of different sets of submarket boundaries constructed by using either standard statistical methods or through consultation with real estate agents and other market analysts. The analysis draws on housing transactions data from Istanbul, Turkey. While the results do not demonstrate the outright superiority of any single method, they do suggest that expert-defined boundaries tend to perform at least as well as alternative construction techniques. Importantly, the results suggest that agent-based methods for delineating submarket boundaries might be used with a degree of confidence by real estate analysts and planners in market contexts where rich micro-datasets are not readily available. This has been one of the constraints internationally on wider adoption of submarket boundaries as an analytical tool.
Introduction
Housing market dynamics have a significant impact on the regeneration of neighbourhoods, local and regional development and the stability of national and international economic systems. The structure and operation of the market can dictate who is able to access housing, how property values impact on the distribution of wealth and, as such, are a major driver of social and spatial segregation (Bolt et al., 2010). Yet, while macro-scale analyses of housing market dynamics have been the subject of considerable recent methodological innovation and have made a prominent contribution to policy debates globally, our understanding of the micro-foundations of the market is less well developed, less coherent and has been less prominent in shaping policy and practice.
This has begun to change. Advancements in quantitative research methods and the increased availability of ‘big data’– including large micro-datasets that contain geo-coded details of dwellings, their characteristics and values – have contributed to what Smith and Munro (2008) describe as the ‘microstructural turn’ in housing analysis and have given renewed impetus to conceptual and methodological debate about local market dynamics.
At the heart of much of the research on the structure and operation of the local housing market is the notion that, in order to effectively understand the workings of the highly complex and spatially heterogeneous system, analysts should delineate their study areas into economically meaningful, disaggregated units known as submarkets. It is argued that there are three major benefits to sub-dividing urban housing markets into submarkets. First, it has been shown that statistical models will exhibit greater predictive accuracy if housing units have been assigned to submarkets as a prior step in the estimation procedure (Adair et al., 1996). Second, as Galster (1996) explains, submarkets offer a useful framework for policy makers and planners to explore dynamic change in the housing system. Third, an understanding of submarket structures can help improve the decision making of a variety of real estate market actors. Specifically, this can assist housing consumers to understand and minimise search costs (Rae, 2015); can aid realtors in the marketing of properties for sale (Palm, 1978); and can improve the reliability of attempts by lenders and investors to price risk (Peng and Thibodeau, 2013).
This resurgence in interest in the use of submarkets has, however, seen two long-standing challenges resurface. First, there remains a need to develop a clear conceptual basis for submarkets (Watkins, 2001). Second, even when the theoretical basis for submarket existence has been made clear, it is not at all obvious how we should operationalise the concept (Pryce, 2013).
It is the latter issue that provides the primary focal point for this paper. There are two broad viewpoints of interest. The first is that submarkets should be revealed by statistical analysis of empirical evidence. The alternative suggests that a less data-dependent option is to consult market experts such as real estate agents or valuers.
This qualitative approach is motivated by recognition that information flows might be important in shaping submarket dimensions and that market intermediaries play an important role in disseminating intelligence, informing search patterns and influencing the bidding strategies that can impact directly on the spatial pattern of house prices (Watkins, 2008). This also places agents in a position to be able to effectively reveal submarket boundaries (Michaels and Smith, 1990). The use of agents is potentially appealing in many of the global market contexts where data are limited.
Specifically the paper explores the relative merits of submarket boundaries defined by ‘experts’– agents, valuers and market analysts – when compared with submarkets constructed using statistical methods. In the interests of simplicity, and in line with the majority of empirical studies, the analysis is restricted to the consideration of spatial submarkets only.
The paper has four further sections. The next section reviews the conceptual basis for submarkets and considers the way in which submarket boundaries have been determined in practice. The following section describes the data and research methods used. We then summarise our findings, before concluding with some reflections on the extent to which expert generated definitions might offer a viable short cut for real estate practitioners and policy makers interested in using submarkets in market contexts where data constraints exist.
Housing submarket analysis
Theorising submarket existence
Although the primary focus of this paper is the methods used to identify submarkets in practice, it is important to recognise that the approach used ought to be informed by theory. As Watkins (2012) notes, despite widespread acknowledgement that submarkets exist and are analytically useful, one of the main reasons they have not been used more widely is the absence of a clear conceptual basis for their existence.
The earliest contributions to the submarket were made by researchers who sought to reveal filtering processes (Fisher and Winnick, 1952; Grigsby, 1963). These analysts were trained in the institutional economic tradition and recognised the heterogeneity of housing choice and the importance of neighbourhoods (Galster, 1996). They suggested that submarkets arise as a result of the co-existence of heterogeneity in consumer preferences and a highly variegated housing stock. They introduced the idea that the way that segmented demand interacts with the differentiated stock gives rise to submarkets that exhibit variations in the prices paid for similar properties. In these circumstances, rising demand for dwellings in certain submarkets will, in the absence of appealing substitutes, lead to submarket-specific price inflation. These analysts implied that the existence of submarkets is the product of market disequilibrium and the failure of the market to adjust through space and time. Thus, contrary to mainstream urban economic theory, the implication is that consumers exhibit high levels of neighbourhood attachment and this introduces inertia into the system limiting the extent to which an efficient sorting process might occur.
Persistent disequilibrium does not feature very prominently in subsequent contributions to the literature. Since the 1960s most studies have tended to proceed on the basis that there is a unitary housing market where the ‘law of one price’ holds. The market is thought to tend towards equilibrium, at least in the long run, with price differences viewed either as temporary phenomena or as evidence of multiple equilibria.
In a system of multiple equilibria, within each submarket, constant-quality house prices tend towards equality. The dwellings that comprise each submarket represent relatively close substitutes when considered by potential consumers (Grigsby, 1963; Pryce, 2013). There will, however, be significant differences in the prices observed for similar dwellings between submarkets. Thus, the challenge when identifying theoretically consistent submarkets is twofold: first, the analyst must be able to identify constant quality house prices; second, they must be able to identify any breaks or cleavages in the constant quality house price surface. In practice, however, this is made difficult by the inherent heterogeneity of the product and the way in which values reflect not just physical attributes but also interactions with neighbourhood characteristics.
Theory into practice
The ‘standard’ approach to identifying submarkets involves three broad steps (Watkins, 2012). First, the data are partitioned to delineate potential submarkets. Second, house price (mainly hedonic) modelling techniques are used to determine the price of standardised dwellings. Third, statistical techniques, including F-tests and Tiao-Goldberger tests, are used to determine whether significant differences exist between the submarket-specific standardised price estimates (Watkins, 2001).
There has been considerable variation in the ways in which data are partitioned in the initial stage of this procedure. The lack of consistency in approach is partly a reflection of the complex array of factors that potentially give shape to submarkets. These include interest in the information flows and search patterns (Rae, 2015) that might give rise to what Clapp and Wang (2006) call ‘soft boundaries’; land use planning and regeneration policies that alter supply and reconfigure demand side behaviours (Jones et al., 2005); and administrative boundaries including school catchment areas or tax districts that form ‘hard boundaries’. The influence of these different factors is often simultaneous but the effects are rarely spatially coterminous. Researchers use either prior knowledge or data to address this challenge.
The earliest approaches tended to largely rely on prior knowledge about the market as a means of clustering existing administrative geographic units such as census tracts, electoral districts or postal districts (Ball and Kirwan, 1977; Schnare and Struyk 1976). These methods have now generally been supplanted within the literature by a vast array of increasingly sophisticated empirically determined boundaries (see Tu et al., 2007). In the interests of brevity, however, we do not seek to explore all of the alternatives proposed in the literature. Rather, we focus on three of the most common ‘types’ of approach used: the hierarchical model (partially based on prior knowledge); the use of Principal Components and cluster analysis; and expert-based methods.
The hierarchical approach
In a highly influential paper, Goodman (1981) posited that submarkets should exhibit: simplicity, where fewer are better; similarity, in that there should be a high degree of homogeneity; and compactness, implying that contiguity is desirable. These criteria were applied to data from New Haven, and submarkets were determined on the basis of statistical analysis of covariance. The analysis shows that the implicit prices of neighbourhood characteristics vary spatially. This provided the basis for what is often referred to as the hierarchical approach to defining submarkets. The approach combines properties and neighbourhoods into clusters using a combination of researcher judgement and empirical results.
Goodman and Thibodeau (1998, 2003, 2007) subsequently undertook a range of experiments on various different sets of submarkets configured using this approach and based on data from Dallas, Texas. Their hierarchical approach involves identifying spatial submarket areas using data on housing transactions augmented with information on the performance of public elementary schools. The rationale for the model is that all dwellings share the amenities available within their locality. The determinants of house prices are nested within multiple geographies: properties are located within neighbourhoods, neighbourhoods within school districts and school catchment areas within municipal boundaries. The results reported suggest that, on the basis of application to a single school district, submarket dimensions reflect differences in the school quality (Goodman and Thibodeau, 1998).
The approach was later applied in a paper that used 28,000 single-family homes in the wider county area (Goodman and Thibodeau, 2003). They examined the predictive accuracy of two different submarket specifications: one based on contiguous census tracts and the other based on aggregated zip code areas. The results show that greater disaggregation in submarket construction delivers significant improvements in the accuracy of hedonic estimates.
The main criticism of this hierarchical method is that, although more sophisticated technically and more grounded in empirics than the earliest approaches, this method still retains a reliance on a priori knowledge to choose the most appropriate administrative boundaries. There is a clear rationale for Goodman and Thibodeau’s use of school boundaries but they might plausibly have chosen alternative administrative units constructed for other purposes.
Principal Components Analysis (PCA) and cluster analysis methods
Elsewhere, numerous researchers have sought to use methods that allow the data to determine submarkets. For instance, Dale-Johnson (1982), in his study of transactions information supplied by agents in Santa Clara, used Q-type factor analysis to partition the data. This method, which differs from the more common R-type PCA, was employed to extract five factors from 13 variables. These results were used to assign the data to 10 mutually exclusive submarkets. When compared to a market-wide hedonic model, the submarket configuration yielded a substantial reduction in standard error of the house price estimates.
This method has been developed by others as a means of identifying spatial submarkets. Bourassa et al. (1999) employ standard R-type PCA and K-means cluster analysis sequentially to segment the housing markets in Sydney and Melbourne. Arguably this overcomes the reliance of the hierarchical methods on researcher judgement by allowing the data to determine the neighbourhood groupings. The factor scores were entered into the cluster analysis to define a set of relatively homogenous submarkets. The submarket formulation was shown to outperform standard hedonic equations by significantly reducing the standard error.
The robustness of this approach was tested in subsequent research. Using data from Auckland, Bourassa et al. (2003) compare the performance of a set of submarkets identified using PCA and cluster analysis to group dwellings that are similar but not necessarily adjacent with a set produced by government employed appraisers who were asked to group small geographic areas. The PCA/cluster method was set to produce 34 submarkets and to match the number of segments identified by the appraisers. Interestingly, the hedonic models based on the appraiser-based definitions produced the largest proportion of predicted prices within 20% of the observed outcomes. This raises the interesting question of whether expert judgement might be potentially more effective than complex, data intensive methods.
Expert (agent)-based approaches
This is not the only study to engage real estate professionals in submarket delineation tasks. Several researchers have emphasised the influence of information asymmetries and the role of the agents that mediate information flows in shaping submarket structures (Maclennan et al., 1987). By extension it has been argued that, given their market expertise, real estate professionals are uniquely able to interpret the effects of a wide range of complex factors on submarket structures such as school districts, the quality of public services and other neighbourhood attributes.
In this context, Palm (1978) undertook a survey of real estate salespeople from the San Francisco-Oakland area and from Minneapolis and its suburbs to investigate for spatial bias in the recommendations made to potential buyers. She showed that real estate agents’ advice tended to reinforce market segmentation processes. Palm’s study offers a rationale for using agents to assist in the identification of submarket boundaries and other researchers have begun to explore this possibility.
Subsequently, Michaels and Smith (1990) invited five agents to classify all 85 key locations in suburban Boston into between five and 10 mutually exclusive groups. This produced three useful classifications: one with 10 submarkets and two others with four. They used these responses, albeit with some difficulty, to produce a composite classification of four submarkets. The agent-derived specification performed significantly better than the market-wide hedonic equation. The weakness of this study was, of course, the inability to reconcile information from multiple agents.
Watkins (2001) developed a simple alternative expert-based delineation scheme that sought to overcome the problems Michaels and Smith encountered in reconciling agents’ views. He undertook a study of the Glasgow housing market that offered a direct comparison between alternative submarket constructions including a specification that nests house type subdivisions within the spatial segments. The ‘nested’ set of submarkets was agent-defined in the sense that the partitions were based on the structure of the listings produced by the dominant consortium of local real estate agents. The analysis compared the extent to which the different specifications reduced the overall standard error of hedonic estimates. The expert-defined ‘nested’ model yielded the best results. This approach, of course, is difficult to replicate in the absence of a dominant single listing service. Taken together, however, these studies suggest that expert views are potentially helpful as a means of delineating submarket boundaries. The challenge lies in finding a robust and replicable method for capturing expert views.
To summarise, in this paper, the underlying logic for submarket existence is based on a synthesis of the contributions of Grigsby (1963) and Maclennan (1982). Thus submarkets are deemed to arise from the co-existence of a highly disaggregated housing stock, consisting of observable clusters of dwellings that act as close substitutes for each other, and a considerable degree of heterogeneity amongst demanders of housing. It is the way in which segmented demand maps on to the differentiated stock that gives rise to submarkets and leads to evidence of multiple equilibria in the prices paid for housing attributes in different market segments (Maclennan et al., 1987). This underlying theory provides the rationale for a test procedure that, first, uses hedonic methods to compute constant quality submarket prices and, secondly, compares the differences in constant quality prices between submarkets, constituted using different methods. The best approximation of the ‘true’ submarket structure should be the one that most accurately measures prices.
Research methods and data
Study area and data
The empirical analysis in this paper focuses on Istanbul, the largest city in Turkey and home to almost 15 per cent of the population of the country. Istanbul’s housing sector is dominated by market dwellings, although the owner occupied tenure is extremely heterogeneous and there are significant areas of non-market housing. Most housing is located in high density, inner urban neighbourhoods where much of the stock dates from the early 20th century. This contrasts markedly with the newer dwellings that are located in planned housing areas promoted by government since the start of the century. These areas emerged as a result of a concerted effort from policy makers to transform Istanbul from a mono-centric to a poly-centric city. Public investment was used to make infrastructural improvements and to pump prime industrial development into suburban locales.
The private sector’s development activity responded to the resultant changes in employment patterns and the transport network. Many of the properties in these non-traditional areas occupy the mid and higher end of the price scale. They are marketed in a way that reflects the growth in popularity of gated and semi-gated communities with good links to transport infrastructure, employment centres and high quality public amenities (Alkay, 2011). At the lower end of the market, there are significant numbers of unplanned dwellings, estimated by some to be over 50 per cent of the total, located within squatter settlements, known as ‘Gecekondu’ (Gokmen et al., 2006). These neighbourhoods are predominantly occupied by lower income groups and consist of dwellings in poor physical condition with low sales values.
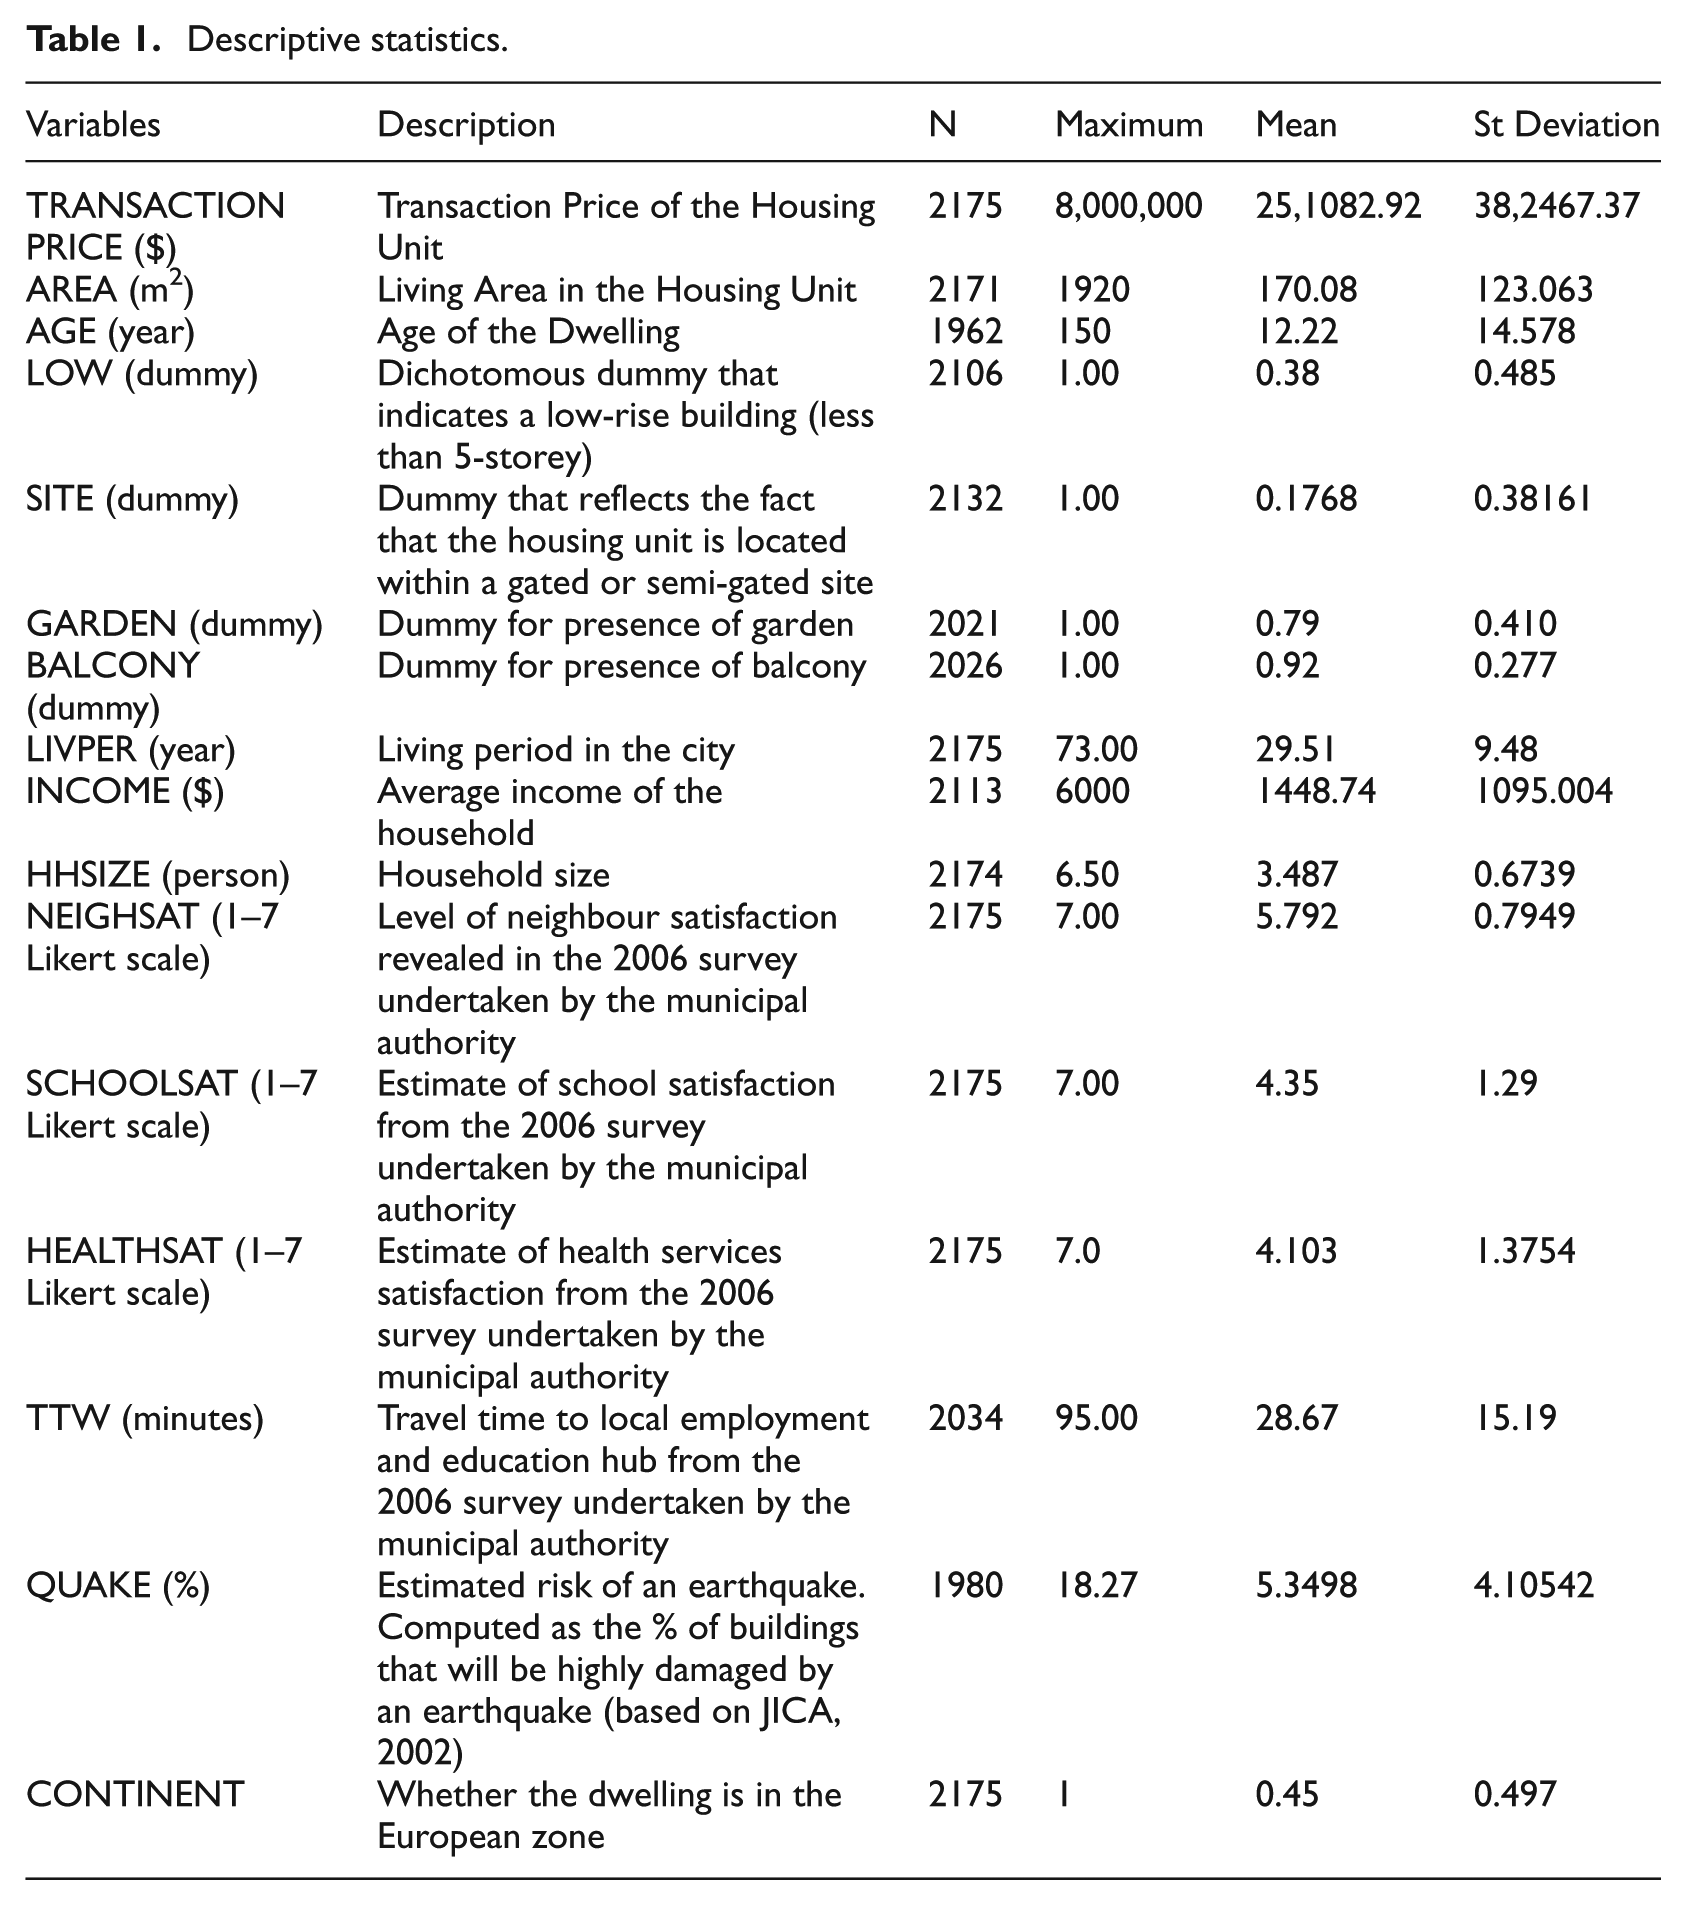
The house price and housing attributes data used in this analysis are drawn from two internet listing services of two leading realtors, Turyap and Remax. These listing services were chosen as they were the largest at the time the field work was undertaken and, as such, offered the broadest coverage of the market. The price and attribute data have been combined with socio-economic, neighbourhood quality and locational characteristics obtained from a household survey undertaken by the Istanbul Greater Municipality (IGM) in 2006. Data on earthquake risk was obtained from the Japanese International Cooperation Agency (JICA) report (JICA, 2002). Table 1 provides a list of the main variables used and associated descriptive statistics.
Descriptive statistics.
Partitioning techniques
In line with the main approaches reviewed above, this paper employs three different methods of identifying submarkets: the use of a priori knowledge in line with the hierarchical model; the use of expert opinion; the use of PCA with cluster analysis. The analysis does not seek to provide an exhaustive comparison of the effectiveness of the very wide array of methods used to identify submarkets. Rather it uses these three approaches on the basis that, first, they are the most common within the literature and, second, they help exemplify the potential differences that alternative approaches might make to predictive power.
Although rarely discussed in the literature, an important prior step to applying each of these methods requires a view to be taken on the likely number of submarkets. In each case, the researchers either need to decide how many clusters should be developed or are required to provide experts with some sense of the scale of submarkets. The literature offers highly varied views on the scale of submarkets. At the highest level of granularity, Bourassa et al. (2003) identify 34 submarkets of about 1000 residents each in Auckland, a city with a population of approximately 345,000 residents. These submarkets are considerably smaller than those identified by Watkins (2001) who defines five submarkets of over 100,000 residents each in Glasgow, where the population is nearer 600,000. At the top end of the scale, Park (2013) identifies three spatial submarkets in Seoul, a city with a population of around 10.2 million. Most mega-city studies define submarkets that are closer in scale to the 3 million residents in the Seoul study than the 1000 of the Auckland study. Further examples include Ling and Hui (2013) who identify five submarkets of around 1.6 million residents each in Hangzhou; and Sobriano (2014) who identifies five submarkets in Mexico City where the population is around 8.9 million. The approach here was to experiment with between five and eight submarkets. The submarkets identified are thus broadly similar in scale (i.e. around 2 million residents) to those used in other studies of cities of a similar size.
The sample size of 2175 observations is not particularly large. However, given that, as we note above, the paucity of data has served to limit attempts to derive submarkets for analytical purposes, this allows us to illustrate how to use standard techniques where data are limited. It is also worth noting that this sample size compares favourably with the 530 observations employed by Alkay (2008) in her model of prices in Istanbul. It also provides similar coverage of the market to the samples of approximately 4000 used by both Park (2013) and Sobriano (2014) in their submarket studies. The sample size supports statistically robust analysis and, importantly given our objectives, means that our approach can be replicated in similarly data constrained contexts.
The characteristics of the submarket generated using these methods are summarised in Table 2.
Summary of submarket characteristics.
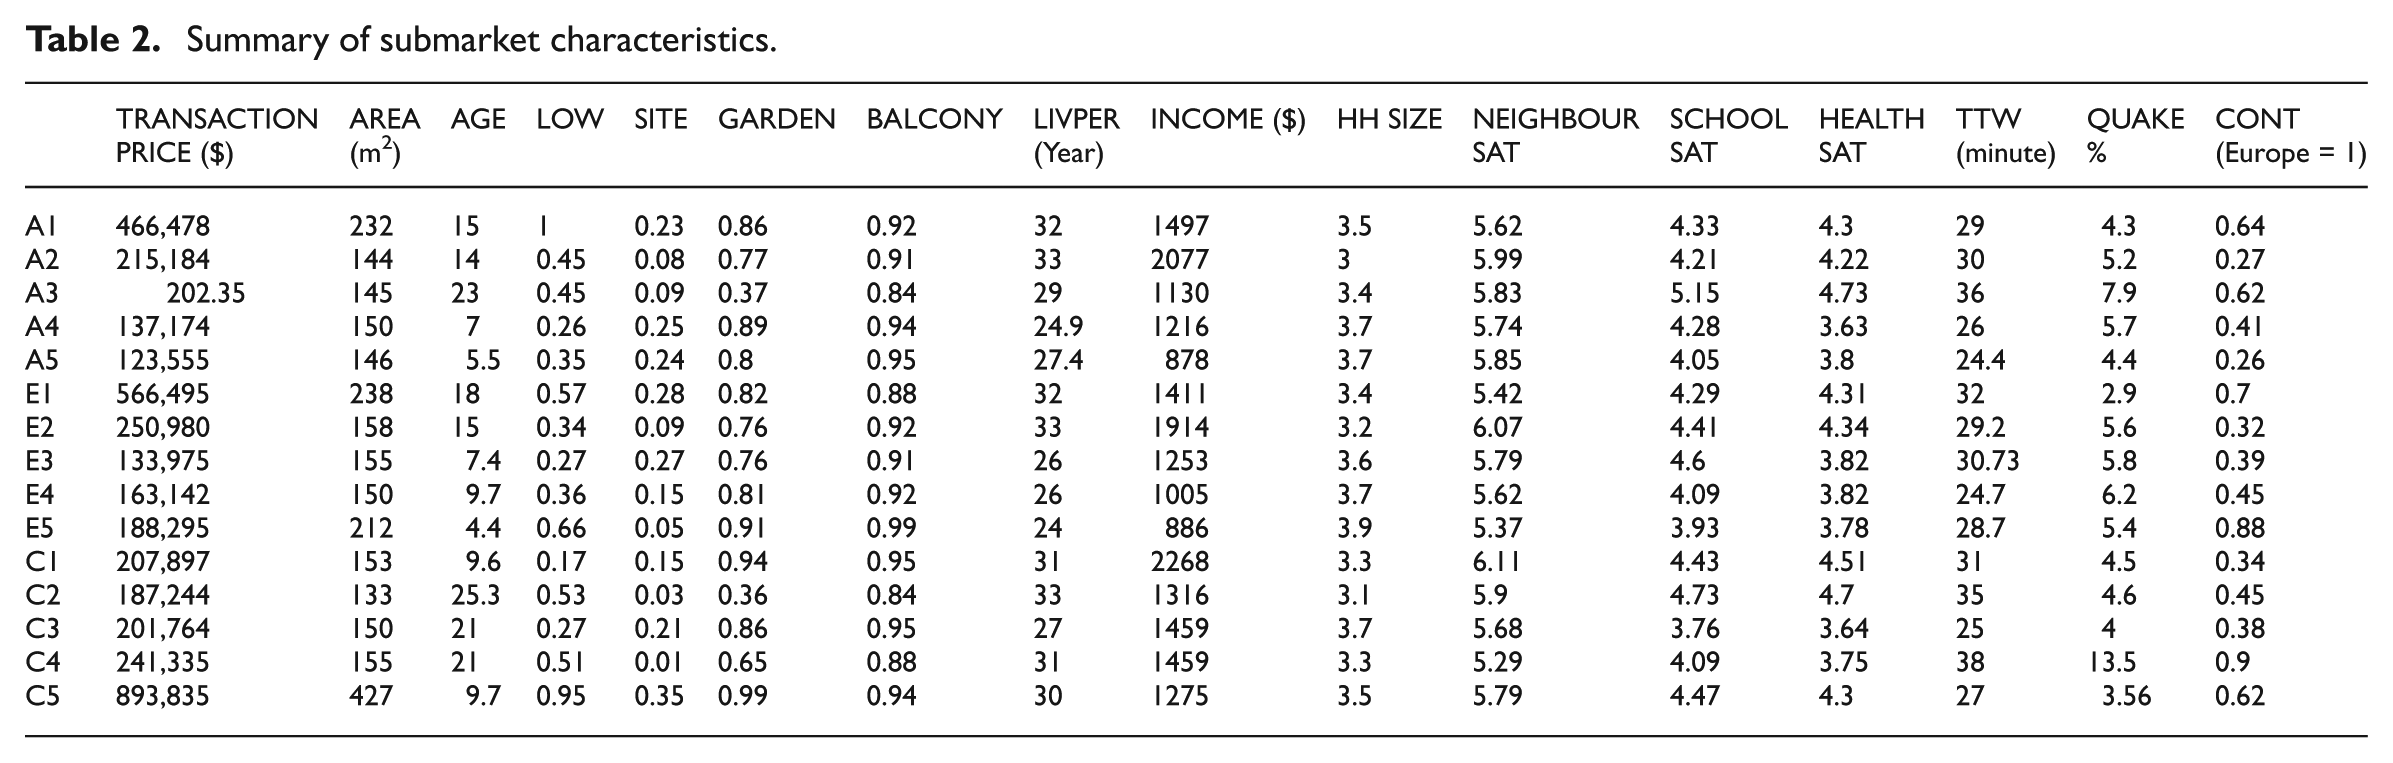
The first method of partitioning the data used the authors’ a priori knowledge about price levels, income profiles, housing types and neighbourhood quality within the study area to generate five spatial submarkets by grouping contiguous administrative units. Submarket 1 (a priori A1 in Table 2) comprises the largest and highest value properties. A5 is home to the lowest income groups.
The second set of submarkets was delineated in consultation with real estate agents and valuers working in the Istanbul market. The consultation took the form of eight semi-structured interviews conducted in November 2007. The real estate professionals interviewed were drawn from the largest firms in the city and were selected using a purposive method. None of the invited participants declined to take part in the study. Larger firms were chosen because of their market-wide coverage, which was deemed preferable to the insights that might be generated from smaller agents who tend to specialise in selected neighbourhoods.
The interviewees were invited to mark spatial submarket boundaries on a 1/200,000 scale map that displayed all established local administrative and neighbourhood boundaries within the city. Each respondent drew between five and seven submarkets, even though no restrictions were set. These submarkets did not necessarily have to be based on spatially contiguous neighbourhoods. In line with theory, the brief given to participants allowed them to group any location that they perceived to be close substitutes. There are some gaps because most of the respondents ignored commercial zones, restricted zones (such as military bases) and non-market areas of housing (see Figure 1 for an example). We made no attempt to assign these zones to submarkets, viewing them instead as being outside of the active owner occupied market.
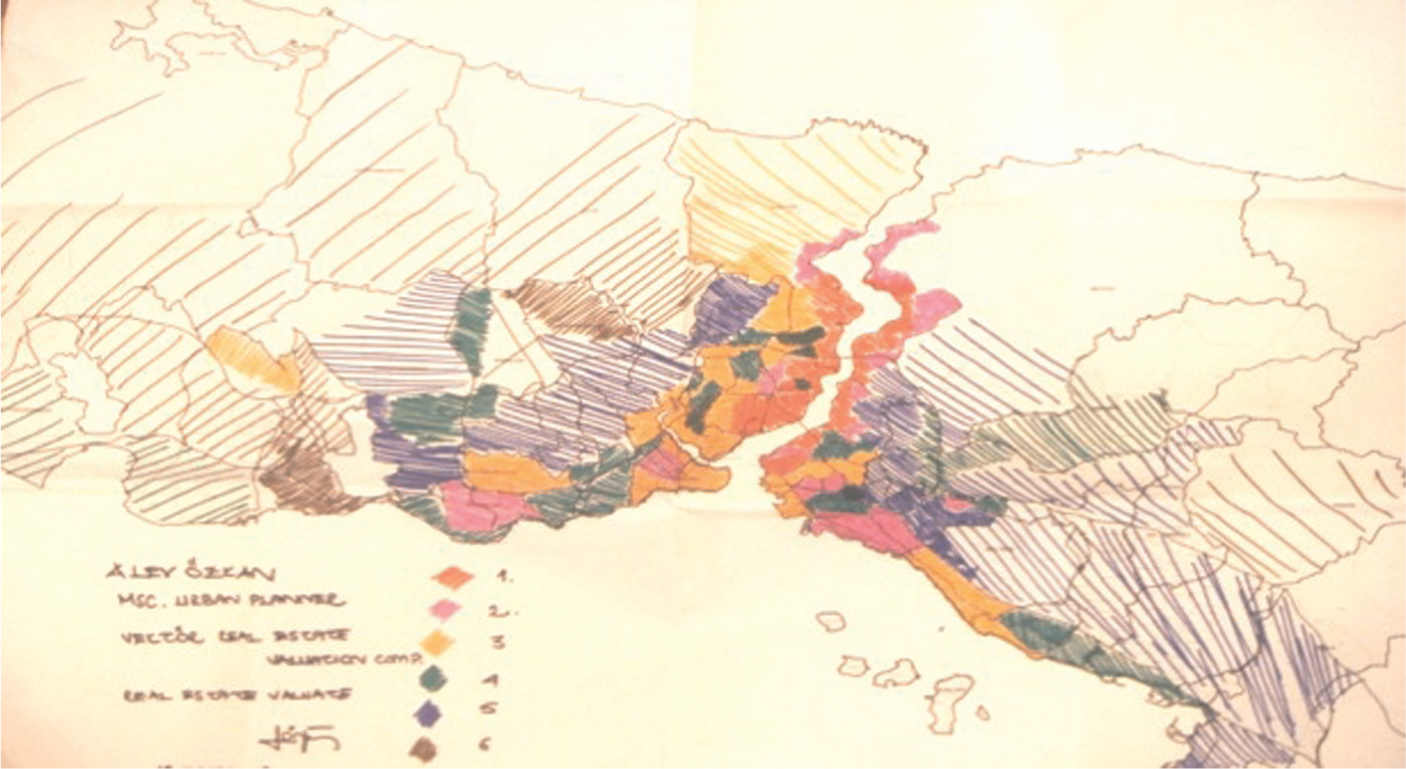
An example of a map drawn by an interviewee.
The use of GIS technology means that it was possible to overlay each of these maps and to combine the outputs into a set of five coherent submarkets. In the synthesised formulation, all neighbourhoods were allocated to the submarket to which they were assigned by more than half of the respondents (see Figure 2). Although, of course, it is possible that the combined submarkets might have looked different had we selected a different sample of agents, we take some comfort from the fact that there was a high degree of consensus between participants suggesting a reasonable degree of conformity both within and beyond the sample.
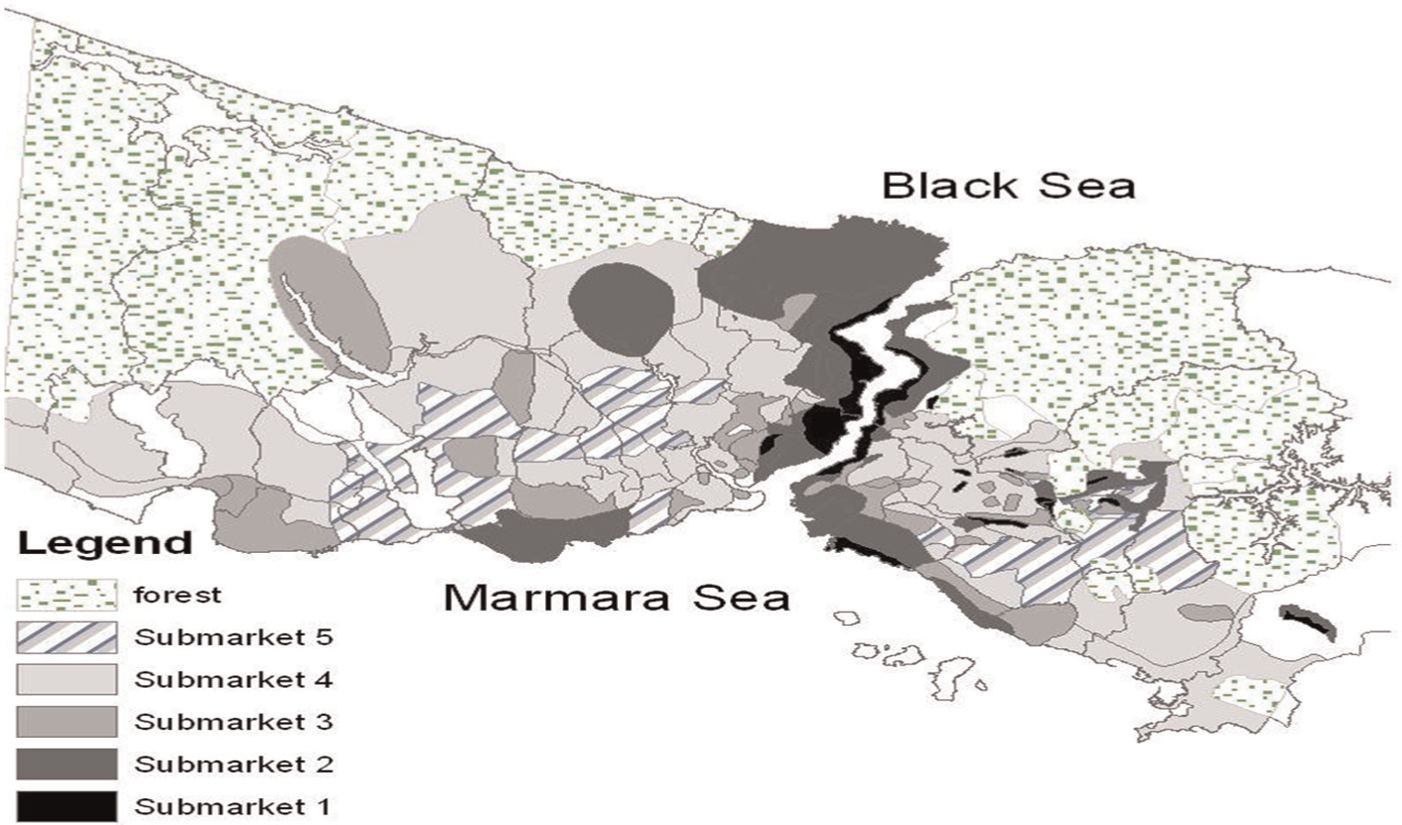
Submarkets in Istanbul.
The submarkets derived from this approach differ from those identified in the a priori specification in several ways. The first submarket constructed by the experts comprises properties that are even higher in value and larger in size than those in A1. E4 has properties with the lowest absolute values. These are closest to the city centre and have the highest earthquake risk but are not occupied by the lowest income groups. The lowest income groups are found in E5.
The third method employed a combination of PCA and cluster analysis. PCA is used to construct factors that are linear combinations of all variables. This allows us to calculate factor scores for the most important groups. The analysis takes account of house prices, floor area, room numbers and dwelling age as well as neighbourhood features such as transport facilities and earthquake risks. Five main factors emerge and these cumulatively explain around 70 per cent of the variance in the dataset. These components load on physical quality, house size, neighbourhood quality, location in relation to amenities and environmental quality.
The factors were used as inputs into the K-means cluster analysis procedure. The cluster analysis process provides a mechanism to allocate the dwellings to groups based on the data rather than prior knowledge. The observations in each cluster should be similar to the others in the same grouping and should be different to those in the alternative clusters. To ease comparison with the other partitioning methods, the procedure was set to ensure that five clusters were determined. PCA/Cluster Submarket 1 (C1 in Table 2) comprises the very largest and highest value properties. The dwellings in C5 are lowest in value. Interestingly none of these statistically derived submarkets features a cluster of the very lowest income groups.
Evaluating alternative submarket boundaries
The methods used here are based on several previous studies that have sought to compare the performance of competing submarket specifications (Goodman and Thibodeau, 2003; Leishman et al., 2013; Watkins, 2001). There are three stages to the evaluation process.
The first benchmarks the performance of alternative submarket specifications against a robust hedonic specification for the market area under examination (see Table 3). The standard specification employed in our study regresses house prices against a vector of structural, neighbourhood and locational characteristics. Some of the variables included in the model seek to capture the effects of context-specific concerns such as the earthquake risk and whether the dwelling is in the European or Asian zones of the city. Similarly, previous studies suggest that indicators such as household size, income and duration of residence are strong proxies for the socio-economic profile of neighbourhoods (Alkay, 2008). Smaller households that have been in residence for longer than average durations are clustered within desirable and established neighbourhoods that tend to command price premiums (Onder et al., 2004).
The baseline hedonic model for the Istanbul municipality.
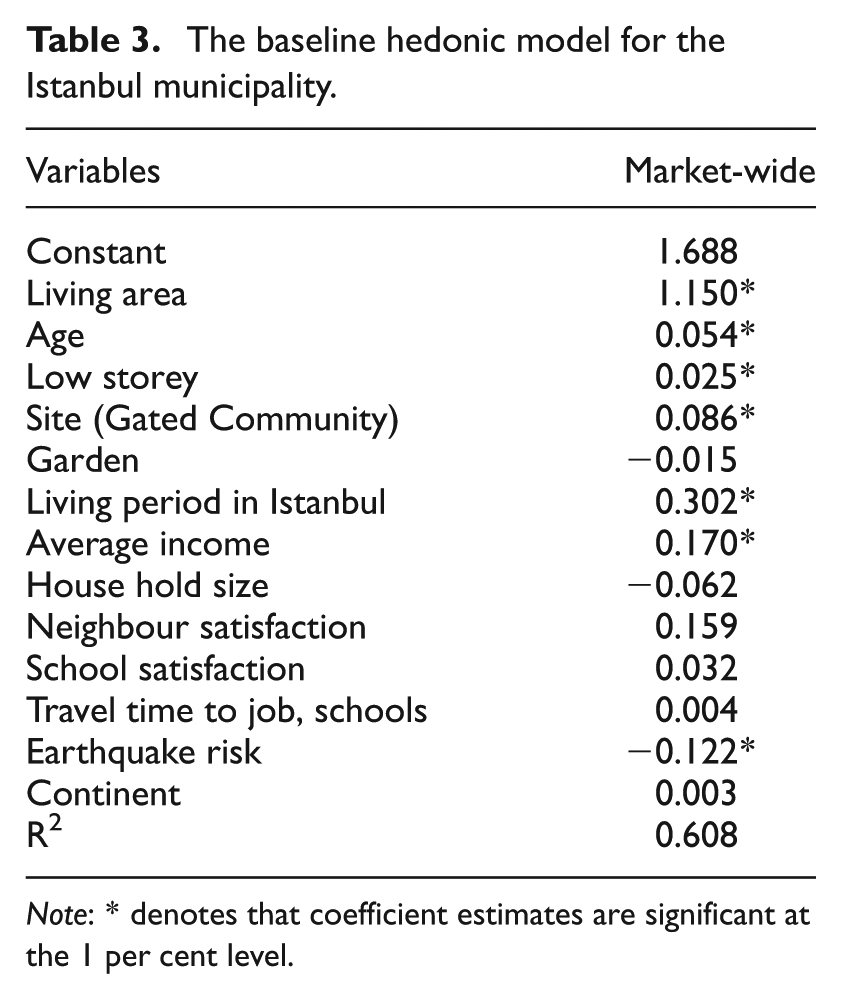
Note: * denotes that coefficient estimates are significant at the 1 per cent level.
In stage two, this model is re-estimated for each of the possible submarkets identified using the three different partitioning techniques. Following the standard submarket identification procedure described above, each set of submarkets must reduce the overall standard error of the hedonic estimates and there must be statistically significant differences in submarket price levels (as revealed by F test results). These tests should indicate both that the submarket specification provides estimates closer to the ‘true’ price surface than a single area-wide hedonic and that the possibility of a single market-wide equilibrium price being observed must be rejected. The predictive accuracy of the price estimates generated by incorporating the submarket specifications is also explored. We consider specifically the average accuracy, based on the mean difference between estimated and observed prices (referred to as the (mean)PE in the equation below). Following Chen et al. (2009), this is computed as follows:
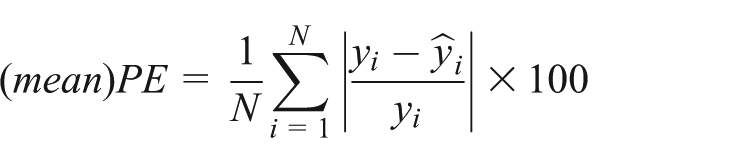
Given that the (mean)PE can be distorted by outliers, we also consider the proportion of estimates that fall within 10 and 20 per cent of the actual value. This additional information on the distribution of predictive errors has been shown to support slightly different conclusions from the (mean)PE measure when applied to urban housing markets (Goodman and Thibodeau, 2003).
Stage three follows Goodman and Dubin (1990), and tests whether one submarket formulation may be shown to be superior to its competitors. This study demonstrates that, where there are two models and one can be shown to be a restricted form of the other, it is possible to use a conventional nested F-test of covariance to compare the formulations. As Goodman and Thibodeau (2007) explain, alternative submarket formulations are in actual fact a special case of non-nested models. They suggest that when a set of house price data covering locations spread throughout the urban plain is divided into two sets of two submarkets each (e.g. one partition achieved by inserting a vertical line to establish east and west submarkets and the other delineated by a horizontal line that creates north and south submarkets) then we have two possible hypotheses. These are:
H0: y = Xβ+ε0 based on the East/West formulation
H1: y = Yγ+ε1 based on the North/South formulation
where y is the vector of house prices, Xβ is the hedonic in the East/West formulation and Yγ is the regression in the North/South formulation. As H1 cannot be written as a restriction of H0 then this parallels the circumstances in which two models are comprised of explanatory variables that cannot be shown to be subsets of each other. As such, the Non-Nested J Test becomes an appropriate method for exploring the relative merits of the competing ‘models’ (Davidson and MacKinnon, 1981). The J Test has been used increasingly widely to explore the relative merits of alternative spatial models and has been applied in the submarket context previously (Goodman and Thibodeau, 2007). The null hypothesis is that submarket formulation X (East/West) is the appropriate basis for partitioning the market. The alternative is that submarket Y (North/South) is superior. The J Test allows us to test H0 against H1 by adding a single parameter, based on the price estimates derived from the alternative specification, to the equations, so that:

and when this is reversed

where ^ denotes the relevant hedonic price estimates. In testing the hypotheses, four possible outcomes may occur: reject both, reject none or reject either one of the two. The test is extended slightly here to examine multiple alternatives. This is done by simply re-testing with each of our different submarket formulations entered as X in the null hypothesis.
Empirical results
The baseline hedonic model took a linear functional form. Following considerable experimentation, this functional form was selected in line with the widely applied criteria established by Cassel and Mendelsohn (1985). This form was preferred to log-log and semi-log variants on the basis that it produced parameter estimates that were consistent with prior theory, a parsimonious equation that provided the best fit to the data and achieved the strongest performance on standard diagnostic tests. The superiority of the linear model over non-linear specifications is unusual but not unique (Keskin, 2008; Palmquist, 1984). The estimated parameters explain 61 per cent of the variation in house price levels which, although modest, falls within the normal range for reported hedonic models (Malpezzi, 2003). The sign and magnitude of each of the coefficient estimates are significant at conventional levels. Thus, in line with much of the literature, the size of the dwelling (living area) is the dominant explanatory variable while improvements in neighbour satisfaction adds a premium and earthquake risk has a significant, negative impact on price.
The model has several noteworthy features. For instance, dwelling age has a positive rather than negative impact on value. This would imply that ‘vintage’ or historic features create a premium for older properties. This effect would seem to outweigh the impact of depreciation and, whilst unusual, the result is in line with previous models of the determinants of house prices in Istanbul (Onder et al., 2004; Ozus et al., 2007). Our attempts to experiment with a piecewise approach that would allow us to capture the non-linear effects of age did not produce statistically significant results. Similarly, attempts to enter the Likert-based earthquake risk measure into the model in different ways that might allow for non-linear impacts did not produce statistically reliable results.
The model also includes an income variable. It has been argued that, as a demand side variable, this runs counter to the underlying theory that suggests that the estimated coefficients should represent the equilibrium value determined in the implicit market for each variable. Following several previous studies, however, the variable is used here as the best available proxy for neighbourhood quality rather than as a measure of demand (Graves et al., 1988; Palmquist, 1984). In these circumstances, the coefficient acts as an estimate of the implicit value of neighbourhood status.
The models for each of the potential submarkets identified using the three alternative identification procedures explained between 61 and 68 per cent of the variation in prices. Each set of submarkets reduced the overall standard error (see Table 4, columns 1 and 2). The best performers were the submarkets defined using the a priori method, which achieved a 21.53 per cent reduction in weighted standard error (WSE), and the expert-defined model that delivered a 15.65 per cent reduction in WSE.
Standard error reduction and prediction accuracy for alternative partitioning methods.
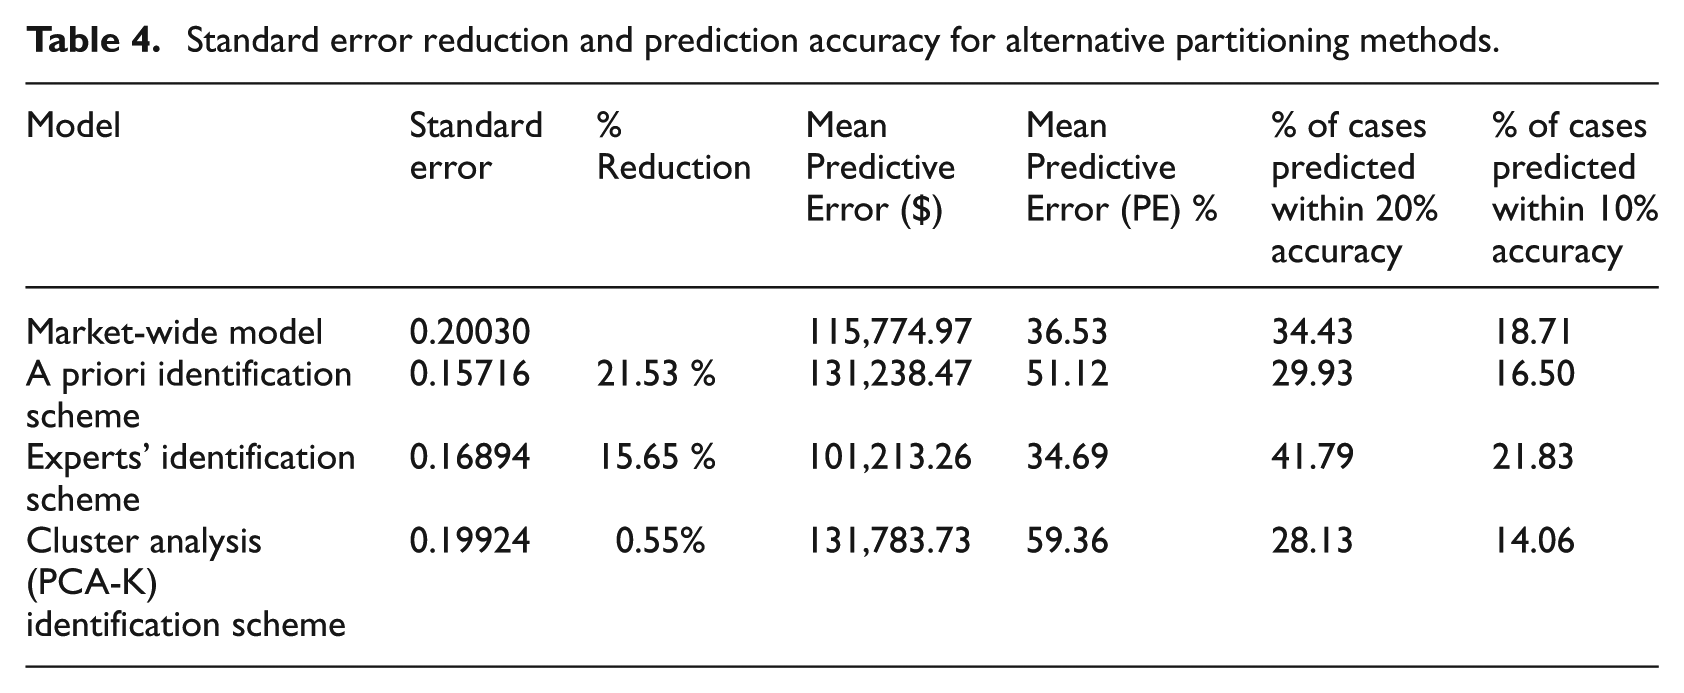
These models were also used to predict transaction prices. The results are summarised in Table 4, columns 3–6. The market-wide model does not predict prices very effectively. The expert formulation produced the smallest difference: 48.6 per cent of the average observed value. The cluster analysis formulation produced the largest difference at 59.36 per cent of the average observed value. The expert-defined specification performs best in terms of the proportion of hedonic estimates within 20 per cent of the observed prices with more than 41 per cent of cases within this range. The PCA/cluster method achieved the lowest score with only 28 per cent of cases in this band. A similar pattern was observed using the narrower target range where 21.8 per cent of the estimated prices produced by the expert-defined formulation were within 10 per cent of the actual prices, compared with only 14 per cent of the PCA/cluster analysis estimates.
The non-nested test results are presented in Table 5. As noted above, the test procedure involves re-estimating the hedonic model based on the H0 specification but augmented by the inclusion of the predicted prices from the H1 model. The key outputs are the coefficient on the predicted price from the alternative (H1) specification and its standard error. This allows us to calculate a t-statistic to determine whether or not to reject the null. The four competing specifications in our experiment were combined using a pairwise process. The t-statistics are summarised above. The table lists the H0 formulation on the vertical axis and the H1 specification on the horizontal axis.
T-statistics from non-nested J Tests.
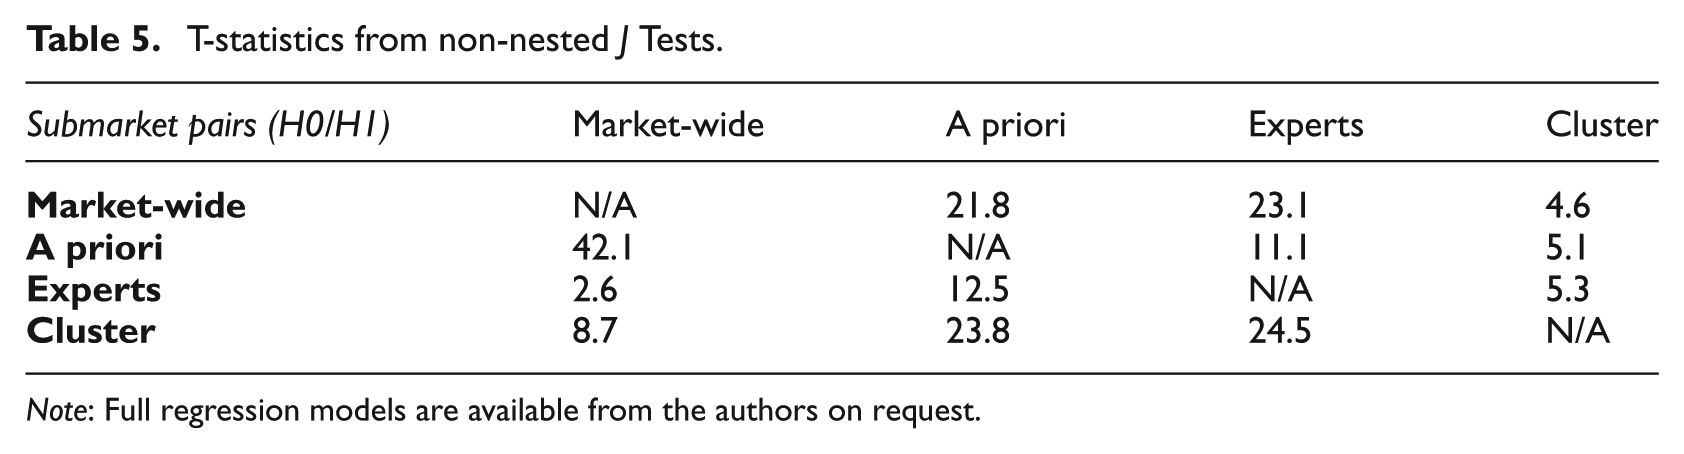
Note: Full regression models are available from the authors on request.
The J Test results are all statistically significant, suggesting that none of the alternative submarket specifications dominates the alternatives.
Conclusions
The need to partition complex and heterogeneous housing markets into functionally meaningful submarkets is an important challenge for real estate analysts. The increase in availability of rich micro-datasets has seen an upsurge in interest in the application of ever more sophisticated methods to help delineate submarkets. But do we really need more data to help effectively identify submarkets?
This paper seeks to explore the extent to which simple, more qualitative methods might achieve similar (or better) results than standard empirical procedures. The issue is explored by developing an experiment that tests alternative approaches to constructing geographic housing submarkets. The partitions established were based on the prior knowledge of the researcher, the most pervasive approach in the literature to date; the use of a more agnostic, data-driven method using a combination of PCA and cluster analysis; and a formulation constructed from in-depth interviews with real estate professionals. The research is designed from an agnostic perspective – we do not seek to assert the superiority of one approach over the others, rather we simply seek to compare how well they perform. With respect to the qualitative approach used to capture expert views, the intention was that the methods used to capture information from the survey respondents should be replicable in different market contexts and could be readily synthesised into a single submarket formulation. A central concern was the desire to develop a method that might help develop submarket formulations to assist the decision making of real estate professionals and policy makers, even in contexts where data constraints are extensive.
The relative merit of the expert-defined submarket boundaries was assessed using a three-stage procedure. First, the submarkets formulated were used as inputs into a standard hedonic analysis. The hedonic results were compared with those produced using a standard market-wide equation and those derived from the alternative submarket specifications. The results showed that the specification based on prior knowledge led to the greatest reduction in standard error (at more than 20 per cent). The expert-defined formulation reduced the standard error by just over 15 per cent. Second, the predictive accuracy of the price estimates derived from the three hedonic equations were examined. This showed that the expert-defined submarket formulation produced the largest proportionate difference between actual and estimated prices. The expert-based formulation also generated the largest proportion of estimates within 10 and 20 per cent of the actual value with more than 20 per cent and 40 per cent respectively in these bands. The formulations based on prior knowledge and PCA with cluster analysis produced markedly inferior scores. Third, a non-nested J Test was used to compare the relative merits of the competing submarket ‘models’. The results indicated that none of the specifications dominates the alternatives.
Although the results do not provide comprehensive evidence that expert-defined submarkets are superior to the specifications derived by using alternative methods to partition our data, the expert-defined model does perform well in terms of predictive accuracy. As such, it might reasonably be argued that the submarkets constructed using this qualitative approach are as good an approximation of the ‘true’ submarket structure as those based on any other approach. These findings suggest that the methods used here to consult experts and to construct a consensus view might easily and effectively be replicated by analysts operating in markets where data availability is limited. This approach might be particularly useful in market contexts where real estate information is not yet systematically collated or widely available to market analysts.
Footnotes
Funding
This research received no specific grant from any funding agency in the public, commercial, or not-for-profit sectors.