
Abstract
How cities can become more conducive to sustainable travel patterns is a pressing matter in urban research. In the built environment–travel literature, several features potentially promoting sustainable mobility remain under-researched. One concerns the precise role of local accessibility – in terms of the number, variety and specific types of amenities – in promoting the slow modes of walking and cycling and in reducing car use. Another is the possibility that the standard assumption of a linear relationship between density and (un)sustainable travel is flawed. To fill these gaps, we explore specific local amenity supply types that stimulate a large share of residents to walk or cycle, avoiding long drives, to accomplish their daily activities. In a case study of the Västra Götaland region in Sweden, we analyse a combination of high-quality micro data from registers and the national travel survey using a stepwise statistical approach. We find evidence of non-linear discontinuities and significant geographical variation in how local accessibility affects travel behaviour. While more neighbourhood amenities contribute to more walking/cycling, the effect of establishing additional amenities varies amongst neighbourhood types and travel variables. Local everyday services, for example, grocery stores and preschools, are critical in triggering change. The findings inform urban planning by showing how a basic supply of essential amenities could contribute to better prerequisites for walking or cycling and reduced car dependence by inducing residents to choose local options.
Introduction
This paper sheds light on the specific circumstances in which urban residents choose to use local supply options and travel on foot or by bicycle, rather than choosing distant alternatives that require motorised travel by car. Seeking sustainable urban development, many Western cities have shifted the emphasis of transport policy and investment away from the car. Instead, walking and cycling, together with public transport, have grown in both importance and mode share (Boarnet, 2013). There is virtual consensus that in a sustainable city, walking and cycling should be integrated components of the overall, multimodal urban transport system (Kenworthy, 2006; Southworth, 2005). They are also seen as vital elements of the discourse of vibrant, attractive and healthy cities (e.g. Dovey and Pafka, 2019; Sallis et al., 2015). Much attention is focused on how the urban built environment, depending on its particular characteristics, can either impede or facilitate non-motorised travel modes (Saelens and Handy, 2008; Wang et al., 2016). This is also reflected in ‘energy-conscious’ urban planning in which the need for travel is reduced through, for example, density levels that make possible shorter distances between activity locations. This creates opportunities for non-car-based mobility and consequently lowered energy use and associated urban transport emissions (Knaap and Talen, 2005).
However, the extensive literature on built environment–travel relationships seldom pays attention to local accessibility at a detailed level or to the importance of slow modes (i.e. walking and cycling) (van Wee, 2016). For example, Salon et al.’s (2012) exhaustive review of how local planning actions affect distance travelled by car includes no studies capturing the effects of specific local amenities in terms of, for example, supply type, quality and size. Mainly as a result of data limitations, most studies use aggregate proxies for amenity supply in the form of the traditional ‘Ds’ of the built environment’ (i.e. density, diversity, design, destination accessibility and distance to transit) (Ewing and Cervero, 2010; Stevens, 2017). Rather than deriving from such aggregate measures, travel to many everyday activities is likely directly influenced by the presence of particular neighbourhood amenities (e.g. shops, restaurants and schools) that enable locally oriented daily living (Elldér, 2018; Handy, 2017). Therefore, from the perspectives of both travel behaviour theory and sustainable urban development policy, closer investigation of the distinct role of local accessibility in terms of the number, types and variety of amenities available in urban neighbourhoods is justified. A primary aim of this paper is accordingly to analyse how the characteristics of local amenity supply correlate with whether residents choose to walk/cycle or drive long distances to reach everyday activities.
Detailed analysis of the relationships between local accessibility and travel behaviour is particularly relevant to planning, since the presence of certain amenities near and within residential areas could have triggering effects on mode choice, not least on car use. Such effects might occur: if specific key amenities (e.g. a grocery store) are unavailable (or have closed) locally and residents must travel farther to reach substitutes; if local options (e.g. local restaurants) are perceived as unattractive and residents therefore choose other destinations located beyond walking/biking distance; or when a specific combination of amenities makes local living possible by forming a critical ‘basic supply’ for most everyday activities.
From a theoretical perspective, previous studies generally assume that the effect of the built environment on travel is linear, that is, that a change in supply density will generate a proportional change in car travel, regardless of context. Recent studies suggest the existence of non-linear effects (Case, 2013; Ding et al., 2018; Tao et al., 2020) and that effects vary amongst different geographical areas (Boarnet et al., 2011; Salon, 2009, 2015). However, these studies mainly focus on non-linearity/heterogeneity regarding aggregate ‘D variables’. They rarely examine the local supply in detail, for example, how travel patterns are influenced by the presence, absence or specific combinations of amenities, or how relationships vary amongst different kinds of residential areas. The second aim of our study is accordingly to explore and identify possible local amenity supplies that exert discontinuous influence on residents’ mode choice in favour of walking and cycling and in disfavour of car trips.
These discontinuities can refer to critical levels in terms of the supply of specific types, combinations and volumes of amenities. They may represent triggers or breaks in citizens’ travel habits with important repercussions for urban sustainability in terms of energy use, congestion and pollution. Identification of such local supply types, which can stimulate substantial changes (i.e. discontinuities) in travel patterns in favour of slow modes and hence sustainable mobility, is highly relevant to urban planning and policy. Our paper builds knowledge of the potential for proactive urban planning focusing on the built environment, land use and the location of activities, in terms of densification and mixing amenities, to support a more energy-efficient transport system through a shift from car use to walking and cycling.
Literature review
The land use pattern resulting from the spatial distribution of activity locations conditions the overall spatial opportunity structure and choice set surrounding the individual. Besides other structuring factors such as access to mobility resources and time, the land use pattern is a fundamental prerequisite for destination choice and mode choice (e.g. van Wee and Handy, 2016). According to the common ‘compact development hypothesis’, when amenities/destinations are located near where people live, car driving will decrease because of shorter distances to amenities, and also because walking, cycling and public transport use will be more viable (Handy, 2017). This assumption corroborates basic transport behaviour theory, in which individual mobility is understood as resulting from demand for activities distributed across space. Given that travel is usually secondary to the activity that it enables, nearby destinations should be preferred over more distant ones, other things being equal (Handy and Clifton, 2001; Meurs and Haaijer, 2001). Residents are often more likely to use nearby options, but mainly in the case of unspecialised activities/amenities. This is less self-evident in the case of specialised amenities. If covering some additional distance provides access to destinations perceived as superior (e.g. because of quality, symbolic values or allegiance), they may be preferred despite their location (Haugen et al., 2012; Handy and Clifton, 2001; Næss et al., 2019). In practice, travel distance minimisation is not necessarily the primary factor in destination choice, but one of many priorities amongst which travel time and activity scheduling also play important roles. An affinity for travel as such can also influence destination choice (Handy and Clifton, 2001). In a contemporary urban ‘mobility lifestyle’ based on speed and car use, geographical proximity may be subordinate to a wide choice range (Haugen and Vilhelmson, 2013; Mokhtarian et al., 2015).
While compact development alone is insufficient for drastic reductions in driving, it remains a necessary precondition for urban resilience and robustness, that is, for any substantial reductions to occur at all (Handy, 2017). Destinations located within walking or biking distance of residences enable and spur the use of modes of travel other than driving (Handy and Clifton, 2001), making the compact city less prone to car dependency, more resilient to disrupted fossil fuel supply and more sustainable than other urban forms (Næss et al., 2017). Mode shift away from driving and towards the slow and non-motorised modes of walking and cycling also entails several environmental ‘co-benefits’ (Sallis et al., 2015; Salon et al., 2012) such as low local environmental impact, non-pollution, congestion reduction and energy conservation, along with social and health advantages such as improved recreational value, improved health, and potential for sociability and social capital generation (e.g. Gärling et al., 2014). Moreover, because of their broad availability, walking and cycling can contribute to a more socially equitable transport system. They can reduce the vulnerability of people who are disadvantaged in car-dependent urban structures, that is, children/youth, single parents, elderly and low-income earners (Southworth, 2005), or who for other reasons live in conditions of transport poverty (Lucas et al., 2016).
There is broad agreement that although land use patterns and features of the built environment do not fully determine travel behaviour, they nevertheless influence it in non-negligible ways (Handy, 2017; Næss et al., 2017; van Wee and Handy, 2016). However, many authors have noted the need for more nuance in assessing the importance of built-environment features for driving, for example, highlighting that such relationships are not uniform across trip purposes, social groups and neighbourhood types (Elldér, 2014; Boarnet, 2011; Salon, 2015; Voulgaris et al., 2016). From a policy and planning perspective, it is important to analyse in detail the specific local amenities and/or concentrations of amenities that truly influence where everyday activities are performed (Elldér, 2018; Handy, 2017). Opportunities to influence the establishment (or prevent the closure) of certain key amenities are often probably more effective (i.e. direct and quick) than are other often-discussed interventions, notably general densification. We suspect, for example, that certain amenities may inherently constitute what we here call critical discontinuities, determining when the local supply is or is not deemed sufficient by residents. Neighbourhoods that are self-sufficient in terms of the supply of unspecialised amenities, that is, that have a basic local supply, likely exhibit more intra-neighbourhood-oriented travel patterns and lower car use than do areas with poor local accessibility (Næss et al., 2019). In the latter case, residents rely on amenities in the larger urban area, and this usually entails more car use. An important task is therefore to explore the number, variety and specific types of local amenities required for residents living in different types of neighbourhoods to choose to conduct their everyday activities locally, by walking or cycling, and to avoid long car journeys.
However, two main and interrelated challenges call for further investigation: (1) it is difficult to isolate the effects of the number, variety and specific types of local amenities since there are strong co-variations between these different ways of representing local accessibility. Obviously, in areas with many local amenities, the variation is greater and a certain category of amenity is more likely to be represented. (2) Previous research shows that the effect of the built environment is often non-linear (Elldér, 2018; Ding et al., 2018; Tao et al., 2020; van Wee and Handy, 2016) and varies between contexts (Næss, 2019; Salon, 2015; Voulgaris et al., 2016). Acknowledging this means that the effect of establishing or closing amenities will depend on the other types of amenities present. For example, the establishment of additional amenities will likely have a greater impact on travel behaviour in areas with a small local supply than in urban neighbourhoods where the local supply is already substantial. In the next section, we present a stepwise exploratory statistical analysis designed to capture this complex dynamic, and shed light on the specific circumstances in which urban residents actually choose to use local supply options and travel on foot or by bicycle, rather than opting for distant alternatives that require car travel.
Data and methods
Study region
Our study is set in the Västra Götaland region on the Swedish west coast. The selection of study area is partly data driven, since an extended sample from the comprehensive national travel survey is available for Västra Götaland. The region constitutes a relevant case given its diverse geography, with a settlement structure including a large city/metropolitan area (i.e. Sweden’s second largest city, Gothenburg), several medium-sized cities, as well as small towns and sparsely populated areas. Västra Götaland has a well-developed multimodal transport system, comprising an extensive road network, bike lanes and a public transport system that compares well with those of other cities of the Global North (Curtis et al., 2019). During the time of study, 1.6 million people lived in the region, of whom 900,000 lived in Gothenburg and its surrounding municipalities.
Data
Travel behaviour and individual background factors
We capture travel activities and individual background factors using data from the Swedish national travel survey conducted by the governmental agency Traffic Analysis. It contains travel data for a representative cross-section of all residents of Sweden aged 6–84 years. The survey comprises travel diaries in which respondents report information about all their movements (e.g. distance, time, trip purpose and travel mode) on a randomly selected day. The sample size totals approximately 40,000 respondents when pooling data for the 2011–2016 period, and the response rate was about 40% each year. We select respondents of all ages resident in Västra Götaland.
Local accessibility
The local accessibility of everyday amenities is captured using data from the GILDA database. GILDA is compiled by Statistics Sweden and contains geo-referenced, longitudinal individual and workplace data from various official Swedish registers of the total population. The database has been updated annually since 1990. GILDA offers unique opportunities to identify the number, variety and specific types of amenities available in different areas, since all workplaces are covered in terms of type of activity (i.e. SNI codes) and geographical location (100-m resolution).
Variable definitions
The included variables fall into three categories: travel activities, local accessibility, and individual background variables. See Table 1 for descriptive statistics and precise definitions.
Descriptive statistics and variable definitions.
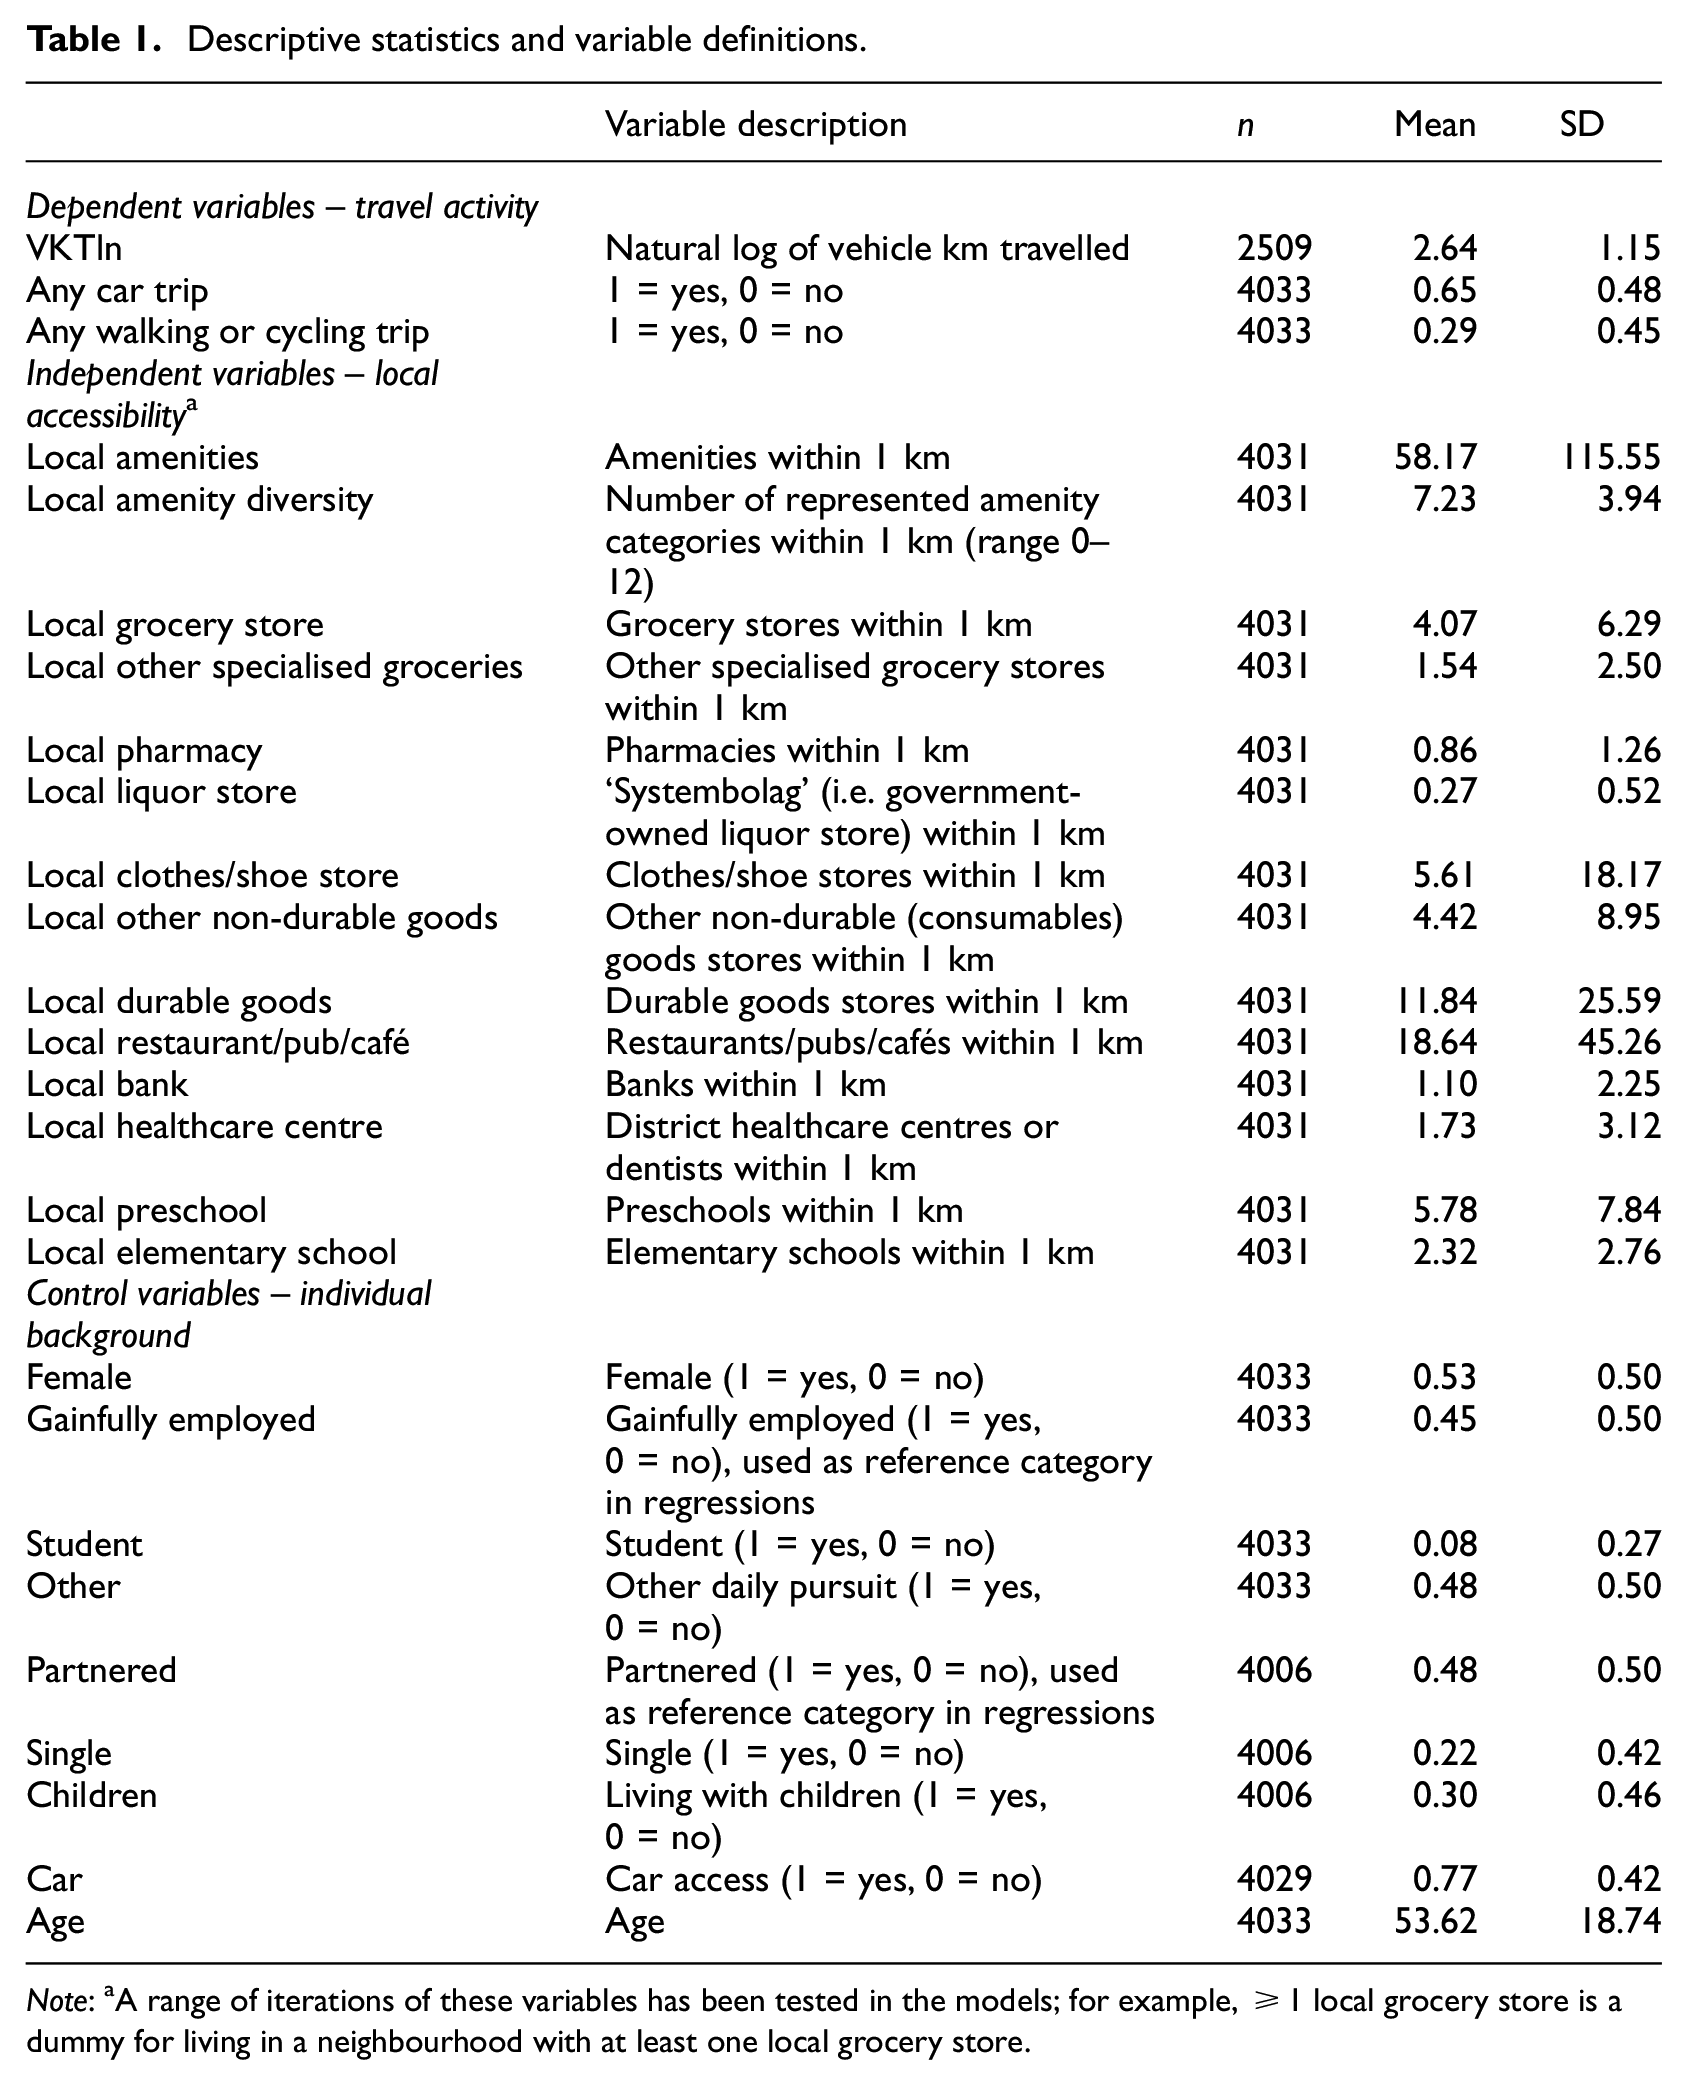
Note: aA range of iterations of these variables has been tested in the models; for example, ≥1 local grocery store is a dummy for living in a neighbourhood with at least one local grocery store.
Dependent variables – travel activity
Our focus is on everyday activities that could be conducted near home, on foot or by bicycle and by much of the population (Haugen, 2011). 1 We analyse trips in connection with the following activities: grocery shopping and other purchases, restaurant/café/pub visits, picking up/dropping off children, healthcare and other service errands. We select respondents who made any trip having these activities as the main purpose. We aggregate all trips for the selected purposes originating from home 2 performed on the measurement day. Next, three different dependent variables capturing the respondents’ travel patterns for the selected activities are defined and analysed: Any walking or cycling trip is a binary indicator of whether or not a respondent walked or cycled; 3 Any car trip indicates whether or not the respondent travelled by car; and VKT (vehicle kilometres travelled) is the natural logarithm of the total distance travelled by car.
Independent variables – local accessibility
The main independent variables capture local accessibility in terms of the amenities available within a 1-km range. In the travel survey, the highest geographical resolution available is the small areas for market statistics (SAMS) level. SAMS are defined by Statistics Sweden to represent homogenous residential neighbourhoods. In the study region, there are 1977 SAMS with an average of 850 inhabitants. The accessibility variables relate to the SAMS where the respondents’ homes are located. Since it is impossible to define exact home locations within the SAMS, we instead use GILDA data for the total population of each SAMS to define its demographic centre of gravity. Local accessibility variables are measured within 1-km buffers from the demographic centre of each SAMS. Most walking/cycling trips for the selected activities are made within this distance. Yet, although the SAMS are geographically detailed in urban areas, they can be quite large in sparsely populated areas (Amcoff, 2012). Accessibility measures are therefore less reliable in rural areas. Few respondents, however, live in very large SAMS.
To measure local accessibility, we include 12 categories of amenities required to perform the selected travel activities: grocery stores, liquor stores (government-owned ‘Systembolaget’), other specialised groceries (e.g. bakeries and fruit/vegetable stores), clothing/shoe stores, pharmacies, retailers of other non-durable goods, retailers of durable goods, district healthcare centres and dentists, restaurants/pubs/cafés, banks, primary schools and preschools. Three variables are defined to capture the number, variety and specific types of amenities available near the respondents’ residential locations: Local amenities denotes the total number of local amenities; Variety of local amenities captures how many of the 12 categories of amenities are available locally; and the remaining variables capture the number of each specific amenity (e.g. Local grocery store).
Independent variables – individual background variables
We control for several socio-demographic variables previously found to correlate with travel behaviour. Gender, age, daily pursuit, car access and family/household situation had significant effects and are therefore included.
Statistical approach
To capture the dynamics of what number, variety and specific types of local amenities matter in what neighbourhood types, we designed a stepwise exploratory statistical analysis. In a first step, we propose a neighbourhood typology based on observed discontinuities in the relationship between local accessibility and travel. Based on this typology, we then segment the data set to separately analyse the identified neighbourhood types. Each step is described in more detail below.
Discontinuities and neighbourhood typology (step 1)
We start our analysis by proposing a neighbourhood typology of local accessibility based on discontinuities in the relationship between the local supply of amenities and the travel patterns of the area’s residents. We apply a simple but effective method in visually estimating the location of possible discontinuities in plotted data (i.e. binned scatter plots, as suggested by, e.g., Ficotela and Denoel, 2009; Toms and Villard, 2015). We plot the means and 95% confidence intervals of the travel activity variables in equal-sized bins for the continuous local accessibility variables. This results in several types of neighbourhoods whose residents exhibit different travel patterns. Each neighbourhood type is analysed further in the following steps 2 and 3. This approach allows us to investigate the number, variety and specific types of local amenities that have an impact on what areas, thereby capturing otherwise hidden variation. This initial step is itself an important analysis, as it may reveal non-linearity and discontinuities in the importance of local accessibility for travel. The remaining analyses are performed separately for each area type.
Dimension reduction (step 2)
Before attempting to isolate the effects of the various local accessibility variables in a multivariate setting, we perform a principal component analysis (PCA) for each identified neighbourhood type. The geography of local amenities is complex and there may be dimensions not captured by the independent variables. For example, certain combinations and clusters of amenities may be of particular importance and form a ‘basic supply’ that allows a locally oriented everyday life. The input variables in the PCA are the 12 local accessibility variables. The factors produced from these analyses are then used as independent variables in step 3.
Multivariate analysis (step 3)
Finally, we attempt to analyse in detail the number, variety and specific types of amenities important for mode choice within each identified area type. We test different variations of the accessibility variables, including the PCA factors, to try to isolate the effect of specific amenity supplies within each neighbourhood type. Three regression models are presented for each area type. The continuous variable VKTln is analysed using ordinary least square regressions, and the dichotomous variables Any walking or cycling trip and Any car trip are analysed using binary logistic regressions. The final models presented (section Multivariate analysis) include only those variables found to be significant in preliminary models.
Delimitations
Our exploratory statistical approach is indeed a challenge and the visual estimation of discontinuities is obviously somewhat arbitrary. We do not expect to find any abrupt threshold effects, since travel is a complex human behaviour influenced by a range of factors, so it is unlikely that a small change in local accessibility would result in a sharp change in travel. Rather, we expect to identify gradual discontinuities and indications of associated area types. To check for robustness, we perform sensitivity analyses by varying the values (i.e. number of local amenities) that delimit the neighbourhood types without the results presented below (in sections Dimension reduction and Multivariate analysis) varying substantially.
In relation to this, we are aware that a certain type of local supply does not exist independently of other built-environment factors. It is a challenge to isolate the specific impact of local accessibility from the effects of other built-environment factors. To avoid multicollinearity, we decided not to include standard D-variables here. 4 Local accessibility correlates with, for example, population density and distance to the closest city centre, though it is debatable whether such aggregated measures have the same direct effect on travel behaviour (Elldér, 2018). However, it is important to stress that such features of the built environment are often a prerequisite for a certain local supply and therefore have an indirect effect – not least, the distance to the city centre is a prerequisite, as higher densities and local access are more likely in neighbourhoods located closer to urban cores (Næss et al., 2017, 2019). However, the focus here is on analysing local access in detail, and on isolating the direct effects of the specific types, quantity, variety and co-locations of local amenities.
No direct measures of residential self-selection are included in our data, a limitation as people who prefer active travel over driving are more inclined to live in areas with related amenities. Parts of the explanation related to accessibility could therefore be attributed to self-selection. Sociodemographic control variables, however, prevent some bias (Brownstone and Golob, 2009). Another limitation is that we combine walking and cycling in one variable to obtain a sufficient number of observations for the analysis. This may cause some bias since the accessibility determinants of walking and cycling could differ with respect to the distance to amenities.
Results
Discontinuities and neighbourhood typology
We begin by exploring potential discontinuities in how mode choice (left y-axis) and VKT (right y-axis) correlate with the total number of local amenities (x-axis) using a binned scatter plot (see Figure 1). Some general observations are worth highlighting. As expected, the diagram shows strong correlations between local accessibility and travel activities: when the total number of local amenities increases, the residents travel less by car and walk/cycle to a greater extent. The correlation is significant and has a strong effect even after controlling for other factors. However, the correlations are not strictly linear, and various discontinuities in travel behaviour appear as local access increases.
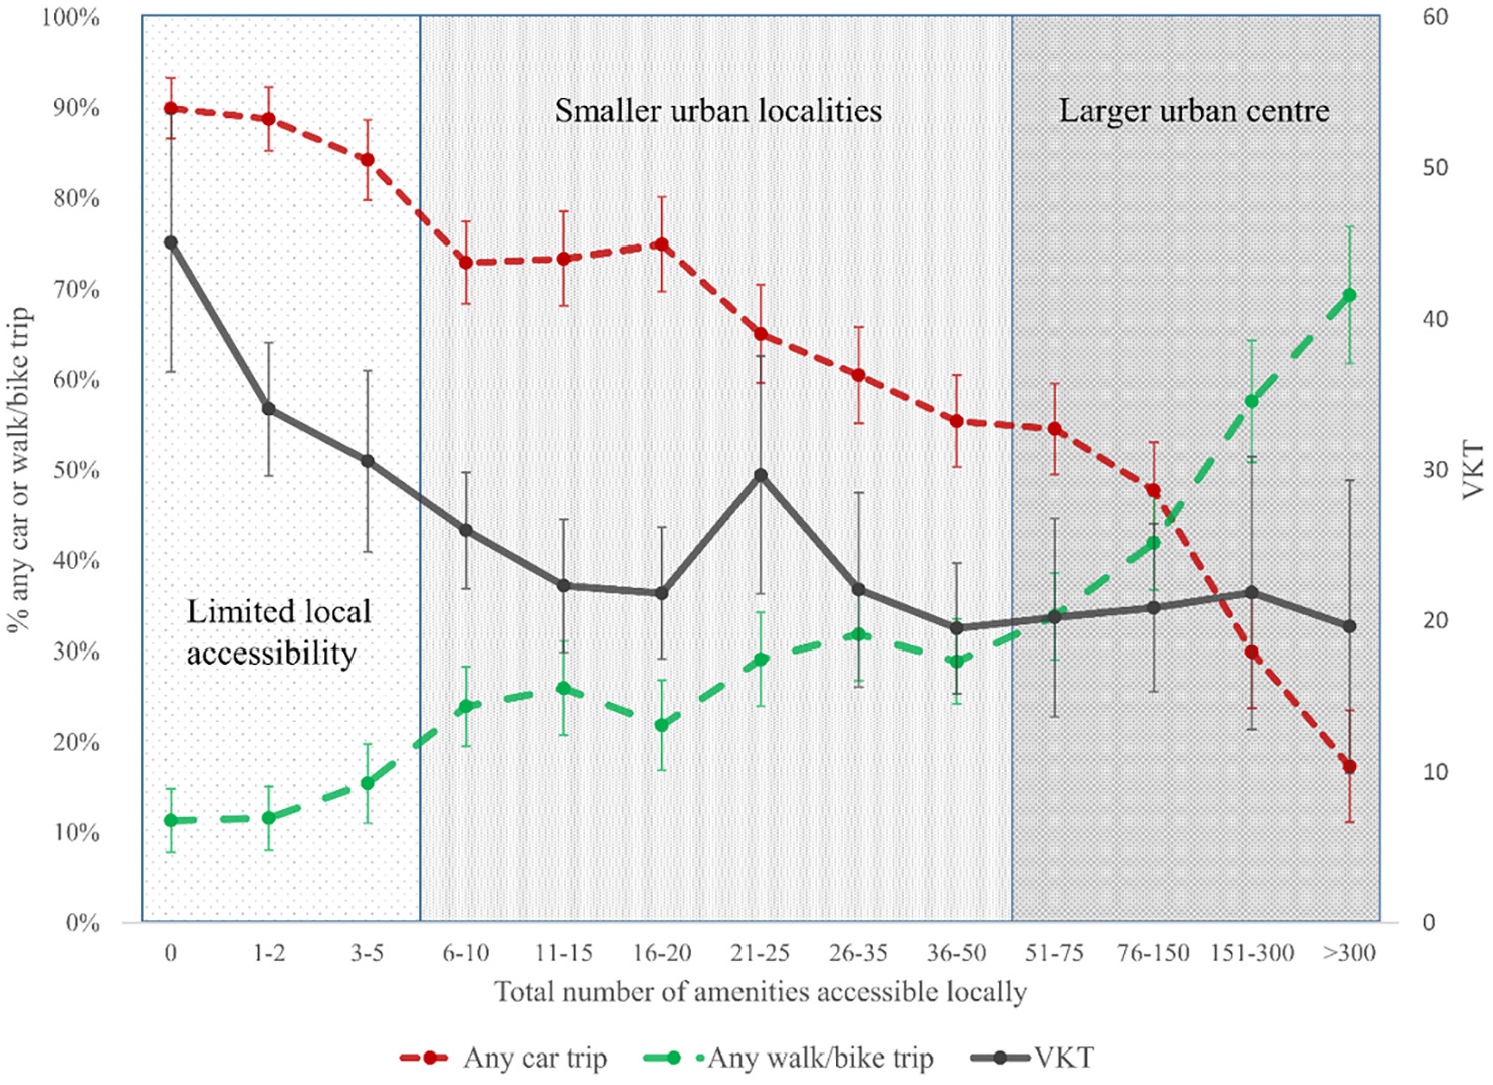
Binned-scatter plot of dependent variables and total number of local amenities (the bars in the plot represent 95% confidence intervals).
For all travel activity variables, diminishing returns are evident from adding additional local amenities, most notably for VKT. Once 6–10 amenities are locally accessible, VKT does not decrease much more with further increases in local accessibility. There are also diminishing returns when it comes to the likelihood of walking/cycling or driving. With an increasing number of local amenities, the share of walking/cycling continues to increase and the share of car trips to decrease, but the change is less pronounced at higher levels of local accessibility. For the mode choice variables, there is also a point of discontinuity at which the rate of travel mode change decreases after 6–10 amenities are available locally. Additional discontinuities are not as obvious, although a plateau can be discerned, particularly for walking/cycling propensity when 6–50 amenities are accessible locally. Approximately 30–40% of the residents of these neighbourhoods walk/cycle and 60–70% drive to reach everyday activities. When the total number of local amenities grows beyond this level, walking/cycling becomes increasingly competitive relative to the car. However, a very large number of local amenities is required before the slow modes pose a real ‘threat’ to the car. It is only when the total number exceeds 150 that a majority chooses to walk/cycle rather than drive.
Generally, the total number of local amenities appears to be a central indicator of the residents’ travel patterns. However, this figure correlates strongly with the other ways (e.g. variety and specific types) of capturing the local amenity supply, and we suspect that important variation in the relationship is hidden. To refine the analysis and attempt to isolate the effect of the specific number, variety and types of local amenities, we subdivide the data set into three parts. Based on the observed discontinuities in the binned scatter plot (Figure 1), we distinguish three types of neighbourhoods in terms of amenity supply: Areas with limited local accessibility (0–5 local amenities), Small urban localities (6–50 local amenities) and Large urban centres (>50 local amenities).
Residents living in neighbourhoods with Limited local accessibility can access an average of two amenities locally. The most common amenity accessed locally in these neighbourhoods is a durable goods retailer, school or preschool, followed by a restaurant and a grocery store. In Small urban localities, residents can access an average of 23 amenities within 1 km of home. Residents can choose from an average of over five restaurants/pubs/cafés, two grocery stores and several durable goods retailers, schools and preschools locally. However, many residents still lack a local pharmacy or liquor store. On average, eight categories of amenities are accessible locally. Those living in Large urban centres can choose from a wide range of local amenities, on average 167 amenities and 11 of the 12 amenity categories within 1 km of home. The large urban centre dwellers can choose from on average over ten different grocery stores, consumables stores, restaurants, durable goods stores and preschools locally.
Dimension reduction
As an intermediate step before investigating what number, variety and specific types of local amenities have a significant impact on travel behaviour, we performed PCA. This was done to reduce the data and identify underlying dimensions of the local amenity supply within each of the three neighbourhood types (and to avoid multicollinearity between the local accessibility variables). The general ways of describing local accessibility in terms of total quantity or number of amenity categories represented locally risks hiding important combinations and co-locations of amenities that could affect travel patterns. Certain combinations of amenities could potentially satisfy a broader range of everyday needs, while other combinations may lack key amenities that many people need to access daily. In both cases, the residents’ travel behaviour may be affected.
We performed PCA separately for each neighbourhood type. The input variables are the numbers of each of the 12 amenity categories present locally, and the analysis identifies significant underlying dimensions of the amenity supply in each area type. Each factor is labelled based on the combinations of amenity types that score high. The results for the Limited local accessibility neighbourhoods are not presented because the identified PCA factors had no significant impact on the travel activity variables in the subsequent analyses of these neighbourhoods (see section Multivariate analysis).
Concerning Small urban localities, the analysis resulted in a three-factor solution (Table 2) explaining 60% of the variance. People living in a Small urban locality with everyday amenities (i.e. scoring high on the first factor) have better local access to groceries, restaurants, preschools and schools than do people living in neighbourhoods not scoring high on this factor. A Small urban locality with retail agglomeration (the second factor) stands out for having more retailers of durable goods and clothes/shoe stores and banks, while a Small urban locality with local health facilities (the third factor) is distinguished by having more pharmacies and healthcare centres.
PCA. a
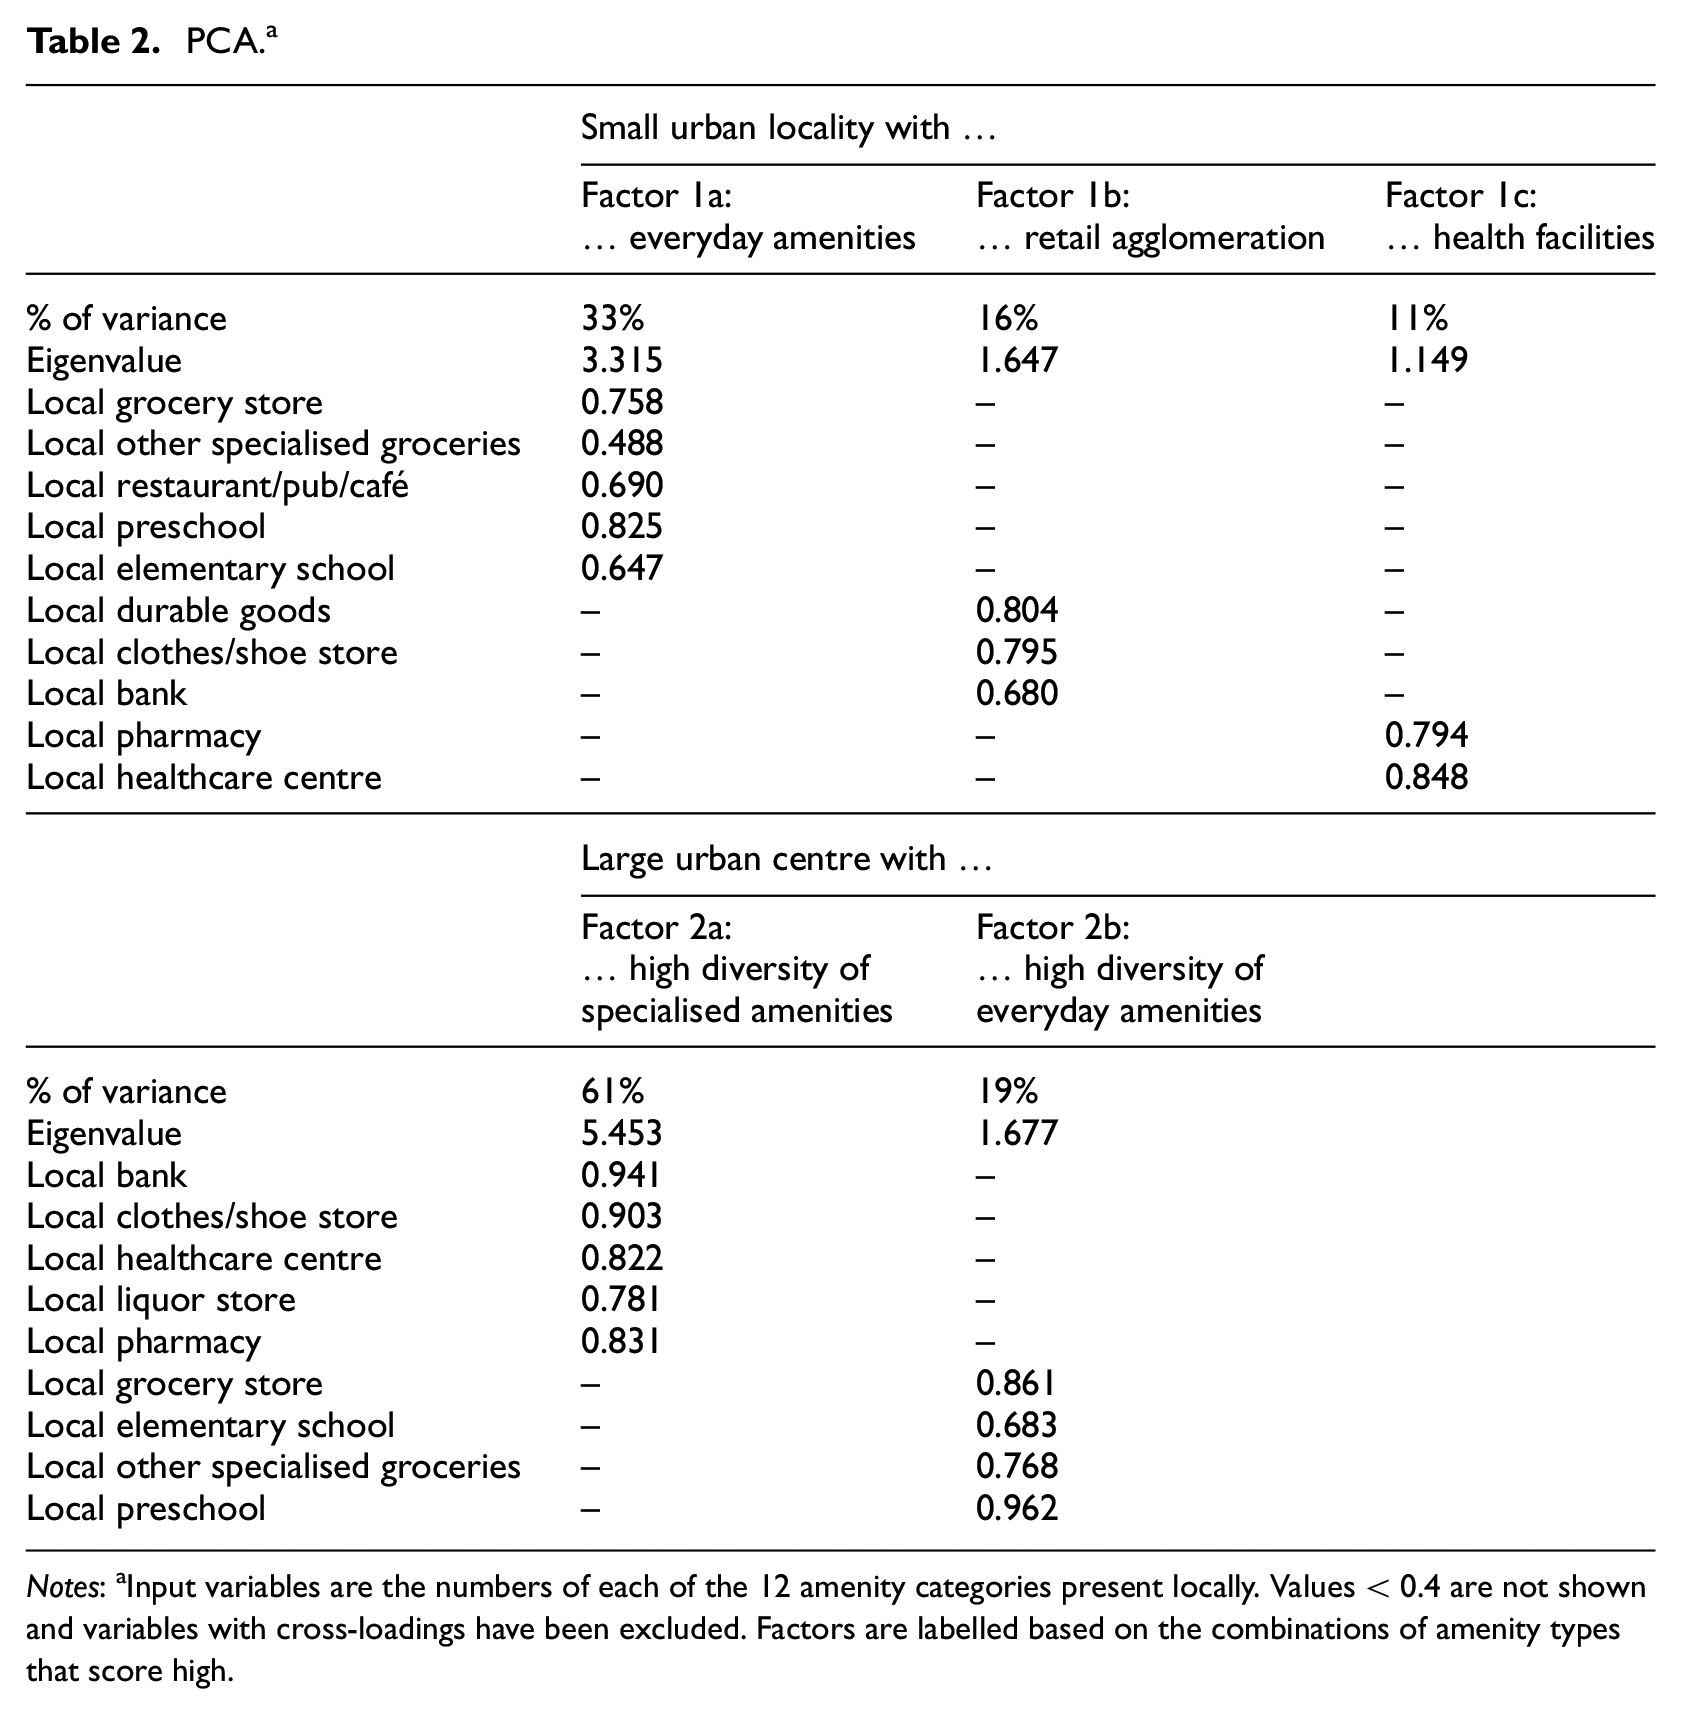
Notes: aInput variables are the numbers of each of the 12 amenity categories present locally. Values < 0.4 are not shown and variables with cross-loadings have been excluded. Factors are labelled based on the combinations of amenity types that score high.
When it comes to Large urban centres, the PCA identified two significant factors (Table 2). The first and dominant factor, Large urban centres with high diversity of specialised amenities, explains 61% of the variation and scores high for banks, clothes/shoe stores, healthcare centres, pharmacies and liquor stores. This does not mean that other, everyday amenities are absent locally, but indicates that there are not significantly more local options compared with other areas. People living in neighbourhoods scoring high on this factor can access a very wide range of local amenities. The second factor is Large urban centres with high diversity of everyday amenities. It scores high mainly on some of the most essential amenities that many people need to access daily, such as preschools and grocery stores. It refers to locations near the main urban cores with a higher proportion of housing but that are nonetheless high-density urban neighbourhoods.
Multivariate analysis
Table 3 summarises the results of the multivariate analysis of the relationships between local accessibility and sustainable travel behaviour for all three neighbourhood types. First, we analyse the Limited local accessibility category. In these neighbourhoods, it is mainly the presence of a grocery store that has a travel behavioural effect. A local grocery store increases the likelihood of walking/cycling and decreases the likelihood of making a car trip. It is the only local accessibility variable that significantly affects mode choice. Furthermore, people who can access three, four or five local amenities drive shorter distances than do those who lack local amenities altogether. Surprisingly, the presence of a local grocery store contributes to longer drives, though this effect is not significant when we omit the dummies for total number of local amenities.
Multivariate models.
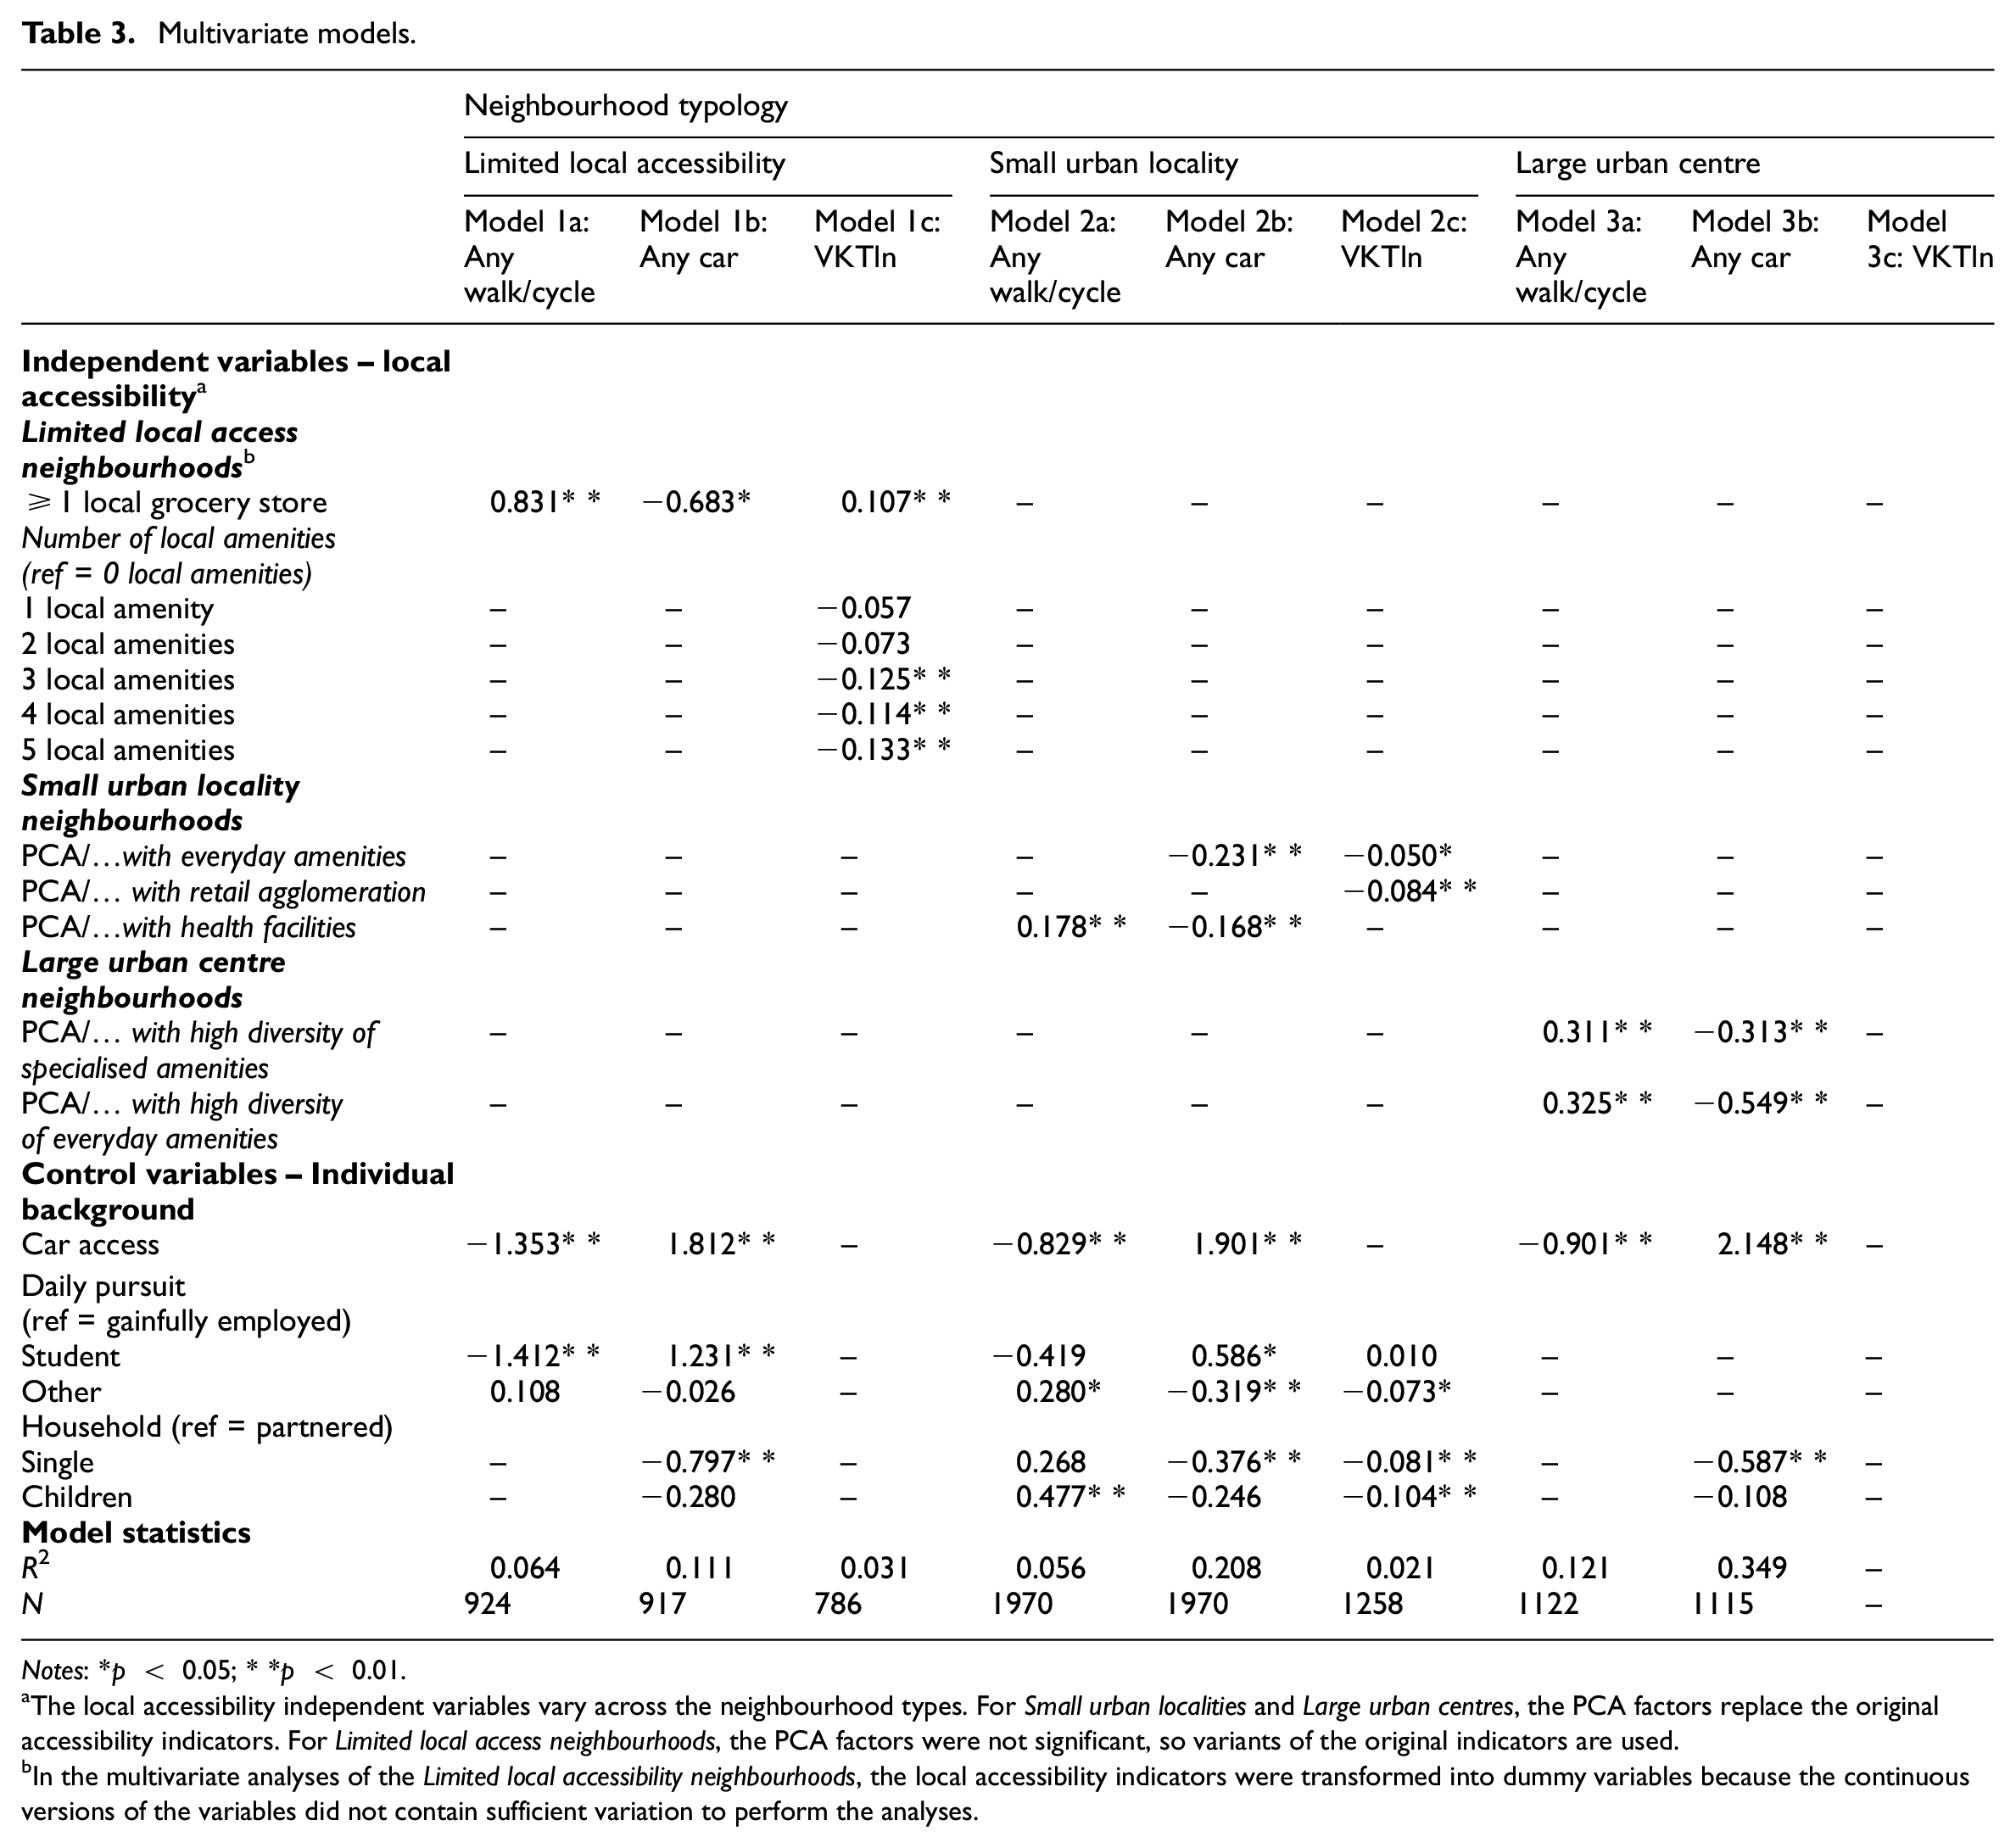
Notes: *p < 0.05; **p < 0.01.
The local accessibility independent variables vary across the neighbourhood types. For Small urban localities and Large urban centres, the PCA factors replace the original accessibility indicators. For Limited local access neighbourhoods, the PCA factors were not significant, so variants of the original indicators are used.
In the multivariate analyses of the Limited local accessibility neighbourhoods, the local accessibility indicators were transformed into dummy variables because the continuous versions of the variables did not contain sufficient variation to perform the analyses.
For the Small urban localities and Large urban centres, we ended up replacing the local accessibility indicators with the PCA factors as they contributed more to the models.
People living in areas with high scores on the factor Small urban locality with everyday amenities are less likely to drive and more likely to walk/cycle. When they do drive, the distances are shorter. Driving distances are also shorter amongst people living in a neighbourhood scoring high on the factor Small urban locality with retail agglomerations. Those living in areas scoring high on the factor Small urban locality with health facilities are less likely to drive.
Within the category Large urban centres, both PCA factors have a similar and significant impact on mode choice. Residents in areas scoring high on both Large urban centres with high diversity of specialised amenities and Large urban centres with high diversity of everyday amenities, respectively, have a higher likelihood of walking/cycling and a lower likelihood of driving.
Finally, note that the Local amenity diversity generally provided less explanatory power and is not significant after controlling for the total number of local amenities and the PCA factors. This does not mean that the diversity per se is not important. Since areas with, for example, high diversity and low amounts of local amenities or vice versa are rare, it would require considerably more observations to fully explore.
Discussion
Our analysis shows that local accessibility is central to individuals’ travel behaviour in terms of mode choice (i.e. walking/biking versus car driving) and volume of car use (i.e. VKT) for everyday activities. The presence of more amenities in one’s residential vicinity contributes to more sustainable mobility in the form of walking and cycling, and less car use. 5 However, the relationship is not strictly linear, as the analyses indicate discontinuities and plateauing in travel behaviour trends with increased local access. This corroborates previous research that also identified non-linear effects but primarily concerning standard D variables (e.g. Case, 2013; Ding et al., 2018). Our results indicate that the establishment of additional amenities in an area may have diverse effects depending on the geographical context. We observe a sharp decrease in VKT in neighbourhoods where only a few amenities are located. However, this effect disappears when the residents can access about ten amenities locally. This clear non-linearity can be set against the common assumption that a change in density always leads to a proportional change in car travel (Ewing and Cervero, 2010; Stevens, 2017). We also note a clear slowing of the change in mode choice at a similar local access level. We believe that this discontinuity appears because neighbourhoods with this level of local accessibility have reached a rudimentary basic supply of essential amenities. In these neighbourhoods, most residents can access at least one grocery store, preschool, elementary school, restaurant and some type of durable or consumable goods retailer near home. Many of these amenities are often relatively unspecialised and homogenous as regards supply and quality, increasing the likelihood that residents will choose nearby options. These findings are in line with those of, for example, Næss et al. (2019). When more amenities are added, the possible choices increase but the basic supply in terms of basic amenity categories that are locally represented might not.
Furthermore, for those who habitually reach their everyday activities by car, increased access to a larger number of local amenities has a limited impact on driving distance. Those who can and choose to drive opt out of the locally accessible amenities, preferring alternatives located farther away. However, having access to a wide range of options locally appears to affect the decision not to drive – and the ability of walking/cycling to seriously challenge dominant car use. A break-even point appears when more than 150 amenities are present in the neighbourhood, as more people then choose to walk/cycle instead of drive. Results further indicate that walking/cycling continues to increase with even higher levels of local access.
Isolating the effects of different aspects of local accessibility, including the total number, variety and importance of specific amenities, is a challenge (see also Naess et al., 2017). Substantial covariance between the accessibility variables hampers far-reaching conclusions as to whether or not any specific local access features are more important than others when the data are jointly analysed. However, by splitting the data set and analysing different neighbourhood types separately using PCA and multivariate models, we isolated the effects of some particularly important local accessibility features, adding important nuance to the research literature on the built environment–travel relationship.
In neighbourhoods with Limited local accessibility, the presence of a local grocery store is of key importance, confirming previous studies (Elldér, 2018; Lee and Moudon, 2008). It reduces the probability of car trips and encourages more walking/cycling. In the context of sparsely populated areas in Sweden, the local grocery store often plays a crucial role with multiple functions. It serves as a social meeting place and as a branch/outlet for other services (e.g. pharmacy, postal services and deliveries), likely explaining its importance for residents’ travel behaviour.
For Small urban localities and Large urban centres, PCA helped to identify local clusters and co-locations of different types of amenities that significantly affect travel behaviour. Common to several identified factors having significant effects is that they indicate a greater range of basic everyday amenities, such as grocery stores and day-care centres, and/or a greater range of specialised amenities, such as banks and pharmacies. This indicates that the residents of areas scoring high on these factors are more likely to have a wider basic supply and are not forced to leave their neighbourhoods to conduct daily errands to the same extent as are residents of other neighbourhoods. These findings also suggest that there are specific configurations of local accessibility that support more sustainable travel patterns outside of major cities. This shows that there are preconditions for less driving even in the metropolitan outskirts and in smaller cities, an issue that has received less attention in the literature (Sandow and Westin, 2010).
Our findings contribute to the general theoretical ideas presented in the built environment–travel research literature (Boarnet, 2011; Naess et al., 2019; van Wee and Handy, 2016): first, we elaborate on how the potential for sustainable travel patterns depends on the area-specific characteristics of local amenity supply in terms of the number, variety and specific types of amenities; second, we expand on the concept of discontinuities (and trend breaks) in built environment–travel relationships.
These findings also inform strategic urban policy and planning aimed at promoting sustainable mobility. Importantly, this means replacing the general understanding of densification along the lines of the compact development hypothesis with a more targeted approach. Providing a basic supply of essential everyday and specialised amenities locally – type and variety depending on area characteristics as detailed above – actually creates incentives for residents to choose walking or cycling rather than driving, contributing to lower car dependence. However, the opportunity to influence the location of various amenities differs between regulatory contexts. In Sweden, with a relatively strong public sector and land use regulation, key amenities such as schools, preschools and healthcare centres are possible to influence by planning. Most services, however, are commercial, under market influence and requiring more general measures to promote the local supply, for example by strategic infill development, ensuring that plot ratios in land use plans are sufficiently high and that ground-floor premises are preserved for retailers, and limiting external shopping centres. By inducing residents to choose local options, the urban transport system could shift in a more sustainable direction through the environmental, social and health advantages of the slow modes. Not least, neighbourhoods that contain a basic supply of amenities can reduce the prevalence of transport poverty amongst groups for whom distant options are inaccessible.
Conclusion
A key question in current policy, practice and research into urban planning and development is how urban environments can become more conducive to sustainable travel patterns. In this paper, we show that local accessibility in terms of the number, variety and specific types of amenities present in residential neighbourhoods is crucial for sustainable travel, which is often neglected given the methodological approach of many previous built environment–travel studies. If the local accessibility conditions are favourable, residents are more likely to opt out of car travel and instead use the sustainable modes of walking and cycling.
Our analysis indicates that the general assumption that the built environment–travel (i.e. VKT) relationship is linear and that change in local accessibility generates the same effect everywhere regardless of the current accessibility conditions is an oversimplification. There are important discontinuities in the relationship between local accessibility and travel behaviour. Moreover, the effects vary across different geographical contexts and different travel activity variables. This indicates the need to carefully consider the specific context being studied, to refine data sets and to refine the analysis to produce more sophisticated and relevant results than those of standard approaches.
We propose an area-specific notion of basic supply as a likely explanation for the observed discontinuities. Certain amenities, and combinations of amenities, appear to function as essentials, allowing and encouraging residents to stay local for their everyday activities, contributing to more walking/cycling and less driving. We suggest that this insight should be applied in strategic urban planning to foster sustainable transport systems and neighbourhoods.
Footnotes
Acknowledgements
The authors would gratefully like to acknowledge the valuable comments from local planners involved in the reference group of this research project, members of the Mobility research group at the University of Gothenburg, and three anonymous reviewers for comments on earlier versions of this research.
Declaration of conflicting interests
The authors declared no potential conflicts of interest with respect to the research, authorship, and/or publication of this article.
Funding
The authors disclosed receipt of the following financial support for the research, authorship, and/or publication of this article: This research was funded by the Swedish Energy Agency project number 44499-1.