
Abstract
Many North American cities are building bicycling infrastructure. Lively discussions on social media, where people passionately support or reject bicycling infrastructure projects, provide a unique data set on attitudes towards bicycling infrastructure. Our goal is to analyse social media posts in Edmonton and Victoria, Canada as new bike infrastructure was implemented to understand the thematic and social elements of the conversation and how these changed over time. We collected Twitter messages (n = 13,121: 7640 in Edmonton; 5481 in Victoria) and compared three timeframes: before lanes opened (January 2015 to lane opening); the first riding season (opening to April 2017); and the second riding season (May 2017 to November 2018). For each timeframe, we evaluated word-combination frequencies (to understand the use of language) and social network structures (to understand which accounts were influential and how they interacted). We observed a change in the three time periods. Before the bicycling infrastructure was built, Twitter activity was focused on advocacy, which was especially strong in Victoria. The first riding season had the most social media activity, the most diverse perspectives and the most controversy. The second riding season held more support. Based on the Twitter activity, we found that Edmonton had more support from local businesses and traditional media, launching a connected network of infrastructure with less social media opposition. Our results suggest that attitudes associated with change in bicycling infrastructure may have a cycle, with initial negative responses to change, followed by an uptick in positive attitudes.
Introduction
Widespread acceptance of new bike infrastructure and the practice of bicycling depends on socio-political and cultural context (Aldred and Jungnickel, 2014; Wild et al., 2018). The construction of bike infrastructure may re-allocate public space, financial resources and political priority previously dedicated to automobile travel, and this may be viewed as a challenge to social values (Wild et al., 2018). Field et al. (2018) characterise the implementation of bike lanes as a ‘socio-technical disruption’ that incorporates ‘a range of policy, regulatory, and design elements that confront existing power dynamics and values’. Thus, commentary around new bicycle infrastructure can be highly politicised.
Transportation in cities is often discussed on Twitter. Urban informatics of social media streams may allow researchers to understand demands, challenges and opportunities (Nik-Bakht and El-Diraby, 2016). Further, younger demographics who are engaged on social media are often under-represented in traditional public hearings for planning projects (Einstein et al., 2019). As such, Twitter may provide a venue to capture voices that have been missing from the planning process or even as a consultation platform to inform policy.
Our goal is to understand how discourse on social media varied over the period of implementation of new bicycle infrastructure projects in two Canadian cities: Edmonton, Alberta and Victoria, British Columbia. These two Canadian cities had high-profile openings of separated bicycle lanes in their downtown cores in 2017. We collected and analysed relevant social media from Twitter before, during and following the opening of new bicycle lanes in order to understand the thematic and social elements of the conversation, and how they changed over time. Specifically, we characterise what bicycling themes were discussed; evaluate the language used to discuss new bicycle infrastructure; identified how influential Twitter accounts interacted with each other; and evaluate how these changed over time. This analysis seeks to provide insight into social media activity in the process of cities building new infrastructure and how city planners can use social media to anticipate and monitor public opinions and experiences.
Literature review
Attitudes toward bike infrastructure
Bike lanes represent more than new infrastructure. Attitudes towards bike lanes can relate to social identity, the social meanings of driving, bicycling and city space (Vreugdenhil and Williams, 2013), perceptions about the characteristics of the people using bike lanes and perceptions about the type of city that builds them (Yoder and Johnstone, 2018). Accordingly, attitudes towards new bike lanes can be complex. They may change over time. For example, Crane et al. (2016) found that before and after the construction of protected bike lanes in Sydney, Australia, retailers stated concerns about lost parking in interviews before construction but not after. Wild et al. (2018) summarised negative perceptions of bicycle infrastructure as ‘bikelash’, and suggested these perceptions originate from four different sources – retailers, who worry about loss of business because of perceived lack of parking; conservative voters; opposition to gentrification; and disaffected cyclists. The socio-political underpinnings of a seemingly exaggerated response to bike lanes (coined ‘white line fever’ by Vreugdenhil and Williams, 2013) as political barriers often limit what new bicycling infrastructure can be built in communities (Aldred et al., 2018). Organised opposition to new protected bike lanes and the broader societal impacts in car-centred societies has only been studied in a limited number of cities (Crane et al., 2016). Social media research methods can increase the number and geographic spread of studies into new protected bike lanes.
Social media and urban transportation planning
For transportation planning, social media analysis has been used to capture voices, experiences and themes of discussion that are missing from traditional approaches. For example, with respect to public transportation, Schweitzer (2014) found that sentiments on Twitter in relation to public transit (and public transit users) were more negative, compared with those made towards other public-service agencies; however, transit agencies who interacted with system users (e.g. answering questions and responding to comments) had more positive outcomes. Therefore, there are feedback loops between the actions of transportation agencies, the attitudes of users on social media and potentially stakeholder support for new projects. Understanding these interactions may help inform social media strategies for transportation agencies that do not further feed negative attitudes towards new bike lane projects. In addition, city planners can collect and analyse discussions on social media more rapidly than using traditional surveys or focus groups. Social media research can capture themes and language used (e.g. through natural language processing; Manning and Schütze, 1999) and how information is shared (e.g. though social network analysis; Himelboim et al., 2017). Building on this emerging public transit research, social media analysis of Twitter data may provide a platform to better understand attitudes and concerns for new protected bike lane projects in cities.
Material and methods
Study areas
Edmonton, Alberta, Canada has a population of 1,321,426 (Table 1). Edmonton has a temperate continental climate with a wide range of temperatures and substantial snow and ice in the winter. Edmonton is notable for having extensive urban parks in the river valley and a large network of multi-use trails within the city. Compared with other Canadian cities of similar size, in the mid-2010s Edmonton had few painted bike lanes or other types of infrastructure outside of the urban parks prior to the bike grid implementation. In Edmonton, a grid of downtown bicycle lanes opened starting on 16 June 2017 through July 2017 totalling 7.6 km.
Summary statistics to provide context for the two cities.
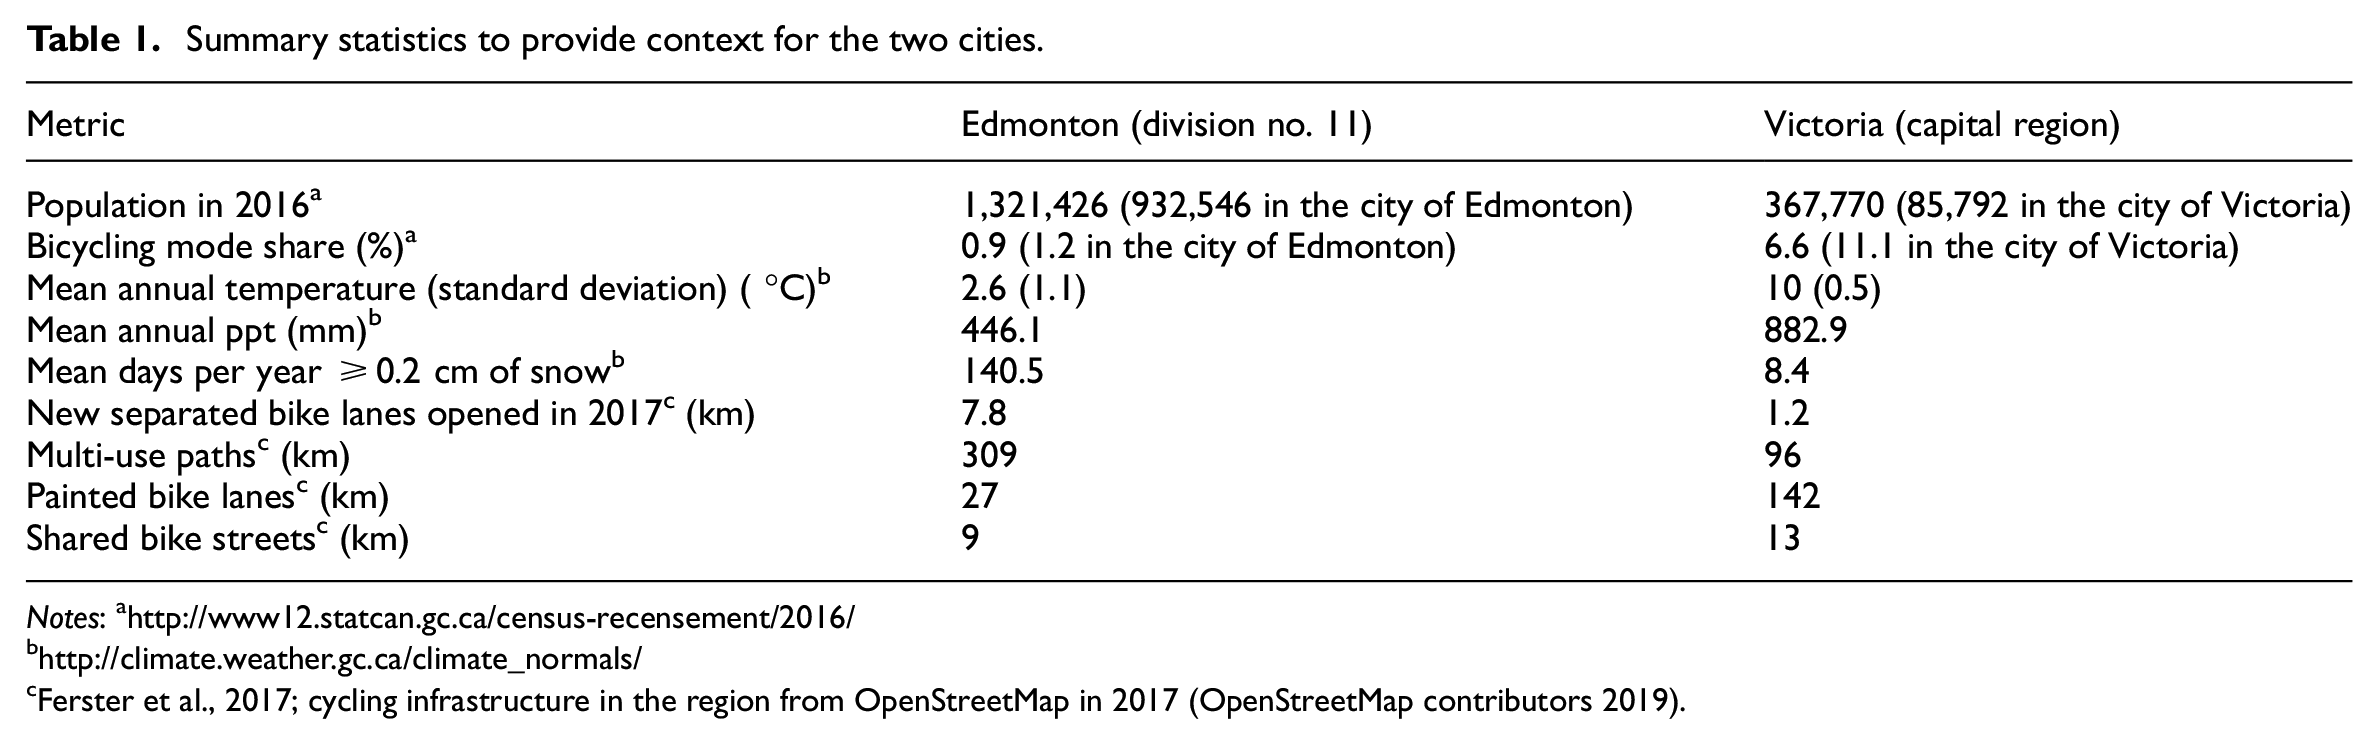
Ferster et al., 2017; cycling infrastructure in the region from OpenStreetMap in 2017 (OpenStreetMap contributors 2019).
Victoria, British Columbia, Canada has a population of 85,792. Victoria experiences a Pacific Maritime climate with few days of snow and ice accumulation and a smaller seasonal temperature range than Edmonton. Victoria has a high bicycle mode share relative to other Canadian cities. The Greater Victoria area is noted for having converted abandoned rail beds into multi-use trails leading into the city and has a reputation as a bicycling city, yet there has historically been very little bicycling infrastructure in the urban core. In Victoria, a 1.2 km protected bike lane was opened on Pandora Avenue on 1 May 2017 and a second opened on Fort Street on 27 May 2018. In both cities, there were plans to expand all-ages-and-abilities bicycle networks in the near future.
Twitter data collection
We collected data before and after the protected bike lanes opened in the two study cities. We used two search strategies for the different time frames. We collected data before the protected bike lanes opened using the Twitter advanced search and we collected data after the lanes opened with the Twitter Search application programming interface (API). In both cases, we developed a basic search format for Twitter that consisted of (1) geographic keywords and (2) commonly used theme keywords for bicycle infrastructure (Table 2). We included terms to remove other locations with the same names (e.g. the state of Victoria, Australia). We chose the geographic keywords approach because it returned substantially more results than the geofence approach in our study areas. Twitter data retrieval is subject to internal filters that return a subset of data that is biased towards the most influential accounts (González-Bailón et al., 2014). Therefore, our analyses focus on the most central accounts in these discussions.
Geographic keyword search for bicycle infrastructure themes in Twitter data.
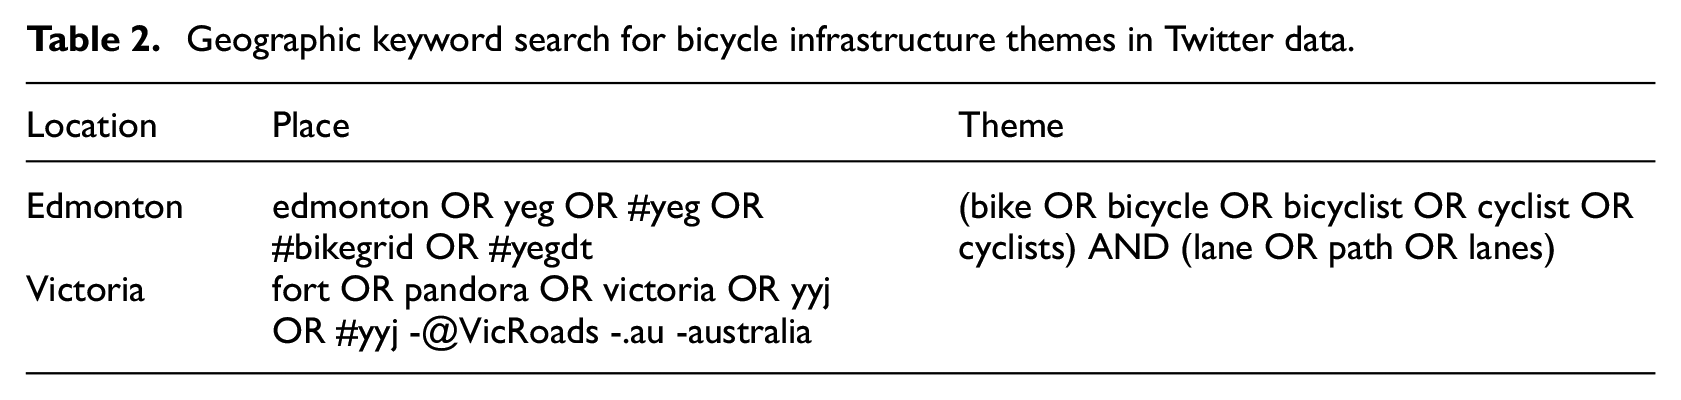
We collected data from January 2015 to the opening of infrastructure in each city (16 June 2017 in Edmonton and 1 May 2017 in Victoria) using the advanced search method (retrospective), and from the opening dates to 8 November 2018 using the search API method (prospective). Starting the same week that the first protected bicycle lanes were opened in each city, we used the TAGS application (Twitter Archiving Google Sheet, available at: https://tags.hawksey.info/), which uses the Twitter Search API within a Google Spreadsheet (available at: http://sheets.google.com). We set the parameter for maximum Tweets returned within the hourly searches to 17,000 and, given the volume of Tweets on this topic, the limit was not reached (we collected a maximum 200 Tweets in one day). A secondary search phase was conducted using the Twitter Advanced Search to fill in activity before we started collecting data using TAGS. In the Advanced Search approach, the same queries were executed using the advanced search in Twitter and Tweet IDs were recorded. The advanced search does not return retweets (only original Tweets and a count of retweets). Therefore, caution is warranted for comparing data from before the bike lanes were open with the other timeframes. We used the Tweet ID to collate unique Tweets. For each unique Tweet ID, we collected the Tweet using the Search API and the package rTweet version 0.6.4 (Kearney, 2018).
Data processing
We wrote search expressions to identify and remove Tweets from other locations with similar names (e.g. Victoria Street in Philadelphia, Fort Collins Colorado and Edmonton Trail in Calgary, AB). Counts were made of original Tweets by day and authors created thematic annotations based on message text. We compared data across three timeframes: (1) before the new infrastructure opened (January 2015 to lane opening dates: 16 June 2017 in Edmonton and 1 May 2017 in Victoria); (2) first riding season (opening dates to 29 April 2018); and (3) second riding season (May 2018 to November 2018). In both cities we observed an increase in bicycle trips in May, which we considered the start of the riding season (Eco Counter, 2018; Urban Analysis, 2018). We used the R package tm (Feinerer and Hornik, 2017) to calculate the frequency of word pairs (bigrams) for each of the timeframes. For the bigrams, we removed non-English characters, punctuation and common stop-words, and we combined common proper pronouns and very common word combinations using an underscore (e.g. bike_lanes and pandora_avenue). Finally, for each of the timeframes, we used iGraph (Csárdi and Nepusz, 2014) to create social network graphs for the ten accounts with the highest total degree (count of mentions, retweets and replies), colour based on modularity class (accounts that interacted similarly are shown in the same colours, as seen in the online version of this paper), and a Fruchterman-Reingold layout (accounts that interacted similarly are located closer together). We calculated network metrics using iGraph to help classify and understand social network structures. For interpretation, we identified the roles of accounts (e.g. politicians, advocates, etc.) based on public Twitter profiles.
Results
We collected 13,121 Tweets from January 2015 to August 2018 (Table 3). For both cities, the number of original Tweets peaked at the opening of the first protected bike lanes.
Count of Tweets by city and source.
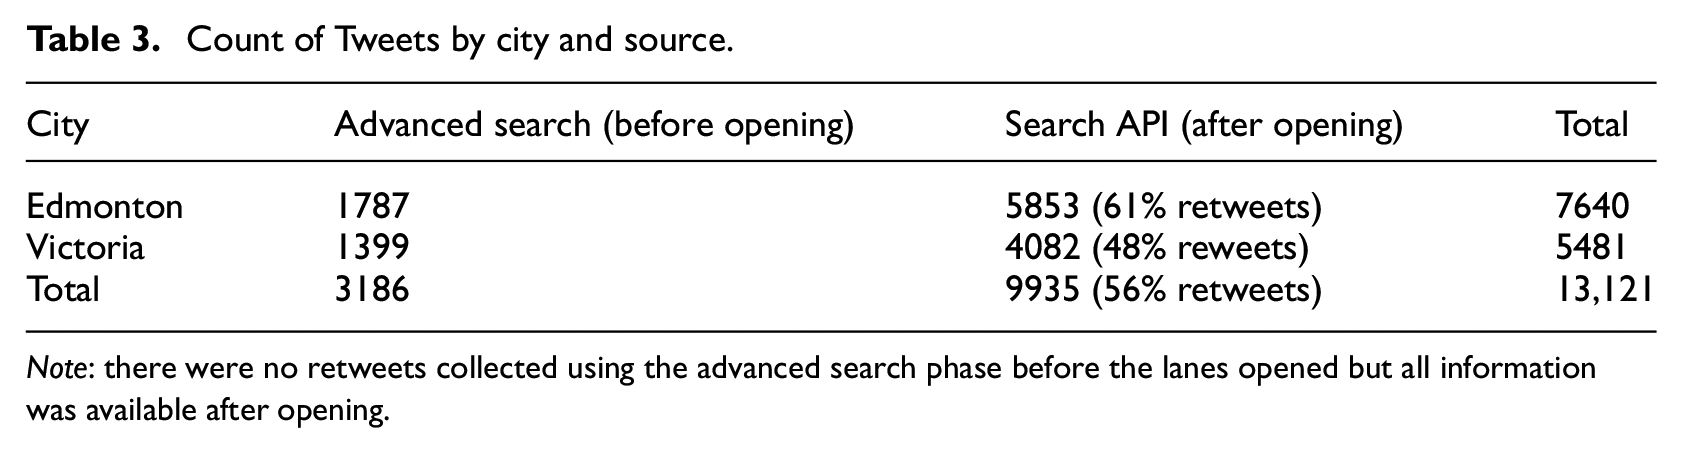
Note: there were no retweets collected using the advanced search phase before the lanes opened but all information was available after opening.
Annotated timelines
As a first step to summarise the sequence of events and themes that corresponded with Twitter activity, we reviewed the text, links and other media posted during peaks in Twitter activity and labelled the main topics of discussion. Based on our analysis, we constructed a timeline of the main events discussed on Twitter (Figure 1). Our data collection started around the time that both cities released plans for protected bike lanes. The first timeframe was marked by challenging circumstances in both cities leading to calls for improved infrastructure by bicycling advocates. The City of Edmonton made a controversial decision to remove two painted bike lanes in an industrial area. Both cities had unofficial protected bike lanes prior to the opening of the official infrastructure. In Edmonton, a ‘guerrilla bike lane’ was installed illegally and soon after removed by city crews. In Victoria, the ‘pop-up bike lane’ was sanctioned by the city and installed in front of city hall to generate publicity. The guerrilla bike lane generated more discussion on Twitter. In Victoria, there was a fatal crash involving a female cyclist who was struck by a driver in a delivery truck. The guerrilla bike lane in Edmonton and the fatal crash in Victoria preceded periods when there were widespread calls by bicycling advocates for new infrastructure.
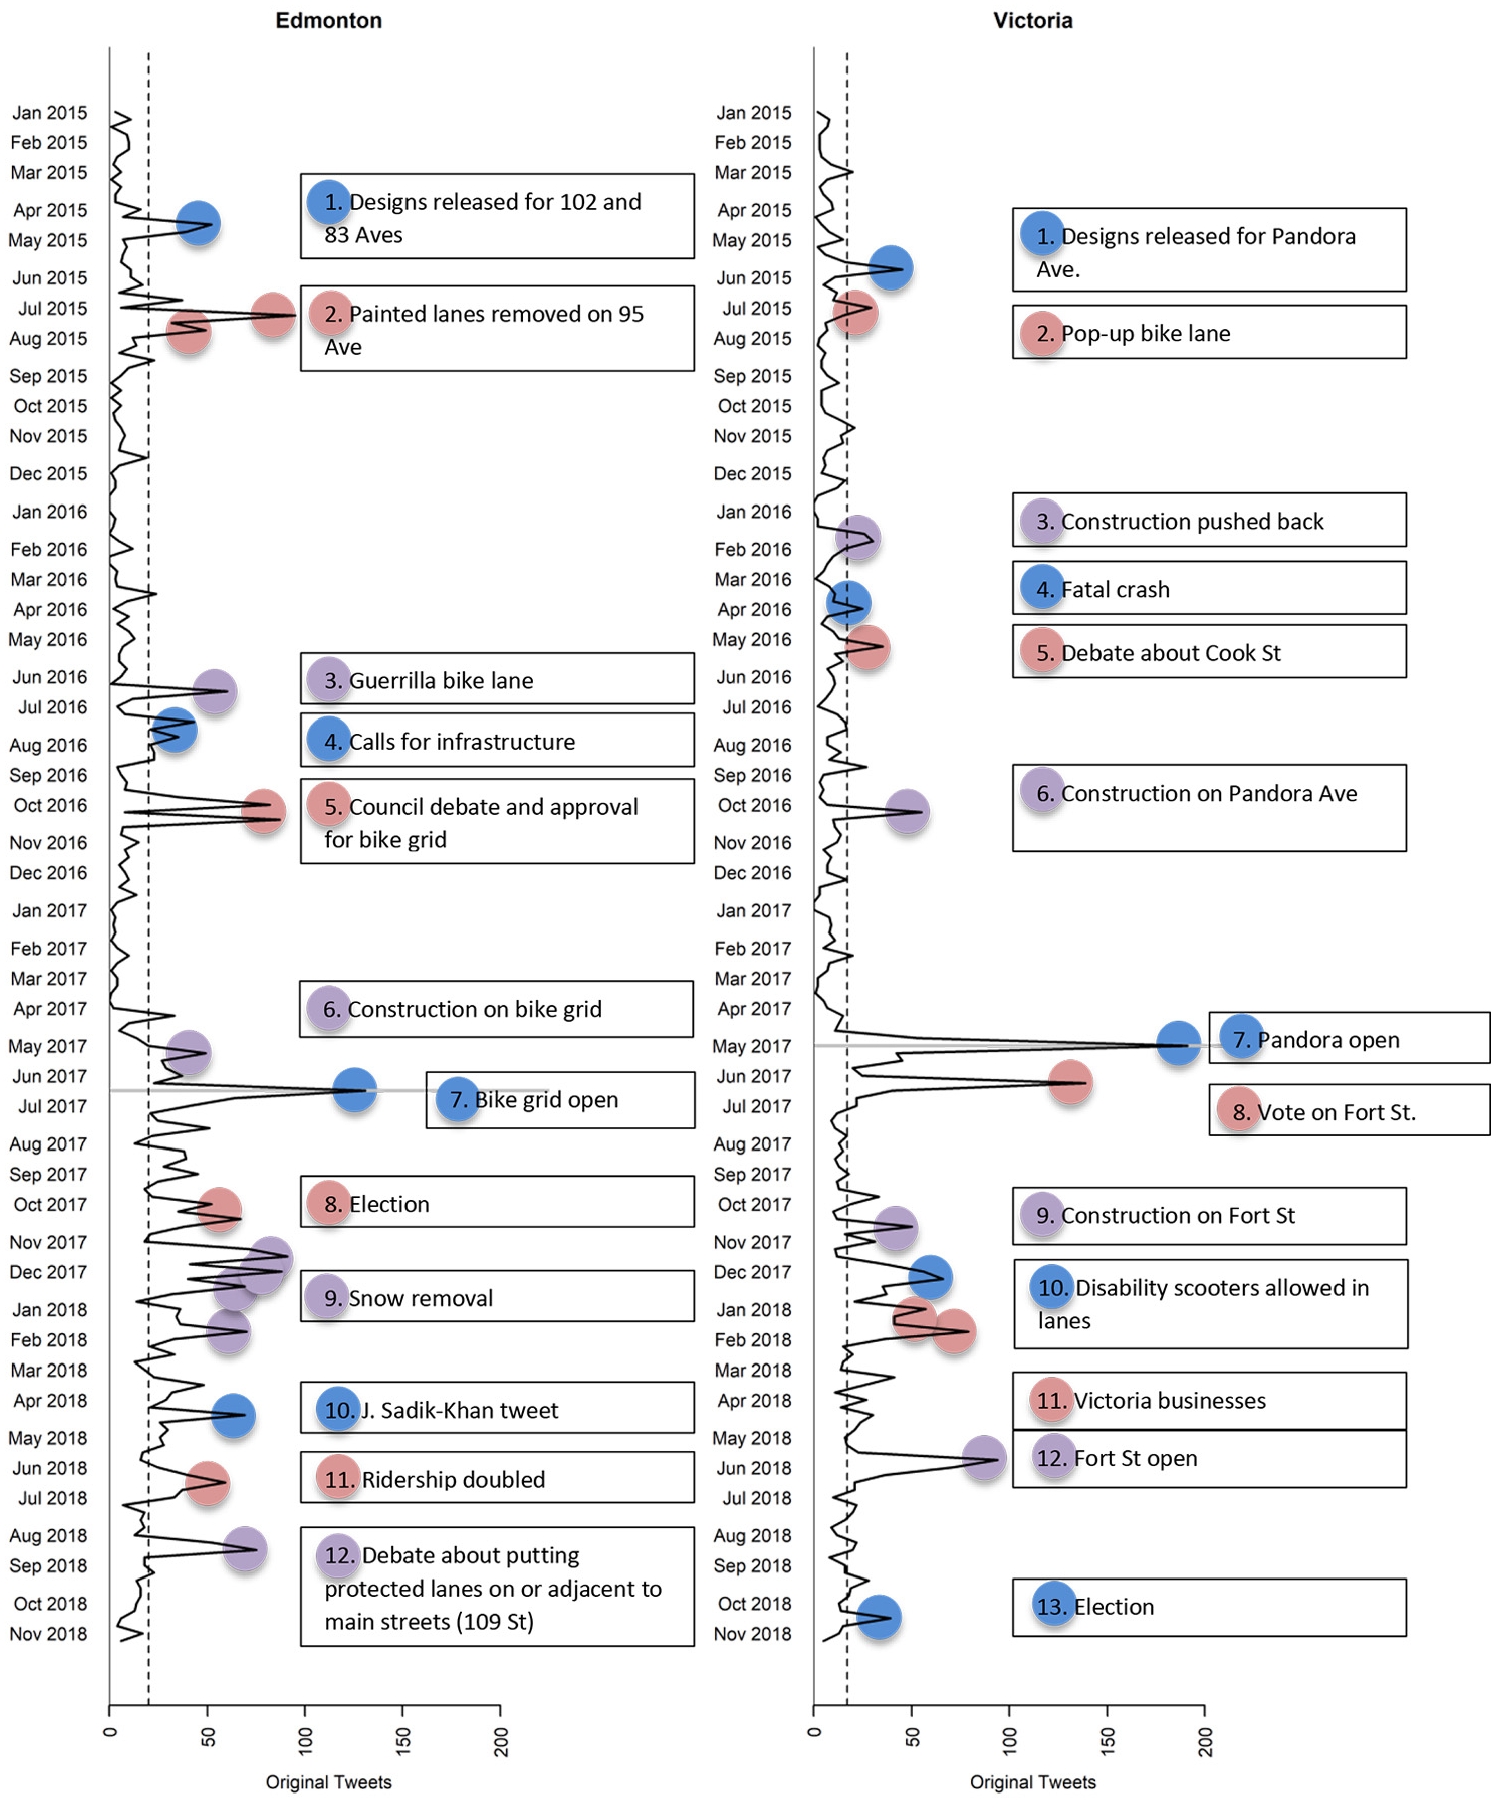
Timeline of original Tweets for Edmonton and Victoria. The mean weekly original Tweets for each city are shown using a vertical dotted black line, and the timing of the first new protected bike lane opening is given using a horizontal solid grey line. The repeating three-colour-scheme identifies the label for each peak in Tweet counts.
A major difference in the implementation of the protected bike lanes was that Edmonton constructed a grid of bike lanes nearly simultaneously, while in Victoria, two parallel protected bike lanes were opened a year apart (Pandora Avenue in May 2017, and Fort Street in May 2018). As a result, Victoria had a staged discussion on Twitter, with a similar discussion pattern continuing to unfold on Twitter during the first riding season as had occurred during the pre-opening phase.
In Edmonton, winter cycling was widely discussed in the first winter season (2018) with some opposition framed around winter conditions and snow clearing priority (‘The latest #yeg bike lane backlash has to do with the city’s snow clearing efforts…’ @ RobWilliamsCTV 931168144516886529). Edmonton was also a topic of discussion at the 2018 Winter Cycling Conference. Near the end of the timeline, a debate opened in Edmonton about whether new protected bike lanes should be placed on or adjacent to main commercial streets. Also, in Victoria, earlier in the timeline, there was debate about installing a protected bike lane on Cook Street that met organised resistance from local business owners.
Both cities had elections in the study period. Twitter activity was noticeable but less intense than at other times in the study period. In Edmonton, the election occurred in the first riding season, while in Victoria the election occurred in the second riding season.
We observed an increase in bike-lane-related Twitter activity over the three timeframes (Table 4). The first riding season had the most activity. The rate of activity in the second riding exceeded the timeframe before the bike lanes were installed.
Selected timeframes for Edmonton (Edm) and Victoria (Vic).
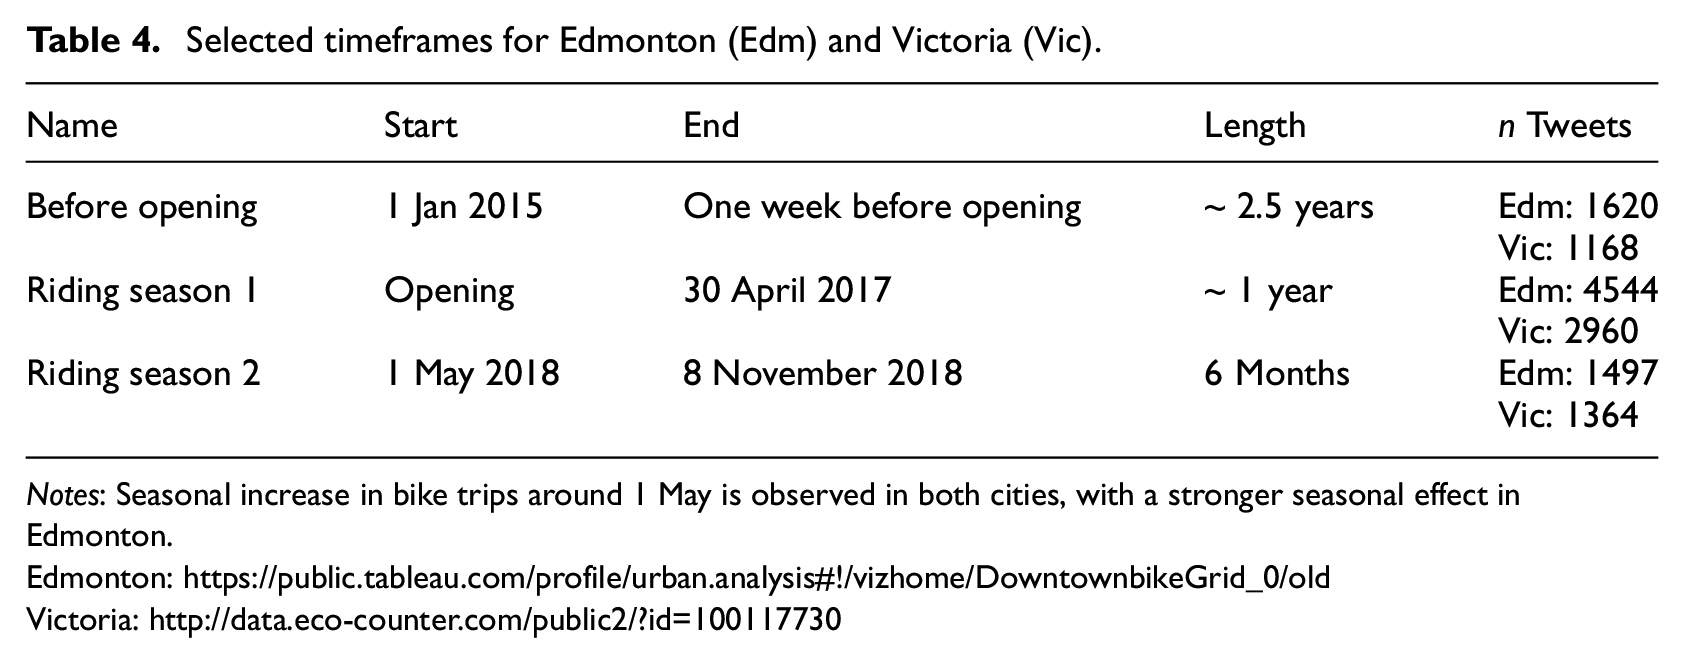
Notes: Seasonal increase in bike trips around 1 May is observed in both cities, with a stronger seasonal effect in Edmonton.
Word combination frequencies
To understand the language used to describe the new bicycle infrastructure projects and how it changed over time, we evaluated the frequency of word combinations for the three timeframes.
Before opening
The bigrams showed controversy before the protected bike lanes were installed (Table 5a). In Edmonton, there was discussion about the ‘bike_lane removed’ (a painted bike lane in an industrial area) and as a result the city had to forfeit a national ‘safety award’. In Victoria, there was discussion about ‘cycling crashes’ after a ‘woman [was] killed’ in a collision with a ‘delivery truck’. After organised opposition to plans to expand bicycling infrastructure, there were calls to ‘boycott…’ ‘Victoria businesses’ that opposed the plans.
Top five word pair frequencies.
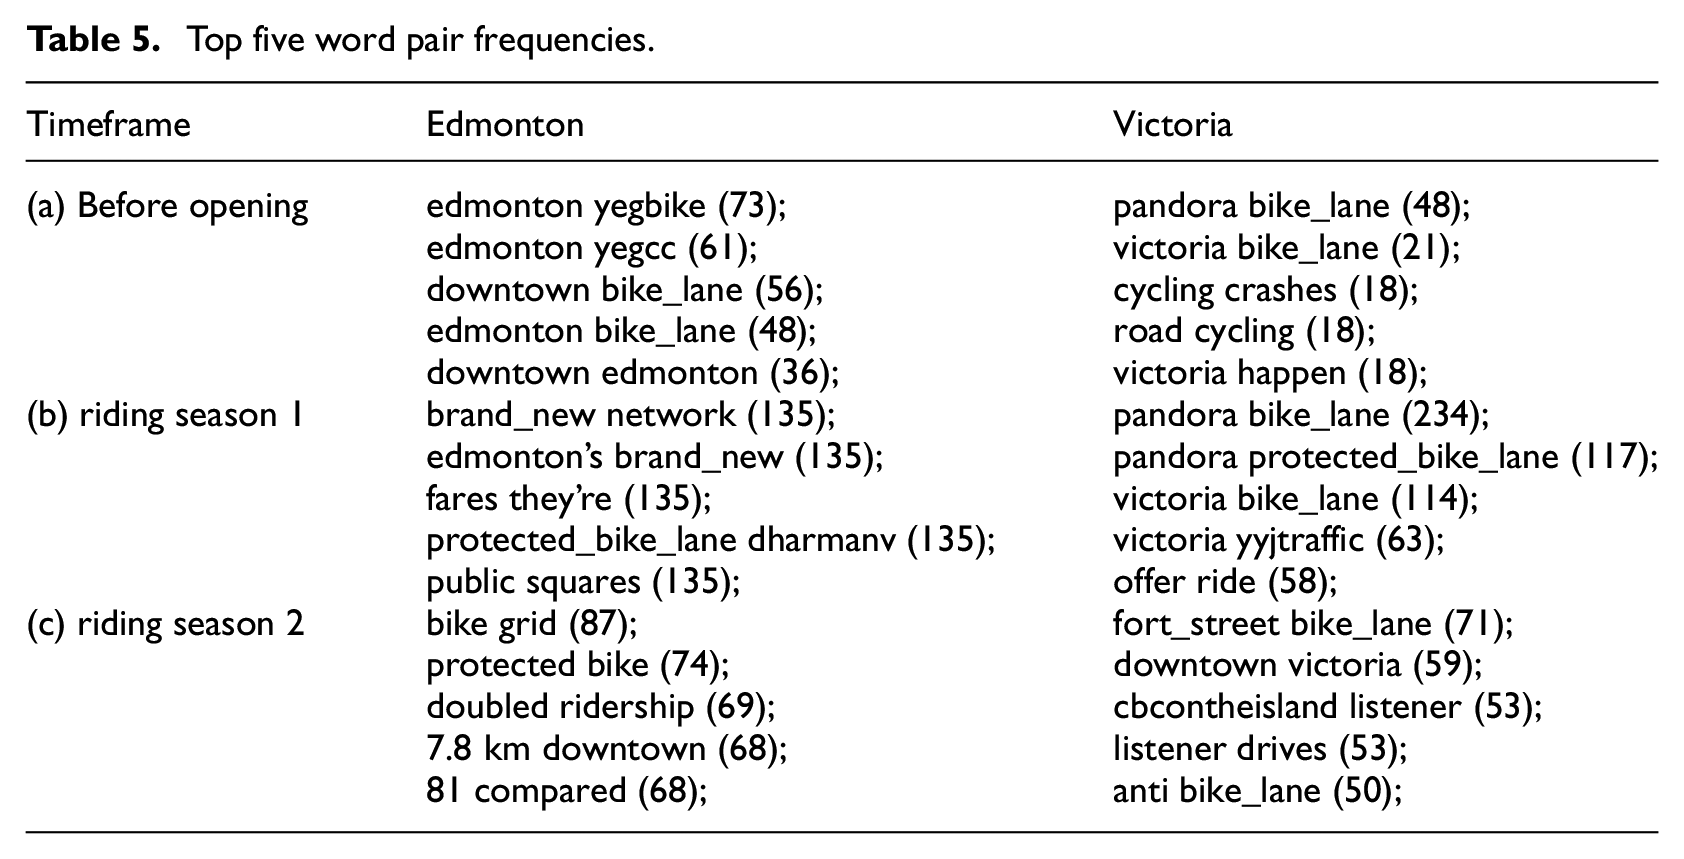
Different language was used to describe similar infrastructure in the two cities: in Edmonton, the project was branded as ‘bike grid’; in Victoria the project was branded as ‘Biketoria’ (which was later abandoned as being too narrow and divisive).
First riding season
In the first riding season (Table 5b), the infrastructure was described as a ‘bike_lane network’ in Edmonton, while individual lanes were mentioned by name in Victoria. In Victoria, the discussion centred on Pandora Avenue, but expanded to include Fort Street.
In Edmonton, several widely shared Tweets around the time of the election dominated the discussion: @JSadikKhan Tweeted ‘The streets we need are more than bike lanes or new trains, public squares or taxi fares. They’re about the people – and the people here are ready to #streetfight. Amazing to see Edmonton’s real-time evolution from a city of cars to #ACityforLife’ (985640514346192896). @modacitylife Tweeted ‘Emboldened by Edmonton’s brand-new network of protected bike lanes, @dharmanv and his one-year-old son left the car in the driveway this Christmas, and started a delightful new family tradition’ (944331580981460992). Given the large followings of these accounts for transportation planning enthusiasts, these Tweets likely reached audiences both within the city of Edmonton and beyond. In Victoria, a widely shared Tweet by @Burgundavia mentioned children using the bike facilities ‘Something I never saw on Pandora before the protected bike lane – kids’ (868154995744489472). Bike lanes were cited as being important for retaining the youth and businesses. In Edmonton, there was a large increase in mentions about parked vehicles obstructing the bike lanes.
In Victoria, word combinations such as ‘hurt business’ were in relation to statements such as ‘Businesses on Pandora say the bike lanes there have not hurt business’ (@CTVNewsRob 984526556545470464). A widely shared example was a restaurant that opened a ‘ride through’ window.
Second riding season
In the second riding season (Table 5c), the ‘bike grid’ in Edmonton was celebrated for ‘doubled ridership’ and some people said it was ‘directly related’ to people’s decisions to ride. In Victoria, Fort Street took first position as the most discussed protected bike lane, and there were more mentions of an ‘AAA (all ages and abilities) connected’ network. In Victoria there was a civic election in this time period and there was discussion about the different ‘bike_lane voices’, some that were ‘anti bike_lane’ and others that are ‘bicycle friendly’. Another widely shared Tweet said ‘This @CBContheisland listener drives a truck in downtown Victoria. On protected bike lanes, he’s turned from an opponent into a supporter’ (@GregorCraigie 1003628157193289728).
Social network graphs
To understand which Twitter profiles were influential, how they interacted with each other and how this changed over time, we evaluated the social network graphs. The social network graphs show connections between accounts based on mentions, replies and retweets. The network structure can be interpreted visually and statistically based on the strength and alignment of these connections (Himelboim et al., 2017).
Before opening
In the first timeframe, important accounts included bicycling advocates, local media, the city Twitter accounts and each city’s respective mayors (Figure 2a). Most of the activity was directed towards the cities’ accounts and the mayors’ accounts (rather than outwards from the mayors actively taking part in the discussion). Advocates in Victoria were more interconnected (more mentions) than in Edmonton. Edmonton had a clustering coefficient of zero (indicating that accounts shared few mutual connections), in contrast to Victoria’s relatively high clustering coefficient of 0.7. Edmonton had multiple advocacy groups (@pathsforppl and @edmontonbicycle), while Victoria had one (@gvcc). Local media were generally not connected with other accounts in the network (they functioned as isolates).
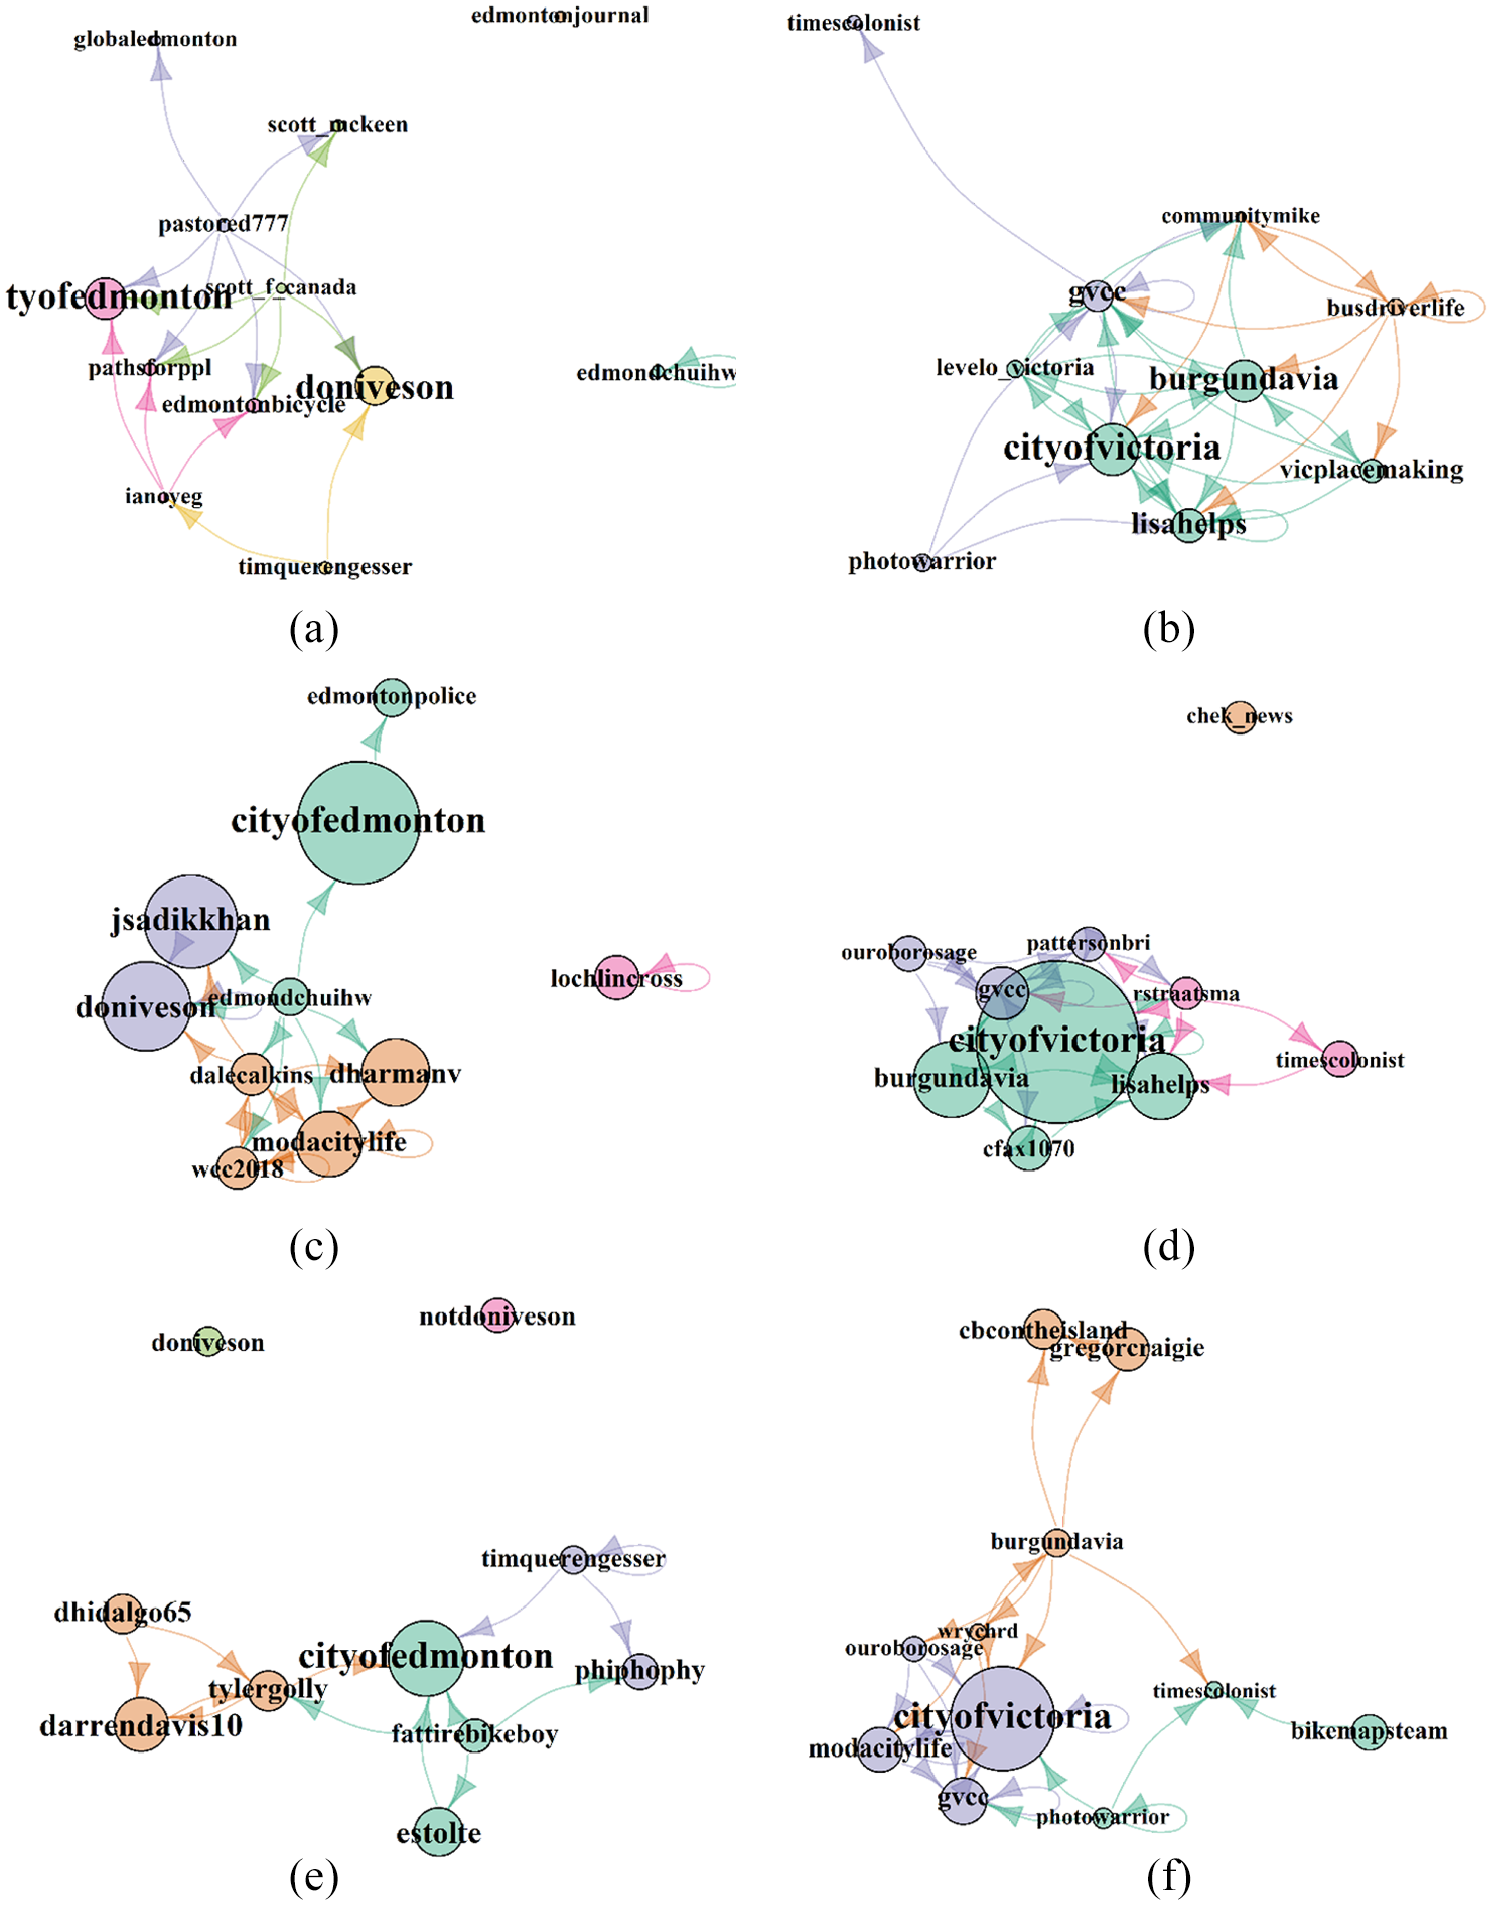
Social network graphs for Edmonton (left column) and Victoria (right column) for each timeframe before opening (a and b), riding season 1 (c and d) and riding season 2 (e and f).
First riding season
In the first riding season, there was more bicycling-related Twitter activity (Figure 2b). Each city’s Twitter account grew to be the most important in their respective networks, as they functioned as hubs to disseminate information (the local police departments were also involved in this role) and were mentioned in Tweets. Both mayors were important in the discussion but mostly through passive mentions (i.e. other accounts making mentions, rather than active posts, retweets or replies in conversations). In Edmonton, the bicycle advocates were supplanted by planners. In Victoria, the same advocates held their place in the network. In Victoria, news media become relatively more important, functioned as hubs for discussion and had more connections with other parts of the network. In both cities radio stations or personalities (@lochlincross in Edmonton and @cfax1070 in Victoria) functioned as the hubs where most of the critique originated. The clustering coefficients indicated that Victoria was slightly more connected than Edmonton (0.64 in Victoria versus 0.60 in Edmonton) and that Victoria was less clustered than before the protected bike lanes opened.
Second riding season
In the second riding season, the city accounts remained important, but the mayors’ accounts were much less important (Figure 2c). This was despite a civic election in Victoria. In Edmonton, the mayor’s official @doniveson account was overtaken by a spoof account @NotDonIveson. In Victoria, many of the same accounts were active in both seasons. In Edmonton, some of the long-term advocates gained a higher prominence in the network. Once again, Victoria had a higher clustering coefficient (0.5 in Victoria versus 0.39 in Edmonton), but both cities had a lower clustering coefficient than during the first riding season.
Discussion
We found an active and evolving social media discussion about bicycling infrastructure in Edmonton and Victoria. As a platform that flourishes for ‘massively shared experiences’ (Sarno, 2009), Twitter provided a lens to study attitudes related to the opening of new protected bike lanes. Using these data, we were able to collate timelines of events, review linked media and read personal commentary for details, and gauge how salient topics and sources were based on the amount of retweets, link sharing (along with a quotation or commentary related to the link) and commentary. We found several key uses of Twitter by players: (1) bicycle advocates, who were well connected and had been involved in discussions for long periods of time; (2) information sharing by local government; (3) traditional news media, through link sharing in institutional social media use; and (4) retweeting, link sharing and casual commentary by the public. Attitudes were expressed by the language used, the types of articles that were shared and the topics and opinions that were widely retweeted. These topics changed through our study period and this evolution may offer lessons for policymakers.
The three timeframes we looked at had different characteristics, which demonstrates that the conversation changed over time, from one more centred on advocacy to one of more acceptance. The timeframe before the lanes were opened was characterised by advocacy directed towards city governments and elected officials, sharing pro-bicycling promotional material, releasing designs, serious crashes and planning decisions related to insufficient infrastructure. In the first time period, Victoria had the characteristics of a ‘small world’ social network (Himelboim et al., 2017), where strangers are linked by common acquaintances, forming cliques. In the first season after the protected lanes opened, cities became the most important nodes in the networks as they shared information; newspapers shared articles documenting events that were shared by diverse audiences on social media, including many who were not involved in the discussion before; the language used to describe the infrastructure changed (e.g. Victoria dropped ‘Biketoria’ branding). The second riding season had some lingering controversy but had widespread sharing of comments indicating acceptance of the new infrastructure. The social network graph in Victoria was more connected than in Edmonton. In both cities, the network clustering coefficient decreased between the first and second riding season, indicating more diversity as new people entered the conversation about bicycling on Twitter.
One main difference between the two cities was that from the outset, Edmonton had much more support from local business, with the endorsement of the downtown business association and a local industry partner (a consulting firm) who partially funded (50%) and conducted the viability studies (Stantec, 2016). It is unlikely that the business support originated on (or could be predicted from) activity we observed on Twitter. Business support may have been led by motivated individuals in the business community (e.g. at Stantec or in the downtown business association) or other factors. In contrast, some local businesses in Victoria formed early organised opposition, especially in the Cook Street Village area. Partly related to this resistance, the policy decision made in Victoria was to deploy protected bike lanes one-street-at-a-time in places where there was the least resistance from business, while in Edmonton a connected grid was launched in a single riding season and was considerably longer than in Victoria (7.1 km versus 1.2 km). The protected bike lanes built in Victoria were more permanent structures consisting of concrete curbs with aesthetic treatments than the quick build seen in Edmonton. Launching the entire grid at once might have helped protect the bike lanes if Edmonton had a change in political power in the election that occurred in the first riding season. Previous research has shown that there are significant safety advantages for connected networks of bike infrastructure (Marqués and Hernández-Herrador, 2017). In addition, we observed that simultaneous broad-scale deployment of bicycling networks may provide the additional advantage of avoiding repeated social media controversy for each new phase of construction. However, the permanency of the bike lanes in Victoria would also protect them to some extent from future changes in political will. Likewise, references on Twitter in Edmonton were not directed towards one particular street but the entire grid or network. We observed that in Victoria, after the facilities on Pandora were built, in the second year the same patterns of discussion were echoed for Fort Street.
Policymakers are influenced by public opinion, so as public perceptions turn negative, political will to implement projects that are beneficial for public health, sustainability and population growth may evaporate. Overcoming the financial, political and public opinion barriers to building bicycling infrastructure usually requires a political champion (Aldred et al., 2018). Opposition to the new bike lanes was observed in both cities. In Edmonton, tacks were found in the new protected bike lanes as a physical act of opposition (‘Just took 44 tacks off the 102 Ave bike lane between 106 St and 107 St...’ @Kub64, 1026211824646029313). Four typical sources of backlash to bike lanes (‘bikelash’), include businesses, political conservatives, anti-gentrification advocates and disenfranchised cyclists (Wild et al., 2018). While we did not find widespread opposition from anti-gentrification advocates or disenfranchised cyclists, most of the opposition we observed was related to local business (which was politicised in local elections, discussed later). Scepticism or opposition to bike lanes from the business community often stems from a belief that their business model is dependent on an automobile-oriented customer base (Clifton et al., 2013). A survey of downtown Victoria merchants conducted by the Greater Victoria Cycling Coalition found that the majority underestimated how many of their customers arrived by bike (Straatsma and Berkout, 2014). Similarly, Crane et al. (2016) found that business opposition to new bike lanes in Sydney, Australia centred on concerns about lost parking and productivity before the lanes were built but this shifted to complaints about disruption due to construction. Initially, bicycling advocates made calls on Twitter to boycott the anti-bike businesses in Victoria (‘Boycott Victoria Businesses that Oppose Bike Lanes’! @AvrgeJoeCyclist 690292914774081536), but over time advocates turned instead to a strategy of massively promoting successful businesses on Pandora Avenue (‘Safer Streets Pay Off for Businesses’ @ourborosage 1001501172404969472). These positive anecdotes trickled into traditional media, such as the story about a new restaurant offering a ‘ride-thru’ option (Aalgaard, 2018). These stories were shared on Twitter, but we saw no evidence that the businesses were using the platform to communicate information with other business owners or the general public. Similar to Crane et al. (2016), some businesses in both cities complained about construction when the infrastructure was built (‘Bridge, bike lane brings construction hell to Glenora businesses’ @LynnJerchel 905449509206974464; ‘Have you avoided walking along Fort Street because of bike-lane construction? Join Mark Brennae on CFAX1070, whose guests say businesses are suffering’. @cfax1070 971186166052589568). Businesses who opposed the construction of new bike lanes were not as vocal in Edmonton. For example, the executive director of the downtown business association, Ian O’Donnell, told council ‘It’s important to remember, we’re not leading the way here. We’re following best practice. Most other major cities have already done this’ (@estolte 1004759497963798528).
Twitter users are generally younger, educated and urban (Duggan, 2015), and therefore our Twitter data showed us a subset of perspectives from a demographic that often aligned with those in favour of urban bicycle infrastructure. Most of the discussion, and the most visible discussion, was supportive of the new bicycle facilities. The most visible opposition was from traditional newspaper, radio and television media and a few very outspoken individuals. In some cases, we observed constructive criticism based on experiences and safety concerns (e.g. sharing experiences with near misses). Twitter was a place where bicycling advocates organised and shared information. Yet, we have often heard in interactions with policy-makers and bicycling advocates the common view that social media can be very negative, for example, Victoria mayor Lisa Helps was quoted as‘social media can be nasty sometimes, especially when building bike lanes’! (@PeterMeiszner 859808243702390785). In some cases, we learned about opposition indirectly, for example ‘Dear Proud BC and anti-bike lane peeps around Greater Victoria…’ (@ouroborosage, 955578966806380544; which led us to find a video shared on Facebook). It is possible that the negative attitudes expressed on Twitter, while less numerous and influential compared with those in support, were especially salient to people who used Twitter over long time periods (i.e. before and after the infrastructure was built) as a medium for advocacy and communication with other individuals in support of bicycling lanes. A knowledge gap in social media research in transportation is how interactions and content on different social media platforms interact.
Traditional media, such as newspapers, television and radio, were highly influential in framing the conversations about bicycle infrastructure on Twitter since they provided much of the material that was shared on social media. Newspapers can have feedback loops with public perceptions of safety; for example, as bicycling becomes more newsworthy, incidents are reported at higher rates, which can lead to the perception that bicycling is unsafe (Macmillan et al., 2016). Early in the timeline in Victoria, local newspaper articles likely served to further the message of cycling advocates after a fatal crash by voicing the advocates’ calls for safer infrastructure (‘Victoria cyclists call for protected bike lanes after woman killed by delivery truck’ @cbcnewsbc 715011353912721408). Traditional media also voiced business opposition in Cook Street Village (‘Cook Street retailers want bike lane moved’ @timescolonist 690963814691508224). After the lanes opened, traditional media reported on the opening of the lanes (‘Caution the word for Pandora bike lanes, opening Monday’ @timescolonist 858358529434034179), confusion for car drivers (‘Two wheeled elation, and four wheeled confusion as Victoria’s protected bike lanes open on Pandora’ @CTVNewsScott 859110144319397888) and an early crash (‘Serious crash on Pandora bike lane raises flags’ @timescolonist 872805264084287488). Framing and grammatical choices by media can influence public perception of crash responsibility (Goddard et al., 2019). These headlines and quotes may have been especially impactful, since they were broadly shared, quoted and discussed on Twitter, thus amplifying the attitudes purveyed by traditional media.
In both cities, some radio stations functioned as hubs for overtly dissenting opinions (‘@cfax1070 How F***ed up is Victoria getting, With ALL the Bike lanes…’ @vjseymour 1059605920747937792; ‘When I was off last week I was downtown a couple of times in the morning. I saw NOBODY using the bike lanes. Am I wrong???’ @957CRUZFM 902189471415676928). Talk radio provides opportunities for unfiltered public commentary through call-in programmes (Herrera-Damas and Hermida, 2014) and this practice may have extended to Twitter. While these attitudes were extreme, they likely were not very strong, since these accounts were not involved in the discussion for long periods of time and were mostly isolated from other accounts. Additionally, talk radio may also cater to car-driving audiences, providing an easy controversial topic for news and call-in discussion points. Later in the timeline, both in Edmonton and Victoria, traditional media ran stories that were supportive of the infrastructure and these were widely shared (‘According to the Downtown Bike Grid Monitoring website, the number of cyclists has increased by 81 per cent in May compared with a year ago, since Edmonton opened what has become a 7.8-kilometre network of protected lanes’ @thestaredmonton 1007632609592139776; ‘This @CBContheisland listener drives a truck in downtown Victoria. On protected bike lanes, he’s turned from an opponent into a supporter’. @GregorCraigie 1003628157193 289728).
Both cities had civic elections during the study period where the mayoral champions of the projects ran for re-election. In Pittsburgh, Yoder and Johnstone (2018) found negative sentiments associated with the period of time near a civic election where bike lanes were a salient topic. Likewise, we found some of the most negative comments occurred during the election periods (e.g. ‘for context: this municipal election has been an unusually ugly one for Victoria, with the incumbent mayor besieged by a bunch of shitty dudes basically running on a platform of “fuck homeless people, we hate the current mayor bcs she’s a dumb lady, and also bike lanes suck”’ @DubiousCA 1053881191563067392), but they were not very numerous. We also found the volume of Tweets was less than many of the other events. We observed new accounts interacting in these regions on these political issues, including some influential accounts that were in support of bicycle infrastructure (such as @JSadikKhan and @modacitylife). In both cities, bike lanes were framed by traditional media as a major election issue, and most of the election-related posts came from the traditional media. At the time of writing, the projects in both cities remained intact, are associated with increases in bicycle trips and the mayoral champions were re-elected. Yet future changes in public opinion or policy could lead to calls for the removal of these facilities.
In research about public transit agencies, Schweitzer (2014) found that agencies who engaged with system users by answering questions and responding to comments had fewer negative sentiments on social media. In this work, we found that the Twitter accounts run by cities mostly functioned as dissemination hubs. While the information Tweets sent by these accounts were influential and widely shared, cities may explore social media strategies with more interaction, as these may reduce negative sentiments in conversation. On the other hand, in both cities, elected officials were engaged in conversations in the early stages, were passively mentioned in the first riding season and were missing from social media graphs in the second riding season. This shows that negative interactions may be a real barrier to engaging in conversations, and this may be better handled by agency accounts.
The Twitter search API provides a sample of Tweets that represents the most central accounts, thus missing activity from less central accounts (González-Bailón et al., 2014). While these peripheral accounts are less influential, they are more numerous, and they represent people who may be directly influenced by online discussions. Our research focused on the interactions and messaging of central accounts.
Conclusion
We collected Twitter data to understand the social and political dimensions of new bicycle infrastructure in Edmonton, Alberta and Victoria, British Columbia. We identified three timeframes with different characteristics: a period of advocacy before the lanes opened; increased and widespread discussion when the lanes opened; and growing acceptance in the second riding season. Despite a cold, snowy continental climate and not having an established reputation as a bicycling city, Edmonton had several advantages: support from local business and less negative commentary on Twitter by local traditional media, supporting the deployment of a usable network of lanes in the downtown core. Victoria, BC experienced organised opposition from businesses in some areas, critical news coverage and deployed lanes one-at-a-time, resulting in repeated controversy in social media discussions. Twitter activity before the lanes were built did not indicate the level of acceptance when the lanes were built. For example, the high levels of bicycle advocacy in Victoria before the lanes were built was overshadowed by business opposition. In contrast, Edmonton had more negativity about bicycle lanes before they were built, but which were met with less opposition than Victoria after the lanes were built. Over time, acceptance was indicated by more positive messages about business and increased bicycle trips and fewer negative messages directed towards local politicians. Through personal Twitter accounts and city government Twitter accounts, planners and policymakers played an active role in conversations about bike lanes on social media, which may have influenced public discussion. At the time of writing, both projects remain in place and are associated with increased bicycle trips. Emerging topics of discussion in both cities included the placement of bike lanes on major commercial streets, which has relevance for future policy decisions.
Footnotes
Funding
The authors disclosed receipt of the following financial support for the research, authorship, and/or publication of this article: This work was supported by the Public Health Agency of Canada. Additional support for one of the co-authors was provided by the Michael Smith Foundation for Health Research.