
Abstract
A growing number of studies of European and North American cities have shown that poverty is moving away from urban centres in a process known as the decentralisation (or suburbanisation) of poverty. These findings raise important questions about the impact on the quality of life for poorer residents who face financial constraints with respect to their access to transport. This article investigates the implications of the decentralisation of poverty for access to amenities and employment. Using data on England and Wales, we find that the decentralisation of poverty has led to greater inequalities between poor and non-poor households in access to both employment and amenities in large urban areas. We also provide two methodological innovations: (1) we address the long-standing methodological problem of measuring centralisation for cities with multiple urban centres by developing a generalised formula for the RCI (relative centralisation index), and (2) we demonstrate the use of OpenStreetMap data for identifying urban centres.
Introduction
A stylised feature of cities, as portrayed in many traditional theories of urban structure (Alonso, 1964; Burgess, 1925; Muth, 1969), is that a considerable gap in incomes exists between residents living near the city centre and those in the suburbs. These textbook models typically represent the industrial city as monocentric, with employment concentrated at the centre and the working classes located close to the centre to minimise commuting costs. Professional commuter classes reside in the suburbs where there is lower density housing and less exposure to air pollution. This has been the traditional characterisation of major American cities (Burgess, 1925; Glaeser et al., 2008; Rosenthal and Ross, 2015). Whilst the opposite is true in many European cities (Brueckner et al., 1999), studies show that most UK cities follow the US archetype: average incomes tend to rise with distance to the city centre (Glaeser et al., 2008).
However, this archetypal view of inner city poverty is being challenged in the UK by the twin forces of economic regeneration and gentrification (Slater, 2006). The latter process involves the influx of more affluent residents into poorer neighbourhoods with both positive and negative potential effects for low-income residents. Much controversy has been generated around whether gentrification is merely displacing low-income residents from inner cities rather than helping them through regeneration of their local area (Slater, 2006). Factors such as welfare regime (highlighted by Boris Johnson’s 1 remarks in 2012 about a ‘Kosovo-style social cleansing’ of the poor in London; Mulholland et al., 2012) and the commercialisation of social housing could also cause low-income individuals to be displaced from their traditional inner city neighbourhoods, with potentially important implications for access to employment.
Inner city zones contain a high density of employment opportunities and/or transport connections relative to the other zones – both of which are likely to be of benefit to poorer residents (Rae et al., 2016). This raises concerns about the emergence of new forms of ‘spatial mismatch’ arising not from the segregation of poor workers who are from ethnic minorities, disconnected from major centres of growth, as in Kain’s (1968) original thesis, but due instead to the decentralisation of poverty – the process of poorer households being pushed out of inner cities towards the urban periphery. There is growing evidence that this phenomenon extends beyond London – the focus of Boris Johnson’s concerns – to other UK cities (Bailey and Minton, 2018; Kavanagh et al., 2016) and to many other cities in the Western world (Cooke and Denton, 2015; Hedin et al., 2012; Hochstenbach and Musterd, 2018; Jargowsky, 2003; Kneebone and Berube, 2013).
Whilst there is now a considerable body of work on the changing nature of spatial segregation in British (Kavanagh et al., 2016), European (Musterd et al., 2016) and American cities (Kneebone and Berube 2013), little has been done to explore the implications of the decentralisation of poverty for employment and amenity access. One of the challenges of estimating the effect on access is how to conceptualise and measure the decentralisation of poverty when the Burgess/Muth/Alonso assumption of monocentricity breaks down. Fundamental changes to economic and industrial structures combined with falling transport costs for raw materials (Mieszkowski and Mills, 1993) have given rise to more varied and complex urban structures, with implications for access to amenities and exposure to air pollution (Bailey et al., 2018). Polycentric cities are no longer an aberration but a relatively commonplace urban form and, partly because of this, indices of centralisation have fallen out of use for studying segregation (Brown and Chung, 2006). The absolute centralisation index (ACI) and the relative centralisation index (RCI) measures of spatial centralisation were first proposed by Duncan and Duncan (1955) in an era when monocentricity was still a reasonable description of most cities. Recent studies have advanced the use of the RCI by adapting it as a measure of localised segregation and by providing a framework to account for uncertainty in estimates of the measure (Folch and Rey, 2016; Kavanagh et al., 2016). However, the issue of polycentricity – multiple urban centres – has yet to be addressed.
Our aim in this article is to demonstrate how a relatively simple modification of the RCI formula leads to an elegant generalisation that can account for polycentricity. An additional challenge for measuring centralisation is how to locate the urban centre. This becomes more problematic when cities are polycentric. We also show how open licence GIS data from OpenStreetMap (OSM; OpenStreetMap, 2017) can be readily used to identify the locations of urban centres.
A second key contribution of our article is to highlight the implications of the decentralisation of poverty for employment access, which is an important but under-researched topic. Specifically, we measure whether relative access to employment opportunities for poorer residents and unemployed jobseekers has changed over time. Since distance to the city centre is used as an indicator of accessibility to amenities and opportunities (Kavanagh et al., 2016), we also assess the level of correlation between measures of centralisation and accessibility.
The remainder of the article is structured as follows. In the second section, we describe the existing literature on the changing geography of poverty in order to highlight the gaps in current knowledge that we seek to address. We explain our methodological innovations in the third section. Then we will explore changes in relative centralisation and access for poor and unemployed individuals in England and Wales. Our data and results are presented in the fourth and fifth sections, and we offer a brief conclusion in the final section.
Background
There is evidence of spatial clustering of poor and non-poor households within UK cities (Rae, 2012) and of increasing segregation by income in Europe more generally (Musterd et al., 2016). These trends are concerning given the significant body of evidence on the association between neighbourhood poverty and cognitive development, educational performance, mental health, employment outcomes and crime (see review by Galster and Sharkey, 2017). The neighbourhood effects of poverty can lead to a downward spiral of decreasing geographical and social mobility for residents within and between generations. There are also implications for social cohesion as the presence of spatial distance between groups potentially leads to social distance and the subsequent erosion of social harmony within cities (Allport, 1954; Musterd et al., 2016).
At the same time, there has been growing evidence of a shift in the spatial distribution of poverty away from city centres. Historically, the centralisation of poverty and other social attributes has been viewed as an important and distinct dimension of segregation, alongside evenness, exposure, clustering and concentration (Massey and Denton, 1988). Centralisation refers to residential proximity to the city centre, and was originally of concern because the oldest and most substandard housing was located near the centre in many North American cities. Absolute centralisation refers to the clustering of a group in the area around the city centre. Since cities are in general more densely populated in the centre anyway, researchers find it more useful to focus on the relative centralisation of one group to another (Kavanagh et al., 2016; Musterd et al., 2016). In many cities in the Western world, the average income of residents tends to be lower in zones closer to the city centre (Glaeser et al., 2008). Historically, due to transportation cost constraints, the development of cities usually evolved from the central business area. Over time, technological and infrastructure developments to accommodate automobiles and railways led to a fall in the cost of inter-city transportation. This in turn led to a fall in the cost of living further away from the city centre. In the US, as well as in other countries, this led to the suburbanisation of the professional classes and the centralisation of poverty, leaving more densely built central neighbourhoods populated by households on lower incomes (Mieszkowski and Mills, 1993).
The historical suburbanisation of affluence is typically attributed to the income elasticity of demand for space: it is hypothesised that as residents’ incomes increase, their demand for living space increases at a greater rate. Since the unit price of land tends to fall with distance from the central business district, wealthier residents maximise utility by moving further away from the city centre under certain conditions (Becker, 1965). Other explanations suggest that the presence of better public transportation networks in the city centre attracts poorer residents, who are less likely to own cars due to running costs (Cuberes and Roberts, 2015). Whilst inner city poverty remains a feature of many cities, in the early 20th century there is evidence of increasing poverty in zones away from the inner city (Cooke and Denton, 2015; Hedin et al., 2012; Hochstenbach and Musterd, 2018; Jargowsky, 2003; Kavanagh et al., 2016; Kneebone and Berube, 2013). This phenomenon is also referred to as the ‘suburbanisation of poverty’, although suburbs are not always easy to define in a consistent way and so Kavanagh et al. (2016) have argued that it is better to conceptualise and measure the process in terms of decentralisation. In the UK, there have been signs that the relative centralisation of benefit claimants has been in decline (Kavanagh et al., 2016), caused by the displacement of lower-income households from more densely populated inner city areas towards the less populated suburbs (Bailey and Minton, 2018).
A number of dynamic forces have been identified as drivers of decentralisation. In the UK, discounted sales of social housing to former social housing residents through the Right to Buy scheme, 2 combined with the deregulation of the rental housing sector and speculative buying, are push factors that may be contributing to the out-migration of low-income households from inner city neighbourhoods. Whilst the gentrification of previously low-income neighbourhoods can cause short-term falls in segregation as these neighbourhoods become more socially mixed, in the long term further gentrification can ultimately lead to segregated affluent neighbourhoods due to exclusionary barriers which keep low-income households from moving in (Hochstenbach and Musterd, 2018). The commercialisation of social housing can restrict the number of inner city residences available to low-income individuals, as in the case of Amsterdam and Rotterdam (Hochstenbach and Musterd, 2018). This process is buttressed by the liberalisation of the rental market, the speculative buying of inner city properties, the redevelopment of older properties and the demolition of vacant properties in response to low housing demand. Revitalised neighbourhoods correspondingly attract more prosperous residents to an area (see Cameron (2003) for an English example), which leads to the pricing-out of poorer households. In an expanding city, new development tends to occur away from the centre, meaning the oldest parts of a city are often those in the centre. The heritage and aesthetic potential of these older dwellings combined with these other processes can make them target areas for redevelopment, and in due course they are bought up by higher-income residents. This pattern of redevelopment and consumption preference can explain why cities such as Philadelphia have a pronounced middle-ring income dip: the suburbs and inner city have higher average incomes than the areas between them (Rosenthal and Ross, 2015).
Implications of (de)centralisation
The decentralisation of poverty has raised concerns about access to amenities and opportunities for lower-income households. Accessibility can be defined in a number of ways (Geurs and Van Wee, 2004), but in this article we are interested in what Hansen (1959: 73) calls the ‘potential of opportunities for interaction’. For residents, accessibility is dependent on the quantity of opportunities in nearby areas and the cost of travel to access these opportunities. These opportunities can cover factors that contribute to social and personal life, such as air quality, proximity to noise pollution and access to employment, learning, healthcare and shopping. On a number of these factors, distance to the city centre can act as an indicator of accessibility. City centres have a higher density of employment opportunities than other zones, as well as main shopping streets and sites of culture and entertainment. Major transport hubs for intra-city travel are located within central areas, allowing for easier access to other city zones. On the other hand, traffic and dense urban development can mean that air pollution and other environmental factors are worse in city centres.
The relative decentralisation of poverty also has the potential to increase the level of spatial mismatch between where low-income individuals reside and where job opportunities are located. The spatial mismatch hypothesis originally referred to the barriers that black individuals faced in the US as entry-level jobs began moving from inner cities to the suburbs (Kain, 1968). Various causal mechanisms behind spatial mismatch have been proposed, including: discrimination in the housing market; excessive commute times; lower job search efficiency in areas further away; and consumer discrimination against minority groups (Gobillon et al., 2007). In the UK context, the decentralisation of poverty could lead to an additional cause for spatial mismatch arising from lower income groups moving further away from jobs in the inner city. Those on lower incomes are particularly vulnerable to the loss of opportunities caused by increasing physical distances. They tend, on average, to make fewer trips and to travel shorter distances (Titheridge et al., 2014). This is related to a number of factors, including budget constraints, lower rates of car ownership amongst lower-income households (Clark et al., 2016), poor transport connectivity in poorer neighbourhoods (Rae et al., 2016), as well as social barriers such as fear of crime in their local neighbourhoods. In theory, since distance to a central business district is a proxy indicator of employment access, the decentralisation of poverty ought to have had an adverse effect on access to employment for lower-income households (Bailey and Minton, 2018; Kavanagh et al., 2016). For similar reasons, we would expect an adverse effect also on access to a variety of amenities, which are often concentrated in urban centres.
The current article
The most common approach to defining centralisation is to categorise those living within
Urban centres are places that act as a central point for administration, culture, shopping and entertainment. Large metropolitan areas such as Greater London and Manchester contain multiple points which can be classified as urban centres. When the assumption of monocentricity is made for the sake of empirical convenience about an urban area that is in fact polycentric, it can lead to unexpected results. For instance, neighbourhoods of high deprivation near a secondary urban centre can be misclassified as being on the urban periphery, leading to an underestimation of how centralised poorer residents actually are.
In the current article, we focus on functional economic regions delineated by travel to work areas (TTWAs). We compare levels of relative centralisation between (i) poor and non-poor and (ii) jobseekers and non-jobseekers across TTWAs in England and Wales between 2001 and 2011. The latter is of interest because this period covers the 2008 recession, which led to unemployment rates in 2011 being the highest since 1995 (8.4%; ONS, 2018). The Great Recession may have had an effect on the decentralisation of poverty by shifting the spatial pattern of employment opportunities and changing the geographical location of the unemployed.
We extend the current state of knowledge by addressing two issues in the ‘decentralisation of poverty’ literature: (1) the consequences of decentralisation for access to employment and amenities, and (2) the methodological issue of polycentric urban regions. With regard to the former, we extend the work of Kavanagh et al. (2016) and Bailey and Minton (2018) by considering the practical consequence of the decentralisation of poverty on accessibility. For the latter, we show that a simple modification to existing measures of centralisation can overcome issues of polycentricism. Combined with open licence GIS data, our polycentric approach also allows us to extend the measurement of decentralisation to much larger study areas.
Methods
For our analysis, we rely on area-level data. Our lowest-level areal units are Lower Super Output Areas (LSOA). LSOAs are areal units derived from contiguous postcodes based on the UK census, and each LSOA has on average 1500 residents and 650 households. Distances between LSOAs are measured using Euclidean distances from population weighted centroids. Our highest-level areal units are TTWAs whose boundaries indicate an area where the majority of residents travel to work. We use TTWA boundaries that are based on commuter flow data from the 2011 census. Our choice of TTWA as the unit of analysis is to maximise comparability with earlier work done on the decentralisation of poverty in the UK (Bailey and Minton, 2018). An alternative option would be to use Functional Urban Areas (FUAs), which have the advantage of being comparable across countries. We provide results using FUAs instead of TTWAs in the supplementary materials. Our main substantive conclusions are largely unchanged regardless of areal definition.
The relative centralisation index
The RCI (relative centralisation index), and the less commonly used ACI (absolute centralisation index), are measures of centralisation originally created to deal with monocentric cities (Duncan and Duncan, 1955; Massey and Denton, 1988). The RCI measures the relative concentration of one group compared with another by distance from the city centre. This article is concerned with the relative centralisation of welfare claimants compared with non-claimants. The underlying idea can also be used to construct other indices of spatial inequality.
Table 1 illustrates the relationship between the cumulative proportion of poor and non-poor individuals living in each zone within an urban area. In our article, these zones correspond to LSOAs and urban areas correspond to TTWAs. The zones in Table 1 range from
Hypothetical example of cumulative proportions of poor and non-poor.
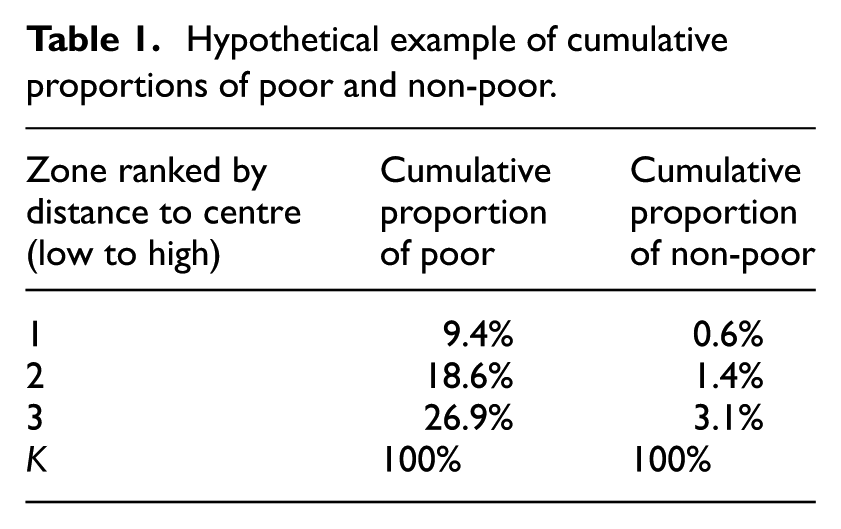
The cumulative proportion of poor (
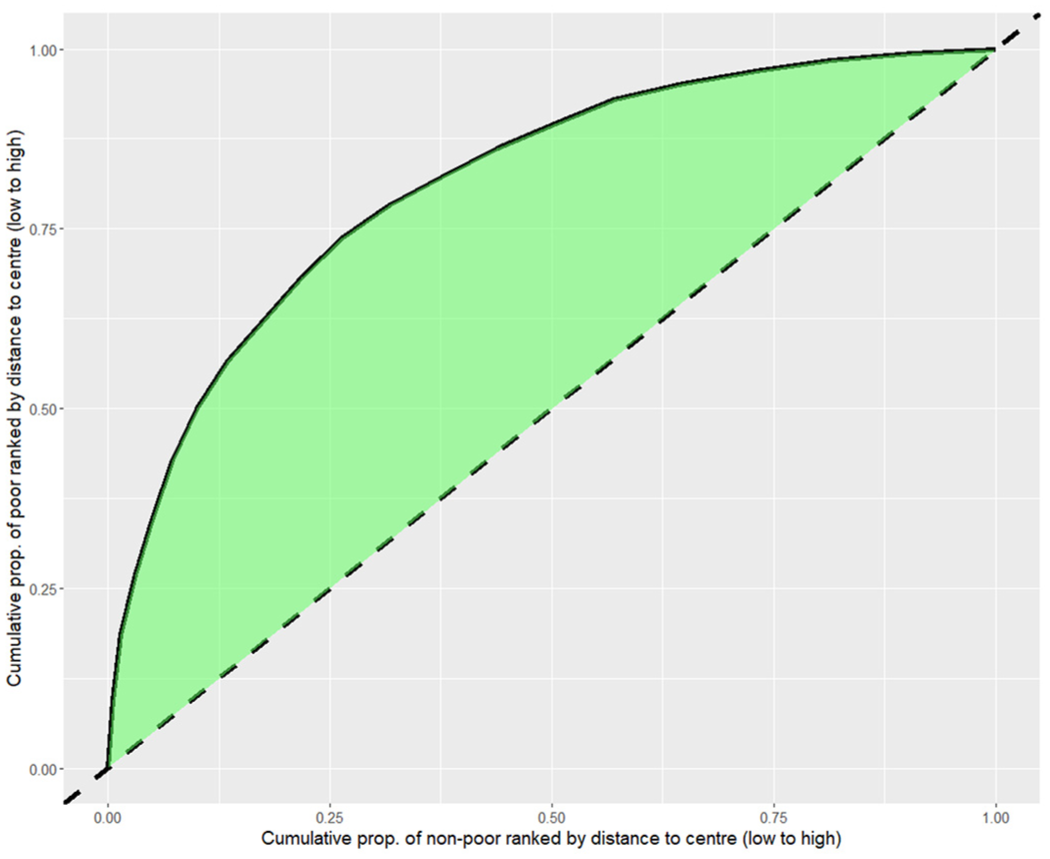
Cumulative proportions of poor and non-poor by distance to urban centre.
The standard formula for the RCI is expressed as:
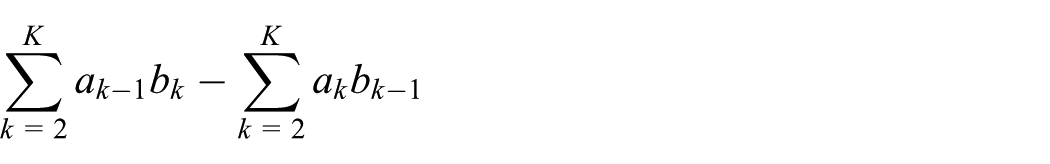
which assumes there is one major urban centre. We generalise the RCI formula to account for multiple centres. We do this by ordering the zones in Table 1 by their distance to the nearest major urban centre (instead of a single city centre). It is a simple idea, but one that allows the RCI to be computed for a much wider range of geographical areas. When there is only one centre, the more generalised RCI measure is identical to the original RCI.
To illustrate the impact of polycentricity on these two measures, consider the Warrington and Wigan TTWA (Figure 2). This TTWA is clearly polycentric and contains six large towns: the largest is Warrington, with an adult population of roughly 161,000 in its urban area (2011). The remaining five towns have comparable populations ranging from 60,000 (Widnes) to 100,000 (Wigan). Panel (a) shows that zones with high levels of poverty tend to be clustered around town centres. If we apply the traditional formula for the RCI, we have to assume monocentricity as it only uses distance from the main urban centre, Warrington, to calculate centralisation, yielding a value of 0.006 in 2001 (panel b). This RCI seems to indicate that there is no relative centralisation of poverty. This occurs because smaller towns, with centralised pockets of poverty, are effectively treated as suburbs of Warrington. Once we use distance to the nearest town centre instead (panel c) when calculating the RCI, we get a value of 0.1840 which better reflects the relationship between poverty and centralisation as seen in panel (a). Note that the RCI of a TTWA is not equal to the average RCI of its sub-areas. For instance, the average RCI of the 36 Built Up Areas (BUAs) that (roughly) made up London was −0.003, whilst the TTWA RCI was 0.092.
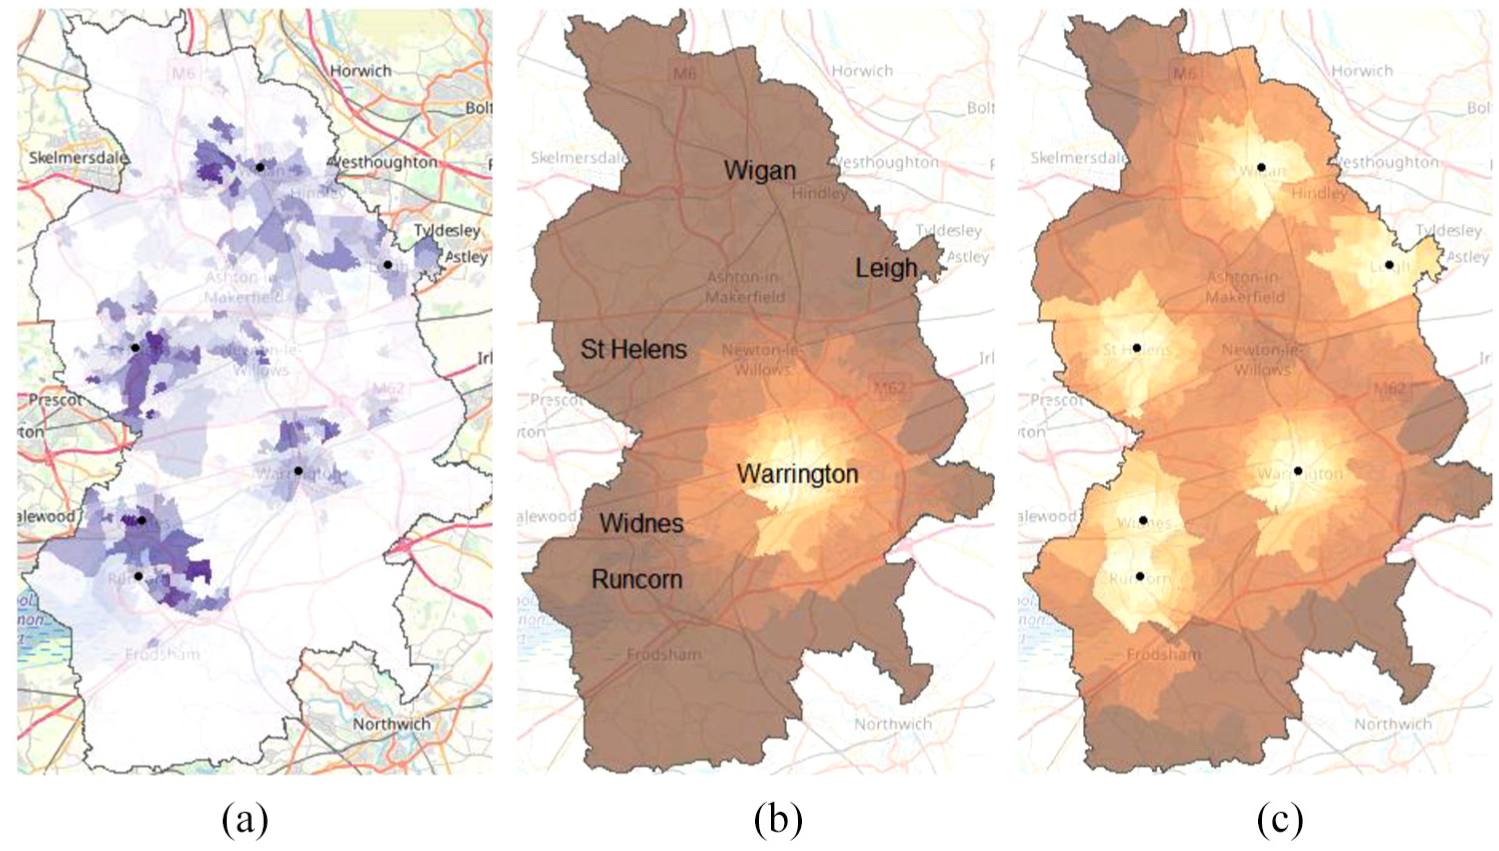
Warrington and Wigan TTWA. (a) Percentage of individuals in poverty from IMD. (b) Distance of zones to main centre (Warrington). (c) Distance of zones to nearest large urban centre. Darker colours represent higher percentages and longer distances.
Other spatial inequality indices
The basic principles underlying the RCI can be used to create other indices of relative spatial inequality. By changing the ordering of the zones in Table 1 by access to employment, we can create the relative access to employment (RAE) index. Similarly, if we order zones by proximity to amenities, we create the relative proximity to amenities (RPA) index. Our measures of access are operationalised later. One advantage of the RCI and other related measures is that they only rely on the rank order of zones. This means that using different measures of employment access to calculate the RAE, for example, will give similar results if the measures have a strong rank correlation. For calculating the RPA and RAE, we ordered zones such that positive values represent an over-representation of poor individuals in zones with better access to employment and access to amenities respectively.
Data
Our measure of poverty is based on the number of adults and children within households claiming low-income benefits in a LSOA. These numbers are collected from the Department for Work and Pensions (DWP). We use data from the English index of multiple deprivation (IMD) for 2004 and 2015. Since many IMD measures are based on lagged data, the IMD data reports income poverty numbers for 2001 and 2011 respectively, as well as total population numbers. Since comparable data are not available for Wales, the low-income analysis does not include the 22 TTWAs which have areas in Wales.
Our measure of unemployment poverty is based on the number of individuals in a LSOA claiming job seekers allowance (JSA), an employment benefit paid to unemployed adults who are actively seeking work. There were no changes to the provision of JSA over the time period covered (2001–2011). All eligible welfare recipients were aged between 18 and 65. For this article, we use the claimant count recorded in May. The total working age population is derived from the 2001 and 2011 censuses. This information comes from published DWP data. Since the IMD low-income measure includes households with members receiving means-tested JSA, there is some overlap between our poverty and unemployment measures.
There are minor discrepancies between the 2011 census and the DWP data, as information from the former uses updated LSOA boundaries. We converted area statistics from the 2011 census to be compatible with the older 2001 LSOA boundaries, using postcode data in a fashion similar to Bailey and Minton (2018).
Both the 2001 and 2011 censuses also record the number of individuals who work in a zone, known as its workplace population, which we use as a measure of current economic activity and a proxy for employment opportunity in an area. Detailed information on workplace population by occupational group is also available. For each LSOA, we calculate its access to employment opportunities using a commonly used gravity-based measure (Geurs and Van Wee, 2004; Hansen, 1959). For a target LSOA, this accessibility measure is:

where
Additional information on proximity to amenities comes from the English IMD for 2004 and 2010. We use the IMD score for geographical barriers, which is a weighted score composed of the proximity of residents in a LSOA to the nearest primary school, general practitioner surgery, food shop and post office (Noble et al., 2004). Lower IMD scores indicate greater proximity to these commonly used amenities.
Throughout our analysis, we use Euclidean distance as measured from the centroid of a LSOA to another point. In principle, it would be possible to use travel time rather than Euclidean distance for many of our measures. However Euclidean distance is also a good approximation to travel time because ‘the correlation between Euclidean distances and generalized transport costs (computed from real transport data) … is extremely high at 0.97’ (Combes and Lafourcade, 2005).
Definition of city/urban centres
Defining the centre point of a city is a difficult and rather subjective task since city centres can be spread over a wide area. Some researchers use the location of key landmarks (Brown, 1987), while others use train stations, city halls and retail centres (Kavanagh et al., 2016). The task becomes increasingly onerous, and harder to replicate, as the number of urban zones and centres being studied increases, which in turn severely restricts the practicality of studying a large number of urban areas. To overcome these problems, we make use of data on town and city centres from OpenStreetMap (OSM), which contains volunteer-collected data on centres and central features such as town halls. OSM has been described as the ‘Wikipedia map of the world’, and its geodata on features more complicated than city centres (such as buildings) have compared favourably to that of proprietary sources (Jokar Arsanjani et al., 2015: 2–3).
First we started by identifying the boundaries of built up urban areas. The Built Up Areas (BUAs) dataset provided by the Office for National Statistics (ONS) contains the boundaries of all areas in the UK with an irreversibly urban quality. Each BUA was identified using Ordnance Survey maps from grid squares data (Office for National Statistics, 2013). Due to their construction, BUAs’ boundaries may overlap more than one TTWA but are generally smaller than TTWAs and much larger than LSOAs. Larger BUAs, such as Greater London, are further split into sub-divisions, thus providing a useful means of splitting conurbations. For each BUA (or BUA subdivision) with over 10,000 residents, we started with the population weighted centroid and queried OSM for the nearest city within its boundaries. If a city centre was found we took that point as the urban centre for the BUA; otherwise, we began the process again using the nearest town centre. If no town centre was found then we used the nearest town hall, and finally the population weighted centroid. We chose this method because each BUA may contain multiple town and city centres due to data entry errors and BUAs that overlap multiple towns. This data-led method resulted in 822 potential urban centres including 54 city centres, 665 town centres, 24 town halls and 79 population weighted centroids.
For each TTWA, we wanted to take into account the relative size of the TTWA when considering whether a location was a major and relevant urban centre or not. For each TTWA, we found the largest BUA (or BUA sub-division) and its population (
Results
Evidence of poverty decentralisation in populated regions
Across almost all TTWAs, we find that both poor residents and jobseekers were more likely to be concentrated around a) urban centres, b) employment opportunities and c) common amenities than the rest of the population in both 2001 and 2011. Nonetheless, for poor residents, we found that the RCI fell between 2001 and 2011 from an average of 0.134 to 0.116. During the same period, the RAE changed from 0.171 to 0.150 and the RPA from 0.187 to 0.170. There was a strong correlation between the RCI change and the RAE change (Spearman’s
When we compared results using the monocentric and generalised RCI, we found that the average absolute difference between the two statistics was roughly 0.033 for 2001. In 10% of cases, the difference was 0.108 or larger, which is much more notable. We obtain almost identical comparison results for 2011.
For jobseekers, we found that between 2001 and 2011 the average RCI rose from 0.140 to 0.157, whilst the RAE and RPA also rose from 0.166 to 0.184 and from 0.164 to 0.183 respectively. This shows an opposite average trend compared with the poor.
Correlation between decentralisation and TTWA size
Previous studies of centralisation have been limited to only large urban areas (Bailey and Minton, 2018; Hochstenbach and Musterd, 2018; Kavanagh et al., 2016). Looking at the entire range of TTWAs, we find that this obscures the true extent of how decentralisation is linked with the size of urban areas. Larger TTWAs tend to have experienced a greater decentralisation of poor residents and jobseekers compared with smaller areas, as well as greater (negative) changes to access to employment and amenities. For poor residents, we find moderate correlations between population and change in the RCI (
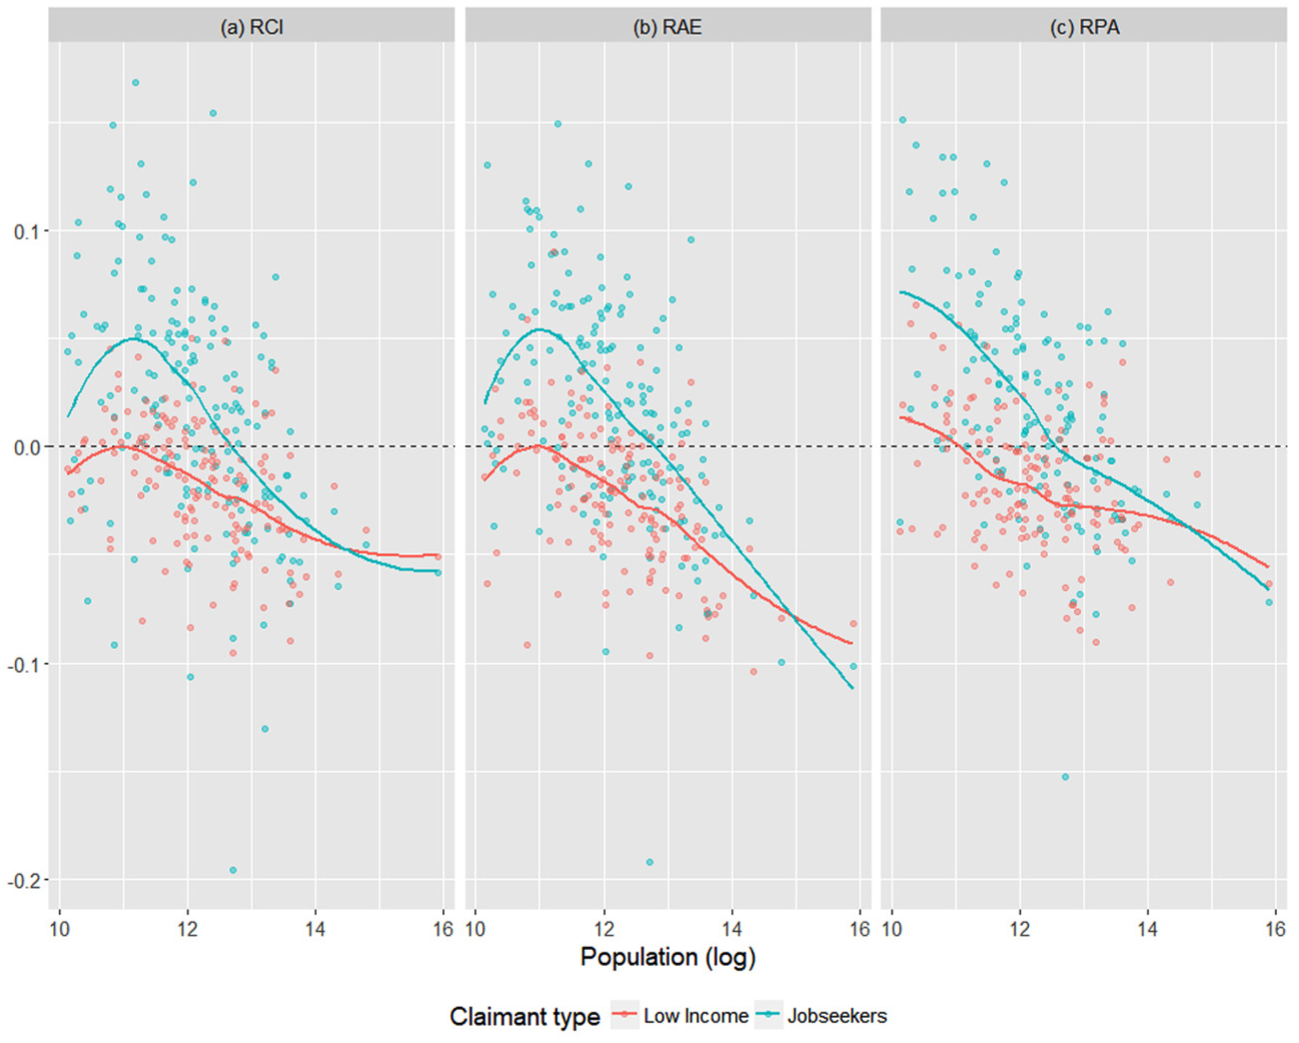
Change in spatial inequality indices by TTWA population (2001–2011).
Causes of changes to access to employment and amenities
Whilst the changes to centralisation are driven by changes to the spatial pattern of where claimants are located relative to non-claimants, this is not true for our access indices. Changes in access may be driven by changes in the location of employment and amenities in a city, especially given the 2008 recession. We chose to see how sensitive our results were to changes in access by recalculating both the RAE and RPA for 2001 and 2011 using the same claimant population data from 2001. For poor residents, we found that the difference in average RAE in 2001 and 2011 was only −0.002, indicating that changes to access to employment are driven almost entirely by changes in the distribution of poverty. The recalculated average RPA was 0.187 in 2001 and 0.177 in 2011. Since the RPA for 2011 using correct population data was 0.170, we believe that the real change to RPA cannot be attributed solely to changes in the claimant population. We find similar results using indices based on jobseeker numbers.
Conclusion and discussion
Two key findings emerge from this research. First we find evidence of a relative decentralisation of poverty in England and Wales in large TTWAs, but little change in smaller TTWAs. These results suggest that the trend in the decentralisation of poverty in the past two decades is most prevalent in larger cities and metropolitans areas. We do not explore the reasons for this trend, but possible explanations include: (i) higher rates of redevelopment and gentrification in the central areas of larger cities; (ii) falling housing affordability in the main city centre of a commuting area in large cities (Bailey and Minton, 2018); and (iii) rejuvenation of historical inner city areas (Rosenthal and Ross, 2015). Since there is some overlap between the low-income and unemployed population, increases in the relative centralisation of jobseekers in smaller TTWAs may counteract any decentralising effects on poverty in these areas. One reason for the centralisation of jobseekers may be the migration of unemployed individuals to urban centres in smaller TTWAs from periphery areas with poorer transport links. We hope that our findings stimulate research into the causal mechanisms underpinning these changes.
Second, we find that the decentralisation of poverty has had a negative impact on access to employment opportunities and access to amenities for welfare claimants compared with the rest of the population. By being more concentrated in the city centre, claimants should have relatively better access to amenities and employment opportunities, and hence the decentralisation of poverty would lead to a decline in access. We have no reason to believe that the fall in access to employment for poor households is due to changes in where employment opportunities are located. The findings establish the link between the decentralisation of poverty and its effects on people’s access to amenities and opportunities. Extra physical distance from the centre could serve as a barrier to employment and upward mobility for poorer residents due to lower search efficiency and higher costs of travel (Gobillon et al., 2007).
In addition to the substantive findings, we offer two methodological innovations with regards to (i) generalising the RCI to polycentric urban regions, and (ii) locating the presence of urban centres using OpenStreetMap. These innovations have made it possible to apply our analysis to large numbers of metropolitan areas of various sizes. A major limitation of previous centralisation studies is the low sample size of the urban areas under investigation, which was primarily due to (a) the laborious nature of specifying centre points, and (b) the polycentric nature of modern metropolitan areas (Brown and Chung, 2006). Comparing the monocentric and generalised RCI, we find that on average the difference between the measures was small, with notable extreme differences for some large TTWAs (such as Warrington and Wigan). These cases would have biased any analysis of centralisation that focused on large areas only (such as major city case studies) or any multivariate analysis (e.g. looking at the relationship between centralisation and area population). We believe that by addressing these methodological concerns, we can encourage researchers to increase the range of urban areas and countries under study, and the research questions which can be explored with a larger dataset. For example, data permitting, researchers can test the degree to which decentralisation is associated with intra-country factors (e.g. affordability of renting; Bailey and Minton, 2018) as well as inter-country factors (e.g. national housing policy; Musterd et al., 2016). However, we do note that practical issues may arise surrounding the quality of OSM data outside of Europe as well as around differing definitions of urban region (Jokar Arsanjani et al., 2015). We also computed results for UK FUAs to facilitate future comparison with other OECD countries. 3
The current article only considers the implication of decentralisation for access to employment opportunities and proximity to a range of amenities. However, there are many other consequences that need to be investigated, such as exposure to air pollution, which tends to be highest nearer urban centres due to traffic congestion. Our study was also limited in how employment was measured – we lacked data on employment choice and quality as well as any indicator of unmet demand for labour. We believe that data linkage between census data and other sources could potentially address this issue.
Supplemental Material
Zhang_Supplementary_materials – Supplemental material for The dynamics of poverty, employment and access to amenities in polycentric cities: Measuring the decentralisation of poverty and its impacts in England and Wales
Supplemental material, Zhang_Supplementary_materials for The dynamics of poverty, employment and access to amenities in polycentric cities: Measuring the decentralisation of poverty and its impacts in England and Wales by Meng Le Zhang and Gwilym Pryce in Urban Studies
Footnotes
Acknowledgements
We would like to thank John Minton and Nick Bailey for their comments and advice on this work.
Declaration of conflicting interests
The author(s) declared no potential conflicts of interest with respect to the research, authorship, and/or publication of this article.
Funding
The author(s) disclosed receipt of the following financial support for the research, authorship, and/or publication of this article: We gratefully acknowledge the Economic and Social Research Council (ESRC), who funded the Applied Quantitative Methods Network: Phase II (Grant Reference ES/K006460/1) and the Understanding Inequalities project (Grant Reference ES/P009301/1) through which this research was conducted.
Supplemental Material
Supplemental material for this article is available online.
Notes
References
Supplementary Material
Please find the following supplemental material available below.
For Open Access articles published under a Creative Commons License, all supplemental material carries the same license as the article it is associated with.
For non-Open Access articles published, all supplemental material carries a non-exclusive license, and permission requests for re-use of supplemental material or any part of supplemental material shall be sent directly to the copyright owner as specified in the copyright notice associated with the article.