
Abstract
School segregation and residential segregation are generally highly correlated. Cities in the Netherlands are considered to be moderately segregated residentially, while the educational landscape is choice-based but publicly funded. This article analyses how school and residential segregation are interrelated in the educational landscape of Dutch cities. Drawing on individual register data about all primary school pupils in the 10 largest cities, it demonstrates that segregation by ethnicity and social class is generally high, but that the patterns differ strongly between cities. By hypothetically allocating children to the nearest schools, this article demonstrates that even in a highly choice-based school context school segregation is to a large extent the effect of residential patterns. The role of residential trends, notably gentrification, is therefore crucial for understanding the differences in current trends of school segregation across Dutch urban contexts.
Introduction
Although the way in which segregation may affect individual life chances is hotly debated and the evidence for direct neighbourhood effects is mixed (Andersson et al., 2007; Musterd et al., 2003; Van Ham et al., 2012), segregation is widely associated with the reproduction of inequalities across class, race and gender (Sampson, 2012). One of the key mechanisms through which the residential neighbourhood affects life chances is through access to good quality education. Particularly at the primary school level, children attend schools in the close vicinity of their home. In most urban contexts there is a very strong connection between school and neighbourhood. High performing schools tend to be located in affluent neighbourhoods with a relatively advantaged student population, while also attracting advantaged pupils from elsewhere (Oberti and Savina, 2019). Many schools in socially deprived areas tend to recruit predominantly from the local area, often resulting in a plethora of challenges for these schools. The unequal geography of education is connected to wider social inequalities. School segregation, often measured through the unequal distribution of pupils with different social characteristics (income, ethnicity/race, language) across schools, is the spatial manifestation of those inequalities (Ball, 2003; Burgess et al., 2011). Both in scholarly and in public debates, school segregation is considered to be a big societal problem which is not just fundamental but also highly visible in the everyday lives of people.
In many contexts school choice and neighbourhood choice are strongly integrated, particularly in cities in which school districts or catchment areas determine access to local schools (Frankenberg, 2013; Hamnett and Butler, 2013; Noreisch, 2007; Rangvid, 2007; Van Zanten and Kosunen, 2013). The literature of the ‘geography of education’ (Butler and Hamnett, 2007) clearly shows that the spatial dimension is indispensable for understanding how social inequality is reproduced (Butler and Van Zanten, 2007; Reay et al., 2011). As schools are key amenities fixed in place, residential choice for families in many contexts revolves around the quest for access to good schools. While residential and school segregation are intertwined, they are not the same (Taylor and Gorard, 2001). The dynamics of housing and school choice, as well as the constraints of housing market and school landscape, differ across national and urban contexts (Van Zanten and Kosunen, 2013). While in some educational landscapes school segregation is a reflection of residential patterns, other contexts may demonstrate more complex correlations between school and residential segregation. Parental choice is also increasingly adopted in various contexts to reduce school segregation and educational inequalities (Ball, 2003; Logan et al., 2008; Orfield and Eaton, 1996). Various studies, however, argue that in educational landscapes characterised by a high degree of parental choice and few geographical constraints, different choice strategies of parents could be expected to lead to levels of school segregation that are higher than residential levels (Boterman, 2013). The Netherlands offers a crucial case to study how the residential domain and the educational domain are intertwined. In the Dutch school context, in which both schools and parents have a high degree of autonomy in the processes of choice and admission, the residential neighbourhood plays a secondary role. But how much of school segregation can be still be attributed to residential patterns in the context of free parental choice? This contribution seeks to assess the relationship between residential and school segregation in the context of the egalitarian and free choice educational setting of larger Dutch cities. Drawing on individual level register data, this article assesses the patterns and trends of school segregation along ethnic and social class lines at the level of primary schools. The main question is: How can we understand trends and patterns of primary school segregation in relation to residential segregation in the free parental choice context of Dutch cities?
First, this article discusses the mechanisms behind school segregation from an international perspective. Second, it discusses how the Dutch case presents an opportunity to advance the literature, explaining the particularities of the Dutch school context and the specific explanations behind school segregation in Dutch cities. The empirical section presents the patterns and trends of school segregation in Dutch cities. School segregation is then linked to patterns of residential segregation. The discussion connects the findings to the debate about school choice and school segregation.
Explanations for school segregation
There is a longstanding research tradition that has measured and explained the trends and causes of school segregation, especially in the US. The strong concentration of Black Americans in specific neighbourhoods and schools and the resulting educational inequalities have been a public and scholarly concern for many decades (Denton, 1995; Logan et al., 2008; Reardon and Owens, 2014). In other countries such as Germany, Denmark and the Netherlands, too, rising school segregation between ethnic and racial groups is an important academic and political concern (Karsten et al., 2006; Noreisch, 2007; Rangvid, 2007). In the UK, France and some other countries, the relationship between school choice, school outcomes and school segregation is mainly studied as an issue of social class (Burgess et al., 2011; Oberti, 2007). This is partly because of data, but in the case of France also due to a strong taboo on focusing on ethnic and racial inequalities (Oberti, 2008) and in the UK due to a longstanding scholarly tradition for the analysis of social class (Ball, 2003). Many studies point to a growing segregation of working class and middle class schooling, resulting in a widening gap between circuits of social reproduction (Ball, 2003; Oberti and Savina, 2019; Reay et al., 2011). While ethnic and social segregation are not the same and some mechanisms are specific for particular groups, many explanations for school segregation revolve around a number of central relationships.
The most central relationship in the literature for explaining school segregation is that of the school and the residential neighbourhood (Denton, 1995). Studies from the US (Frankenberg, 2013; Logan and Oakley, 2004; Reardon and Owens, 2014) and the UK (Burgess et al., 2011, 2015; Hamnett and Butler, 2013; Taylor and Gorard, 2001) but also from many other western European contexts (Bernelius and Vaattovaara, 2016; Boterman, 2018; Kristen, 2003; Rangvid, 2007) argue that residential patterns account for much of the school segregation. A main reason for this strong relationship is associated with the way in which the school system is organised. Where school districts or catchment areas organise the distribution of pupils across schools based on the residential location of the children, the structure of the housing market and patterns of residential segregation tend to be reflected in the composition of schools. The demographic composition of cities and the residential patterns of children belonging to different class and ethnic groups in such contexts are the most important factors for explaining school segregation. Nonetheless, while residential and school segregation are intertwined, they are not the same (Taylor and Gorard, 2001). The dynamics of housing and school choice, as well as the constraints of housing market and school landscape, differ across national and urban contexts (Van Zanten and Kosunen, 2013). While school segregation can be a reflection of residential patterns in some contexts, other contexts may demonstrate more complex correlations between school and residential segregation (Bernelius and Vaattovaara, 2016).
Correspondingly, different institutional school contexts offer different opportunities to opt out of the neighbourhood. Particularly in the US, various policy measures aimed at desegregating schools were based on the premise that allowing pupils to go to school outside of their neighbourhood would provide them with better educational opportunities (Orfield and Eaton, 1996; Witte, 2000). Whether this takes the shape of bussing, vouchers or a more general enlargement of school choice, cutting the strong link between neighbourhood and school is the central objective. Many of those measures are aimed at providing opportunities to opt out of (perceived) low quality public schools that are situated in strongly segregated and usually poor neighbourhoods. However, in various urban contexts private education and public charter or magnet schools offer other opt-out options that are typically used by higher social economic groups (Saporito, 2003). The selective out-commuting of middle class, often white, parents is a key explanatory factor for school segregation. With systems that traditionally were geographically based moving in a more choice-driven direction, the role of parental preferences in processes of school segregation seems increasingly important. The geography of education literature largely revolves around the strategic school choice behaviour of middle class parents, who use their various forms of capital (economic, social, cultural) to navigate the schooling landscape to ensure social reproduction. The literature identifies a range of school choice strategies, including moving into desired catchment areas for public schools, but also using various opt-out routes ranging from ‘going private’ to selecting faith-based and specific pedagogically profiled schools (Ball, 2003; Butler and Hamnett, 2007; Butler et al., 2013). Middle class parents are demonstrated to carefully assess school quality, both through evaluation of standardised test and other formal quality scores, and also by connecting school quality to its class and ethnic composition (Boterman, 2013; Butler and Hamnett, 2007; Hamnett et al., 2013; Rangvid, 2007; Raveaud and Van Zanten, 2007). Especially in the context of socially and ethnically mixed urban areas, these strategies are typically leading to people selecting schools that provide a relatively homogenous environment, providing safety in numbers (Vowden, 2012). The strategising of the (white) middle classes is therefore identified as a segregating force in a wide range of international urban contexts.
This literature has been criticised for constructing middle class parents as choosing, engaged and informed agents and working class parents as uninformed, uninterested and passive in respect to school selection (Burgess et al., 2011, 2015). It also suggests that within very similar choice sets, middle class parents tend to prioritise academic quality more than working class parents. Notwithstanding, it also concludes that school choice is much more about the range of schools one can choose from than about differences in parental preferences for academic quality of schools. The range of options available to parents is not only related to preferences and resources, but also to the types of schools to choose from, which obviously also has a clear geographical dimension. This ties into a third key explanation for school segregation: the variation within school landscapes. Next to the degree and organisation of parental choice, school landscapes are also differentiated in terms of the range of options parents have available to them. School landscapes can range from a highly uniform public and secular system such as in Finland to largely private systems with huge variation in quality such as in Chile (Van Zanten and Kosunen, 2013). This variety is also related to the historical role of faith-based schools in many countries. Most school landscapes have a public system integrated with, or next to which exist, a wide variety of faith-based or otherwise denominational schools. For instance, in Scotland, Belgium and Germany a large share of all primary schools provide education to various religious groups, notably Catholics, Protestants and Jews (Flint, 2007; Kristen, 2003). Moreover, in several contexts both state-funded and private schools may offer education rooted in different pedagogical traditions such as Montessori, Waldorf and Steiner (Karsten et al., 2006; Morris, 2015). The more options parents have available to them the greater the segregating potential of the school landscape (Boterman, 2018). In some places parents can only choose one school whereas in other contexts parents are offered a wide range of options.
This segregating potential of a more differentiated school landscape is also mediated by how much autonomy schools have with regard to how selective they are in terms of intake. School choice by parents is not the same as admission and enrolment. The degree to which schools can set the rules and/or have the liberty to interpret those rules can significantly affect school segregation. There is longstanding research that argues that the entire educational landscape favours the interests of the middle classes (Ball, 2003; Bourdieu and Passeron, 1990; Reay et al., 2011). This is not just because of strategically navigating parents with high economic, social and cultural capital but also because of a highly relational process between the institutional landscape, actors within schools, and parents. School segregation is therefore also an outcome of unequal opportunities throughout the entire school selection, admission and enrolment process.
The case: School segregation in Dutch cities
The educational landscape of primary education in Dutch cities offers a critical case for studying how the residential domain and the educational domain are intertwined. The system of primary education in the Netherlands combines freedom of school choice with an egalitarian landscape: the Dutch school system is almost entirely publicly funded, with no significant financial barriers and relatively little differentiation in terms of quality, which means that economic capital only plays a marginal direct role for access to high quality education. At the same time, freedom of school choice and the freedom to found a school are constitutionally granted rights, which has resulted in a high degree of autonomy for schools and a high degree of parental choice. This has produced a very differentiated school landscape, which is also highly spatially and historically contingent, in which parents can choose from a wide range of options. Parental choice and the autonomy of schools have resulted in a situation in which the residential neighbourhood should play a relatively minor role in school segregation. However, in spite of moderate levels of residential segregation along lines of both social class and ethnicity, school segregation is demonstrated to be quite high (Boterman, 2018; Clark et al., 1992; Gramberg, 1998; Ladd et al., 2009). Dutch cities are a test case for what maximum expansion of parental choice and school autonomy may imply for school segregation. This makes the Dutch case a unique opportunity to test what implementing more choice in other educational contexts could entail.
The majority of Dutch primary schools are fee-free private schools, based on a religious or pedagogical principle. Of all 6506 regular 1 primary schools, 68% are non-public, although they are all publicly funded and generally (but not necessarily) accessible to all children (DUO, 2017). These non-public schools are predominantly based on the Catholic (30%) or Protestant (30%) faith. Another substantial number of schools are based on the didactical principles of Maria Montessori and Helen Parkhurst (Dalton Plan schools) or on Anthroposophical philosophy (Steiner/Waldorf schools). In recent years, schools based on the Islamic faith and to a lesser degree Hinduism have also been founded, exclusively in the larger cities (Merry and Driessen, 2012). This variety of school types is, however, not equally spread over the country. In the Southern provinces of the Netherlands that are traditionally Catholic, the vast majority of schools reflect this religious predominance. Correspondingly, in the most religious parts of the Protestant heartland, schools are almost exclusively Protestant or public. In the large cities the landscape is more varied, with a larger share of non-denominational public schools (still only 50% in Amsterdam), non-religious schools, such as Anthroposophist or Montessori schools, but also schools based on other faiths (Jewish, Muslim, Hindu). Historically, this differentiated educational landscape produced a high degree of segregation of pupils along religious lines, notably between Catholics and Protestants, which to some extent cut across lines of social class (Dijkstra et al., 2002; Lijphart, 1968). In spite of secularisation and the waning of school choice along religious lines, religious background (not necessarily practising) is still a key predictor for what schools children attend (Denessen et al., 2005).
Explanations for school segregation in the Netherlands
A number of studies have explicitly investigated the levels, causes and effects of school segregation in the Netherlands (Boterman, 2018; Clark et al., 1992; Dijkstra et al., 2002; Gramberg, 1998; Karsten et al., 2003, 2006; Ladd et al., 2009; Sykes and Musterd, 2010). The majority of these studies are preoccupied with ethnic segregation. The most comprehensive account of levels of school segregation in Dutch cities is offered by the work of Ladd et al. (2009). Calculating various measures of segregation for the largest cities, Amsterdam, Rotterdam, The Hague and Utrecht, they conclude that school segregation for what they refer to as disadvantaged immigrants is high in Dutch cities. Comparing the levels in the four main Dutch urban centres with those in US cities in North Carolina, they suggest that the levels are even higher than for ‘black students in most major American cities’ (Ladd et al., 2009: 25). These high levels of school segregation are explained along similar lines to those identified in the international literature. The two key factors that are discussed are the influence of demographics and residential patterns on the one hand, and the dynamics of school choice on the other. Given the historically strong position of parental choice and school autonomy, many studies have investigated parental preferences. It is argued that in the free-choice context of the Netherlands parental choices are central for understanding school segregation.
In explanations for the changing patterns of segregation in Dutch cities, most studies start from the demographics of Dutch cities, especially the size and distribution of children with different migration backgrounds. The suburbanisation of predominantly native Dutch middle class families, and migration from countries like Turkey and Morocco, in combination with higher birth rates among migrant women, prompted a rapid change in school populations in Dutch cities in the 1980s and 1990s (Clark et al., 1992). For instance, while 85% of all children of primary school age in Amsterdam (65,000) were of native Dutch descent in 1975, in 1985 only 28,000 children (about 60%) belonged to this group (Van Breenen et al., 1991). Furthermore, the geography of these demographic transformations is highly uneven. The residential segregation of families with different migration backgrounds is therefore suggested as an explanation for ethnic school segregation (Gramberg, 1998). However, many scholars investigating residential levels of segregation have argued that Dutch cities are internationally only moderately segregated 2 (Musterd and Ostendorf, 2009). While these conclusions are based on the whole population, there were no studies that contended that for children patterns might be higher. A study by Clark and colleagues (1992) even argues that segregation among families is lower than among other types of households. Most studies thus conclude that while residential segregation in Dutch cities partly explains school segregation, there are important additional reasons for the discrepancy in the levels of residential and school segregation along ethnic lines (Clark et al., 1992; Gramberg, 1998; Ladd et al., 2009). The central explanation for this discrepancy is considered to be parental choice. The longstanding legal enshrinement of parental choice and school autonomy in the Netherlands is reflected in a literature that investigates the different motivations and preferences of various groups of parents. Most studies of the dynamics of school selection suggest four key elements: the religious or pedagogical profile of a school; (perceived) school quality; composition of school populations; and spatial proximity.
Karsten and colleagues (2003, 2006) argue that parents choose a school that provides a ‘match between home and school’. Historically, this match would be established through faith (notably Protestant and Catholic) (Dijkstra et al., 2002; Lijphart, 1968). While school choice along religious lines has generally waned, religious background (not necessarily practising) is still a key predictor for what schools children attend, especially among Muslim, Hindu and orthodox Protestant families (Karsten et al., 2006; Merry and Driessen, 2012; Vedder, 2006). This match between home and school is also established through pedagogical principles. Several studies have identified that highly educated parents may, for instance, prefer Montessori- or Steiner-based teaching (Karsten et al., 2006).
(Perceived) school quality is a key element of school choice dynamics. This is, however, a highly ambiguous concept in the Dutch context. There exist no formal rankings of school quality except for the publicly published reports by the Inspection of the Ministry, which only single out the problematic schools. Primary schools may be assessed by average test scores (CITO), but this provides more an indication of the potential attainment of the school population than the performance of the school itself. Various studies of parental choice indicate that school quality is associated with ‘the school climate, order and discipline, and pupils attending this school to get ahead in society’ (Denessen et al., 2005: 362). There is also substantial evidence that parents associate the quality of a school with the composition of that school (Boterman, 2013; Gramberg, 1998). Whereas some studies have found that school population is not a direct reason for parents to choose specific schools, others have identified the (ethnic) composition of a school as a key factor in the selection process, especially in the avoidance of particular schools (Karsten et al., 2003). This kind of ‘negative choice’, however, is difficult to isolate from other ‘positive’ elements of choice. The preference for particular schools is a complex amalgam of considerations in which the ethnic and class composition of the school population is interconnected with subjective interpretations of school quality and the atmosphere at a school. While there is evidence of parents deliberately choosing mixed or diverse schools (Boterman, 2013; cf. Reay et al., 2011), the majority of middle class white parents in practice send their children to relatively homogenous schools, in terms of both class and ethnicity. However, in the context of Dutch cities, class and migration background strongly overlap. While there is a clear increase in the number of highly educated middle class people with a migration background, the majority of the low-income and lower educated groups have a non-Dutch background. This makes it even more difficult to separate class and race/ethnicity and how they play a role in school choice processes.
Finally, various studies on school choice have indicated that proximity is very important for most parents (Karsten et al., 2003, 2006). Although the tolerance for commuting to a school outside the residential neighbourhood is differentiated across social class and ethnic background (cf. Hamnett and Butler, 2013), most Dutch children attend a school within a 500–800 metre radius of their homes (CBS, 2017). This implies that despite the rather weak formal role of geography in structuring choice, the interrelationship of residential and school segregation may still be quite strong in the Dutch context. Furthermore, it also implies that the location of various types of schools also impacts selection processes and patterns of school segregation. In high school density contexts, such as most larger cities, parents can choose between a fairly large range of schools. To assess the role of residential location, the next sections will present the levels and trends of school segregation in the 10 largest Dutch cities and establish to what extent these levels can be explained by residential proximity.
Data and methods
To analyse the levels and trends of school segregation this article makes use of a combination of two widely used segregation measures: the index of Dissimilarity (D) and the Exposure Index (P*). These two measures represent two different approaches to segregation that are often referred to as unevenness (D) and exposure or isolation (P*). Both measures have been used in a wide range of contexts and by many prominent voices in the field of segregation (Logan et al., 2008; Massey and Denton, 1993; Musterd, 2005; Owens et al., 2016), but are not without their problems.
The D measures the unevenness of the distribution of pupils over schools between two groups. The D ranges from 0 to 100, indicating in fact the sum of the share of the two compared groups that would need to change school in order to get a balanced distribution. According to Massey and Denton (1993), an index below 30 is considered low and above 60 is considered high. The advantage of the D is that it is a fairly straightforward index, which is not sensitive to the sizes of the groups and is hence useful for inter-urban comparisons. However, it says nothing about spatial patterns per se and is very sensitive to the size of units over which it is measured. If neighbourhoods or schools are very different in one city compared with another, the D indexes are not comparable. This article compares cities of quite different sizes and different social and ethnic compositions, which makes the D an appropriate measure. Given that the sizes of primary schools in the cities of this study are highly comparable, the indexes of the 10 cities are also comparable.
The D’s strength is that it corrects for group size, but it doesn’t capture the actual numbers of different groups of pupils in schools. To provide supplementary insight into the role of group sizes, the article also utilises the Exposure Index (P*). The Exposure Index expresses the probability with which a member belonging to a specific category is likely to be in a school with a member of another category. As said, the P* is highly sensitive to the share of the analysed group(s) within the city. Sometimes the Isolation Index or Exposure Index is therefore modified to correct for group size (e.g. Tammaru et al., 2016). However, the resulting modified Isolation/Exposure Index would be measuring something very similar to the D, which for this article is already calculated. This article therefore uses the uncorrected P*. To facilitate the interpretation of the P*, average group sizes at the municipal level are also included in the presentation of the data.
This article first describes the levels of school segregation in Dutch cities in the period 2008–2015. For the analysis, I draw on individual register data from the system of social statistical databases (SSD) of Dutch Statistics. The database contains the whole population of children attending primary school in a Dutch municipality (about 1.5 million for each year). The database identifying children attending primary schools is coupled with individual level data about the children’s legal parents. This child–parent dataset was further linked to other databases containing information about the place of residence, migration background and the income and highest level of educational attainment of parents. By aggregating the individual data of children at the level of school, school type, neighbourhood and municipality, I could establish the degree to which pupils of different migration backgrounds and social (income and educational attainment) categories were unevenly distributed across schools, within different municipalities in the Netherlands.
First, segregation indexes are calculated for the 10 largest municipalities in the Netherlands with at least 10,000 children of primary school age (Table 1). This is to ensure that there are enough schools and pupils to calculate segregation indexes without them being too variable in a random way over the years. The measures of segregation were calculated for the period 2008–2015. Ethnic segregation is calculated for three groups of pupils, each with a different migration background: Surinamese, Turks and Moroccans. These migrant backgrounds are the most common in the context of Dutch large cities. The definition maintained is predetermined by Dutch Statistics and is based on the country of birth of parents. For social segregation the analysis is based on two indicators: the (legal) parents’ 3 educational attainment and their household income. Segregation measures are calculated for parents with a higher degree (Bachelor’s level and up) compared with less educated parents (at most, lower level vocational training), and the top 25% compared with the bottom 25% of national household income percentiles.
Descriptives of primary school pupils in the 10 municipalities (2015).
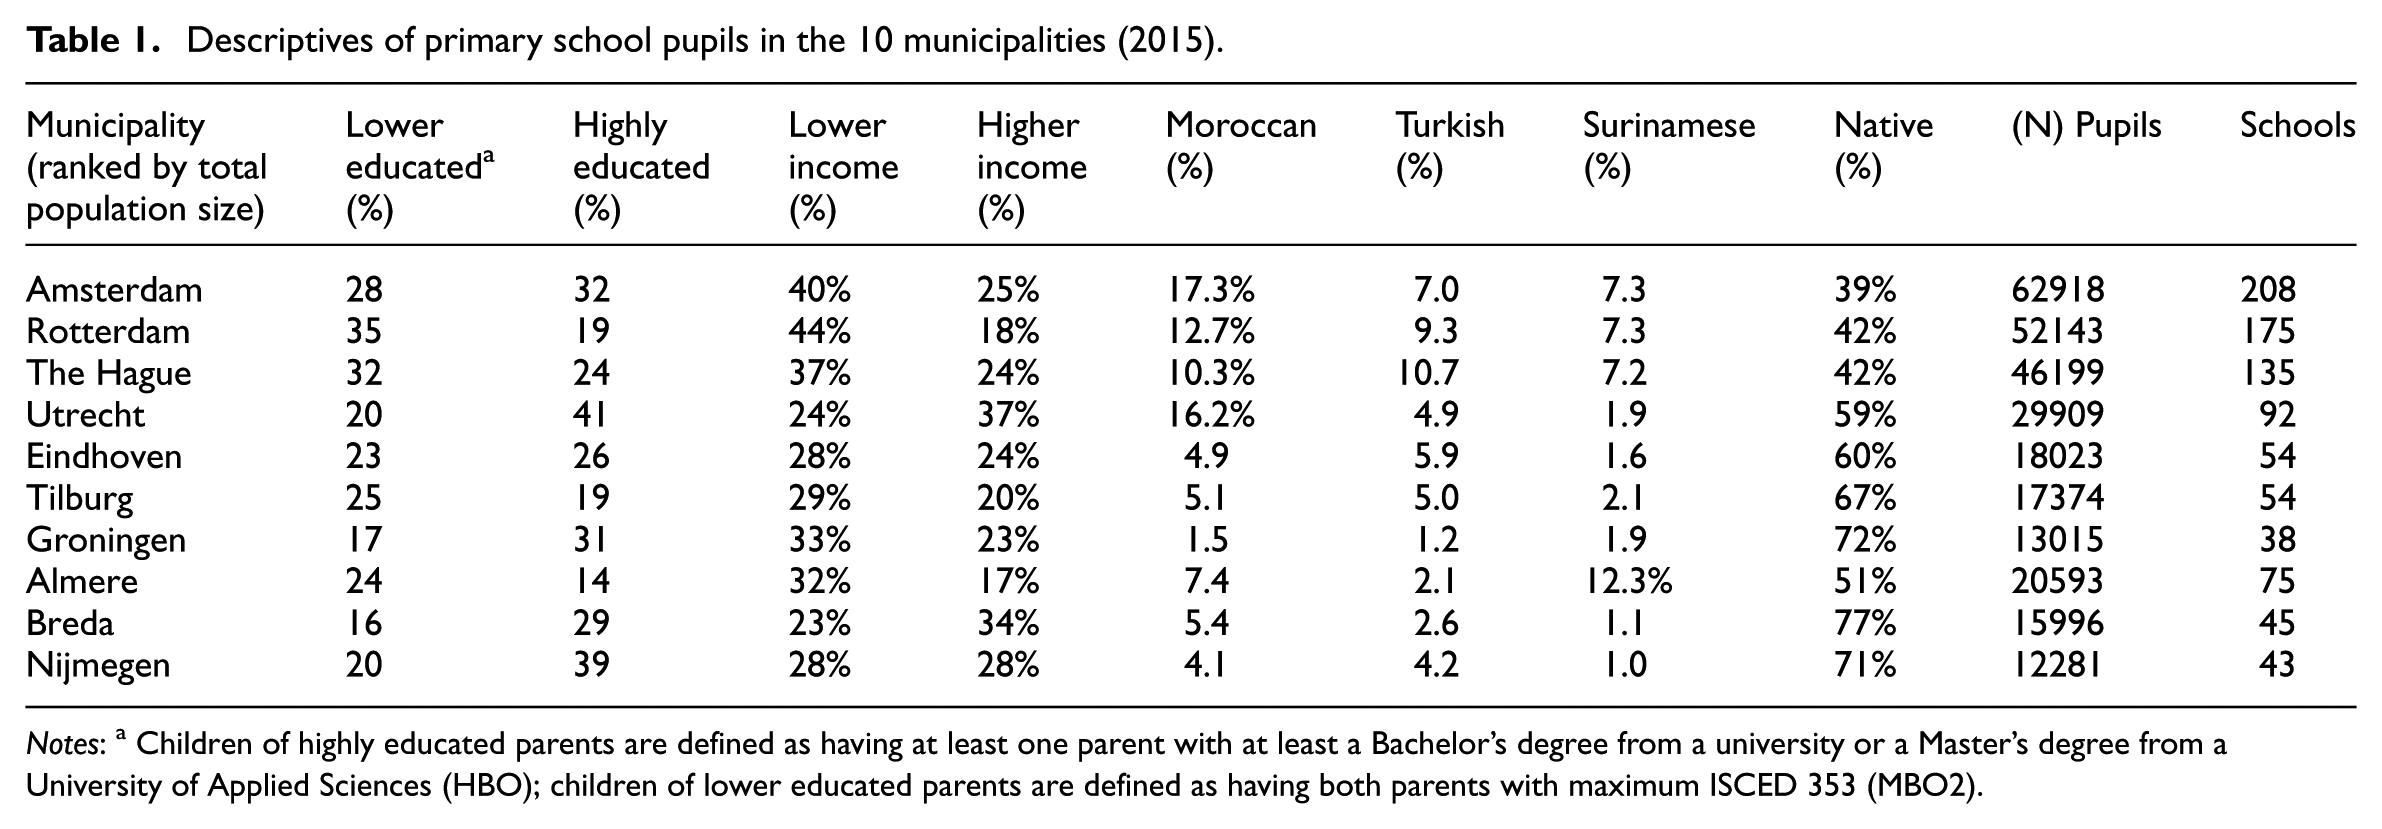
Notes: a Children of highly educated parents are defined as having at least one parent with at least a Bachelor’s degree from a university or a Master’s degree from a University of Applied Sciences (HBO); children of lower educated parents are defined as having both parents with maximum ISCED 353 (MBO2).
A second key element of the analysis of this article is assessing the influence of residential patterns in levels of school segregation. To assess the relationship with residential segregation, the segregation indexes (D and P*) were calculated for the 10 municipalities in the hypothetical situation where all pupils would attend one of the three closest schools. In this hypothetical situation the residential patterns would account almost entirely for the resulting levels of school segregation. For all addresses of school-going children the distance (as the crow flies) to the nearest schools within a 5 kilometre radius was calculated. Subsequently all pupils were allocated to the three nearest schools. 4 The distribution of pupils in this hypothetical situation was then used to calculate both indexes for the different municipalities. The levels of segregation of the hypothetical situation and the situation as measured were then compared.
Patterns and trends of school segregation in Dutch cities
Ethnic segregation
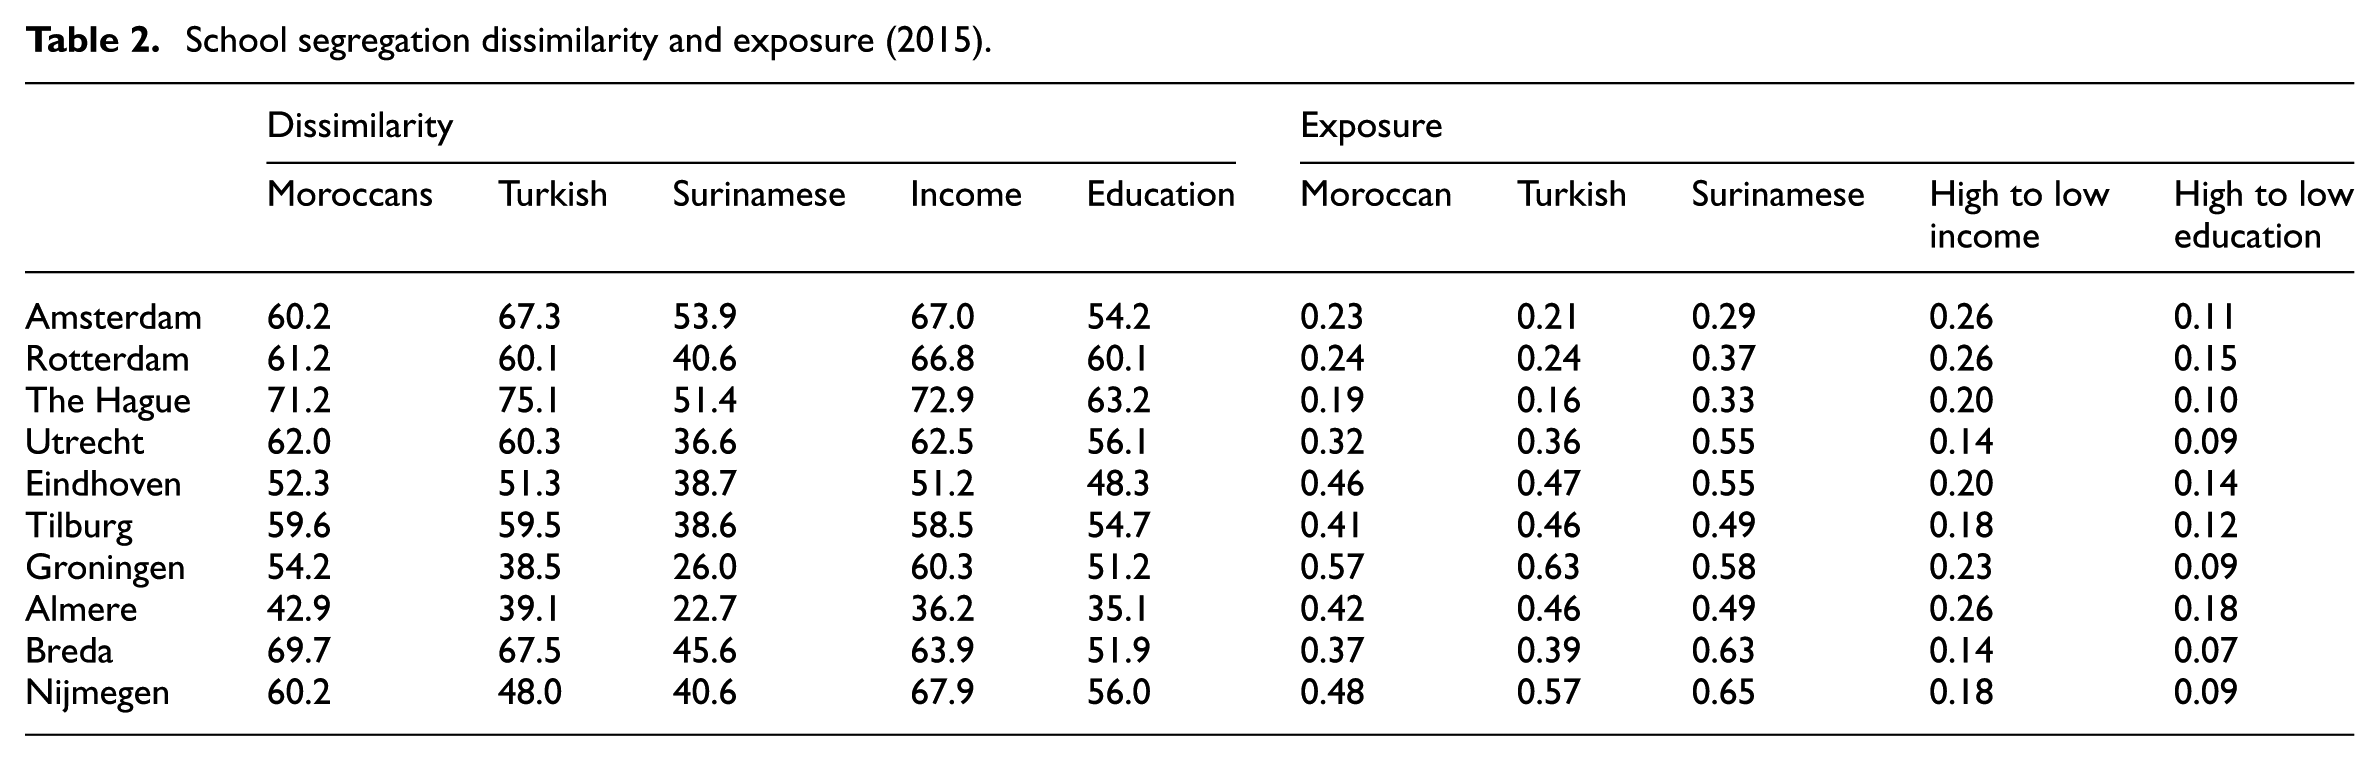
In Dutch cities the level of school segregation along ethnic lines is moderate to high. For Moroccans and Turks the levels demonstrated here are generally high, even higher than reported in earlier studies (Ladd et al., 2009). Surinamese-Dutch are moderately segregated from native Dutch pupils, as the level of segregation is generally considerably lower. The level of ethnic school segregation varies strongly between municipalities, but there are few municipalities that have substantially lower levels of segregation. The highest levels for Turkish-Dutch and Moroccan-Dutch are in The Hague and Breda. For Surinamese-Dutch, The Hague and Amsterdam stand out. For all ethnic groups, levels are relatively low in the suburban new town of Almere. Yet, for Turkish-Dutch and Moroccan-Dutch even in Almere 40% of either group would need to change school to get an even distribution across all schools, which is still substantial. It is interesting to note that except for the consistently low levels in Almere, there is not really any clear pattern of which types of municipalities have higher or lower levels. One of the larger cities, The Hague, consistently ranks among the highest, but Amsterdam, Utrecht and Rotterdam do not. Medium-sized towns have similar or even higher levels of ethnic school segregation than the largest cities.
If we take the Exposure Index into account, the picture changes considerably. As this measure reflects the exposure of a specific group to members of another group within the school, in this case native Dutch children, it is highly sensitive to group size. As Table 2 demonstrates, the level of exposure of Moroccan-Dutch, Turkish-Dutch and Surinamese-Dutch children to native Dutch children differs strongly across urban contexts. For all groups, especially in the bigger cities, the exposure to native Dutch children is quite low. As the cities differ substantially in terms of their school-aged populations, this is partly a group size effect. Nonetheless, since exposure to native Dutch children varies across ethnic groups it is also clearly an expression of different patterns of segregation.
School segregation dissimilarity and exposure (2015).
Despite the generally high levels for both indexes, particularly in the larger cities there is a downward trend for the level of segregation of all ethnic groups, but mostly for Turkish-Dutch and Moroccan-Dutch children. In most urban contexts the exposure to native Dutch children is increasing for all three groups. This is partially due to a change in composition of the urban populations but, as both indexes indicate, also due to decreasing segregation (Table 3).
Trends in school segregation development 2008–2015 (2008 = 100).
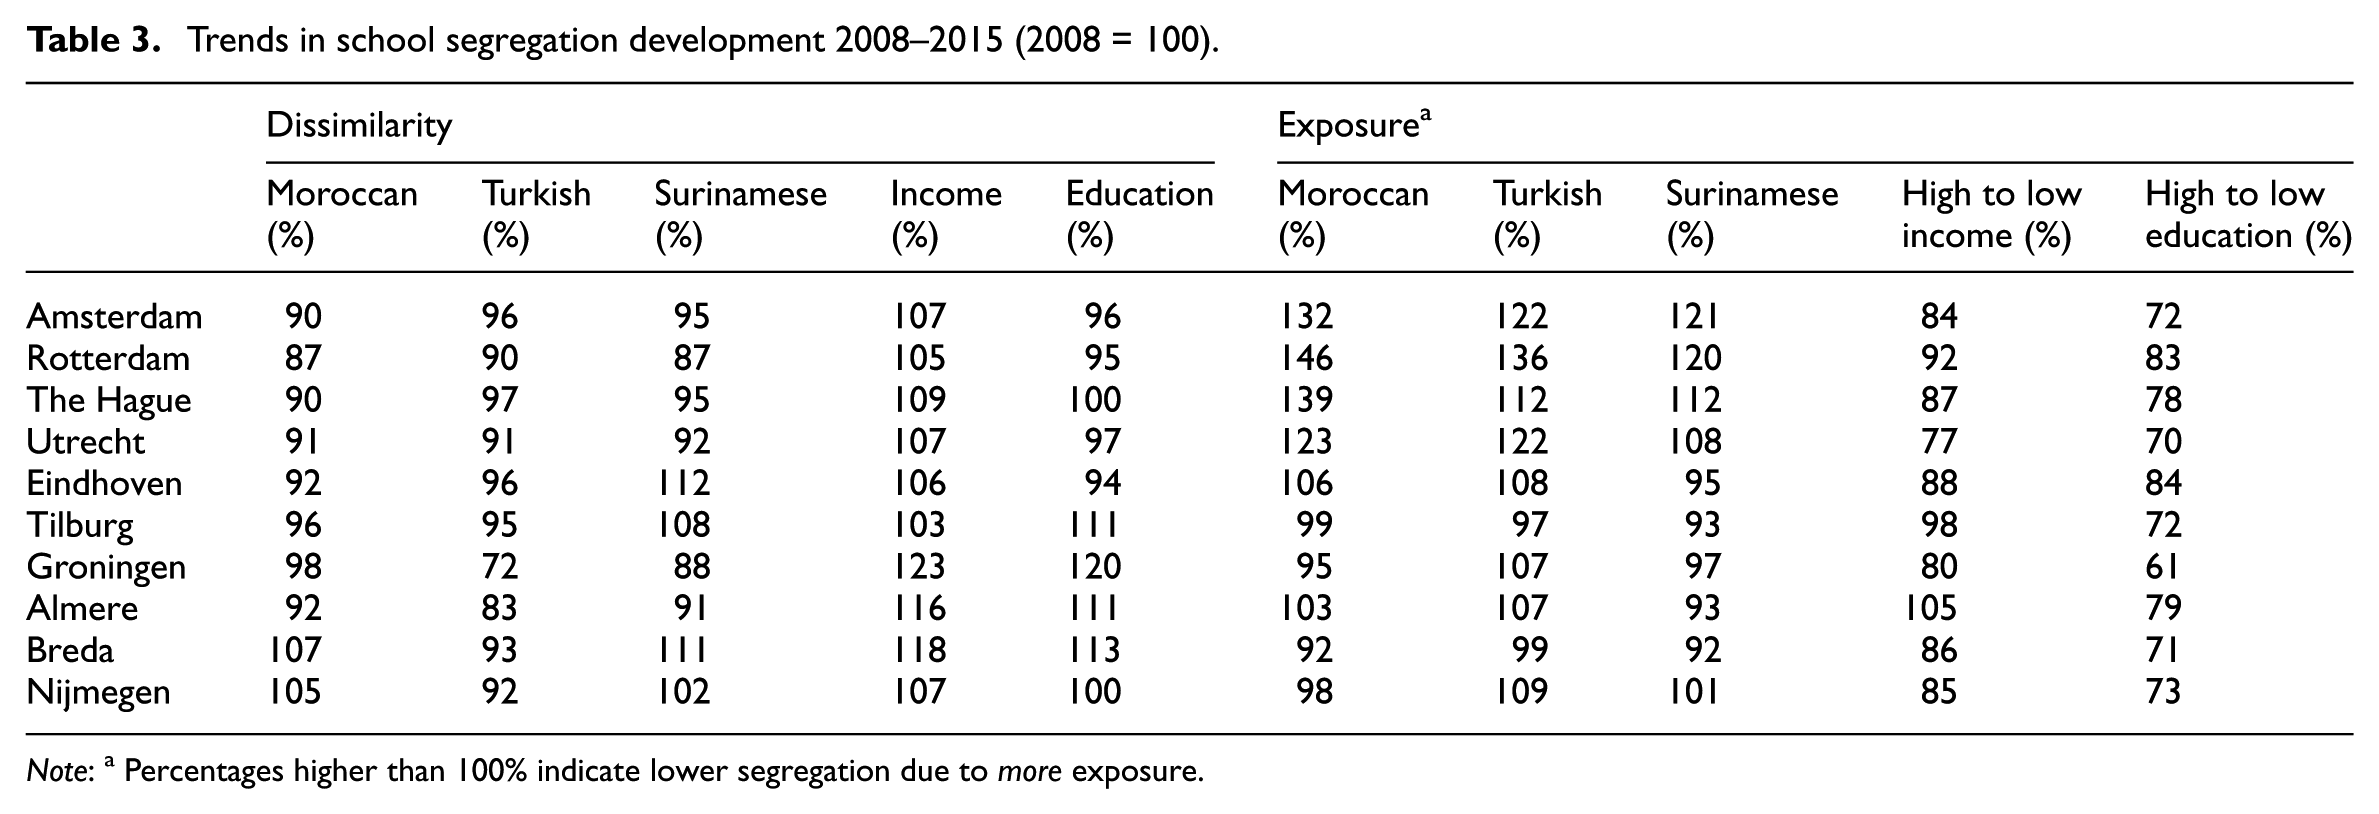
Note: a Percentages higher than 100% indicate lower segregation due to more exposure.
Segregation by social economic status
In the Netherlands, most studies so far have focused more on levels and trends of school segregation across ethnicity, and less across social class. However, internationally school selection is typically associated with social reproduction, often at the intersections of ethnicity and the cultural and economic dimensions of class (Boterman, 2013; Byrne, 2009; Karsten et al., 2006). Based on the level of education and income of parents in the 10 cities, we find that children in primary schools are also highly segregated across social class (Table 2). Income segregation seems to be less stark than segregation by educational attainment, but both are moderate to high. As with ethnic segregation, the differences between different urban contexts are substantial: while Almere shows relatively moderate levels, all other urban centres demonstrate a very uneven distribution of children across social class. The Hague is again the most segregated city, both for income and educational attainment. Remarkably, in the largest cities, imbalance along the lines of educational attainment of parents is going down, while it is going up in other cities. Segregation levels for income, however, seem to be on the rise across the board.
Considering the Exposure Index may provide more information about what is going on. The children of high-income parents and highly educated parents are only exposed to children of low-income and lower educated parents to a limited extent. This exposure is generally going down in all cities (Table 3). This is probably caused by the changing population of cities. Particularly, the large cities are (family) gentrifying (Boterman et al., 2010; Hochstenbach, 2017), coinciding with a rise in high-income and highly educated parents, and correspondingly decreasing shares of lower status groups. As the level of exposure is going down slightly slower than the overall demographic trend, segregation goes down a little. For income the image is different. The levels of exposure of high-income to lower-income populations are going down faster than the population changes in general, indicating increasing segregation. In order to put these patterns and trends into further perspective and tentatively explain them, the next section analyses the relationship with trends in residential segregation of the same populations.
Residential segregation and school segregation
Residential segregation in Dutch cities is relatively moderate, but is higher for ethnic groups than for income groups (Musterd, 2005; Musterd and Ostendorf, 2009). Class-based segregation is strongly mitigated by social mixing policies, income redistribution and the way in which the housing market is regulated. While some studies have argued that ethnic segregation among family households is lower than generally for minority households (Clark et al., 1992: 97), newer studies suggest that among families both ethnic- and class-based distinctions are actually sharper for families (Boterman, 2018). Particularly in urban areas, there is a clear trend towards the liberalising and privatising of housing (Hochstenbach, 2017). The role of economic capital is becoming more important for residential opportunities than in earlier decades. This may create stronger segregation of family households in particular and thereby affect the levels of class-based school segregation as well. However, processes of gentrification are also found to, at least temporarily, increase social mix in some urban areas, also for family households (Boterman et al., 2010). To demonstrate how residential segregation has developed in the past decade, Table 4 presents the levels of residential segregation of children attending primary schools. For the sake of not flooding the article with tables and graphs of all the different migration backgrounds, this section compares all children with a non-western 5 background with those without a migration background.
Residential segregation (D) 2015 migration background, income and educational attainment of parents.
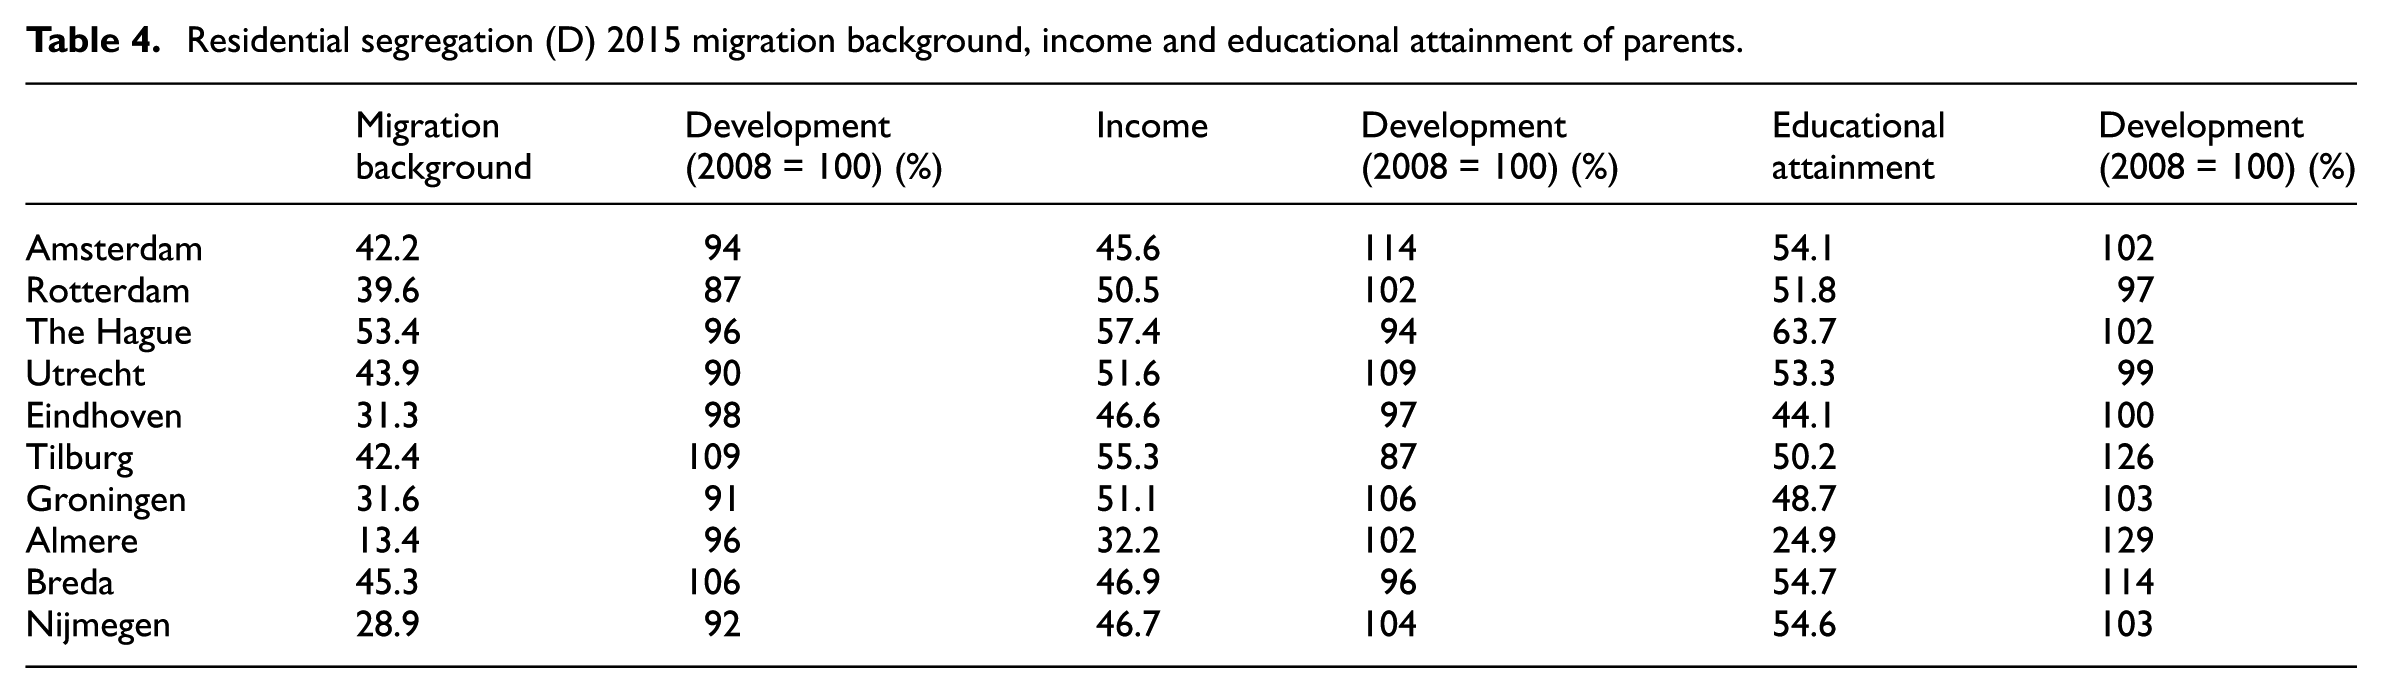
Comparing the different cities, it appears that children of highly and of lower educated parents in particular rarely share residential neighbourhoods in most cities, with the exception of Almere and Eindhoven where levels are clearly lower. Segregation by income and migration background in most cities is also moderately high and exceeds the levels reported for the population as a whole (Musterd, 2005). Again, Almere stands out with low levels and The Hague is the most segregated context. Family households with young children are thus more segregated than other households, implying that children may lead more separated lives than adults.
The trends seem to be variegated for the 10 cities and also appear to be different for the three dimensions. Segregation by migration background is mainly going down, but children of lower and highly educated parents seem to live increasingly segregated in most contexts. For income the image is somewhat mixed. Low- and high-income households in contexts such as Amsterdam and Utrecht are living more segregated but in The Hague and Tilburg levels seem to go down. Comparing the findings for residential segregation with those for school segregation, it appears that school segregation is consistently higher than residential segregation. It is, however, faulty to compare residential (Table 4) and school (Table 2) segregation directly. The units across which pupils could sort themselves are not the same: there are more primary schools than neighbourhoods, and some neighbourhoods do not have a school and some have several. I have therefore hypothetically allocated children to the three nearest schools to test to what extent segregation levels can be ascribed to spatial proximity. Figures 1a–c and 2a–c reveal how much of the school segregation is the apparent result of residential patterns.
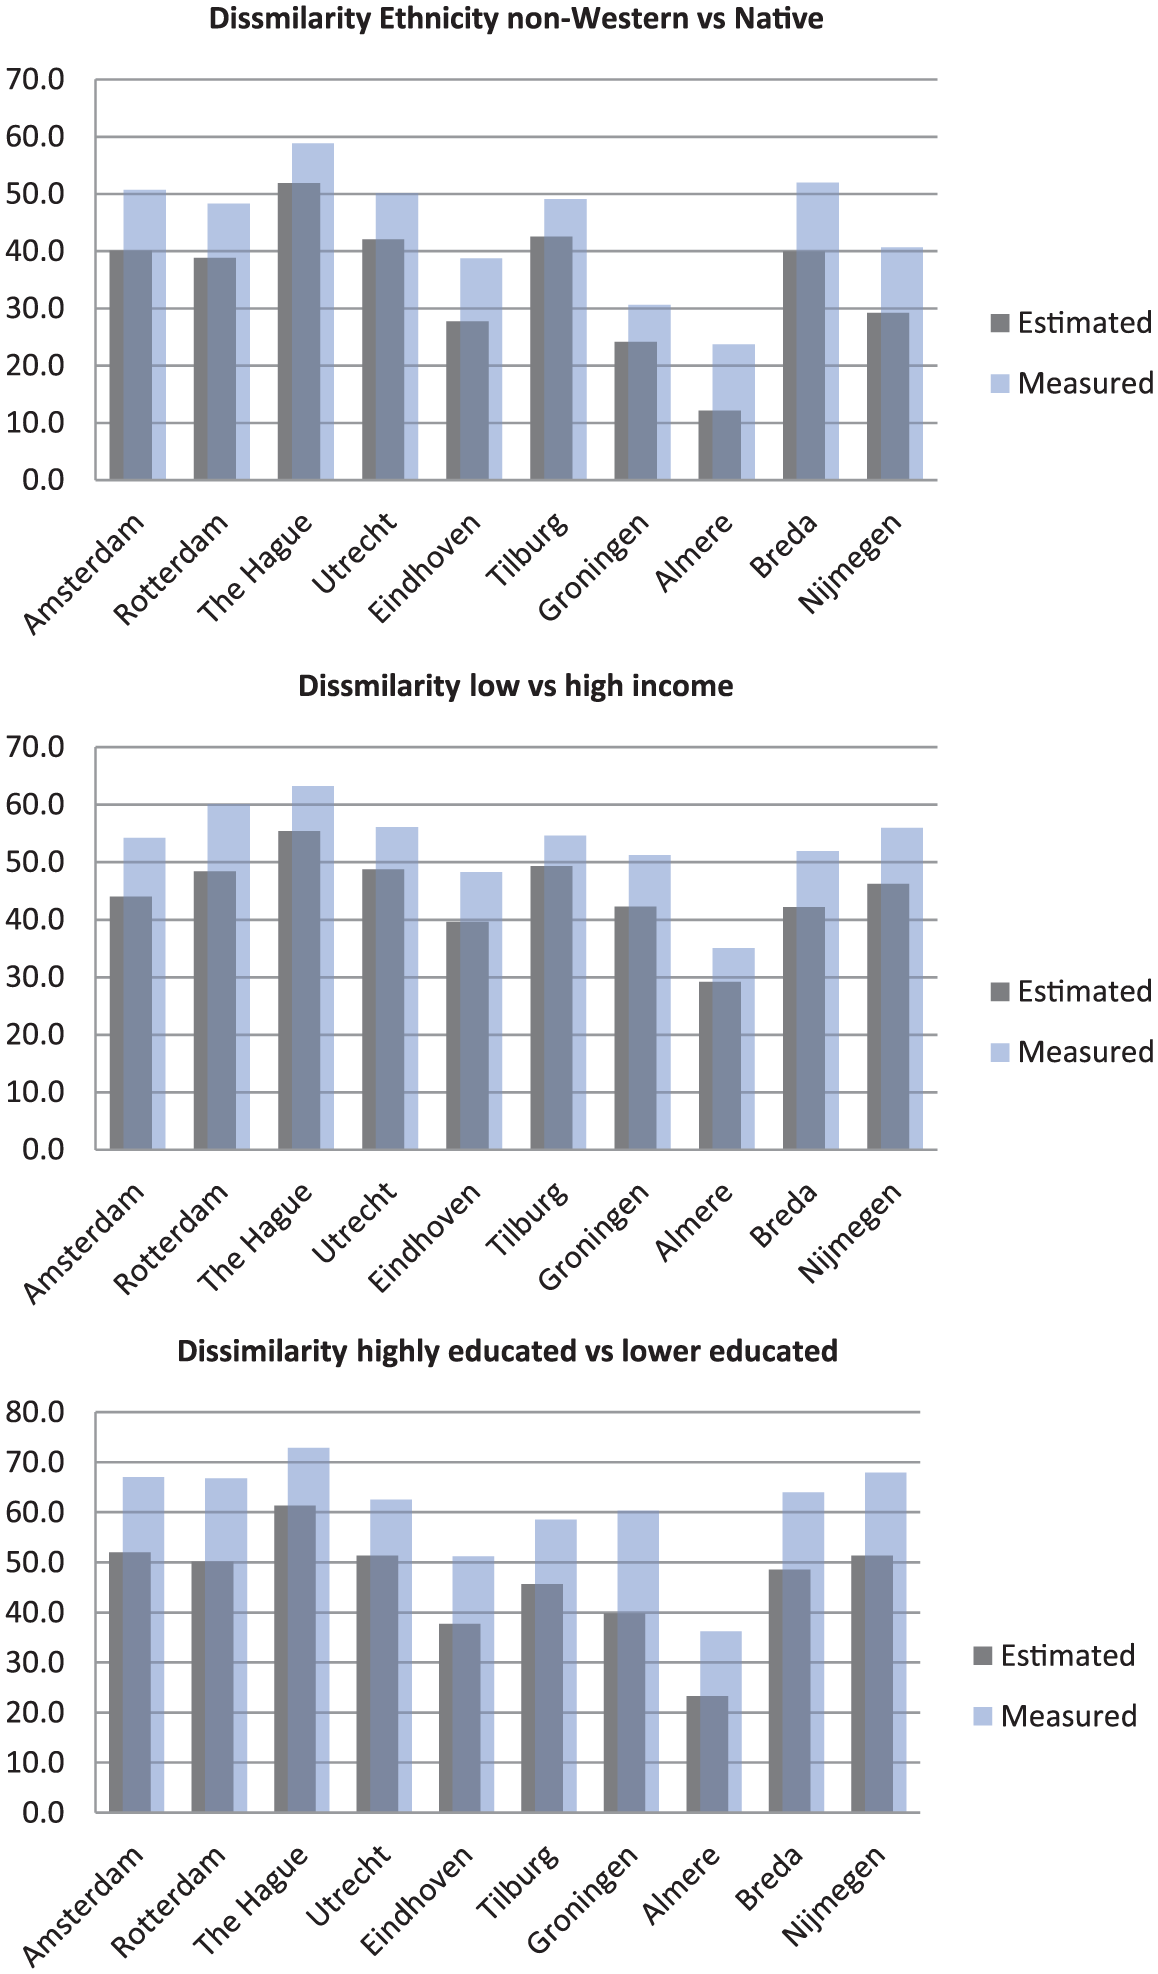
Segregation (D) based on place of residence compared with real situation (2015).
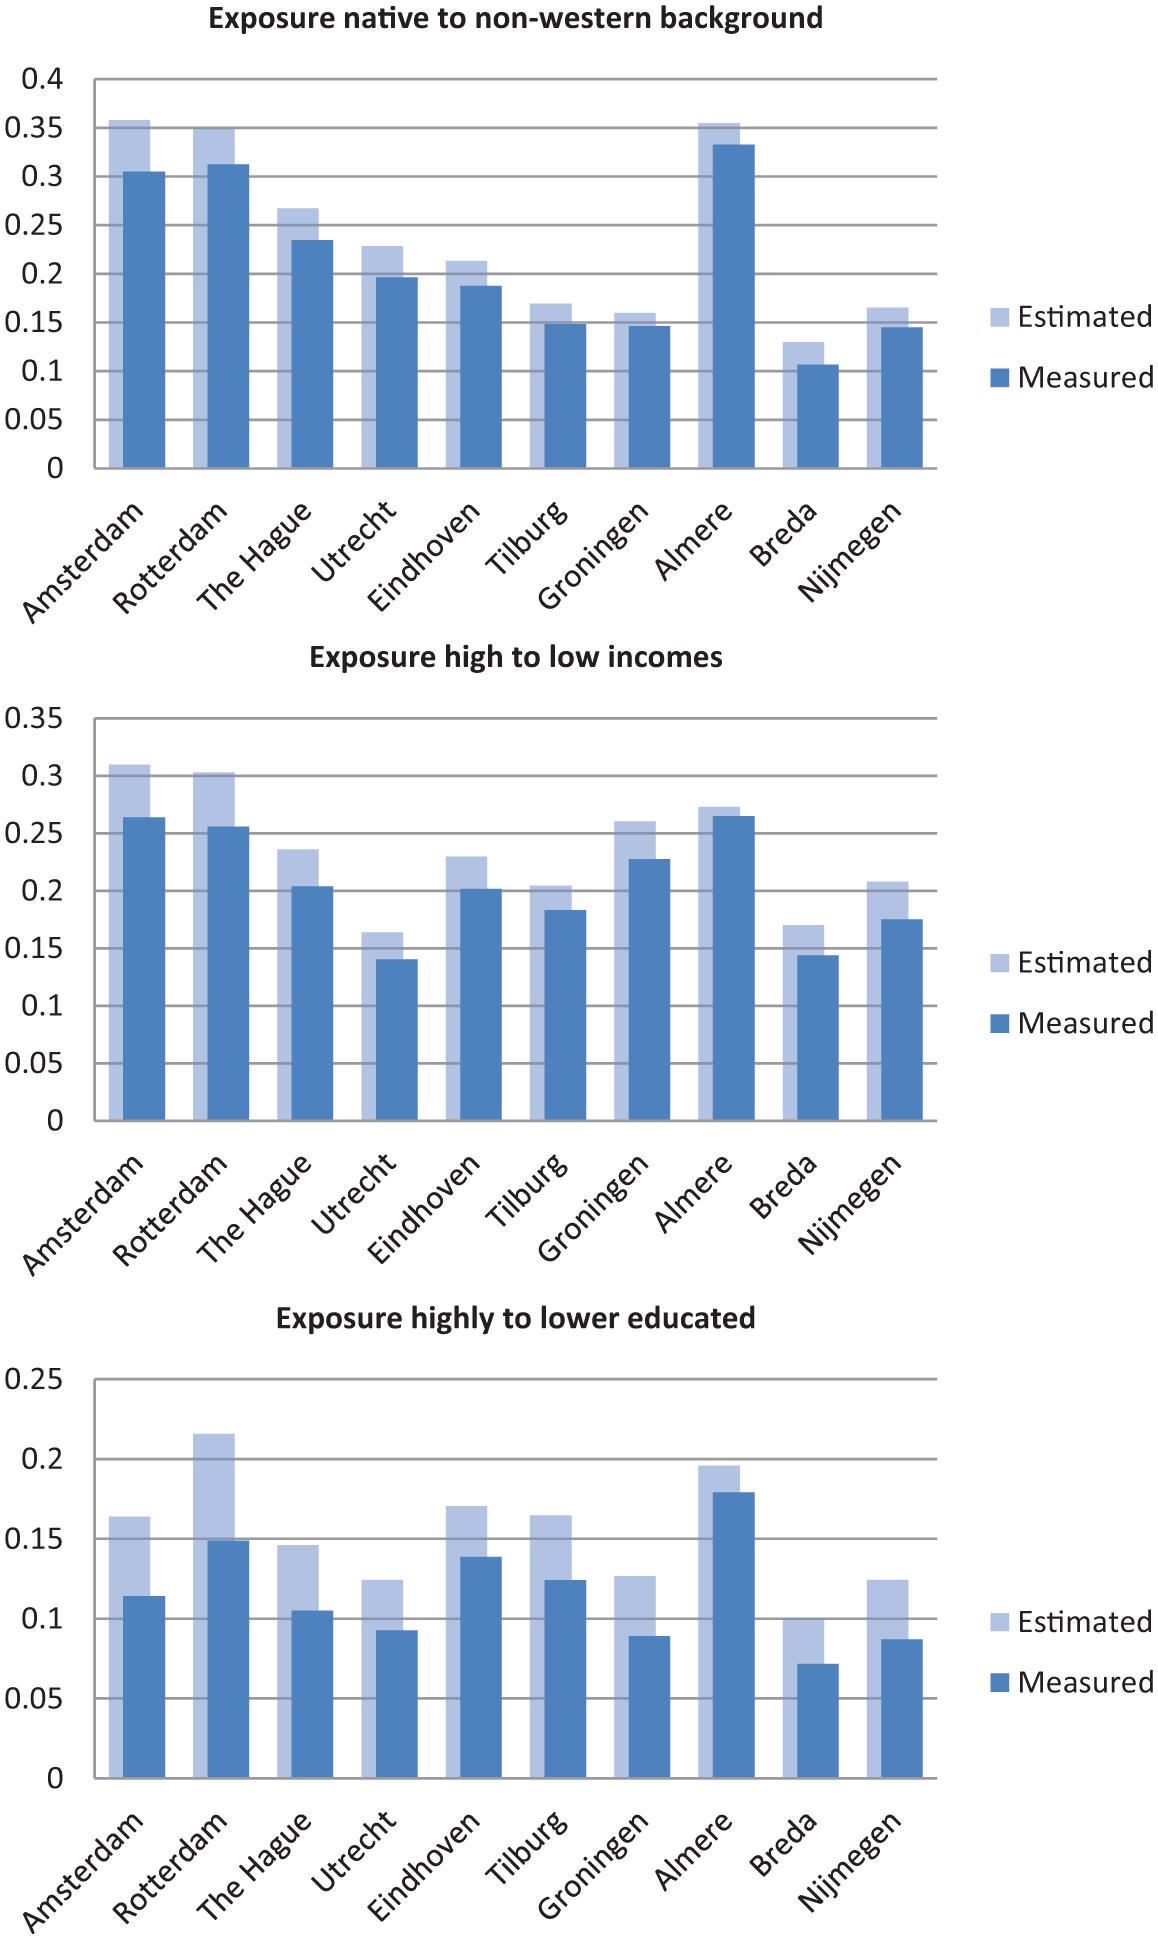
Exposure based on place of residence compared with real situation (2015).
As becomes clear from Figure 1a–c, measured levels for school segregation (using the D) are higher than the hypothetical levels of segregation based on the residential location for the same populations. This applies least for income and most for education. If all children attended the closest three schools, levels of school segregation would generally drop by some 15–20%. For educational attainment and migration background, estimated levels and measured levels of segregation are more apart than for income. There is a remarkable consistency across urban contexts in terms of the share of school segregation that is explained by residential patterns. While the role of the underlying residential segregation in The Hague appears stronger than in Rotterdam and Amsterdam, and in Groningen and Almere the role of school selection seems to be particularly large, in most contexts residential segregation accounts for about 80% of school segregation. In these latter cities, the levels of residential segregation are relatively low but school segregation is inflated in the process of school selection.
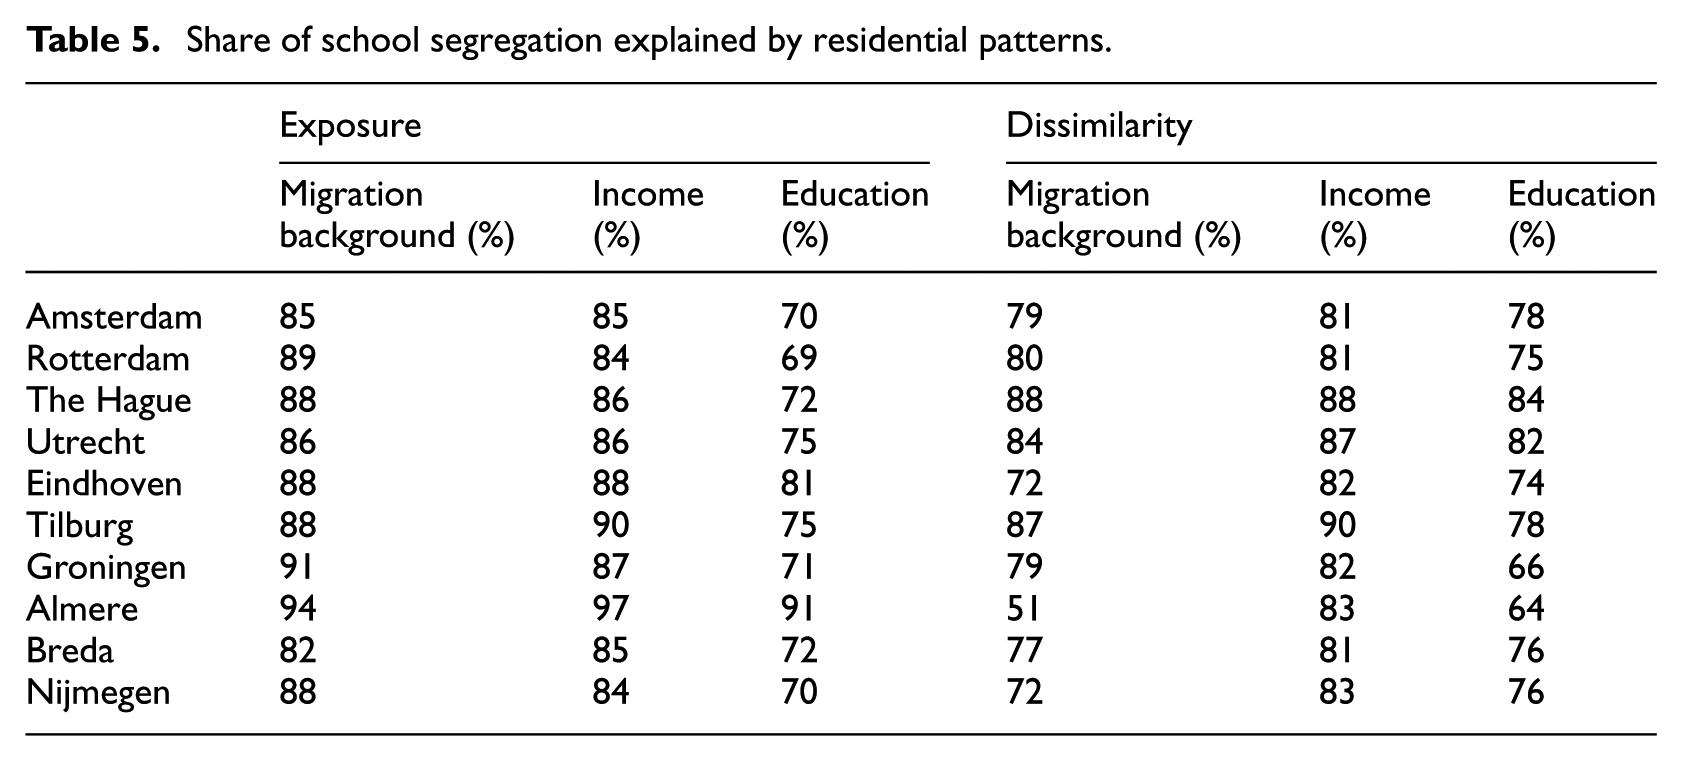
When assessing the same relationship through the Exposure Index (Figure 2a–c), the image is remarkably similar. Again it appears that residential patterns account for much of the school segregation in all cities. For educational attainment the residential patterns appear as a weaker predictor than for income and migration background. In the larger cities, school selection mechanisms seem to be more important than in other urban contexts. Table 5 summarises the results from the calculations for both indexes displayed in the figures. It is evident that while urban contexts are diverse and have their own geographies of education, in all urban contexts about 80% to 90% of school segregation, irrespective of the index used, is accounted for if pupils attend the nearest school. Only Almere presents some interesting outliers, which could be related to the fact that it is the only planned new town among the 10 cities studied. In any case it deserves further attention. Notwithstanding the bigger role of choice in some urban contexts, it becomes evident that in the free school choice context of Dutch cities, where families live is crucial for understanding school segregation.
Share of school segregation explained by residential patterns.
Conclusions and discussion
This article has investigated the trends and patterns of primary school segregation in Dutch cities and how they are related to residential segregation. The case of Dutch cities was utilised to assess to what extent school segregation can be explained by residential patterns in the context of free school choice and a highly differentiated educational landscape, characterised by a wide variety of school types. This article demonstrated that, despite the high degree of choice and the rather egalitarian school landscape, school segregation in different Dutch urban contexts is moderate to high, both for social class and ethnicity. School segregation is not just a phenomenon of the biggest cities such as Amsterdam and Rotterdam, but also of smaller-sized regional centres. Moreover, despite the weak formal role of geography in the allocation of pupils to schools, this article shows that residential patterns explain most of the school segregation in Dutch urban contexts. This provides evidence for the enduring role of geography in shaping social inequalities that are produced through the educational system. This is a highly relevant conclusion in respect to the literature on the geography of education and school choice (Butler and Hamnett, 2007), but it is also important in respect to the global trend in educational reforms that are introducing more parental choice as a means to combat educational inequalities (Ball, 2003). While school choice dynamics are also responsible for a substantial share of segregation in the Dutch context, much of the school selection and resulting segregation are pre-structured by residential processes (cf. Bernelius and Vaattovaara, 2016). This article suggests that residential patterns will continue to matter when school contexts are reformed from neighbourhood-based to choice-based.
A second contribution of this article is that it investigated and compared the levels in different urban contexts. While this increased the robustness of the key findings as described above, it also points to the fact that specific patterns of school segregation vary across spatial contexts. This suggests that despite the nationally defined characteristics of education systems, the geography of education is also significantly influenced by local demographics, local school landscapes and housing market contexts, producing rather variegated trends and levels of segregation. These variegated geographies of education are also reflected in the different trends in segregation across the urban contexts. Segregation of children with different migration backgrounds seems to be in decline in most cities while segregation across social class, and particularly income, is on the rise in most contexts. In the larger cities, however, school segregation by level of educational attainment of parents seems to be getting weaker, but by income it seems to go up. Although I did not explicitly study the mechanisms behind these trends, it seems likely that they are connected to the changing demographic and social composition of those cities. The rise of ethnic school segregation in various urban contexts across Europe, including Dutch cities, was linked to the influx of migrants and the suburbanisation of (white) middle class families (Burgess et al., 2005; Clark et al., 1992). Correspondingly, the rise of the middle class families – (family) gentrification – has significant repercussions for the composition of school populations in various urban contexts (Oberti and Savina, 2019; Van Zanten and Kosunen, 2013). Gentrification and the gradual re- and displacement of lower class families not only affect the class composition of the city but also intersect with the ethnic composition. Gentrification may therefore influence patterns of segregation in neighbourhoods but also at the primary school level. The geography of education literature, which is closely integrated with the gentrification literature, has convincingly demonstrated how residential practices are intertwined with school practices. Not only is it demonstrated how school choice strategies are spatially contingent, but also that residential choices are informed by school choice (Butler and Hamnett, 2007; Boterman, 2013; Noreisch, 2007; Van Zanten and Kosunen, 2013). Moving in or out of neighbourhoods is linked to educational opportunities and constraints related to those places.
This study provides evidence that geography is more relevant in contexts in which school choice is relatively free and should be taken into account in a much more prominent way in studying processes of school choice and segregation. This implies that anti-segregation and other policy measures that aim at reducing educational inequality should take an integrative approach. Such an approach should bring together understandings of the relationship between the school landscape (including the institutional embedding of school choice), the ethnic and class composition of schools and the patterns of residential segregation in specific spatial contexts. This means that educational policies should also be integrated with spatial policies. For instance, social mix policies at the level of the neighbourhood should take into account the consequences for school choice practices, and school policies should be concerned with the repercussion for residential practices. Only when such an integrative perspective is assumed can successful mitigation of the effect of school segregation be achieved.
Footnotes
Declaration of conflicting interests
The author(s) declared no potential conflicts of interest with respect to the research, authorship, and/or publication of this article.
Funding
The author(s) disclosed receipt of the following financial support for the research, authorship, and/or publication of this article: This research was supported by NWO, Dutch Research Council (grant number 016.165.183).