
Abstract
In the last few decades, many governments have implemented urban restructuring programmes with the main goal of combating a variety of socioeconomic problems in deprived neighbourhoods. The main instrument of restructuring has been housing diversification and tenure mixing. The demolition of low-quality (social) housing and the construction of owner-occupied or private rented dwellings was expected to change the population composition of deprived neighbourhoods through the in-migration of middle- and high-income households. Many studies have been critical with regard to the success of such policies in actually upgrading neighbourhoods. Using data from the 31 largest Dutch cities for the 1999 to 2013 period, this study contributes to the literature by investigating the effects of large-scale demolition and new construction on neighbourhood income developments on a low spatial scale. We use propensity score matching to isolate the direct effects of policy by comparing restructured neighbourhoods with a set of control neighbourhoods with low demolition rates, but with similar socioeconomic characteristics. The results indicate that large-scale demolition leads to socioeconomic upgrading of deprived neighbourhoods as a result of attracting and maintaining middle- and high-income households. We find no evidence of spillover effects to nearby neighbourhoods, suggesting that physical restructuring only has very local effects.
Introduction
Many European and North American governments have a long tradition of urban restructuring programmes to regenerate deprived neighbourhoods. The combination of low-quality housing and a variety of socioeconomic problems, such as high crime rates and high unemployment rates, was thought to negatively affect the larger urban area and its residents. On the city level, concentrations of poverty were considered to be detrimental to the economic prosperity of urban regions by reducing the attractiveness of the area to businesses and higher income groups. On the individual level, neighbourhood deprivation was thought to have a negative impact on the individual life chances of residents through a lack of network resources and negative role models. Urban restructuring policies therefore aimed to break up concentrations of poverty and to counteract negative neighbourhood effects by changing the spatial distribution of disadvantaged residents (VROM, 1997).
In many European countries, the main tool of urban restructuring was housing diversification. Through the demolition or sales of low-quality social housing and the construction of more expensive owner-occupied or private rented dwellings, policy-makers aimed to create a socioeconomic mix of residents in deprived neighbourhoods. The in-migration of middle- and high-class households in these neighbourhoods was thought to lead to a process of socioeconomic upgrading (Kleinhans, 2004). It was implicitly assumed that these middle- and higher-income groups would act as role models and network resources for the original residents, thereby improving their individual life chances (Andersson and Musterd, 2005). The socioeconomic upgrading of previously deprived neighbourhoods was also thought to have positive spillover effects on nearby neighbourhoods by improving the housing market position, reputation, and attractiveness of the larger geographical area (cf. Deng, 2011; Ellen and Voicu, 2006).
Many scholars have since been critical about urban restructuring. Some have criticised urban restructuring policies for being a form of state-led gentrification (Uitermark and Bosker, 2014). Similar to other processes of gentrification, state-led gentrification arguably leads to displacement as the demolition and sales of social housing force disadvantaged residents to relocate elsewhere (Boterman and Van Gent, 2014; Uitermark and Bosker, 2014). In addition, the construction of more expensive dwellings stimulates exclusionary displacement, making it financially difficult for low-income residents to move into the neighbourhood (Boterman and Van Gent, 2014; Marcuse, 1986). Others have been critical about the effectiveness of urban restructuring in actually achieving neighbourhood change (e.g. Lawless, 2011; Permentier et al., 2013; Tunstall, 2016; Wilson, 2013). It has been argued that although urban restructuring has led to a physical upgrading of neighbourhoods and a diversified population composition as a result of selective migration, it has failed to improve the lives of disadvantaged residents and it did not lead to significant changes in the socioeconomic status of neighbourhoods (cf. Bailey and Livingston, 2008; Jivraj, 2008; Permentier et al., 2013; Tunstall, 2016; Wilson, 2013).
The present study focuses on the extent to which urban restructuring has stimulated socioeconomic neighbourhood change as a result of changes in the population composition in the 31 largest Dutch cities. While many studies have extensively analysed the effects of urban restructuring on individual outcomes (e.g. Bolt and Van Kempen, 2010; Manley et al., 2012; Miltenburg, 2017), it has been much more difficult to identify the effects of urban restructuring on area-based outcomes (Lawless, 2011). First, urban restructuring programmes were both people-based and place-based programmes that entailed a number of different interventions over time that also differed between neighbourhoods and cities in size and scope. This implies that it has been difficult to ‘measure’ urban restructuring and to identify control neighbourhoods with similar socioeconomic characteristics that did not experience any urban restructuring (Lawless, 2011). The present study overcomes this limitation by focusing on the share of demolished and newly constructed dwellings as the main indicator of urban restructuring. We use propensity score matching to compare neighbourhoods that experienced physical restructuring with neighbourhoods with similar socioeconomic characteristics that did not, allowing us to analyse the causal effect of policy on socioeconomic neighbourhood change.
Second, many studies investigating the effects of physical restructuring have focused on relatively large administrative areas, which means that the effects have to be large to change the trajectory of the entire neighbourhood. We therefore analyse neighbourhood change on a relatively low spatial scale, that is, 500 m × 500 m grids, which allows us to better capture the effects of very localised demolition and new construction.
Third, research has shown that significant changes take time to have effect (Meen et al., 2013; Tunstall, 2016; Zwiers et al., 2017, 2018). Prior studies on urban restructuring in the Netherlands have been limited by a relatively short-term perspective, ranging from one to six years (e.g. Permentier et al., 2013; Wittebrood and van Dijk, 2007), while it is possible that the effects of physical restructuring will only be visible over a much longer period of time. We therefore focus on neighbourhood change over a 15-year period, providing insight into the effects of physical change over and beyond the course of the restructuring programmes and the extent to which restructured neighbourhoods have been successful in maintaining and attracting middle- and higher-income groups over time.
This study focuses on neighbourhood socioeconomic change in the 31 largest Dutch cities between 1999 and 2013. We compare changes in the median neighbourhood income between restructured neighbourhoods, control neighbourhoods, adjacent neighbourhoods, and all other neighbourhoods. We find that restructured neighbourhoods have experienced the highest increase in the median neighbourhood income. We analyse to what extent these changes can be explained by a changed population composition or neighbourhood change in situ. Changes to the housing stock as a result of urban restructuring seem to attract and maintain middle- and high-income households in previously deprived neighbourhoods. However, these effects are very local and do not extend to adjacent neighbourhoods. These findings contribute to our understanding of long-term neighbourhood change and illustrate that large-scale shocks such as physical restructuring can change the trajectory of a neighbourhood.
Physical restructuring and selective migration
Neighbourhoods are very dynamic in their population composition as a result of residential mobility and demographic events; however, neighbourhood status tends to be relatively stable over time (Tunstall, 2016; Zwiers et al., 2017, 2018). This can be explained by the fact the housing stock tends to remain unchanged after initial construction (e.g. Meen et al., 2013; Nygaard and Meen, 2013; Zwiers et al., 2017). Next to less frequent cases of gentrification or decline, this implies that processes of residential mobility often do not lead to neighbourhood change, as households with similar socioeconomic characteristics move in and out of these neighbourhoods, thereby maintaining the status quo over longer periods of time (Meen et al., 2013; Zwiers et al., 2017). Physical restructuring has, however, the potential to induce neighbourhood change by fundamentally changing the housing stock and stimulating selective migration (Meen et al., 2013).
Over the past few decades, many Western European governments have used physical restructuring as a tool to combat processes of decline in deprived neighbourhoods. Although urban restructuring often consisted of both people-based and place-based programmes, most restructuring policies were strongly focused on the housing stock and aimed to create a social mix in deprived neighbourhoods through housing diversification (Kleinhans, 2004). Housing diversification was achieved through the demolition, upgrading or sales of low-quality social rented or council housing and the construction of new upmarket owner-occupied or private rented housing in order to attract a more affluent, middle-class population. The inflow of higher income groups as a result of these tenure changes was expected to lead to the socioeconomic upgrading of these deprived neighbourhoods (Kleinhans, 2004; VROM, 1997).
However, studies evaluating area-based urban policies have been critical about the effectiveness of restructuring in generating processes of neighbourhood upgrading through selective migration (e.g. Lawless, 2011; Permentier et al., 2013; Tunstall, 2016; Wilson, 2013). While some studies have found small positive effects in terms of selective migration as a result of restructuring (Bailey and Livingston, 2008; Jivraj, 2008; Permentier et al., 2013; Wittebrood and Van Dijk, 2007), others have found that selective migration can lead to increasing concentrations of poverty in restructured neighbourhoods (cf. Andersson and Bråmå, 2004; Jivraj, 2008) or elsewhere (Andersson, 2006; Andersson et al., 2010; Posthumus et al., 2013).
In the current literature, it is thus unclear to what extent physical restructuring affects selective migration and how this contributes to socioeconomic neighbourhood change. Researchers have argued that the effectiveness of physical restructuring in generating neighbourhood change depends on the size and scope of these policies (Jivraj, 2008; Nygaard and Meen, 2013; Tunstall, 2016). Major demolition and new construction are necessary to change the trajectory of a neighbourhood (Nygaard and Meen, 2013; Tunstall, 2016). In many cases, only parts of neighbourhoods were targeted for restructuring, which means that the rest of the neighbourhood remained unchanged (cf. Dol and Kleinhans, 2012). This could lead to a (temporary) in-flow of higher income groups in the newly constructed part of the neighbourhood; however, this might not be enough to stimulate the upgrading of the entire neighbourhood. At the same time, many residents from demolished dwellings have moved within the restructured neighbourhood, thereby impeding neighbourhood change (Kleinhans and Van Ham, 2013; Kleinhans and Varady, 2011; Posthumus et al., 2013). When a large proportion of the low-income residents moves within the restructured neighbourhood, a greater share of middle- and higher-income groups moving into the restructured neighbourhood is needed to generate neighbourhood change. Moreover, the effects of physical restructuring might only be visible over a longer period of time as neighbourhood change takes a long time to take effect (Tunstall, 2016; Zwiers et al., 2017). The effectiveness of restructuring depends on the ability of restructured neighbourhoods to maintain and attract middle- and higher-income groups over time. As renovated or newly constructed dwellings age over time, continuous investments are necessary to maintain a certain housing quality (Weber et al., 2006). If this is unsuccessful, positive effects might be visible at first; however, over time, new processes of decline might become apparent, leading to the out-migration of middle- and high-income households (Musterd and Ostendorf, 2005).
The question remains to what extent physical restructuring has effects outside those areas which were directly targeted for demolition and new construction. There are two possible opposing trends. On the one hand, several researchers have been concerned with processes of displacement. As the share of affordable housing is reduced in restructured neighbourhoods low-income households are forced to find affordable housing elsewhere (Atkinson, 2002; Posthumus et al., 2013). This process of displacement might lead to increasing concentrations of poverty in other (nearby) deprived neighbourhoods (Bolt and Van Kempen, 2010; Posthumus et al., 2013). A review of the literature on the effects of urban restructuring programmes in the USA and the Netherlands has, however, found no evidence for such negative spillover effects (Kleinhans and Varady, 2011). On the other hand, US studies have found evidence for positive spillover effects of physical restructuring. Changes to the housing stock in deprived neighbourhoods might improve the reputation and attractiveness of the entire area, leading to positive spillover effects on house prices in nearby neighbourhoods (Deng, 2011; Ellen and Voicu, 2006).
The present study explores three hypotheses. First, we hypothesise that neighbourhoods that have experienced large-scale demolition and new construction, resulting in a substantially different housing stock, have seen more positive change in the median neighbourhood income over time than control neighbourhoods with similar socioeconomic characteristics that have experienced little physical restructuring. Second, we expect that this process of neighbourhood upgrading in restructured neighbourhoods can be explained by a decrease in the share of low-income households and an increase in the share of middle- and high-income households. Third, it could be hypothesised that adjacent areas experienced positive spillover effects as a result of the upgrading of restructured neighbourhoods. Improvements to the housing stock are likely to improve an area’s reputation and lead to rising house prices. We thus might also expect a higher share of higher-income households in neighbourhoods surrounding restructured neighbourhoods.
Data and methods
This study used longitudinal register data from the System of social Statistical Datasets (SSD) from Statistics Netherlands. We have data on the full Dutch population from 1999 to 2013. Neighbourhoods are operationalised using 500 m × 500 m grids. Although 500 m × 500 m grids do not correspond to the administrative boundaries of neighbourhoods, they do provide the geographically most consistent spatial scale as the administrative boundaries of neighbourhoods have changed drastically over time. We focused on neighbourhoods in the 31 largest Dutch cities, leading to a total of 5364 neighbourhoods, and an average population of approximately 800 in 2013. To analyse neighbourhood change over time, we focused on the yearly median household income adjusted for inflation in a neighbourhood. The median is less affected by outliers and thus provides a robust measure of changes in neighbourhood income over time. To ensure the comparability of household incomes across different household types, an equivalence factor was used. We have divided household income by the square root of household size. Conceptually, this means that a four-person household has twice the needs of a single-person household (OECD, 2013).
We focused on neighbourhoods that had experienced substantial restructuring, as the literature suggests that major restructuring is necessary to generate neighbourhood change (Meen et al., 2013; Nygaard and Meen, 2013). We specifically concentrated on the total number of demolished dwellings and new construction as this has been the main tool of urban restructuring in the Netherlands (Kleinhans, 2004). Statistics Netherlands provides information on different types of demolition (partial, complete), with, or without, new construction and/or renovation. We have selected neighbourhoods with more than one standard deviation above the average total number of mutated dwellings between 1999 and 2013. This means that we have selected neighbourhoods with a total number of restructured dwellings ranging from 124 to 1536. This has resulted in a total of 393 neighbourhoods. As the restructuring of these neighbourhoods was expected to have a positive effect on the larger urban area in terms of reputation, house prices, and overall attractiveness, we tested for spillover effects in nearby neighbourhoods. Potential spillover effects would be the strongest in the geographically most proximate neighbourhoods; therefore, we have used queen criteria to identify adjacent neighbourhoods, selecting all neighbourhoods that share a boundary with the restructured neighbourhoods. We have identified a total of 921 adjacent neighbourhoods. Propensity score matching was used to identify control neighbourhoods. Propensity score matching creates matched sets of treated and untreated subjects with similar propensity scores (Rosenbaum and Rubin, 1983). The propensity score is the probability of treatment conditional on a number of observed baseline characteristics (Austin, 2011). This study aimed to compare neighbourhoods with similar socioeconomic status and used the median equivalised household income in 1999, the share of unemployed individuals in 1999, the number of households in 1999 and the share of rented dwellings in 1999 as baseline covariates. Unemployment was defined as receiving unemployment or social assistance for a full year or longer. As we are unable to distinguish between social rented housing and private rented housing in the data, the share of rented dwellings included both, although the majority of rented housing in the Netherlands is social housing (Statistics Netherlands, 2014). The results from the propensity score model indicate that there is a significant positive causal effect of restructuring on the 2013 median neighbourhood income of restructured neighbourhoods (ATET = 709.93 (258.44), p < 0.01). Control neighbourhoods were constrained to have experienced below average physical mutations between 1999 and 2013, with the main goal of isolating the effects of physical restructuring on neighbourhood change. We have used nearest neighbour matching with replacement, which means that restructured neighbourhoods were matched with control neighbourhoods with the closest propensity score (Rosenbaum and Rubin, 1985). Matching with replacement implies that each control neighbourhood can be used as a match more than once, which is particularly useful for the present study as there are only a limited number of neighbourhoods that could function as a suitable control group (Wittebrood and Van Dijk, 2007). We have identified 142 control neighbourhoods with a total number of restructured dwellings ranging from 0 to 31. For comparability, these neighbourhoods were selected from the 31 largest cities within the Netherlands. Control neighbourhoods were not allowed to neighbour restructured neighbourhoods. Maps that illustrate the distribution of the different neighbourhood groups in Amsterdam and Rotterdam are presented in the Appendix.
To reduce selection bias it is important that the covariates are balanced between the treated and untreated subjects. We found no significant mean differences between the control neighbourhoods and the restructured neighbourhoods in the median household income in 1999 (t (173) = 0.73, p > 0.05), the share of unemployed individuals in 1999 (t (156) = 0.33, p > 0.05) and the share of rented dwellings in 1999 (t (216) = −0.77, p > 0.05). There was a significant mean difference in the number of households in 1999 (t (402) = −9.17, p < 0.001). Inspecting the distribution of the explanatory variables with quintiles of the propensity scores proved that the baseline covariates were balanced between the restructured and control neighbourhoods (for more information on balance diagnostics, see Austin, 2009). The only exception here was the number of households in 1999, where we found a discrepancy in the number of households between the restructured and control neighbourhoods, especially in the fourth and fifth propensity score quintile. However, excluding this variable from the propensity score model leads to severe imbalances in the other covariates (results not shown). We therefore kept the number of households in 1999 as a baseline covariate in the propensity model.
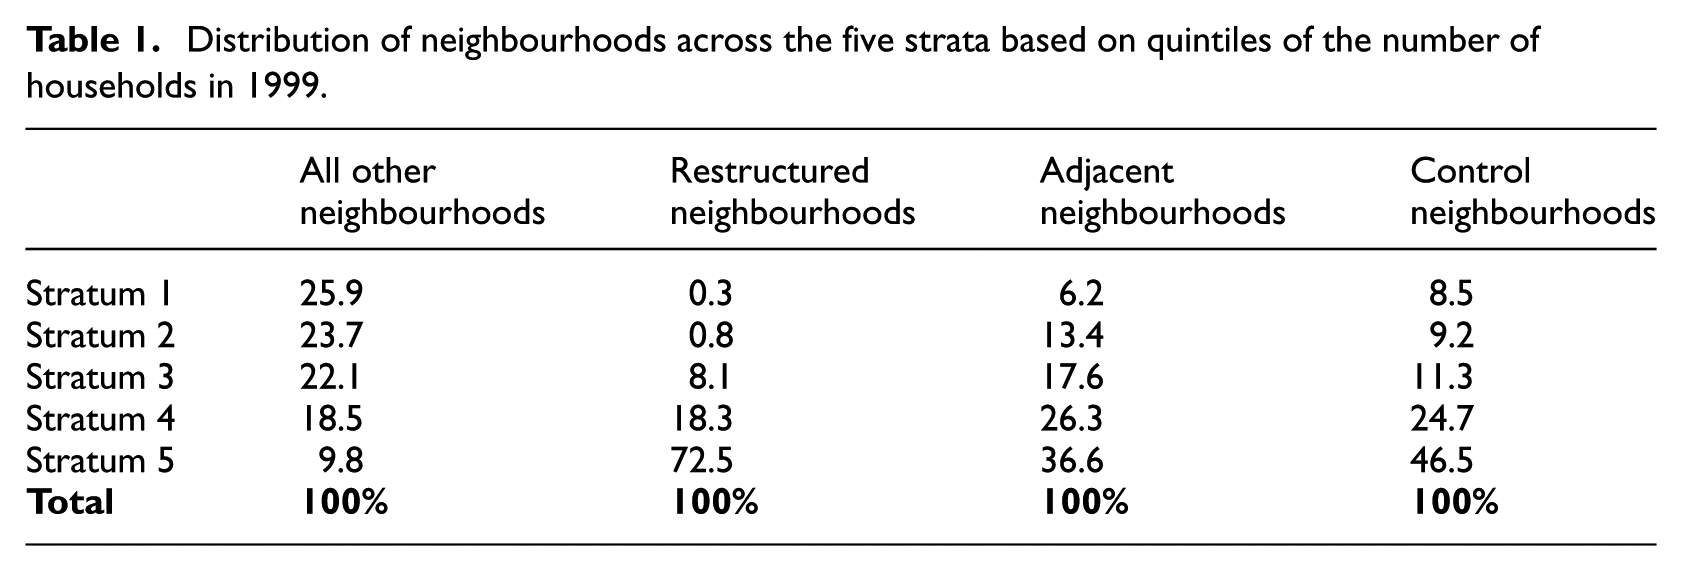
The number of households in 1999 was associated with both our neighbourhood groups and our outcome variable. As mentioned above, the number of households in 1999 was imbalanced between groups. The number of households measures the density in a neighbourhood, but can also be understood as a measure of the potential for change: higher density is generally associated with less change over time. As such, this confounding variable distorted the relationship between our neighbourhood groups and the change in the median neighbourhood income. The inclusion of the number of households as a control variable substantially changed the regression coefficients as the differences between neighbourhood groups became larger and statistically significant (results not shown). Stratification is a way of dealing with confounding by producing groups within which the confounder does not vary. We have therefore created five strata based on quintiles of the number of households in 1999, with the first stratum consisting of low-density neighbourhoods and the fifth stratum of high-density neighbourhoods. Descriptive statistics of the five strata are presented in Table 1.
Distribution of neighbourhoods across the five strata based on quintiles of the number of households in 1999.
We conducted a stratified analysis of five OLS regression models with robust standard errors to explain changes in the median neighbourhood income over time. There was some multicollinearity between the neighbourhood groups in models for the first and second strata because of the small group size of the restructured neighbourhoods and the control neighbourhoods. For these models, these two groups have therefore been combined into one group. The residuals showed some deviations from normality. There was, however, no clear indication of heteroscedasticity and the results from the regression with OLS standard errors did not differ substantially from the results from the regression with robust standard errors. However, the OLS standard errors of the most important predictors were larger than the robust standard errors in the fourth and fifth strata, which suggests that the OLS standard errors were biased upward. As such, we decided to report the results from the OLS regression with robust standard errors.
To better understand the process of neighbourhood change, we analysed changes in the population composition between 1999 and 2013. Based on the national household income distribution, we have created three income categories: low-income groups (the lowest 40%), middle-income groups (the middle 30%), and high-income groups (the top 30%) (see also Hochstenbach and Van Gent, 2015). We focused on changes in the share of the three income groups in the different neighbourhoods. We also analysed in situ change by comparing changes in the median household income of non-movers between 1999 and 2013.
Results
Table 2 presents the descriptive statistics of the restructured neighbourhoods, the adjacent neighbourhoods, the control neighbourhoods, and the rest of the Netherlands.
Descriptive statistics of the different neighbourhood groups, 1999–2013.
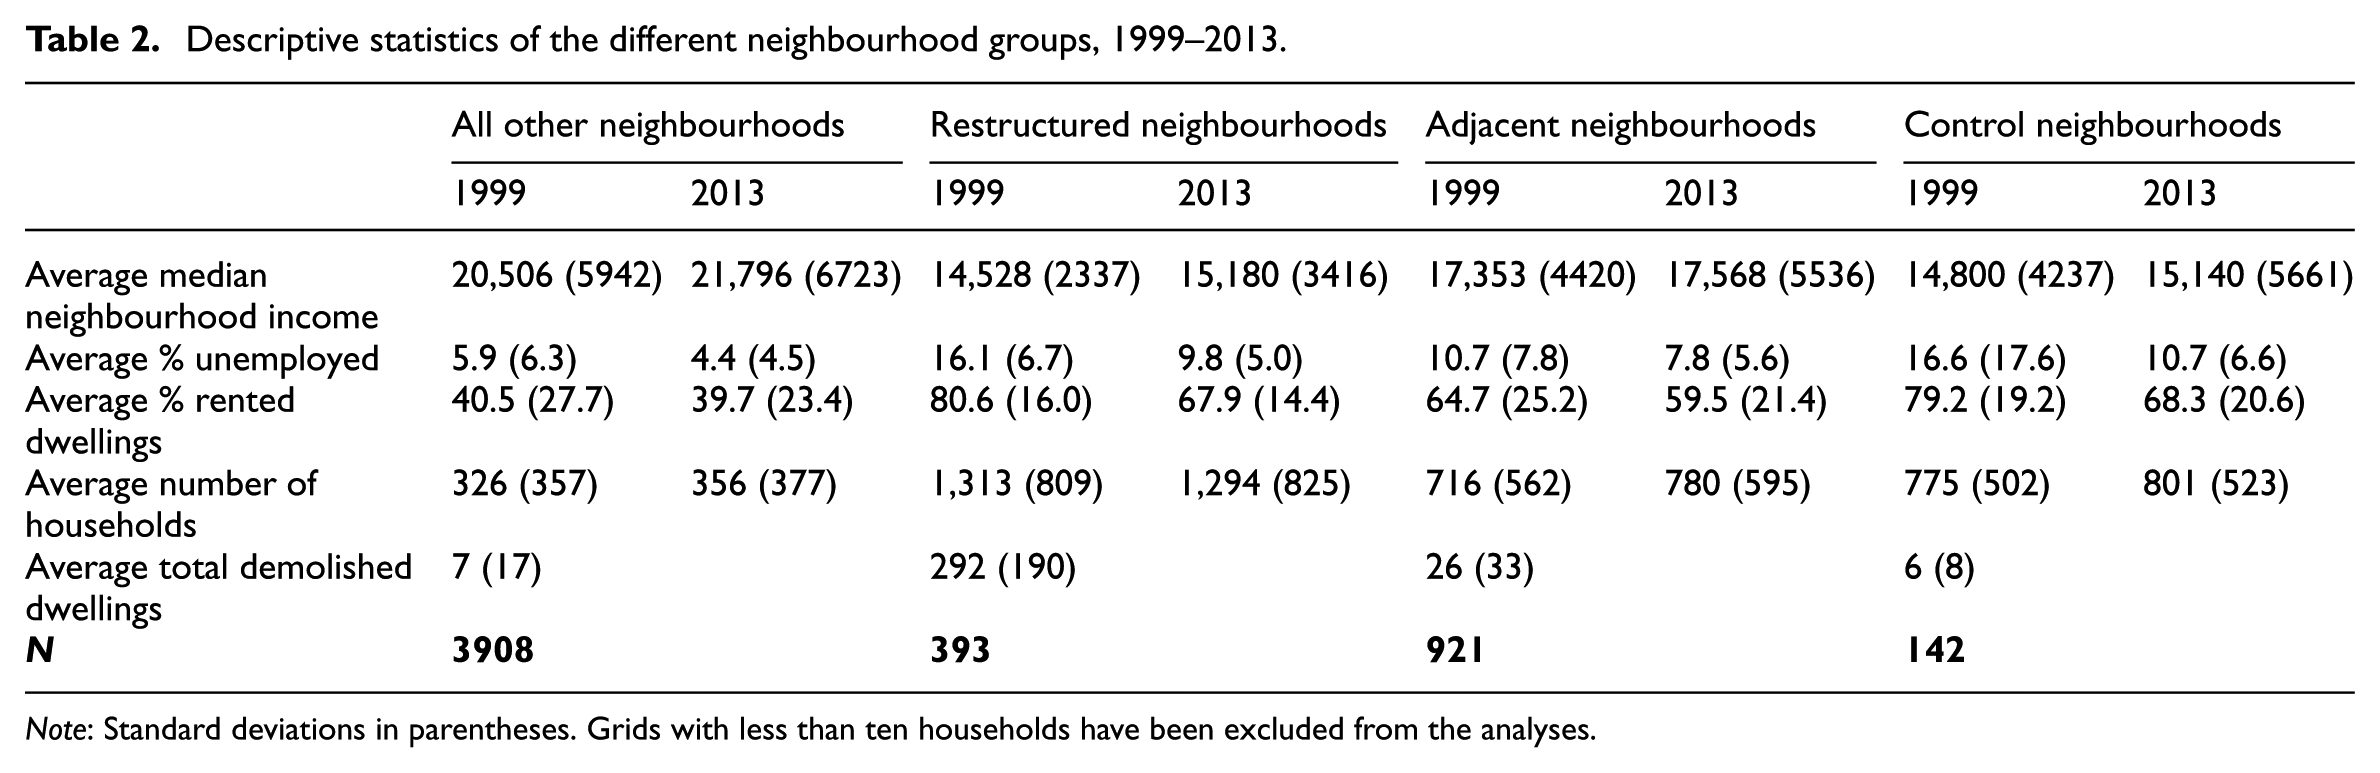
Note: Standard deviations in parentheses. Grids with less than ten households have been excluded from the analyses.
The median equivalised neighbourhood household income in the restructured neighbourhoods was 14,528 euros in 1999. The median equivalised neighbourhood household income was similar in the control neighbourhoods, 14,800 euros, and higher in the adjacent neighbourhoods, 17,353 euros. The median equivalised neighbourhood household income was much higher in the rest of the Netherlands, 20,506 euros. The average share of unemployed individuals was 16.1% in the restructured neighbourhoods, compared with 10.7% in adjacent neighbourhoods and 16.1% in the control neighbourhoods. These shares are far above the average share of unemployed individuals in the rest of the rest of the country: 5.9%. These descriptive figures indicate that neighbourhoods that have experienced large-scale demolition and new construction were among the most disadvantaged neighbourhoods in the country. The average share of rented dwellings in 1999 was 80.6% in the restructured neighbourhoods, which was similar to the average share of rented dwellings in the control neighbourhoods, 79.2%. The average share of rented dwellings in the rest of the country was almost half of that in the restructured neighbourhoods: 40.5%. The average share of rented dwellings in the adjacent neighbourhoods was 64.9%. The restructured neighbourhoods were highly populated areas: the average number of households in 1999 was 1313, compared with 775 in the control neighbourhoods, 716 in the adjacent neighbourhoods, and 326 in the rest of the country.
In 2013, the median equivalised neighbourhood household income adjusted for inflation increased to 15,180 euros in the restructured neighbourhoods. This means that, after adjusting for differences in household size and inflation, the median neighbourhood income has increased by 652 euros, reflecting a 4.5% increase. This increase is almost twice the increase in the control neighbourhoods: the 2013 median neighbourhood household income increased to 15,140 euros, reflecting an average increase of 340 euros, or 2.3%. The median neighbourhood household income in the adjacent neighbourhoods increased by 216 euros to 17,568, showing a 1.2% increase. All other neighbourhoods in the Netherlands experienced an average increase of 1289 euros leading to a median neighbourhood household income of 21,796, reflecting a 6.3% increase. The average share of unemployed individuals dropped in all areas. The average unemployment rate declined to 9.8% in the restructured neighbourhoods, compared with 10.7% in the control neighbourhoods, 7.8% in the adjacent neighbourhoods, and 4.4% in the rest of the country. The average number of households remained relatively stable in all grids: in 2013, the average number of households was 1294 in the restructured neighbourhoods, 801 in the control neighbourhoods, 780 in the adjacent neighbourhoods, and 356 in the rest of the Netherlands.
The average number of demolished dwellings between 1999 and 2013 was 292 in the restructured neighbourhoods and the average share of rented dwellings decreased to 67.9% in 2013, reflecting an average reduction of almost 15%. The average number of demolished dwellings in the control neighbourhoods was much lower: 6. However, the average share of rented dwellings also decreased substantially in these neighbourhoods: from 79.2% to 69.3%. The average number of demolished dwellings was 26 in adjacent neighbourhoods and the average share of rented dwellings decreased to 25.7%. The average number of demolished dwellings was 7 in the rest of the Netherlands, and these neighbourhoods have also experienced a small decrease in the average share of rented dwellings: from 41.6% in 1999 to 40.1% in 2013. While the decrease in the share of rented dwellings in the restructured neighbourhoods can most likely be ascribed to physical restructuring, the decrease in the share of rented dwellings in the other neighbourhoods can be the result of other factors. As the Dutch policy of urban restructuring went hand-in-hand with the liberalisation of the housing market, homeownership was increasingly stimulated and many rented dwellings were sold off to owner occupiers (Uitermark and Bosker, 2014).
Table 3 presents the results from the stratified OLS regression on neighbourhood income change. The results from the first stratum show no significant results between the restructured and control neighbourhoods (reference group) and the adjacent neighbourhoods, and all other neighbourhoods in the Netherlands. This suggest that in low-density areas, the change in the median neighbourhood income is similar in all neighbourhoods. The median equivalised neighbourhood income in 1999 was included as a baseline covariate to control for floor and ceiling effects. The median equivalised neighbourhood income in 1999 has a positive effect on the change in neighbourhood income (b = 0.69, p < 0.001). To test if the changes in the average neighbourhood income are not just driven by housing market dynamics in the four largest cities, dummy variables have been included. Compared with the rest the Netherlands, we find no significant differences in the neighbourhood income in low-density neighbourhoods in Rotterdam, The Hague, and Utrecht. Low-density neighbourhoods in Amsterdam seem to have experienced a significantly lower increase in the neighbourhood income than the rest of the Netherlands (b = −3342.01, p < 0.001).
Results from the stratified OLS regression with robust standard errors on the 2013 median neighbourhood income.
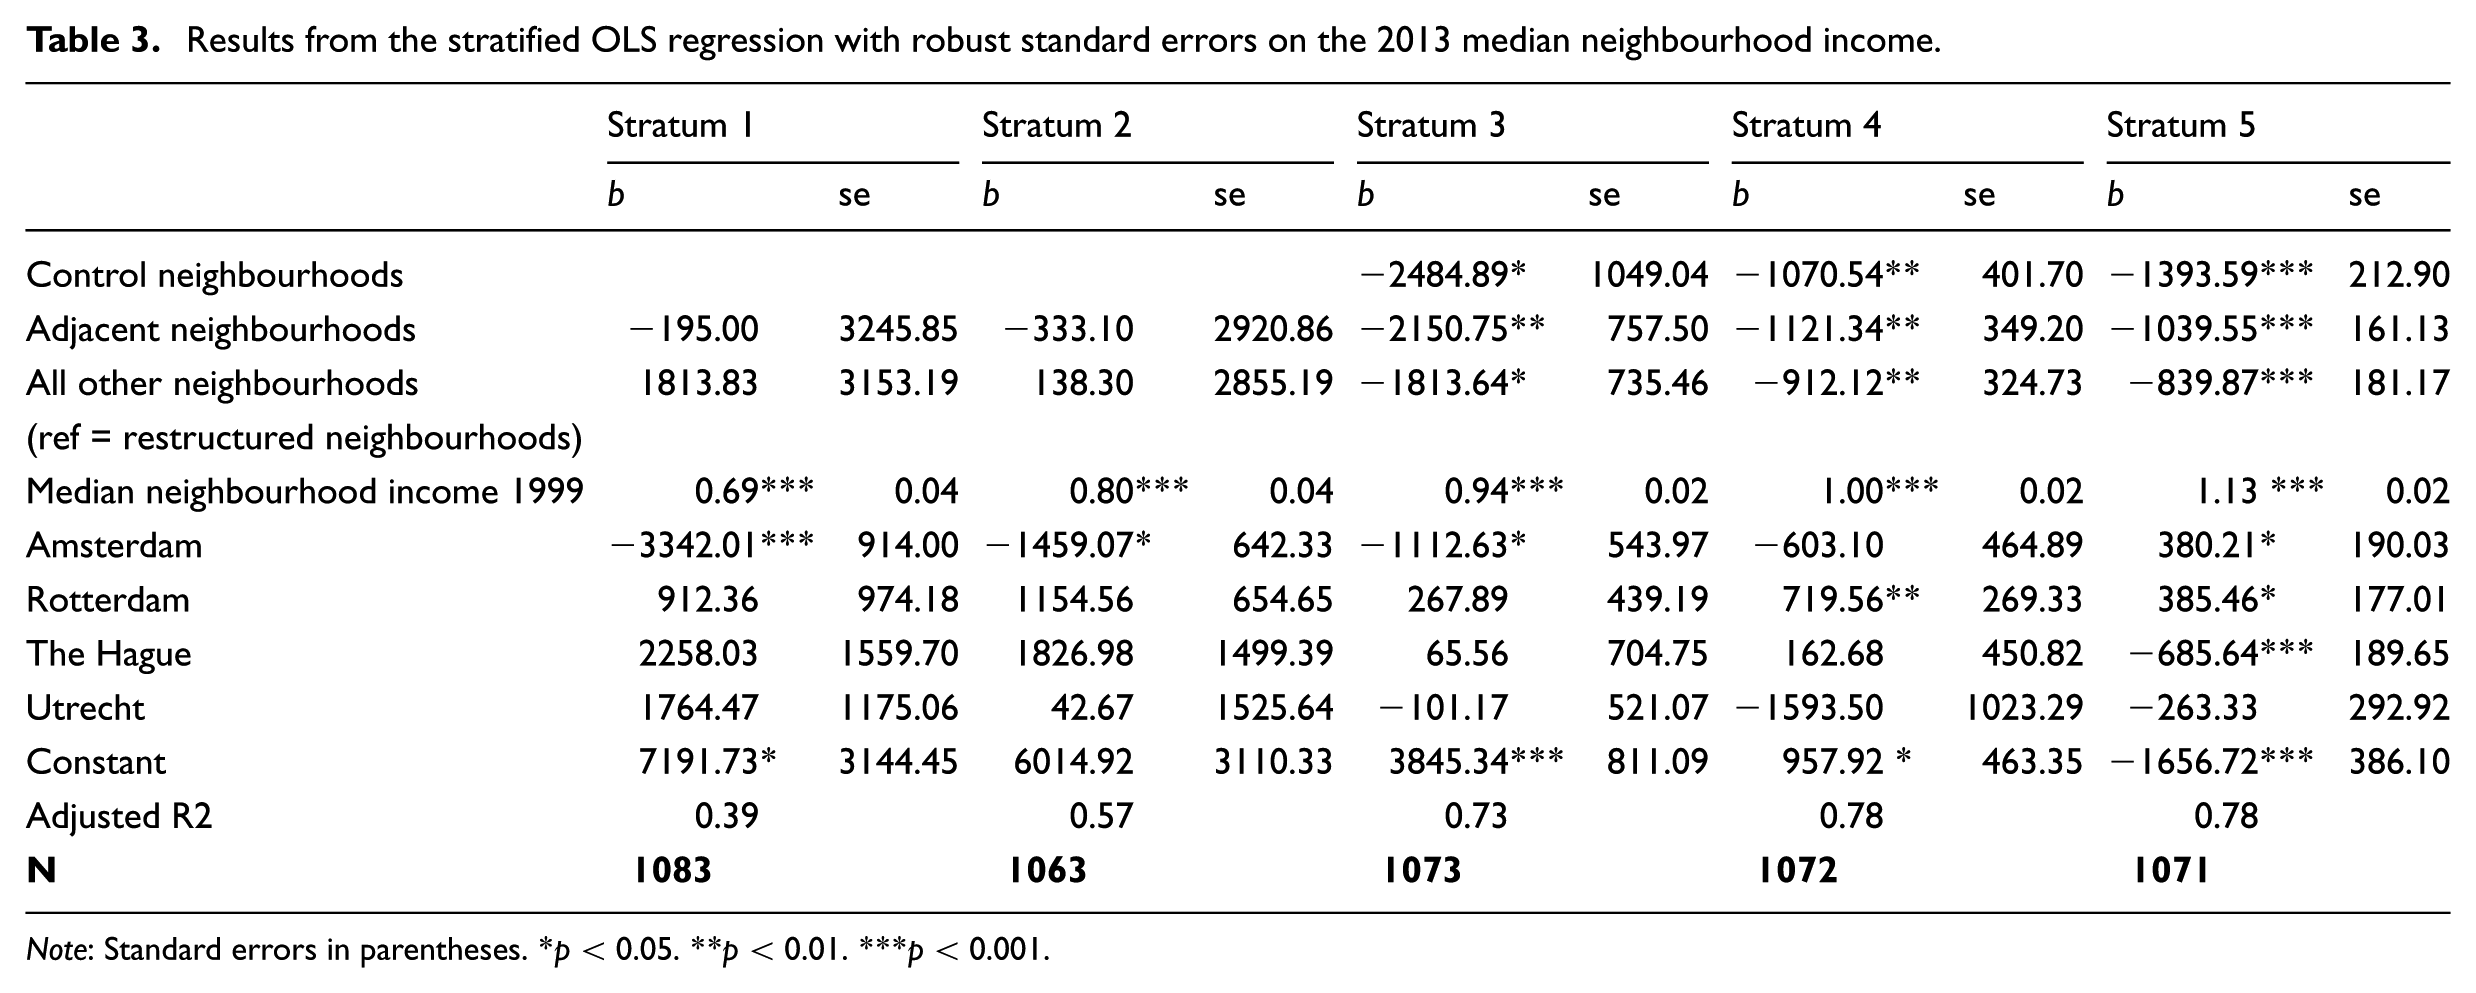
Note: Standard errors in parentheses. *p < 0.05. **p < 0.01. ***p < 0.001.
The results for the second stratum show no significant differences between restructured and control neighbourhoods, and adjacent neighbourhoods, and all other neighbourhoods. For these neighbourhoods, the median neighbourhood income in 1999 is the most important predictor (b = 0.80, p < 0.001). There are no significant differences between Rotterdam, The Hague, Utrecht, and the rest of the country. Neighbourhoods in Amsterdam show a significantly lower increase in the median neighbourhood income (b = −1459.07, p < 0.05).
We find significant differences in the change in the neighbourhood income between the neighbourhood groups in the third, fourth and fifth stratum. In all three strata, the restructured neighbourhoods show a significantly higher increase in the median neighbourhood income between 1999 and 2013. In the fifth stratum, the control neighbourhoods show a significantly lower increase in the median neighbourhood income compared with the restructured neighbourhoods (b = −1393.59, p < 0.001). Both the adjacent neighbourhoods and all other neighbourhoods also show a significantly lower change in neighbourhood income compared with the restructured grids, (b = −1039.55, p < 0.001) and (b = −839.87, p < 0.001), respectively. This finding implies that in higher-density areas, the restructured grids have seen the most change in the median neighbourhood income.
In high-density neighbourhoods, the average neighbourhood income in 1999 has a positive effect on neighbourhood income change (b = 1.00, p < 0.001) and (b = 1.13, p < 0.001) in the fourth and fifth stratum, respectively. The median neighbourhood income in 1999 is the strongest predictor of neighbourhood change in both models (β = 0.89, and β = 0.92). The importance of the median neighbourhood income in 1999 illustrates a strong degree of path dependency (Zwiers et al., 2017). Neighbourhoods with a high median income in 1999 have experienced an increase in the median neighbourhood income over time: neighbourhoods that did well in 1999 do better in 2013. In a similar vein, we find that Amsterdam and Rotterdam experienced significantly more change compared with all other neighbourhoods in the fifth stratum (b = 380.21, p < 0.05) and (b = 385.46, p < 0.05). As many inner-city neighbourhoods in Amsterdam and Rotterdam have become increasingly popular over time, both cities have experienced processes of gentrification resulting in strong rises in house prices and neighbourhood income (Hochstenbach and Van Gent, 2015). Contrarily, high-density neighbourhoods in the Hague have experienced a significantly lower increase in the median neighbourhood income compared with the rest of the country (b = −1656.72, p < 0.001), which indicates a process of neighbourhood decline.
Most of the change in neighbourhood income seems to occur at the top end of the density distribution. The models for the fourth and fifth stratum both explain 78% of the variation in the change in the median neighbourhood income. This seems to suggest that processes of gentrification and decline together with large-scale urban restructuring have had major effects on neighbourhood socioeconomic change in high-density areas.
To understand to what extent these socioeconomic changes can be explained by a changed population composition, we analysed the changes in the share of different income groups in the four neighbourhood types. Table 4 presents the share of low-, middle-, and high-income groups in 1999 and 2013.
Population change in the four neighbourhood types, 1999–2013.
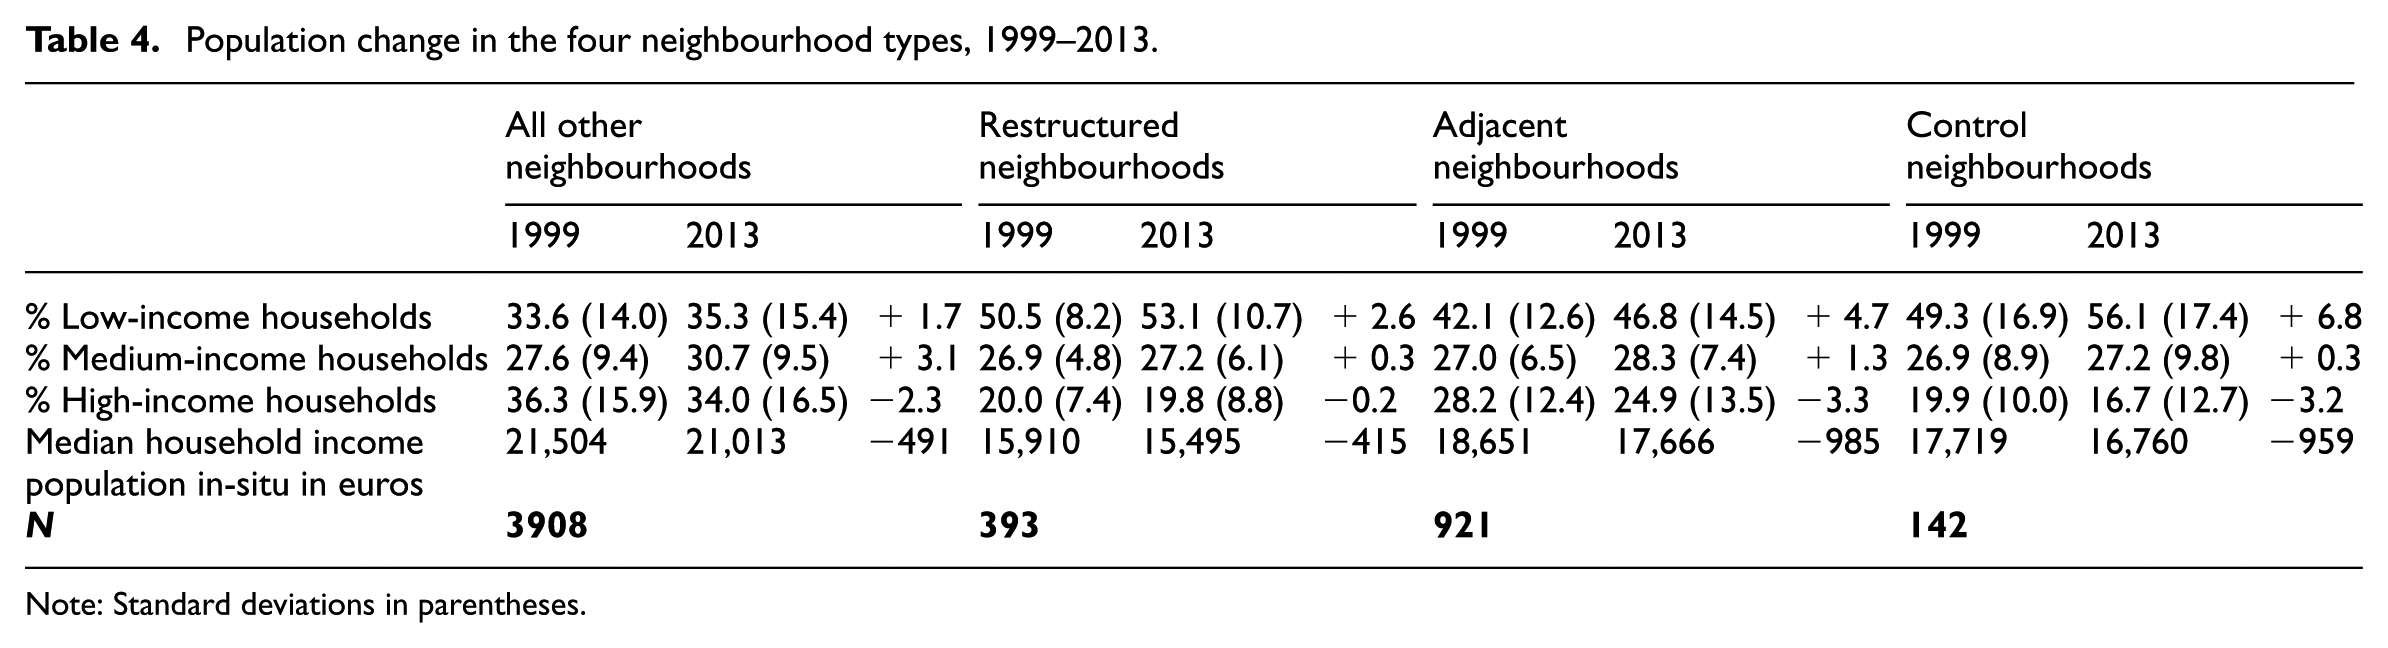
Note: Standard deviations in parentheses.
The share of low-income households increased in all four neighbourhood groups. The control neighbourhoods experienced the highest increase in the share of low-income households, 6.8%, compared with 4.7% in the adjacent neighbourhoods, and 2.6% in the restructured neighbourhoods. The rest of the country saw the smallest increase in low-income households, 1.7%. Despite processes of forced relocation, the restructured neighbourhoods continued to be accessible to low-income households over time. The share of middle-income households increased by 0.3% in the control neighbourhoods and the restructured neighbourhoods, compared with 1.3% in the adjacent neighbourhoods and 3.1% in the rest of the country. The share of high-income households decreased substantially in all four neighbourhood groups: 3.2% in the control neighbourhoods, 3.3% in the adjacent neighbourhoods, and 2.3% in all other neighbourhoods. The restructured neighbourhoods experienced a small decline of 0.3% in the share of high-income households, suggesting that physical restructuring has had a positive effect on the ability of these neighbourhoods to attract and maintain high-income households.
As urban restructuring was expected to have a positive effect on the socioeconomic situation of the sitting population, we analysed changes in the median household income. The median household income has decreased in all four neighbourhood types over the 1999–2013 period. The control and adjacent neighbourhoods experienced a decline of 959 and 985 euros in the median household income among the population in situ, showing a 5.4% and 5.3% decrease. The decline in the median household income in the restructured neighbourhoods is similar to the decline in the rest of the country: 415 compared with 491 euros, reflecting a decrease of 2.6% and 2.3%, respectively.
Discussion and conclusion
This paper has analysed the effects of large-scale demolition and new construction on neighbourhood income change over time and has studied changes in the population composition. We find that restructured neighbourhoods have experienced the largest increase in the median neighbourhood income. Focusing on a low spatial scale, our results indicate that large-scale demolition and new construction have strong positive effects on the neighbourhood income developments of deprived neighbourhoods.
Restructured neighbourhoods have been most successful in attracting and maintaining higher income groups compared with all other neighbourhoods. The decline in the median income among the population in situ was relatively small in the restructured neighbourhoods. Although it is difficult to assess to what extent this can be attributed to urban restructuring, it does seem to indicate that restructured neighbourhoods have become more resilient to decline over time. While it is often argued that the demolition of low-cost rental housing and the construction of owner-occupied and private rented dwellings lead to the displacement of low-income households (e.g. Boterman and Van Gent, 2014), we find that restructured neighbourhoods continue to be accessible to low-income households. Although some low-income households have had to relocate elsewhere as a result of restructuring, this process of displacement appears to have been temporary. However, it is unclear to what extent these neighbourhoods experience exclusionary displacement (Marcuse, 1986). The decline in the share of social housing in these neighbourhoods might make the neighbourhood (financially) inaccessible to the most disadvantaged residents, forcing them to move to other low-income neighbourhoods. This might be a possible explanation for the large increase in the share of low-income households in the adjacent and control neighbourhoods.
Although it is often assumed that improvements to the housing stock lead to a better reputation of the entire area (VROM, 1997), and that increased house prices have spatial spillover effects on nearby dwellings and neighbourhoods (Deng, 2011; Ellen and Voicu, 2006), we do not find evidence for positive spillover effects to adjacent neighbourhoods. On the contrary, adjacent neighbourhoods actually seem to suffer as a result of urban restructuring. Adjacent neighbourhoods have experienced a relatively large increase in the share of low-income households, most likely as a result of forced relocation (Posthumus et al., 2013). In addition, adjacent neighbourhoods have seen the largest decrease in the share of high-income households and the largest decline in the median household income among the population in situ. Although it is difficult to assess to what extent these developments are direct spillover effects of urban restructuring, it does indicate that the positive effects of urban restructuring do not extend beyond the restructured neighbourhood. Future research should focus on the specific spillover effects of restructuring on nearby areas over time, as spillover effects might take time to take effect.
The findings from the present study shed new light on the effectiveness of urban policies. Many studies have been unable to isolate an effect of urban policies on neighbourhood change, which can be explained by the relatively short time span, the focus on large administrative units, the difficulty in measuring ‘urban policies’, and finding a suitable control group. The present study has therefore focused on physical restructuring on the level of 500 m × 500 m grids over a 15-year time period. The use of a measure of demolition and new construction as the main indicator of physical restructuring allowed us to identify a reliable control group. However, identifying a suitable control group is challenging in this field of research. Our control group was very similar to our treatment group in terms of socioeconomic status, but differed substantially in urban density. Because we selected control neighbourhoods from different cities, we cannot be certain that different labour markets and/or housing markets played a role in our findings. In addition, it is possible that the control neighbourhoods were targeted for urban restructuring but on a different scale or with different interventions. Our control neighbourhoods also experienced a decline in the share of rented housing, which can most likely be attributed to the sales of rented housing. Analysing the effects of sales policies on neighbourhood income developments was, however, beyond the scope of this study but would be an intriguing avenue for future research.
Despite these limitations, our findings provide enough evidence to suggest that physical restructuring has positive effects on neighbourhood socioeconomic change. As neighbourhoods are generally relatively stable over time, large-scale demolition seems an effective way to fundamentally change the built environment and population composition in a neighbourhood within a relatively short period of time. The change in the median neighbourhood income in restructured neighbourhoods is significantly higher than in any of the other neighbourhoods, which shows that physical restructuring functions as a shock that induces neighbourhood change through selective migration (Meen et al., 2013). The question remains to what extent restructured neighbourhoods will be able to maintain their improvements and continue along this trend. The present study has focused on the effects of urban restructuring on the neighbourhood level; whether urban restructuring has positive effects on individual outcomes is still subject to debate.
Footnotes
Appendix
Declaration of conflicting interests
The author(s) declared no potential conflicts of interest with respect to the research, authorship, and/or publication of this article.
Funding
The author(s) disclosed receipt of the following financial support for the research, authorship, and/or publication of this article: This research leading to these results has received funding from the European Research Council under the European Union’s Seventh Framework Program (FP/2007–2013) / ERC Grant Agreement n. 615159 (ERC Consolidator Grant DEPRIVEDHOODS, Socio-spatial inequality, deprived neighbourhoods, and neighbourhood effects).