
Abstract
Black teachers experience racialized microaggressions at varying levels in their professional settings. Existing measures of these microaggressions are not context specific. We developed items following a critical quantitative research inquiry approach. Item response theory (IRT) provided validation evidence for the Teacher Experiences of Racialized Microaggressions (TERM) scale. Black U.S. teachers (n = 526) participated. Results revealed a 15-item unidimensional factor structure. IRT analyses revealed the TERM scale measured racialized microaggression levels ranging across the continuum. Use of the TERM scale has implications for understanding the racialized experiences of Black and other underrepresented teachers across other subject areas.
Keywords
Teachers of color often experience racialized microaggressions in their professional contexts (e.g., Kohli, 2018). The need to examine teachers’ racialized experiences is imperative, due to their profound implications such as lasting mental health impacts and physical and psychological stressors (Kohli, 2018; Nadal, 2011; Torres-Harding et al., 2012). The microaggressions experienced by teachers of color are often ignored in mainstream educational policy research (DeCuir-Gunby & Gunby, 2016; Martin, 2009). However, the implications of negative verbal and nonverbal experiences have long-term effects on teachers of color, and the desire to continue in the teaching profession (Frank et al., 2021; Ingersoll & May, 2011; Kohli, 2018). In previous research, teachers of color shared their experiences of microaggressions such as being treated with disdain or mistrust, or feeling dismissed by colleagues (Kohli, 2018), and, specifically, Black teachers have noted specific anti-Black microaggressions that impact their workplace experiences (Brown, 2019). While most Black teachers are concentrated in urban schools (Bond et al., 2015), their experiences of microaggressions persist regardless of the racial composition of their workplace or the extent to which their schools are urban intensive, urban emergent, or urban characteristic (Milner, 2012).
Racial microaggressions were first defined as racial offenses that are expressed in an unconscious manner (Pierce, 1970). Microaggressions are brief, subtle, everyday exchanges that send negative slights or insults to a person of color (Sue et al., 2007). Prior studies show that people of color in educational contexts experience racial microaggressions (e.g., Compton-Lilly, 2020; DeCuir-Gunby & Gunby, 2016; Garcia-Louis et al., 2020; Kohli, 2018). Such experiences have a negative impact on job satisfaction. A few scales have been developed to measure racial microaggressions based on the racial microaggression taxonomy by Sue et al. (2007). The participants in these prior studies did not specifically consist of teachers or professionals in a teaching context (Nadal, 2011; Torres-Harding et al., 2012). Prior studies have developed or used items that examined the racialized experiences of people of color in a workplace or general context (DeCuir-Gunby & Gunby, 2016). This study examines the psychometric properties of the microaggression items in the Black Teachers of Mathematics Perspectives Survey (BTOMPS), a survey developed as part of a larger study of Black mathematics teacher retention. This instrument is based on items from an existing instrument for students of color at the University of Illinois (Harwood et al., 2015). Specifically, the BTOMPS instrument is used to measure racial microaggression for Black teachers in a school-specific context.
Another purpose of this study is to employ item response theory as a method of analysis. Prior studies that developed instruments used to measure racial microaggressions employed exploratory and confirmatory factor analyses (Nadal, 2011; Torres-Harding et al., 2012). There are no other known studies using item response theory (IRT) to analyze an instrument measuring racialized experiences of teachers on an item-level basis. This study will validate the BTOMPS through exploratory factor analysis, and item response theory methods.
This study is also part of a larger investigation funded by the National Science Foundation that seeks a deeper understanding of the experiences of Black mathematics teachers, past and present, and how their experiences help us theorize about the role of Black mathematics teachers in shaping educational policymaking, teacher preparation programs, and proposed retention efforts to retain a more diverse mathematics teaching force.
Critical Race Quantitative Inquiry
Microaggressions in the teaching environment were examined through a critical race theory (CRT) framework. We ground our research in critical race theory. CRT asserts that racism is endemic in U.S. culture. Specifically, CRT highlights how racism is perpetuated at structural levels, and has implications at the interpersonal level. With its roots in legal scholarship (Bell, 1980; Crenshaw et al., 1995), CRT was introduced to education through the work of Ladson-Billings and Tate (1995), and expanded by other scholars (e.g., DeCuir & Dixson, 2004; Delgado & Stefancic, 2017; Ladson-Billings, 1998; Solórzano & Yosso, 2002; Taylor et al., 2016; Yosso, 2005). Since its introduction, CRT has been used to study myriad issues in education broadly (e.g., Cook, 2015; Han & Laughter, 2019) and mathematics education specifically (e.g., Davis & Jett, 2019). CRT is a useful theoretical tool to unpack the racialized experiences of Black mathematics teachers, specifically as we interpret and analyze experiences of racialized microaggressions.
CRT uses research methods to analyze race and racism within societal structures based on color and status hierarchy (Ledesma & Calderon, 2015). CRT is used to examine these societal structures of racism for teachers of color as manifest through microaggressions. The work of critical scholars bridged the gap between quantitative analyses and CRT within the education context. For example, critical race quantitative intersectionality (CRQI) is a quantitative methodology used to frame research, policy, and practice for the purpose of social justice and educational equity in a field dominated by qualitative research methods (Covarrubias & Velez, 2013). CRQI supports the posing of research questions and the disaggregating of data by taking communities of color into account through quantitative analysis (Covarrubias & Velez, 2013). Later, Gillborn et al. (2018) and Garcia et al. (2018) furthered the discussion with the use of the term QuantCrit.
QuantCrit and CRQI share similar tenets. These tenets serve to offer a toolkit to understanding our environment. CRQI operates from the following tenets: a) numbers do not speak for themselves, b) quantifying intersectionally, c) experiential grounding data and, d) commitment to structural transformation of intersectional subordination (Covarrubias et al., 2019). QuantCrit follows these tenets: (a) the centrality of racism, (b) numbers are not neutral, (c) categories are neither natural nor given for race, (d) data cannot speak for itself, and (e) numbers should be used to promote social justice (Garcia et al., 2018; Gillborn et al., 2018). This paper details the development and results of a microaggression scale through these critical race quantitative inquiry framework. To effectively measure teachers’ microaggression experiences we first recognized the fluidity and pervasive nature of racism and its impact on the education context. In measurement theory quantitative values are added to represent behaviors (Crocker & Algina, 2008). However, we believe these values are neither neutral nor do they speak for themselves and warrants the context considered and explained. Finally, we accept the challenge of developing a measure that accounts for the intersectionality within the education context.
Prior Studies of Microaggressions
Microaggressions exist in various forms. Sue et al. (2007) proposed three types of microaggressions: microassaults, microinsults, and microinvalidations. A microassault is an explicit verbal or nonverbal attack meant to harm the intended victim, for example, using a racial epithet towards a person. A microinsult is a subtler form of a microaggression, characterized by insensitive or demeaning verbal or nonverbal messages, for example, ignoring a person of color in a conversation. Lastly, microinvalidation is characterized by nullifying the thoughts, feelings, or experiential reality of a person of color for example, dismissing the negative experiences of a person of color.
Torres-Harding et al. (2012) used the racial microaggressions taxonomy by Sue et al. (2007) to develop the Racial Microaggressions Scale (RMAS) to measure racial microaggressions experienced by people of color. Using exploratory factor analysis and confirmatory factor analysis, the study provided evidence that the RMAS is a reliable and valid tool for measuring microaggressions experienced by people of color. A 35-item, six-factor structure was developed using exploratory factor analysis with the first half of the sample (n = 189), and confirmatory factor analysis was conducted with the second half of the sample (n = 188). A six-factor scale with 32 items emerged from the confirmatory factor analysis. Based on the racial microaggressions taxonomy, several factors fit with the proposed model: criminality (one is treated as dangerous or aggressive), foreigner/not belonging (not a “true” American), environmental invalidations (absence of people from one’s racial background), sexualization (exoticized because of racial background), invisibility (being dismissed because of race), and low-achieving-undesirable culture (belief that someone is successful only because of affirmative action).
Nadal (2011) developed the Racial and Ethnic Microaggressions Scale (REMS) using the racial microaggressions taxonomy by Sue et al. (2007). This instrument was developed to measure racial microaggressions that people of color experience in their everyday lives. After developing the racial microaggressions items based on the racial microaggressions taxonomy by Sue et al. (2007), exploratory factor analysis and confirmatory factor analysis was used to test the validity of the scale. The findings indicate that the REMS is an adequate measure of racial microaggressions. Exploratory factor analysis (n = 443) determined that out of 131 items entered into factor analysis, 79 items remained with six factors (Assumptions of Inferiority, Second-Class Citizen and Assumptions of Criminality, Microinvalidations, Exoticization/Assumptions of Similarity, Environmental Microaggressions, and Workplace and School Microaggressions. Confirmatory factor analysis was conducted with a new sample (n = 218) and determined that the REMS is an adequate measure of racial microaggressions (high coefficient alphas over .80 in the two independent samples).
Similar to Nadal (2011) and Torres-Harding et al. (2012) authors later developed and provided validation evidence for measures assessing microaggressions. For example, Franklin et al. (2014) explored the impact of racial microaggression on behavioral and psychological stress responses in Latinx college (and recently completed college) students. In exploring these relationships, Franklin et al. developed a 13-items measure of racial microaggression using principal component analysis. Lewis and Neville (2015) also created a microaggression measure focusing on the intersection of gender and racial microaggression. Using exploratory factor analysis, the authors concluded a 27-item four-factor solution measuring for the gendered racial microaggression scale for Black women. Both measures were influenced by the work of Sue et al. (2007).
DeCuir-Gunby and Gunby (2016) used critical race analysis to empirically explore various tenets of CRT (the permanence of racism, Whiteness as property, and color blindness) and the Racial and Ethnic Microaggressions Scale developed by Nadal (2011) to determine that higher education professionals (n = 53) have higher levels of racial microaggressions in this sample, compared to K-12 educators (n = 22). This may be a result of a lower percentage of a racially diverse work environment in higher education. The organizations in this study average 25.9% people of color (DeCuir-Gunby & Gunby, 2016). The findings indicated that the one-way ANOVA for K-12 educators in this study were not significant, possibly due to the small sample size. The results for higher education professionals concluded that there is a negative relationship between assumptions of inferiority and job satisfaction, and there is not a negative relationship between detachment and job satisfaction. Additionally, marital status had a positive effect on job satisfaction. People of color may experience more racial microaggressions in settings with more members of the majority race (DeCuir-Gunby & Gunby, 2016). Lastly, additional education, higher incomes, and even marital status are not associated with experiencing fewer racial microaggressions for people of color (DeCuir-Gunby & Gunby, 2016).
More recently, Brown (2019) reported the experiences of 29 African American teachers in Southern California. Brown uncovered five themes of teachers’ reported microaggression: myth of meritocracy, pathologizing cultural values and communication styles, cultural/ethnic insensitivity, ascription of intelligence, and treated as a second-class citizen. These teachers felt the meritocracy myth forces them to work extra hard to negate the negative stereotypes of the dominant culture and to prove their worthiness. For the second theme, teachers expressed a feeling of having an inferior communication style, leading to monitoring speech and language (e.g., volume, directness, and quality or articulation). When interacting with nonminority colleagues, African American teachers felt a diminished racial heritage and identity, and isolation. Brown found that participating teachers expressed feelings that their intelligence and worth ethic were regularly questioned. Finally, teachers also felt a sense of subordination and lack of support from White parents and administrators.
There are pervasive, negative impacts of racism in all parts of society, including education (DeCuir-Gunby & Gunby, 2016). In the current study, the critical race quantitative inquiry framework is used to theorize the work environment of teachers of color. The dearth of studies on the impact of racial microaggressions for teachers of color indicate the need for an instrument to assess teachers’ racialized experiences in the school context. The lasting psychological impacts for teachers of color, as well as the level of job satisfaction and retention in the teaching profession support the need for this study (DeCuir-Gunby & Gunby, 2016).
Existing studies traditionally examine the experiences of teachers of color via qualitative methodologies. Researchers developed quantitative measures to understand microaggression experienced by people of color (e.g., Franklin et al., 2014; Lewis & Neville, 2015; Nadal, 2011; Torres-Harding et al., 2012). However, no measure was specifically developed to examine Black teachers’ racialized experiences. Capturing the experiences of teachers of color via quantitative studies provides further empirical support of their experiences on a large-scale basis. To highlight these experiences, the field needs to develop and validate instruments that measure the experiences that teachers of color have of racialized microaggressions in schools.
Microaggression Items
The BTOMPS survey consists of myriad items capturing the demographic and professional experiences of Black mathematics teachers. Though many of the questions are specific to teaching mathematics, the microaggression scale developed for the survey is not subject specific. Thus, it can be administered to teachers across subject areas, races, and ethnicities. The microaggression items were developed from several resources. The first is a Racial Microaggression Scale used with students of color in a 2015 study from the University of Illinois Urbana-Champaign. The items for the Racial Microaggression Scale were adapted from the Schedule of Racist Events, the Index of Race-Related Stress, and the Racial Life Experiences Scale (Sue, 2010; Hurtado et al., 2008). The purpose of understanding the racialized experiences of students of color is supported by prior research studies indicating that racial discrimination occurs in university contexts (Booker, 2007; D’Augelli & Hershberger, 1993). A mixed methods study of approximately 4,800 students of color yielded findings that many students of color experience racial microaggression on their college campus (Harwood et al., 2015). Students of color often report feeling uncomfortable on campus (39%) and share experiences of being stereotyped because of their race (51%) (Harwood et al., 2015). Furthermore, students of color also state that they feel their contributions are minimized (27%) and they are not taken seriously in the classroom (25%) because of their race (Harwood et al., 2015). The racial microaggressions experienced by students of color on college campuses informed the development of the survey items on the BTOMPS, in order to assess the racial microaggressions experienced by teachers of color in the K-12 school context.
Additionally, the development of the racialized microaggression items for the BTOMPS was based on the narrative stories of 218 diverse teachers of color from across the United States conducted by Rita Kohli (2018). The findings from Kohli’s qualitative study informed the development of the survey items in the BTOMPS. Teachers of color reported feelings of hostile work environments, with experiences of “color blindness” and racial microaggressions as commonplace in the school context. Color blindness ignores race or racial differences. Teachers of color often report feeling invisible, stereotyped, questioned, “othered,” isolated, disrespected, and overlooked for leadership opportunities. Teachers of color often feel that their usefulness is limited to having a similar racial identity with the students, but opportunities to be seen as instrumental in transforming or having a purpose in the field of education is limited by the racial microaggressions experienced in the school context. The racial microaggressions against teachers of color impact their professional growth and retention in the teaching profession.
The items were also inspired by the findings of Frank et al. (2018) that documented the experiences of over two dozen pre-service and in-service teachers in schools serving predominantly Black children. Teachers interviewed referred to being essentialized as one-dimensional disciplinarians who can manage “those Black kids,” but are not honored for their content knowledge as teachers of mathematics who have gifts to share with all children.
Therefore, the development of a survey to understand the experiences of Black teachers in the school setting was important to this study. The response options represent the frequency which the teachers experienced racial microaggressions: “Never,” “Less than Once a Year,” “A Few Times a Year,” “About Once a Month,” “A Few Times a Month,” and “Once a Week or More.”
Method
Participants and Data Source
We surveyed 526 Black teachers of Mathematics nationwide (53% identified as females). The BTOMPS survey was developed with intentionality to recruit Black teachers. Partnering with the Benjamin Banneker Association, we recruited participants from across the United States. Additionally, participants were identified from district-level mathematics supervisors and organizations that focus on addressing the concerns and interests of Black teachers. Full completion of the survey created an eligibility for a $25 gift card. The participants’ age ranged between 18 and 65 years (M = 34.9, SD = 8.6). The majority of the teachers identified as African American (98.2%). Other teachers specified their ethnicity as Caribbean (1.1%), African, Afro-Latino, and bi-racial/multi-racial. Teachers reported a minimum of a Bachelor’s degree (50.1%), Master’s degree (17.5%), doctoral degree (2.9%), and a specialist degree (2%). The teachers taught between 0.5 and 34 years. Specifically, 38.7% of the teachers taught for less than five years, between 5 and 10 years (45.6%), and 11 years or more (15.7%). They taught regular scheduled classes (at least one class weekly) at elementary (22.2%), middle (45.2%), and high schools (31.9%). The participants taught at public traditional (59.2%), public charter (22.8%), public magnet (12.5%), and parochial/religious schools (2.4%). Most teachers (64.1%) took a traditional route to licensure for mathematics teacher certification (e.g., culminated in a degree/license at a university).
Cognitive Interviews
To provide evidence of content validity, first we solicited the assistance of a team of six researchers with expertise in race, mathematics education, and teacher education to confirm the items were capturing the content domain. These experts were asked to provide adjustments and/or inclusions of items missing from the item pool (DeVellis, 2017). We also conducted cognitive interviews with four currently practicing Black teachers and teacher leaders, three women and one man, each having over 15 years of teaching experience in urban and suburban schools. The individual interviews lasted an average one hour (between 45 min to 1.5 h). Participants sat with a researcher to review the survey item for clarity of understanding. Additionally, they responded to researchers’ questions regarding the underlying meaning of each item, the length of the instrument, and the general structure of the items.
Data Analysis
Exploratory Factor Analysis
We assessed the factor structure of the microaggression scale with an exploratory factor analysis (EFA). EFA is exploratory in nature therefore we relied on theory, correlations between items and factor(s) (loadings), percent variance explained by the factors, and the Kaiser’s eigenvalue greater than criterion to determine the number of factors to retain. Because this criterion is the default in most statistical software, it has been incorrectly employed to assess factor retention. In this respect, we considered the common variance in each item (using communalities) to corroborate the Kaiser criterion. Field (2009) argues for an average communality of .60 or greater with large samples (n > = 250). The Kaiser-Meyer-Olkin (KMO; Kaiser, 1970) statistic measures the adequacy of the sample for factor analysis. KMO values range between zero and one. Values greater than .50 are acceptable while values larger than .90 are considered superb (Hutcheson & Sofroniou, 1999).
Field (2009) argues for the use of principal axis factoring when extracting latent factors. We applied an oblique rotation method assuming correlated extracted factors from the items. Tabachnick and Fidell (2019) proposed that the factor solution should account for at least 50% of the total item variance. Additionally, with large samples, Meyers et al. (2017) recommend factor loadings of approximately .40. We conducted the EFA in IBM SPSS Statistics Version 24.
Item Response Theory
It is important to develop sound measurement tools, especially when focusing on psychological constructs such as microaggression. Item response theory (IRT; also known as latent trait theory) is a system of mathematical models used to determine individual and item location on the continuum of the construct of interest (de Ayala, 2009; Embretson & Reise, 2000). IRT provides a modern mechanism for developing and assessing psychometric properties of measures, instead of the more traditional classical test theory (CTT).
IRT follows several assumptions (see de Ayala, 2009). Two key assumptions are dimensionality and local dependence. Dimensionality is often assessed using factor analysis. Local dependence “occurs when examinees [respondents] item responses depend not just on their trait level but on their responses to other test items or other common factors” (Embretson & Reise, 2000, p. 231). In short, dependence occurs when items are correlated after we account for the latent trait (de Ayala, 2009).
We used IRT methods to aid in finalizing items used to develop the microaggression scale. We focused on two fit indices: the root mean square error of approximation (RMSEA; Steiger & Lind, 1980) and the M2 statistics that uses an asymptotic chi-square distribution (Maydeu-Olivares & Joe, 2005). RMSEA served as a supplementary fit index because the M2 statistics tends to be untrustworthy with large samples. RMSEA values ≤ 0.08 reflects reasonable model fit (Hu & Bentler, 1998, 1999).
The gender variable in the BTOMPS was framed to incorporate respondents’ preferred identification following the notions of CRQI. Respondents selected the traditional categories: ‘male’ and ‘female.’ ‘Sex-DIF’ which was assessed because of the ways that Black male and female teachers are often characterized in the literature. For instance, Black male teachers are often characterized as hyper-masculine and needed in schools that serve large populations of boys of color to administer a tough love, no nonsense form of discipline (Pabon, 2016), often leaving them as ‘the discipline stop’ in their schools (Brockenbrough, 2015). Black women are often characterized as firm, yet nurturing caregivers, that is, othermothers (Dixson, 2003) and warm demanders (Ware, 2006) who demand much of their students, but do it in affirming ways. While there is some merit to these characterizations, at the root of them are harmful stereotypes that render Black male and female teachers as one dimensional. Further, their content and pedagogical expertise are often under-recognized and under-developed when school leaders only view teachers of color through these lenses (Frank, 2019; Frank et al., 2018). While the characterizations of male and female Black teachers differ, we assert that both of them are rooted in latent and sometimes harmful racial stereotypes.
IRT parameters were estimated in flexMIRT® version 3.5 (Cai, 2017) using marginal maximum likelihood. We used Chen and Thissen (1997) chi-square statistics included in flexMIRT® to assess the local dependence assumption required for IRT. Chi-square values greater than 10 are cause for concern (Cai et al., 2013).
Results
Cognitive Interviews
Overall, the cognitive interviews did not yield substantive changes to the survey. The teachers and experts agreed with the items generated to measure the construct. Minor changes included reordering questions so that all of the questions related to instructional practice were answered consecutively. Other changes included language to be more aligned to the teaching practice. For example, one teacher suggested that the questions about microaggressions be reworded to also address school-level experiences. One unanticipated result was the emotional responses that two teachers had in response to thinking about their teaching careers through the lens of race. Per their feedback, we made additional minimal changes to the survey (e.g., language and question order).
Exploratory Factor Analysis
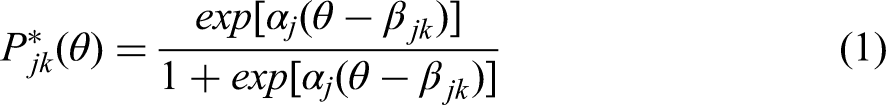
The KMO statistic (.97) confirms the sample adequacy for factor analysis. Table 1 shows the factor solution of the 15 items. We retained a one-factor solution. Item-factor correlations (factor loadings) ranged from .69 (Item-15) to .86 (Item-7 and Item-9), larger than the recommended .40 (Meyers, et al., 2017). The communality values ranged from .47 to .74, with an average of .65, also larger than the recommendation by Field (2009). The one-factor solution accounted for 64.81% of the observed variance, surpassing the minimum 50% (Tabachnick & Fidell, 2019). We calculated internal consistency using Cronbach’s alpha for the microaggression scale, α = .97.
Factor Loadings and Communalities for the 15-Item Microaggressive Experiences Scale.
Note. h2 represents communalities; Kaiser-Meyer-Olkin sample adequacy = .967; Variance explained = 64.81%.
Item Response Theory
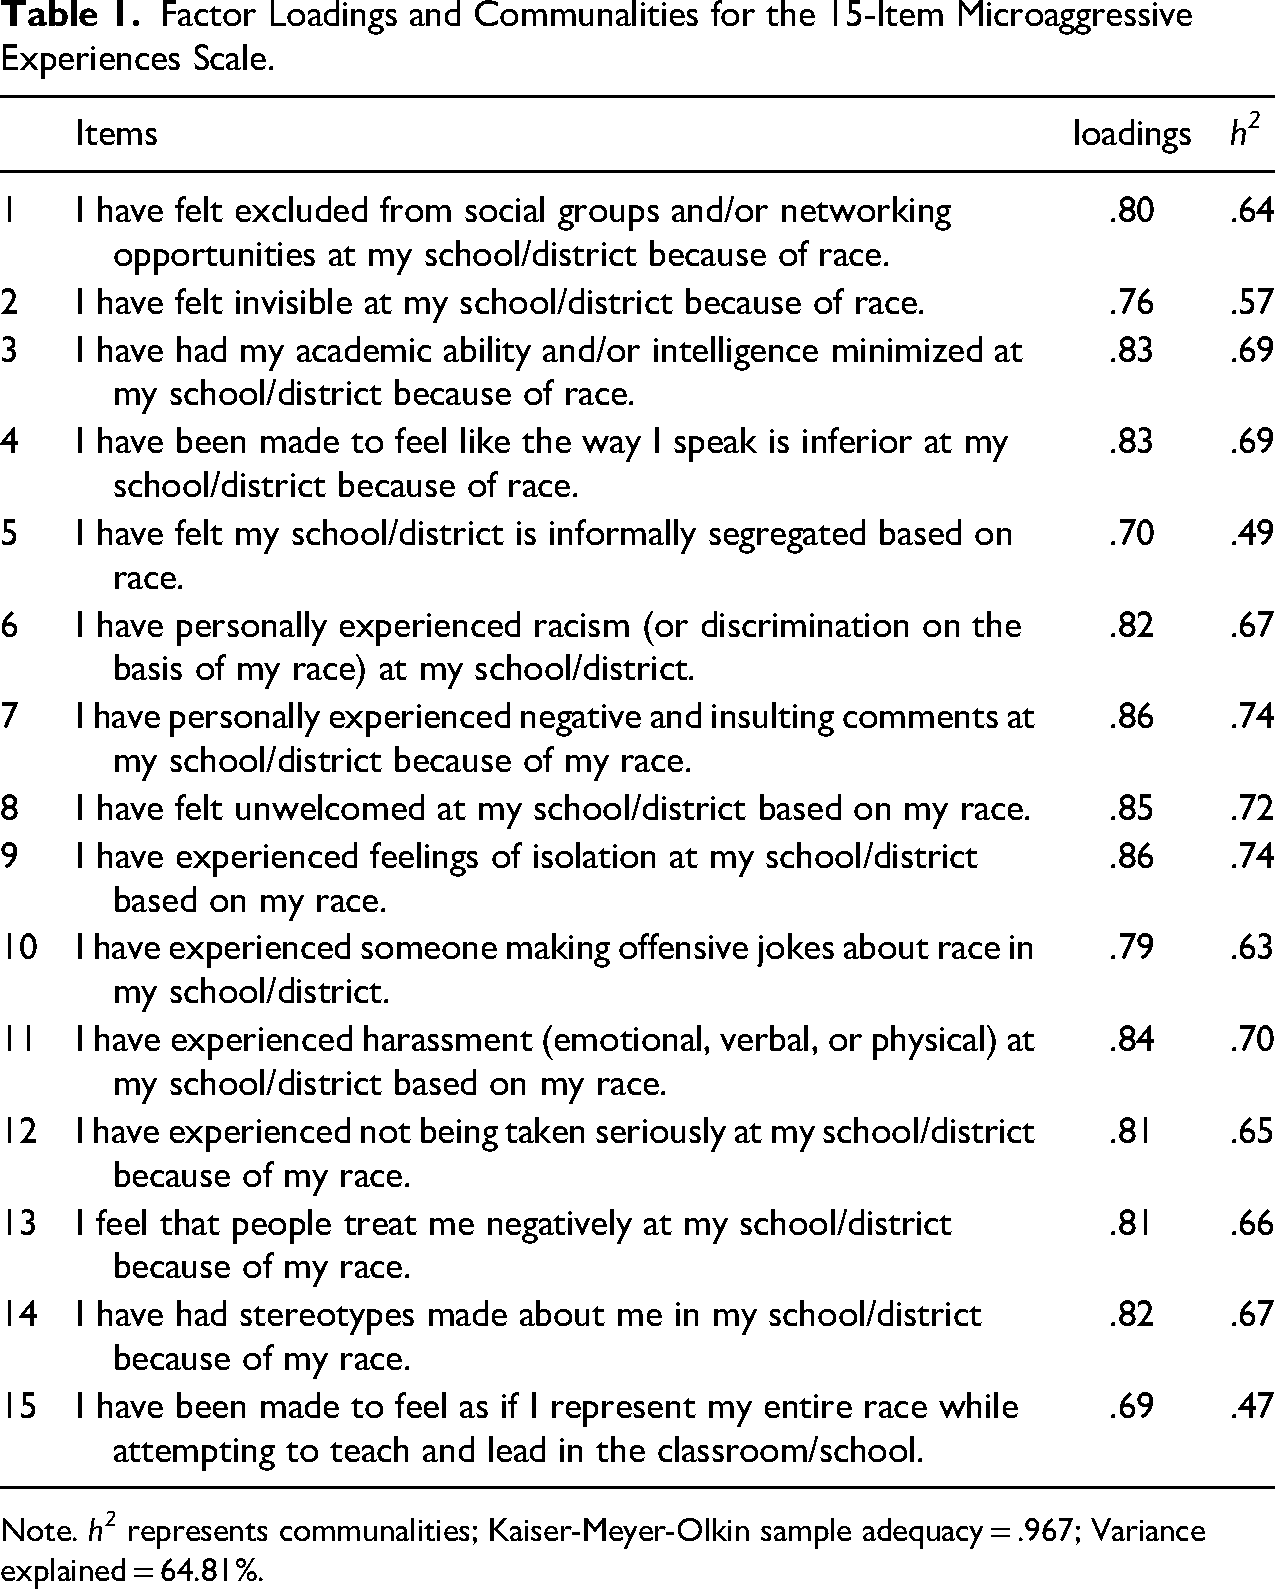
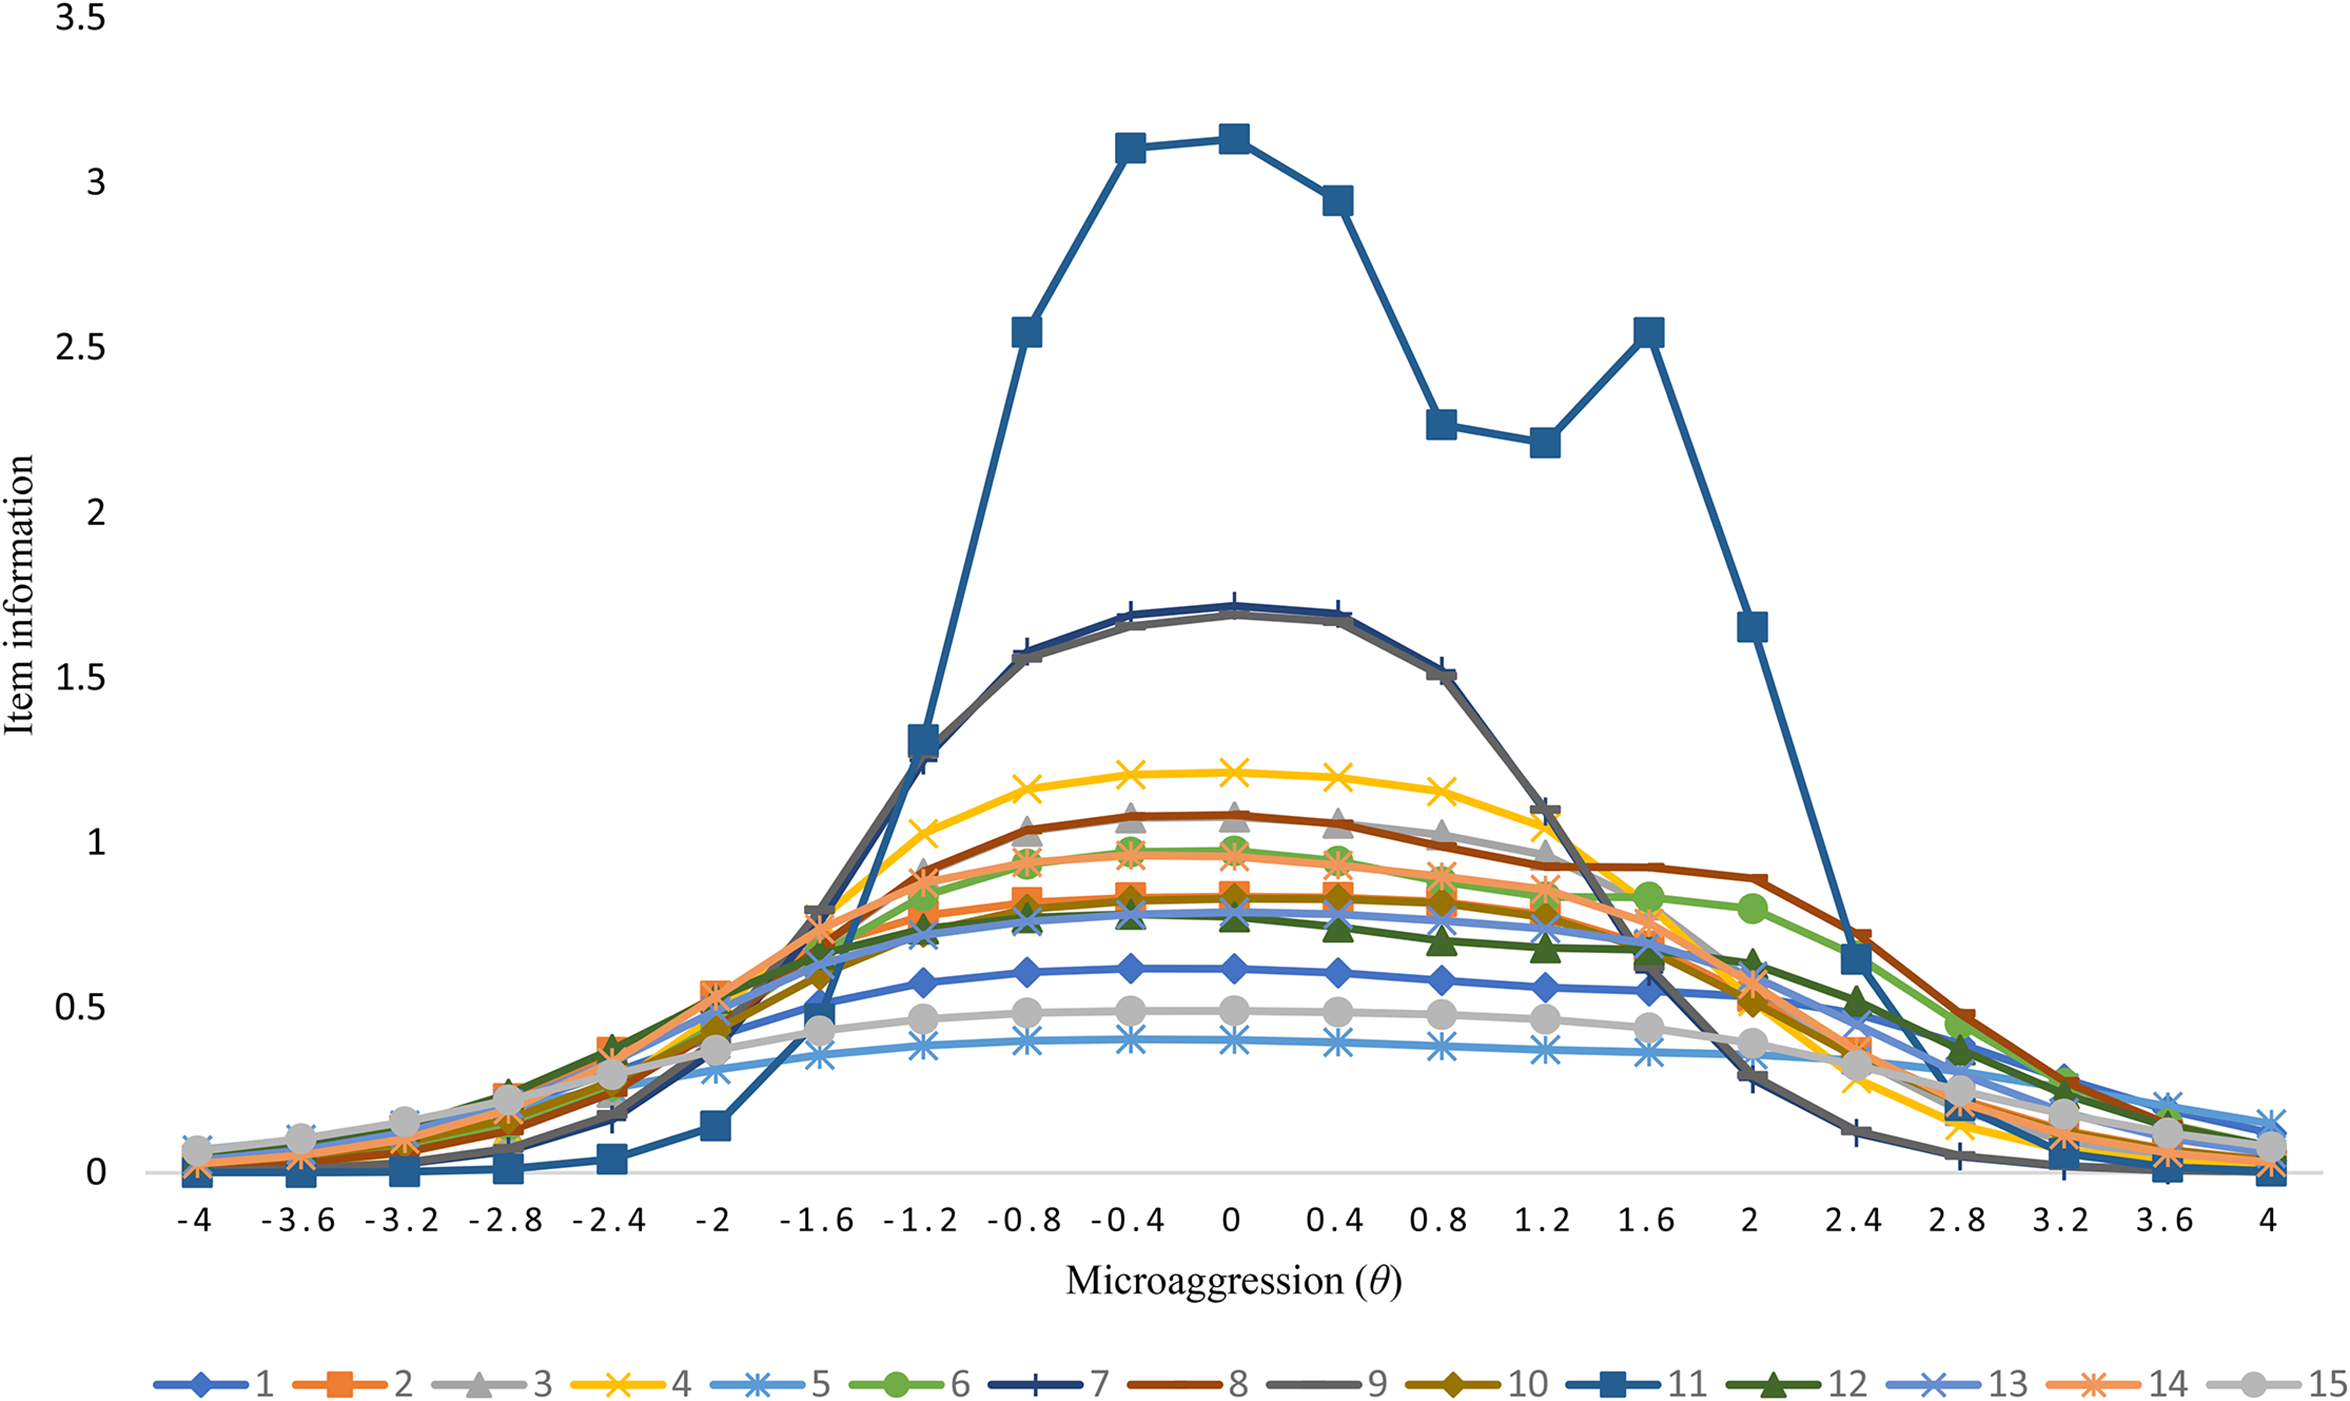
We assessed the assumptions required for IRT analyses. Dimensionality was confirmed by the one-factor solution found from the EFA. Chi-square test values ranged 1.0 to 7.0 for the items (Table 2), indicating local independence assumption met (Cai et al., 2013). With the assumptions satisfied, we assessed a unidimensional GRM for the microaggression scale. The graded response model indicated reasonable fit (M2 (2984) = 10,169.06, p < .001, and RMSEA = 0.07). Thresholds and item discriminations parameters are also presented in Table 2. Item discrimination parameters (a) range from 1.12 to 3.16 reflecting moderate to very high discrimination (Baker, 2001). The highest discriminating item is Item-11: I have experienced harassment (emotional, verbal, or physical) at my school/district based on my race. The threshold parameters (bi) span from −0.66 to 2.35 suggesting the items typically cover a fair range of microaggression experiences. The b1 threshold for Item-11 indicates that a −0.66 level of microaggression experienced is required respond above the first category (“Never”), a −0.37 to respond above “Less than Once a Year,” and 1.58 to respond above “Once a Week or More” (b5) with a .5 probability. All items have negative and positive thresholds suggesting participants across the racial microaggression continuum (at a .5 probability) are likely to endorse the response categories. The item information functions are provided in Figure 1. The y-axis contains information - the precision of the item in measuring microaggressive experiences - and the x-axis represents the levels of microaggressive experiences. Item-4, Item-7, and Item-9 provide the most information widely across the trait continuum while Item-5 the least information. The test information curve (Figure 2) reveals that the 15 items together perform well in assessing individuals, two standard deviations below and approximately 2.5 standard deviations above the mean microaggressive experience. In other words, the scale is most effective in measuring microaggressive experiences in Black teachers within the stated range.
Item information for the 15-item racialized microaggressive experiences scale across the theta (the latent trait scores).
Total information for the 15-item racialized microaggressive experiences scale across the theta (the latent trait scores). The solid line represents the total information while the dotted line shows the standard error of measurement.
IRT Discrimination and Threshold Parameters for the 15-Item Microaggressive Experiences Scale.
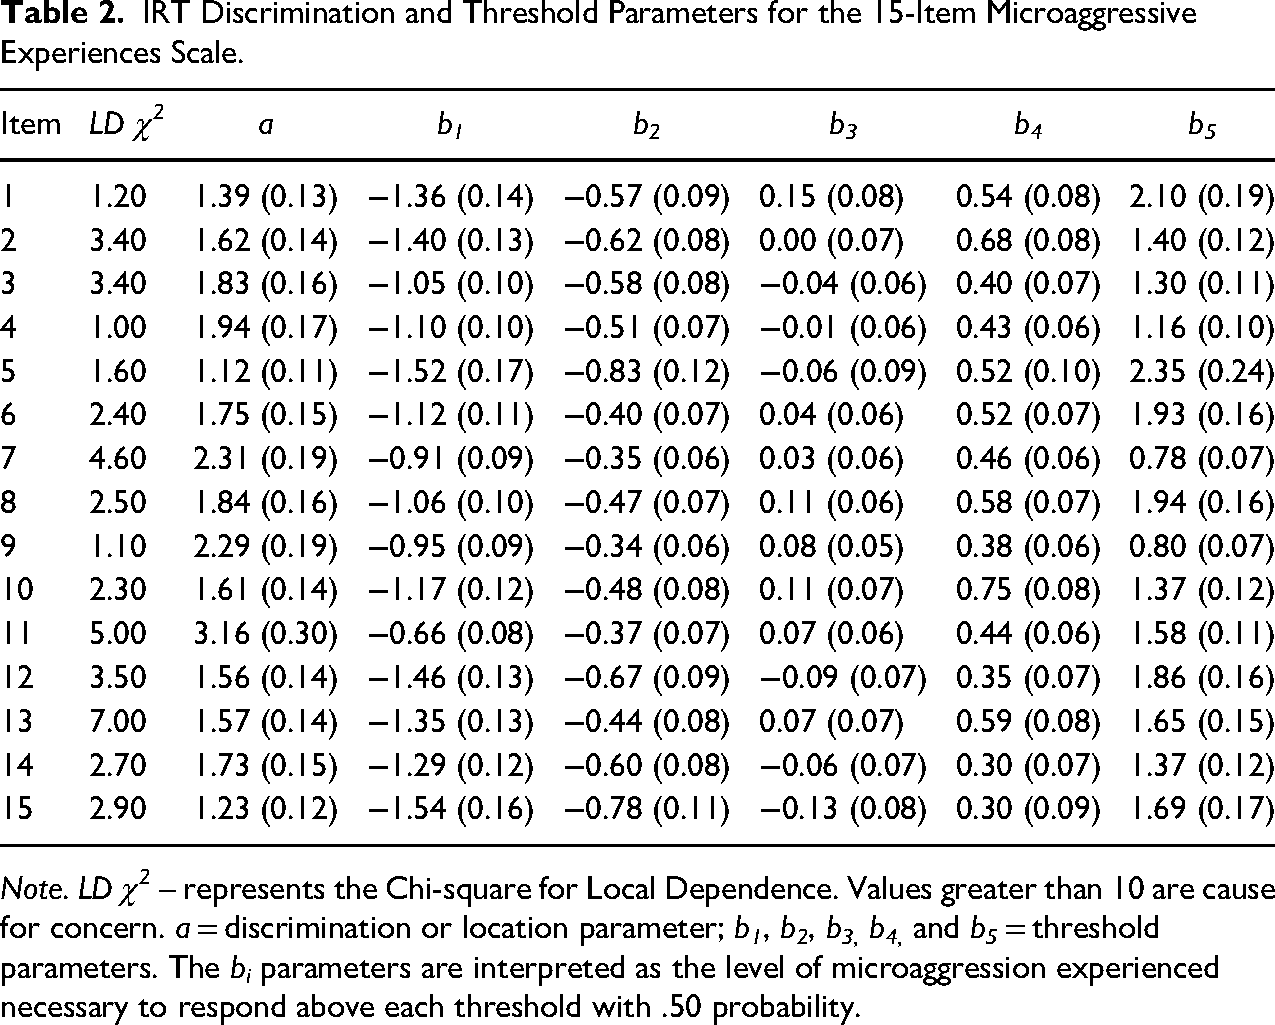
Note. LD χ2 – represents the Chi-square for Local Dependence. Values greater than 10 are cause for concern. a = discrimination or location parameter; b1, b2, b3, b4, and b5 = threshold parameters. The bi parameters are interpreted as the level of microaggression experienced necessary to respond above each threshold with .50 probability.
Differential Item Function
We used Woods (2009) proposed mechanism for selecting the four anchor items (Item-1, Item-8, Item-11, and Item-14). The Bonferroni correction (.05/15 = .003) method was used to reduce the probability of committing a Type I error. The discrimination and threshold parameters for sex (female and male) are presented in Table 3. The reference group was female. The latent mean and variance for the reference group is fixed to zero and one, respectively. The latent mean and variance for males were estimated [μ = −0.31 (SE = 0.07), σ2 = 0.52 (SE = 0.10)]. The sex-DIF results are shown in Table 4. The results showed no item functioned differently for males and females on the racial microaggression scale.
IRT Discrimination and Threshold Parameters for the Microaggressive Experiences Scale Sex-DIF Analysis.
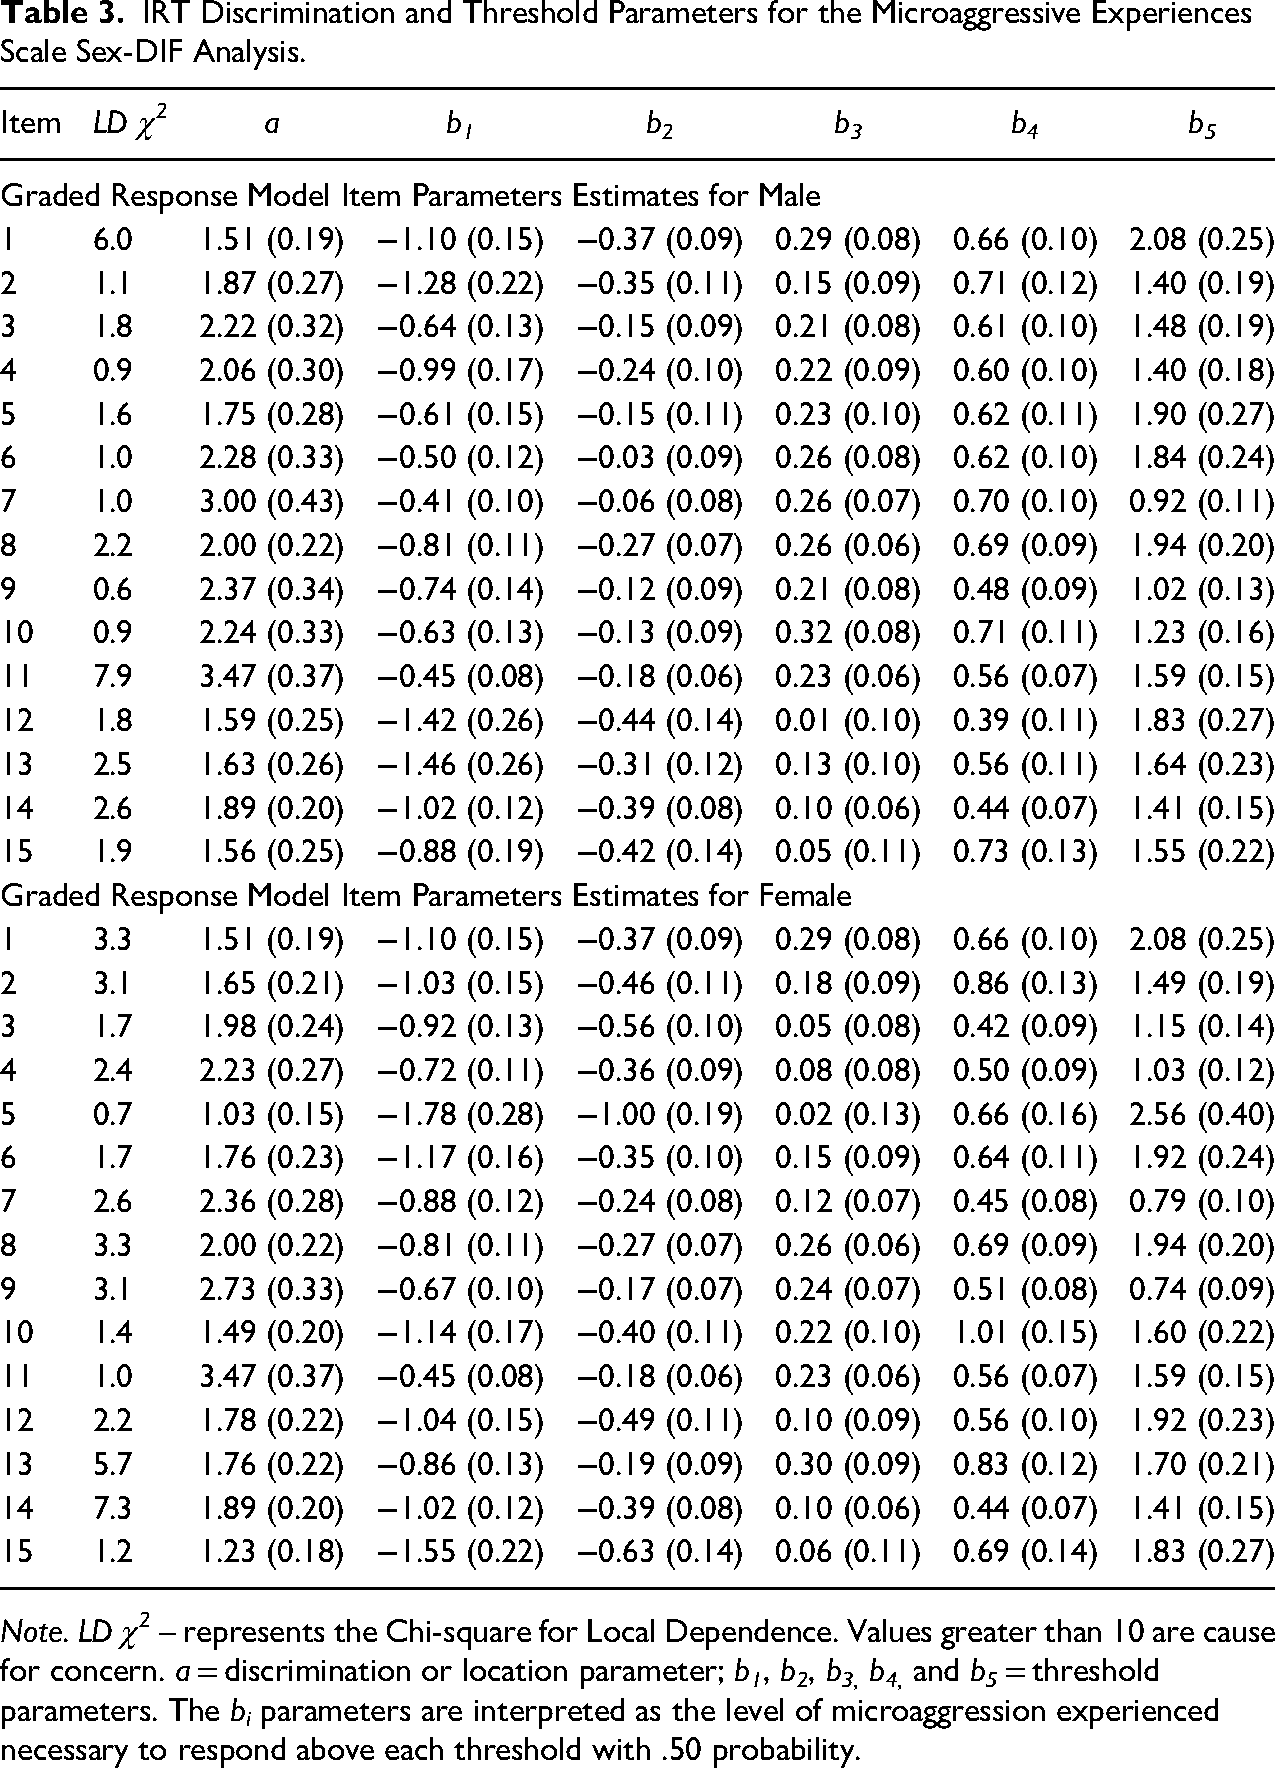
Note. LD χ2 – represents the Chi-square for Local Dependence. Values greater than 10 are cause for concern. a = discrimination or location parameter; b1, b2, b3, b4, and b5 = threshold parameters. The bi parameters are interpreted as the level of microaggression experienced necessary to respond above each threshold with .50 probability.
Chi-Square Statistics for Sex-DIF.
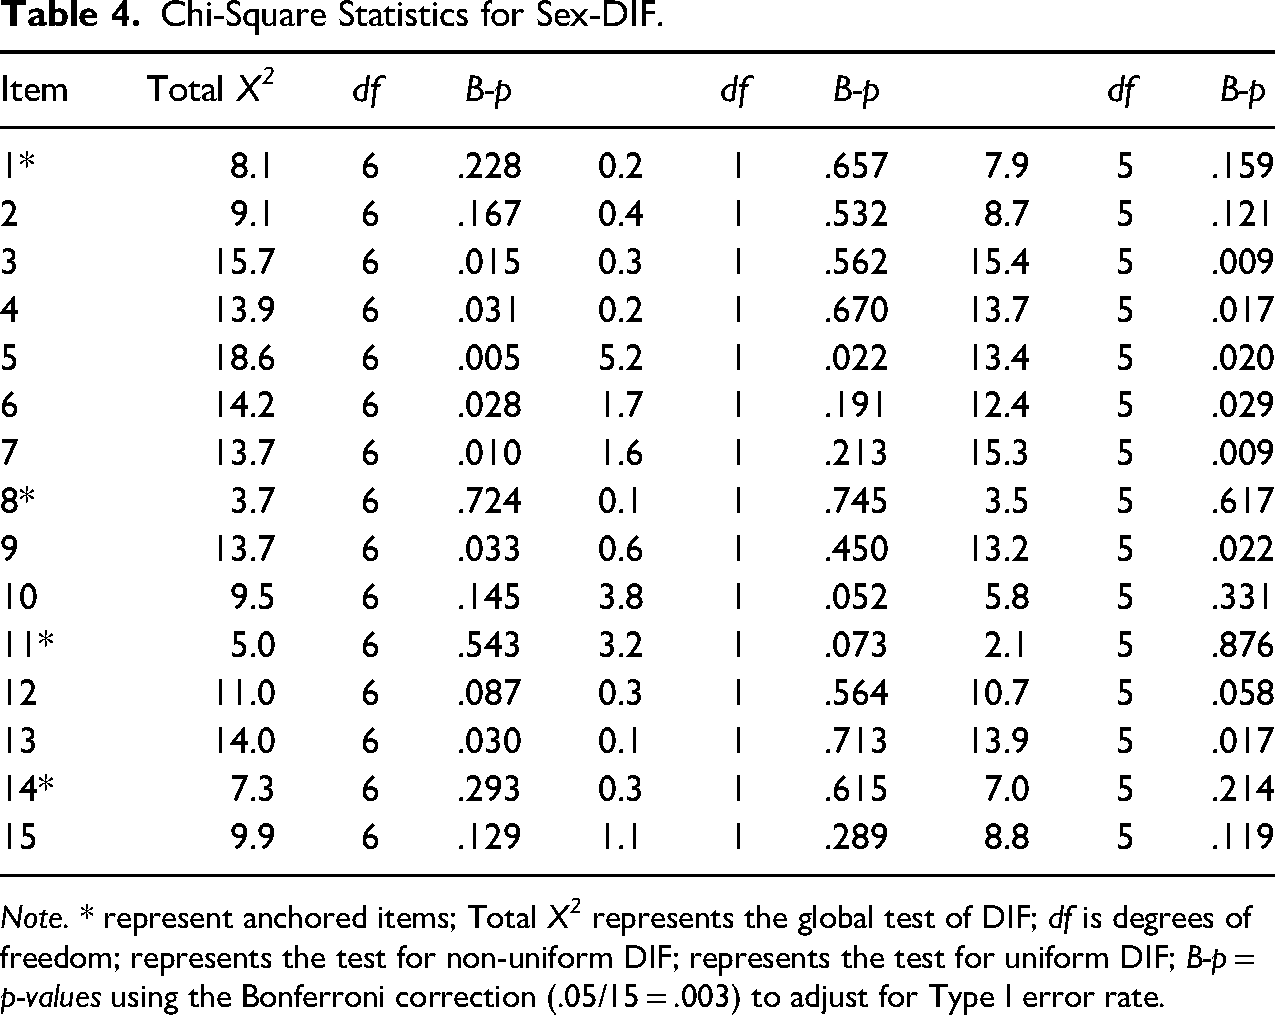
Note. * represent anchored items; Total X2 represents the global test of DIF; df is degrees of freedom; represents the test for non-uniform DIF; represents the test for uniform DIF; B-p = p-values using the Bonferroni correction (.05/15 = .003) to adjust for Type I error rate.
We conducted additional analyses to determine the best use of the scores. We computed mean and sum scores. These scores were correlated with the theta scores derived from the GRM analyses using Pearson’s product moment correlation coefficient (r). The results revealed high correlations between the IRT theta scores and the sum scores (r = .97, p < .001), and the mean scores (r = .98, p < .001).
Discussion
The purpose of the current paper is to provide initial validation evidence of a newly created measure of Black teachers’ racial microaggression experiences using a sample of teachers of mathematics. The qualitative cognitive interviews and the IRT analyses pointed to the successful creation of a measure for teachers’ microaggressive experiences. The final items follow closely to the themes found by Brown (2019) documenting the experiences of Black teachers. Items that loaded together centered on the myth of meritocracy, pathologizing cultural values and communication styles, cultural/ethnic insensitivity, ascription of intelligence, and second-class citizens. This newly-developed scale differs from the aforementioned existing racial microaggressions measures in that the Teacher Experiences of Racialized Microaggression (TERM) scale focuses solely on teachers and their working environment. The scale yielded strong psychometric properties in providing validation evidence for a unidimensional construct and shows high internal consistency. Finally, item response theory analyses indicated the scale measures widely the levels of racialized microaggression experiences. We developed the TERM scale items following the proposal outlined by Sue et al. (2007). The cognitive interviews resulted in the retention of predominantly microvalidation items. The teachers felt these items were more linked to their experiences within the school setting, results shared by Frank et al., (2018) and Brown (2019).
Teacher roles have been impacted by their gender (Dixson, 2003; Pabon, 2016). These characterizations led to assessing the TERM scale for sex-DIF. The results revealed that no items on the TERM scale were being viewed differently because of the gender of the teacher. Scales devoid of DIF show that the items are solely measuring the construct of interest and not tangential factors connected to being male or female (de Ayala, 2009). This bodes well for the TERM scale in measuring racialized microaggression experiences for Black teachers, particularly as the literature on Black male and female teachers often discuss the nuances and differences at the intersection of race and gender identity. We surmise that this scale is able to capture the shared racialized experiences of Black teachers, male or female. We also hope that as we collect future data using the scale, we can confirm this also true for nonbinary/ non-gender conforming teachers, as well as those who identify with other social constructions of gender.
Implications
In this paper, we presented our process for developing and validating the TERM scale. We used the scale to measure Black mathematics teachers’ experiences of racialized microaggressions via self-reported surveys. We believe that this scale has implications that are applicable to several communities, including quantitative researchers, K-12 district policymakers, and teacher education.
Suggestions for Future Scale Use and Revision
The TERM scale is timely as researchers trend towards a critical quantitative understanding of the recruitment and retention of teachers of color . Qualitative studies have called for further evaluation of the microaggressions experienced by Black teachers (e.g., Brown, 2019). The TERM scale provides an effective measure to capture these microaggressive experiences of teachers on a large scale. Researchers and administrators are likely beneficiaries of this measure. The scale is specific to teachers and their work environment experiences. In lieu of a general measure of racial microaggressions, researchers now have access to a relatively short (15-items) measure developed specifically for teachers.
The BTOMPS survey includes mathematics-specific questions; however, the TERM scale used in the survey was written such that it can be administered to teachers regardless of their subject area. Further, the questions are not race-specific, such that it has the potential to be used with non-Black teachers of color. Given the complex and socially constructed nature of race and racism, we contend that there may need to be adaptations to address the various cultural contexts of Indigenous/ Native, Latinx, and Asian Pacific Island communities. However, we assert that the items are sufficiently general to capture the racialized experiences of other teachers of color. Similar to race, we believe that this instrument is written broadly enough to capture the experiences of teachers of color across subject areas outside of mathematics.
District and school-level administrators could use this tool to gather knowledge regarding teachers’ experiences with racialized microaggressions within their schools and districts, particularly as schools seek to diversify their teaching forces. We issue the caveat that this scale is not intended to be evaluative in nature. Thus, under no circumstances do we think teachers’ responses should be used to assess any teacher at the individual or school level. Instead, we suggest that this scale be used to help districts and schools assess their climates and target specific actions to mitigate microaggressive experiences as reported by teachers’ survey responses.
The instrument can be self-administered or group administered. It is a survey tool and therefore can be administered in person or online. With the high correlations across different scores from the TERM scale, the mean or sum scores reflect similar sentiments to that of the IRT theta scores. Therefore, researchers and practitioners are welcome to use the average or summation scores as acceptable substitution for the preferred theta scores for the 15 items. Interpretation remains the same for all methods. Higher scores represent experiencing a higher frequency of racial microaggressions.
Based on the IRT results, future psychometric studies should focus on revising items that are too discriminating, for example, “I have experienced harassment (emotional, verbal, or physical) at my school/district based on my race.” Highly discriminating items do not provide sufficient information for a wide range of the trait continuum. Additionally, items should be developed that provide more information for teachers on the extreme low and high end of the trait – experiencing low and high levels of racialized microaggression.
Policy Research and Practice Implications
Use of the TERM scale has the potential to influence not only educational policy research, but actual practices and policies (e.g., related to retaining teachers of color and color blindness) imbued with ignorance and deficit thinking. At a minimum, any research “about” teachers of color cannot be considered in the absence of considerations of structural and institutional racism. Critical race quantitative inquiry offers an important frame for how to analyze data related to teachers of color, by first centering “race” as an important lens through which to understand the data. The TERM scale suggests that this lens has been the missing factor in understanding the workplace experience of Black teachers, and may be a guide to policies and practices for better recruitment and retention of Black teachers, and for better professional development and practices of all school personnel. Using the TERM scale to identify and highlight teachers’ of color racialized experiences is likely to shine light (ad ultimately reduce) ignorance, color blindness, and deficit thinking.
In addition, policy research approached from this lens has implications for how policies are implemented and enacted. Our findings suggest that school and district leaders need to examine their policies related to cultivating workplace environments that are cognizant of and be able to clearly explicate how racial bias plays out in interpersonal interactions. Further, leaders need to implement policies that hold school personnel responsible for cultivating racist work environments. We are learning from our qualitative work related to this study, that racist microaggressive cultures in mathematics education look like practices, including, limited opportunities to teach advanced mathematics courses to consistent negation of Black teachers’ mathematical pedagogical and content expertise and over-emphasis of their classroom management skills (Frank, 2019; Frank et al., 2018). Limiting opportunities for growth inevitably contribute to Black teachers’ thoughts of leaving the profession.
It beneficial and important to actively centering Black teacher experience in decision-making and practice. Results from the TERM scale may help district leaders (collaboratively with teachers of color) move beyond the personal to systemic changes that are necessary. For example, the expectation that Black teachers discipline Black students should be "called-out." This in turn leads to an examination of the systemic deficiencies that relegate Black students as objects of discipline.
Teacher Education and Educational Leadership
Before pre-service teachers enter the profession, most enroll in some form of teacher education preparation, whether traditional or alternative. We propose that teacher education programs also have a responsibility for addressing workplace culture, particularly in mathematics education. So often mathematics is falsely presented as neutral and culture-free and largely created and advanced by white men (e.g., Hottinger, 2016). This framing of mathematics results in a politicizing of mathematics that so often positions Black students at the lowest rung of mathematics achievement, as measured by standardized assessment. These ideas about Black students permeate mathematics education and filter their way into mathematics teacher education preparation (McGee, 2014), leading to Black teacher candidates reporting isolation and lack of support in predominantly-white mathematics education teacher preparation programs. We propose that mathematics teacher education has a role in explicitly addressing racism, not only how racism impacts students, but also how racism impacts Black teachers and other teachers of color. Teacher education standards in mathematics education (e.g., Association of Mathematics Teacher Educators) and broadly (e.g., Interstate New Teacher Assessment and Support Consortium) highlight professionalism as key to being an effective teacher. Thus, we assert that it is necessary to understand how racism and microaggressive experiences are unprofessional and negatively impact the workplace experiences of Black teachers, especially in mathematics education, which is overwhelmingly white (Neil, 2015).
Related to teacher preparation, this research also has implications for how future educational leaders are prepared. Supporting future leaders in building and maintaining collegial, anti-racist professional communities must be at the center of preparation. Additionally, preparing future school leaders to examine their own racist biases and stereotypes is key, as these factors impact Black teachers’ evaluations (Rogers-Ard et al., 2013), hiring (e.g., D’Amico et al., 2017), and collegial climate (Decuir-Gunby & Gunby, 2016). Using the TERM scale, we demonstrated (Frank et al., 2021), that Black mathematics teachers who reported high instances of racialized microaggressions had greater desire to leave mathematics teaching. Thus, preparing leaders who can foster anti-racist supportive spaces is key for Black mathematics teacher retention.
Limitations and Future Directions
The TERM scale provides a measure with good precision that focuses on teachers’ experiences. There are no major limitations worth mentioning beyond those that accompany the use of web-based survey data (e.g., socially desirable response). However, future research could consider evaluating DIF between teachers from different school types (elementary vs high school). Additionally, collecting data across multiple subject areas and locations (e.g., urban vs. rural) would make for valuable comparisons to continue to build the ubiquitous use of the TERM scale. The items were initially written with the intention to cover teachers’ experiences from all school types, subject areas, and locations but the purview of the current study did not include testing item bias across these categories. Finally, we encourage future research to assess the importance and need for the seven-category response options used in this measure. The number of response categories is an important element to consider for any instrument (DeVellis, 2017).
Conclusion
Black teachers experience racialized microaggressions at varying levels in their professional settings. Existing measures of these microaggressions are not context specific. In this paper, we described our process of developing items following a CQRI approach. IRT provided validation evidence for the 15-item Teacher Experiences of Racialized Microaggressions (TERM) scale. The TERM scale has implications for understanding the racialized experiences of Black and other underrepresented teachers across other subject areas. In addition to contributing to the growing body of research using critical quantitative methods, we assert that use of this instrument has implications for teacher education, educational policy and educational research.
Footnotes
Acknowledgments
This material is based upon work supported by the National Science Foundation under Grant No. 1660733. Any opinions, findings, and conclusions or recommendations expressed in this material are those of the author(s) and do not necessarily reflect the views of the National Science Foundation.
Positionality Statement
We are a research team of people of color, including Jamaican, Asian American, and Black Americans from the Southern, mid-Atlantic, and Eastern regions of the United States. Additionally, we are an interdisciplinary team, including a quantitative methodologist, mathematics educator, social studies educator, and graduate students with similar interests. Conducting research about and with Black mathematics teachers is personal and professional for our team. Prior to becoming a mathematics teacher educator, co-author Frank was a high school mathematics teacher and department chair for over a decade. As Black faculty and doctoral students who taught mathematics (and other subject areas), supervised teachers, and now prepare them as a teacher educators and researchers, we have numerous first-hand accounts of how race and racism shape the professional experiences of Black educators. Like the teachers we surveyed, we, too, have experienced veiled and overt racist practices that influence their thoughts of leaving the field (Frank et al., 2021). So for our team, we offer scholarly analysis that is also influenced by lived experiences.