
Abstract
Yarn quality is important in the manufacture of fabrics and textile products. Yarn analysis ensures that final products meet desired quality standards. Furthermore, the quality of the yarn directly affects the characteristics of the fabric, such as strength, durability, texture, and appearance. Therefore, the textile industry uses yarn quality monitoring and control methods throughout the entire production process, from the selection of raw materials to the manufacture of finished products. This helps to prevent defects, minimize waste, and ensure customer satisfaction. There is currently a commercial equipment, USTER TESTER 6, that measures yarn quality in an industrial environment, which is made up of intelligent sensors of different types. This equipment, characterized by its high cost and size, collects some yarn parameters, such as mass, hairiness, spectrogram, and twist. However, there is a gap in the market for a low-cost system capable of obtaining more characteristics of the yarn, integrated into an industrial environment, and using nondestructive samples. This paper presents an innovative prototype for yarn analysis using computer vision and deep learning techniques, with remote access, able to respond to the needs of Industry 4.0 and industrial digitalization. The prototype demonstrates significant advancements in performance metrics, with improvements of 5–6% in mAP0.5 and 11–12% in mAP0.5:0.95 compared with the standard YOLOv5s6 model. Using a robust 10k-fold cross-validation, the system ensures reliable performance evaluation on unseen data. Comparisons with USTER TESTER 3 indicate a relative error below 4% for parameters such as diameter and linear mass, validating the prototype’s accuracy in key measurements.
Keywords
The quality of textile fabrics is heavily dependent on the quality of the yarn used in the production. During the spinning process, impurities on the textile machines and other irregularities affect the characteristics of the yarn causing defects in the final textile. In order to minimize complaints and costs associated with the lack of quality of textile products, urges the need to have a quality assessment system able to detect yarn parameters that are usually associated with its final product quality. 1
In the textile industry, the implementation of yarn quality systems represents a great investment cost, which limits the application of quality control to a great range, as well as to the full length of yarns used for manufacturing. Nowadays, only a selected range of selected samples is evaluated in certified laboratories, using state-of-the-art machines, such as the USTER TESTER 5 and 6. 2 However, these are limited to the direct analysis of a selected few parameters, such as yarn mass, hairiness, spectrogram, and twist, excluding relevant hairiness-related parameters.
Hairiness is one of the main yarn factors that can negatively affect the quality of final fabrics regarding the presence of short and fine fibers emerging through the yarn surface. As referenced by several authors, the presence of hairiness, in the form of protruding and loop fibers, can cause3–12:
wear between the yarn fibers potentially leading to breakage during yarn processing or use; decrease of yarn strength and durability due to the yarn’s weakened structure; incorrect or uneven appearance of the final fabric; difficulties in the fabric processing, due to tangling and other failures during weaving; potential damage to manufacturing equipment requiring additional maintenance and repair; difficulties with sequential dyeing or printing processes; inconsistencies in the quality of the final product, resulting in batches of products with varying characteristics.
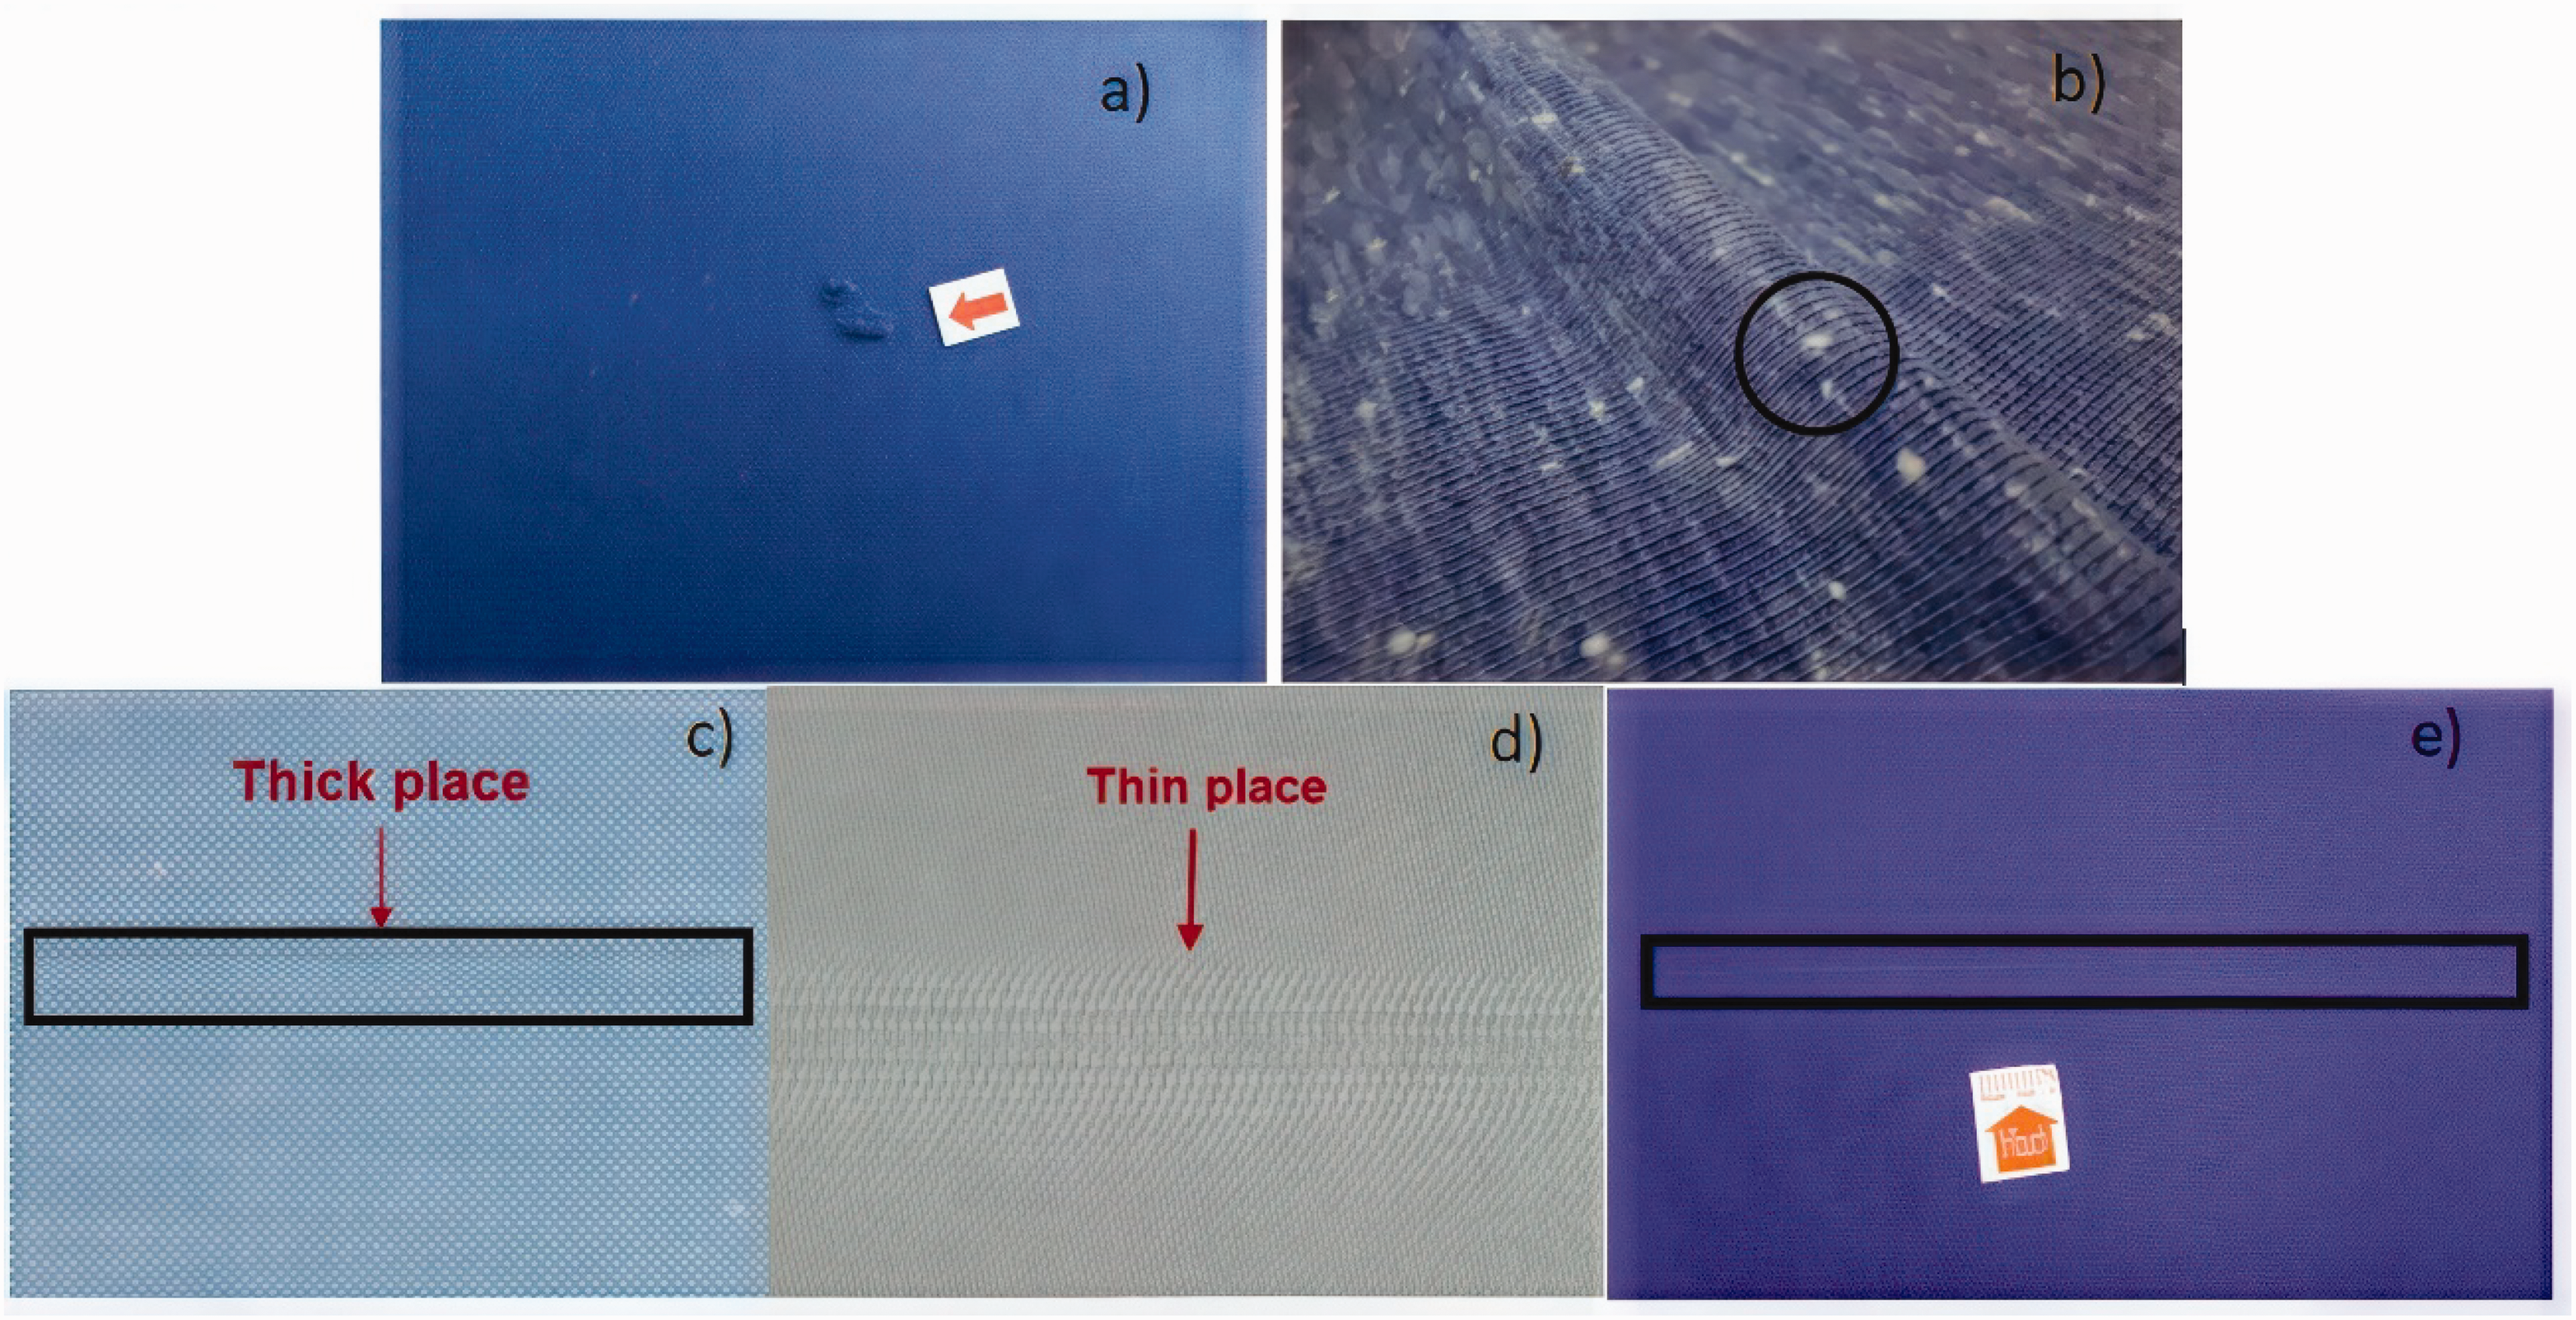
Figure 1 shows the most types of defects in fabric processing caused by yarn defects, such us: neps (Figure 1(a)), hairiness (Figure 1(b)), thick places (Figure 1(c)), thin Places (Figure 1(d)), and large diameter (Figure 1(e)).13,14
In recent years, research has been carried out to collect more yarn quality parameters using image processing, computer vision, and artificial intelligence.16–19 Therefore, there is currently a need to implement the aforementioned technological advances in a physical prototype that integrates:
artificial intelligence; detection of defects in the yarn based on images and video; ability to wind and unwind the yarn to perform analyzes on different types of raw materials, is economical, nondestructive, and easy to reproduce; an application that can provide a set of statistical data on the analyzed yarn, generating a document for immediate or subsequent analysis (report or similar); spectral analysis that allows the identification of periodic irregularities in the yarn.
In this scenario, the prototype presented in this paper was designed to face this challenge. The main objective of the study was to develop an innovative equipment that uses cutting-edge technologies, focusing on the development of algorithms aimed at the comprehensive assessment of yarn quality through image processing, computational, and deep learning (DL) techniques, integrated into a customized mechatronic prototype.
The design of this prototype not only can improve yarn quality analysis but can also promote efficiency and competitiveness in the textile sector. A successful implementation of this yarn quality control system has the potential to significantly reduce losses caused by manufacturing defective textile products, as well as to improve customer satisfaction and strengthen the company’s image. Furthermore, the work can serve as a reference for technological innovation and improvement of the quality of raw materials in other sectors than textiles.
The present article is structured as follows. The second section “Related work” encompasses a literature review in which a survey of research projects is carried out with a focus on yarn analysis. The third section “Development of an innovative yarn analysis system for textile industry” presents the system developed. The fourth section “Experimental results” presents the results obtained with the developed system and with a commercial system in some parameters. Finally, the article ends with a fifth section, “Conclusion and future work,” where the major outcomes of the work are enunciated as well as given some proposals for further steps.
Literature review
Yarn quality analysis is in constant technological evolution. The most common method to evaluate hairiness in a continuous and controlled way is with the application of photoelectric sensors through the USTER TESTER systems. 15
Based on current research, limited documented examples of alternative yarn analysis systems are available for comparison with the proposed developed system, which are discussed extensively in this section. The analysis carried out allows us to obtain the gaps found in each system or work, thus providing a critical assessment of its limitations. This review analyzes and compares solutions and projects that have explored technologies for obtaining yarn characteristics, categorized into two groups: image processing/computer vision with or without artificial intelligence (AI) techniques.
Projects using image processing/computer vision for yarn analysis
Li et al. 16 developed a new methodology for evaluating yarn appearance quality based on image processing, which will be referred to here as System A. Their research proposes the use of computer vision algorithms to capture images of yarns under various conditions and analyze aspects such as regularity, defects, and uniformity. The key innovation of this study is the automation of the evaluation process, which replaces the old manual and subjective methods. The system allows quicker and more objective analysis of yarn quality, with possible uses in textile production lines where real-time quality control is important.
Deng et al. 17 developed a project which will be referred to here as System B. They created an algorithm to separate crossed fibers in yarn analysis using image processing. These are small fibers that stick out from the yarn’s surface, making visual analysis harder. The algorithm helps to identify these fibers more accurately in images. It separates the fibers from the main yarn structure, making it easier to analyze hair density, fiber direction, and surface irregularities. Tests on yarn images with different levels of hairiness showed that the algorithm is strong and adaptable.
Projects using image processing/computer vision and AI for yarn analysis
Haleem et al. 18 developed another system which will be referred to here as System C, using image processing, computer vision, and AI techniques. They focused on real-time yarn testing to reduce delays and check yarn quality. They created an online system to test uniformity and detect neps using three computer vision models based on the Viola–Jones algorithm, 19 developed with the OpenCV library [18]. The system’s performance was compared with a commercial testing equipment, specifically USTER’s TESTER 3, to validate its accuracy.
Guo et al. 20 created another system which will be referred to here as System D, which uses computer vision to check yarn hairiness right on the sizing machine. They used a special tool and an image analysis method. To deal with problems such as yarn layers and low-quality images, they applied techniques to improve the results. This method matched 94% with a well-known hairiness tester and worked well with different yarn types, making it possible to do real-time checks. They compared their results with the Uster Zweigle Hairiness Tester.
El-Geiheini et al. 21 came up with what we refer to here as System E, using image processing and neural networks to predict how strong and stretchy yarns are. They built models in MATLAB to test both cotton and blended yarns. By mixing image analysis with these neural networks, they obtained good predictions of yarn properties.
Abd-Elhamied et al. 23 developed what we refer to here as System F, which also used image processing and neural networks to study cotton yarn. They looked at yarn features including strength, stretch, density, and flaws, using data from standard machines.
Ingle and Jasper 25 discussed how new developments in computer vision and AI are being used to improve yarn inspection. With computer vision capturing clear images of yarn in real-time and AI methods such as convolutional neural networks (CNNs), they can now quickly find and classify issues including hairiness and mass changes, as shown in Figure 2. 25
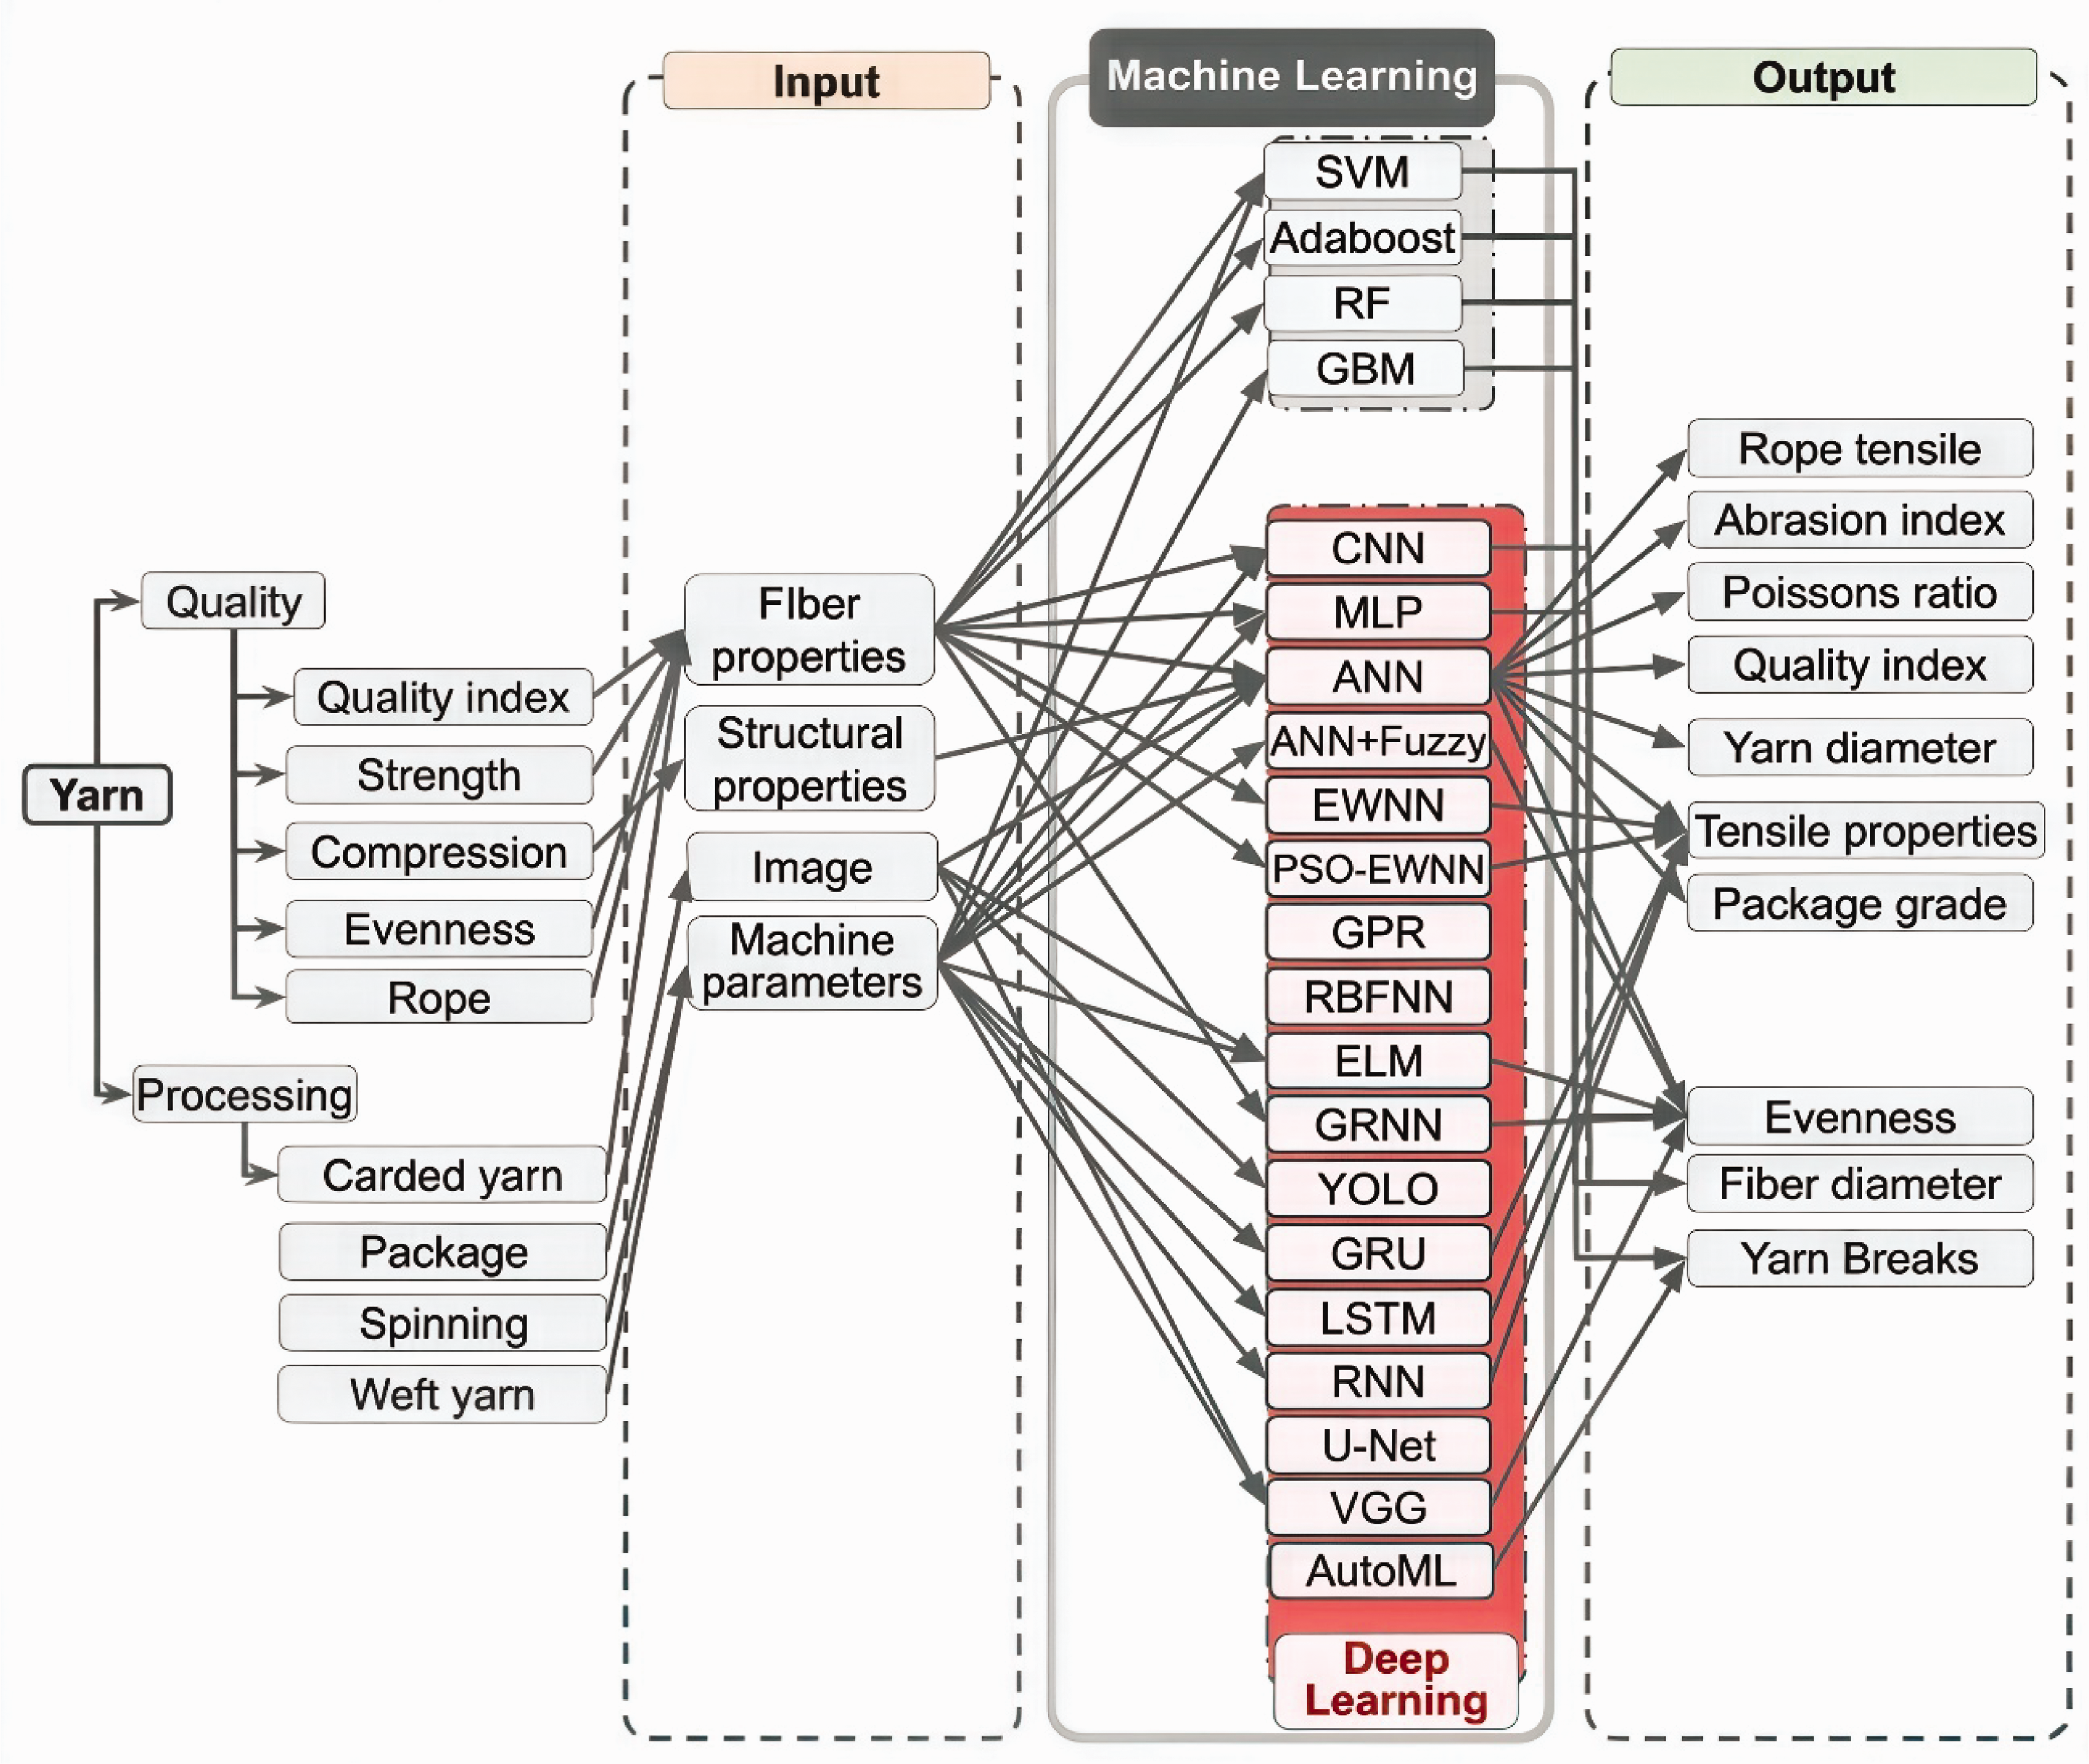
Comprehensive review of machine learning and DL applications in yarn analysis. (Adapted from Ingle and Jasper 25 ).
The introduction of systems based on DL, such as YOLOv5 (You Only Look Once), has revolutionized the detection and classification of complex defects in yarn, with high precision and real-time processing. Recent studies highlight that these technologies improve defect detection, outperforming traditional methods and giving better control over yarn quality.25–31 Furthermore, the application of DL algorithms to images captured during the production of yarn allows for improved final quality control, making it faster, more precise, and more accessible. The ability to perform analyses in advance or in real time allows the correction of defects during the production process, reducing costs and minimizing waste.24–31
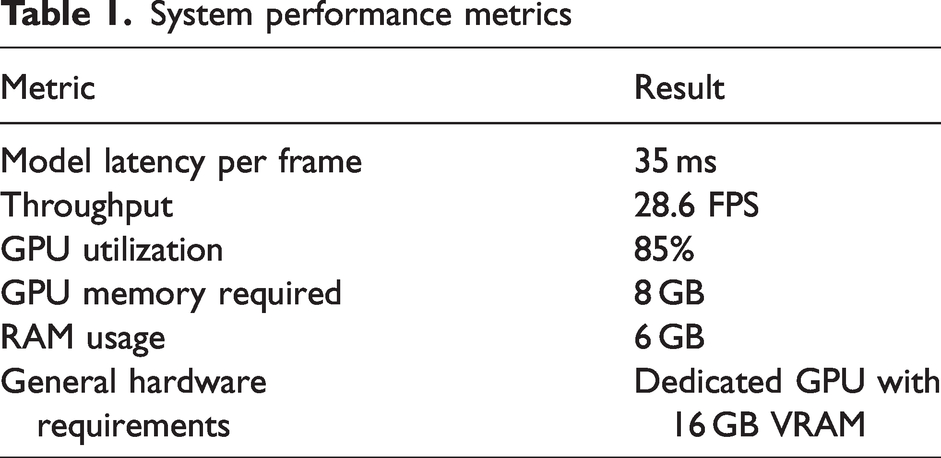
Although YOLOv8 has a more advanced architecture, its full implementation would not be ideal for this project due to the increased computational complexity. Instead, the option to incorporate specific modules, such as C2f, which offer targeted performance improvements without compromising real-time processing. YOLOv5s6 achieved better results compared to YOLOv8, as referenced in Table 1. In addition, the use of YOLOv5s6 allowed us to achieve the following.
System performance metrics
Trade-off between accuracy and speed. While YOLOv8 offers a slight advantage in accuracy, it involves higher computational complexity, potentially reducing the frames per second (FPS) rate. For this project, we prioritized speed and real-time efficiency, which are critical for detection in an industrial production line.
Comparative test results. During testing, YOLOv5s6 demonstrated a 25% higher FPS rate than YOLOv8, with only a marginal difference in accuracy (mAP) of around 2–3% for this specific task.
Industrial application suitability. The choice of YOLOv5s6-Hairiness in this work was based on balancing accuracy and real-time performance, both crucial for industrial applications. The model achieved
Future considerations. Models such as EfficientDet and RetinaNet could provide additional insights into the trade-off between accuracy and computational cost. Although not explored in this project, we will consider these in future work.
Preliminary testing. Several preliminary tests showed that YOLOv5s6 outperformed other algorithm variants, including YOLOv8, in overall results.
Processing speed priority. With processing speed as the top priority, YOLOv5s6, with its remarkable FPS rate, was the preferred choice. In this application, where real-time detection and classification of fibers are essential, minimal latency is critical.
GPU resource availability. As the system operates in an environment with GPU resources, YOLOv5s6 was the best option due to its optimized performance on GPUs. This was especially relevant since the solution was developed in a GPU-enabled environment, accelerating the fiber detection process.
Balance of accuracy and speed. Although YOLOv8 offers slightly higher accuracy, YOLOv5s6 maintains a competitive balance between accuracy and speed. The application requires both good accuracy and rapid response times, which YOLOv5s6 delivers.
Ease of use. While both YOLOv8 and YOLOv5s6 are user-friendly, YOLOv5 stands out as the easier option. Its foundation on the PyTorch framework simplifies implementation, making it ideal for developers.
In summary, YOLOv5s6 was selected for its superior balance of accuracy and speed. Comparative tests demonstrated that YOLOv5s6 is more efficient for real-time industrial applications, where a high FPS rate is critical, and the difference in accuracy was negligible for the project’s objectives.
Comparison between projects with image processing/computer vision and AI techniques
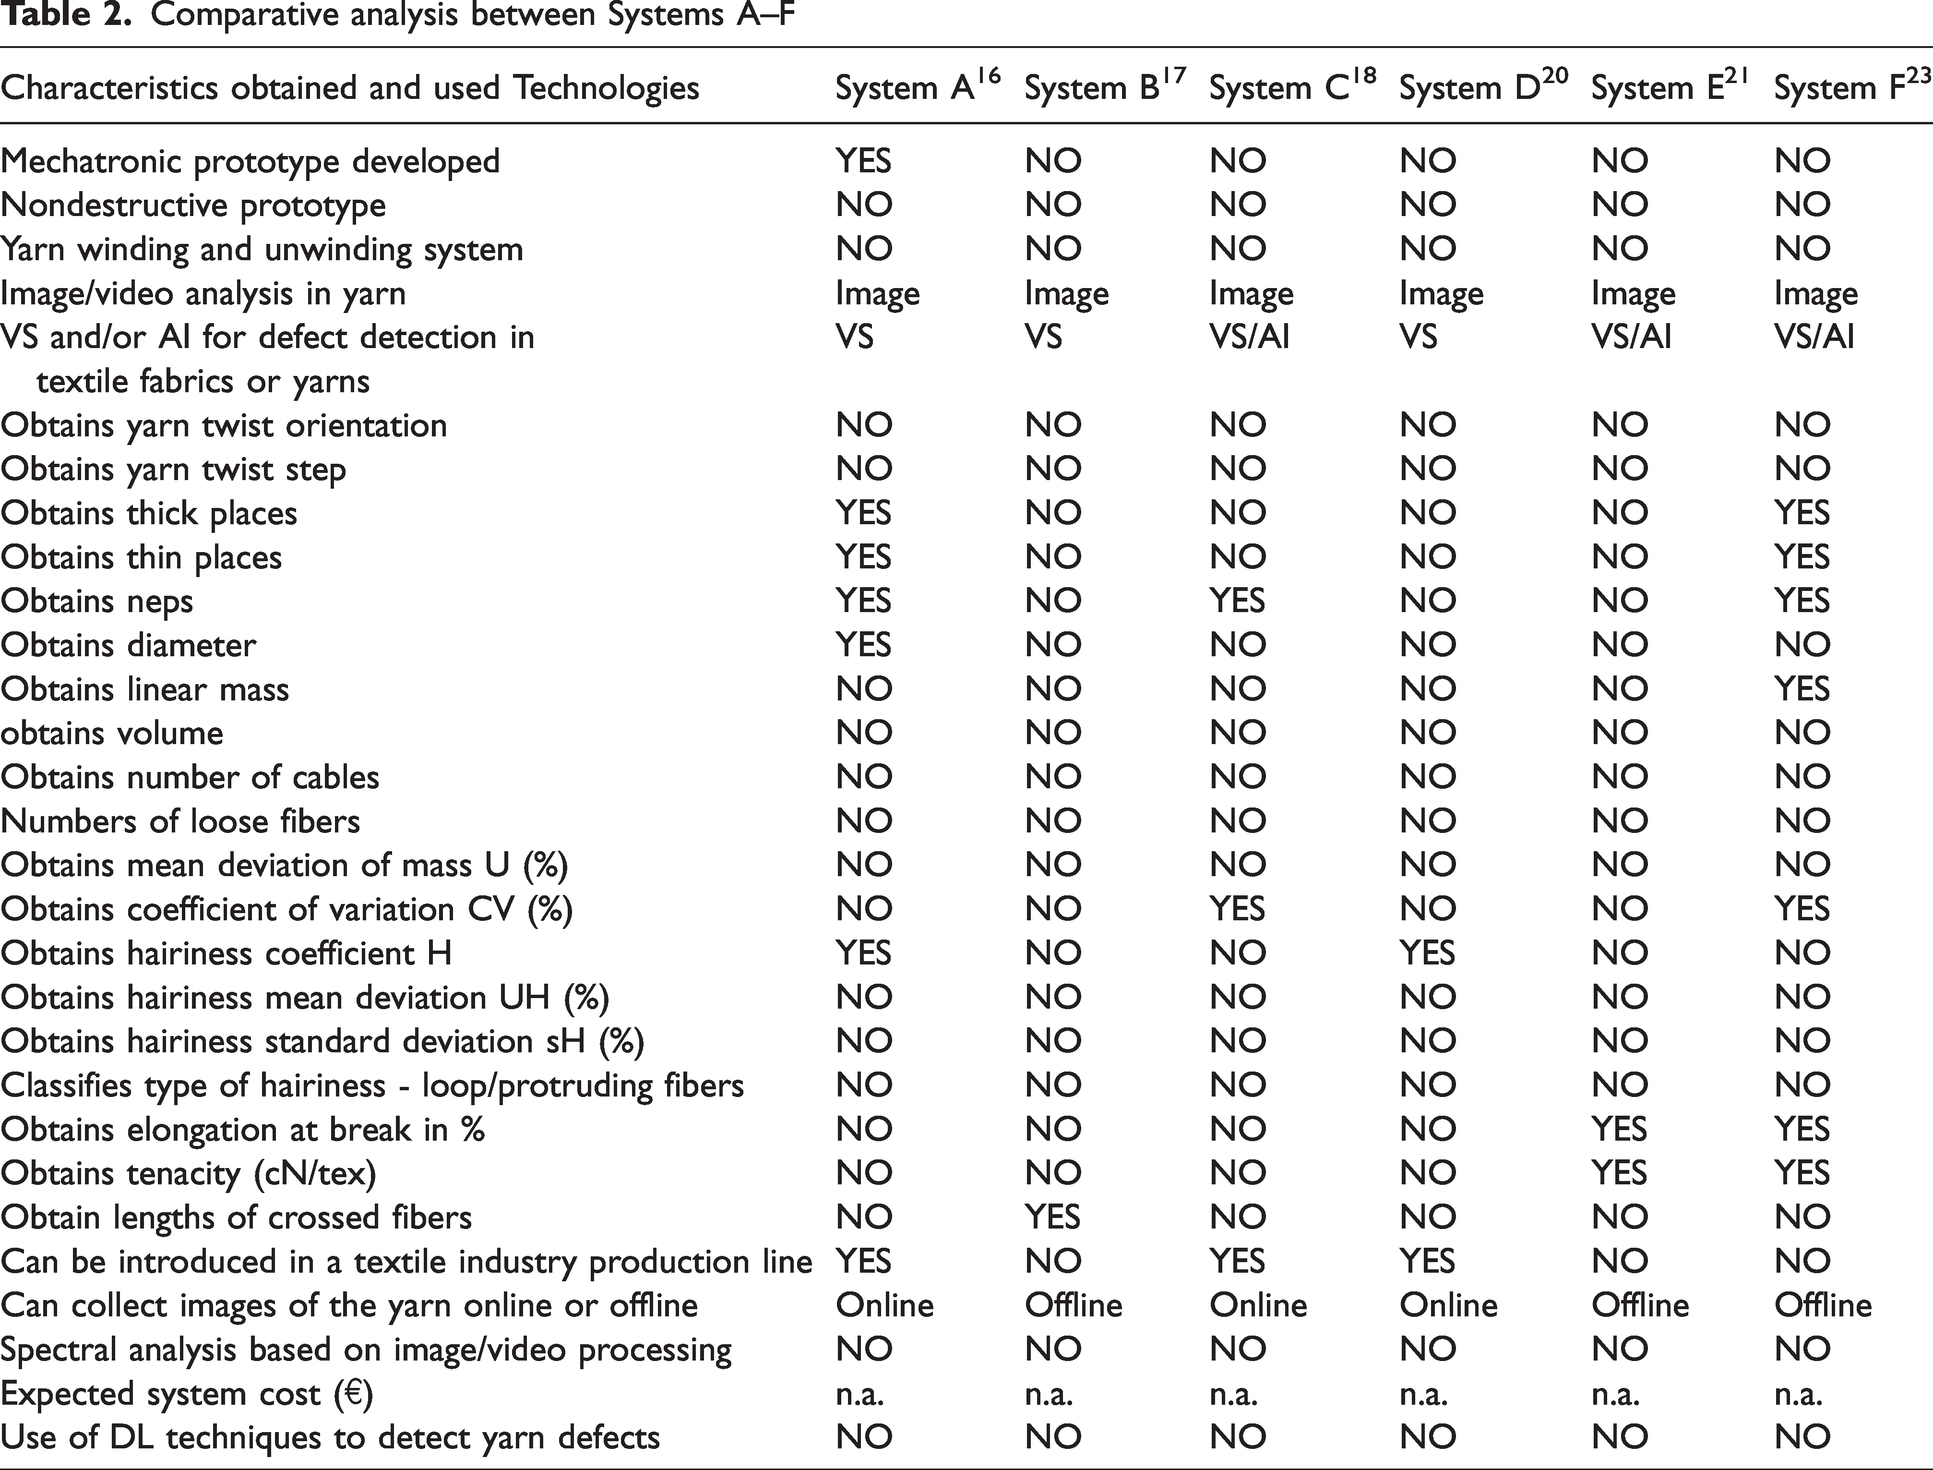
The research carried out reveals that there is a dearth of documented works regarding alternatives for yarn analysis that provide data comparable to our specific case study, that will be detailed in the subsequent sections. Table 2 presents critical characteristics, facilitating a comparative analysis between those described as Systems A–F.
Comparative analysis between Systems A–F
The subsequent analysis aims to provide a critical review of the various yarn analysis systems presented in the previous subsection, highlighting the distinctive features and contributions of each, while also emphasizing existing gaps and what should be done about them. This information is presented in Table 3.
Comparative analysis between Systems A–F
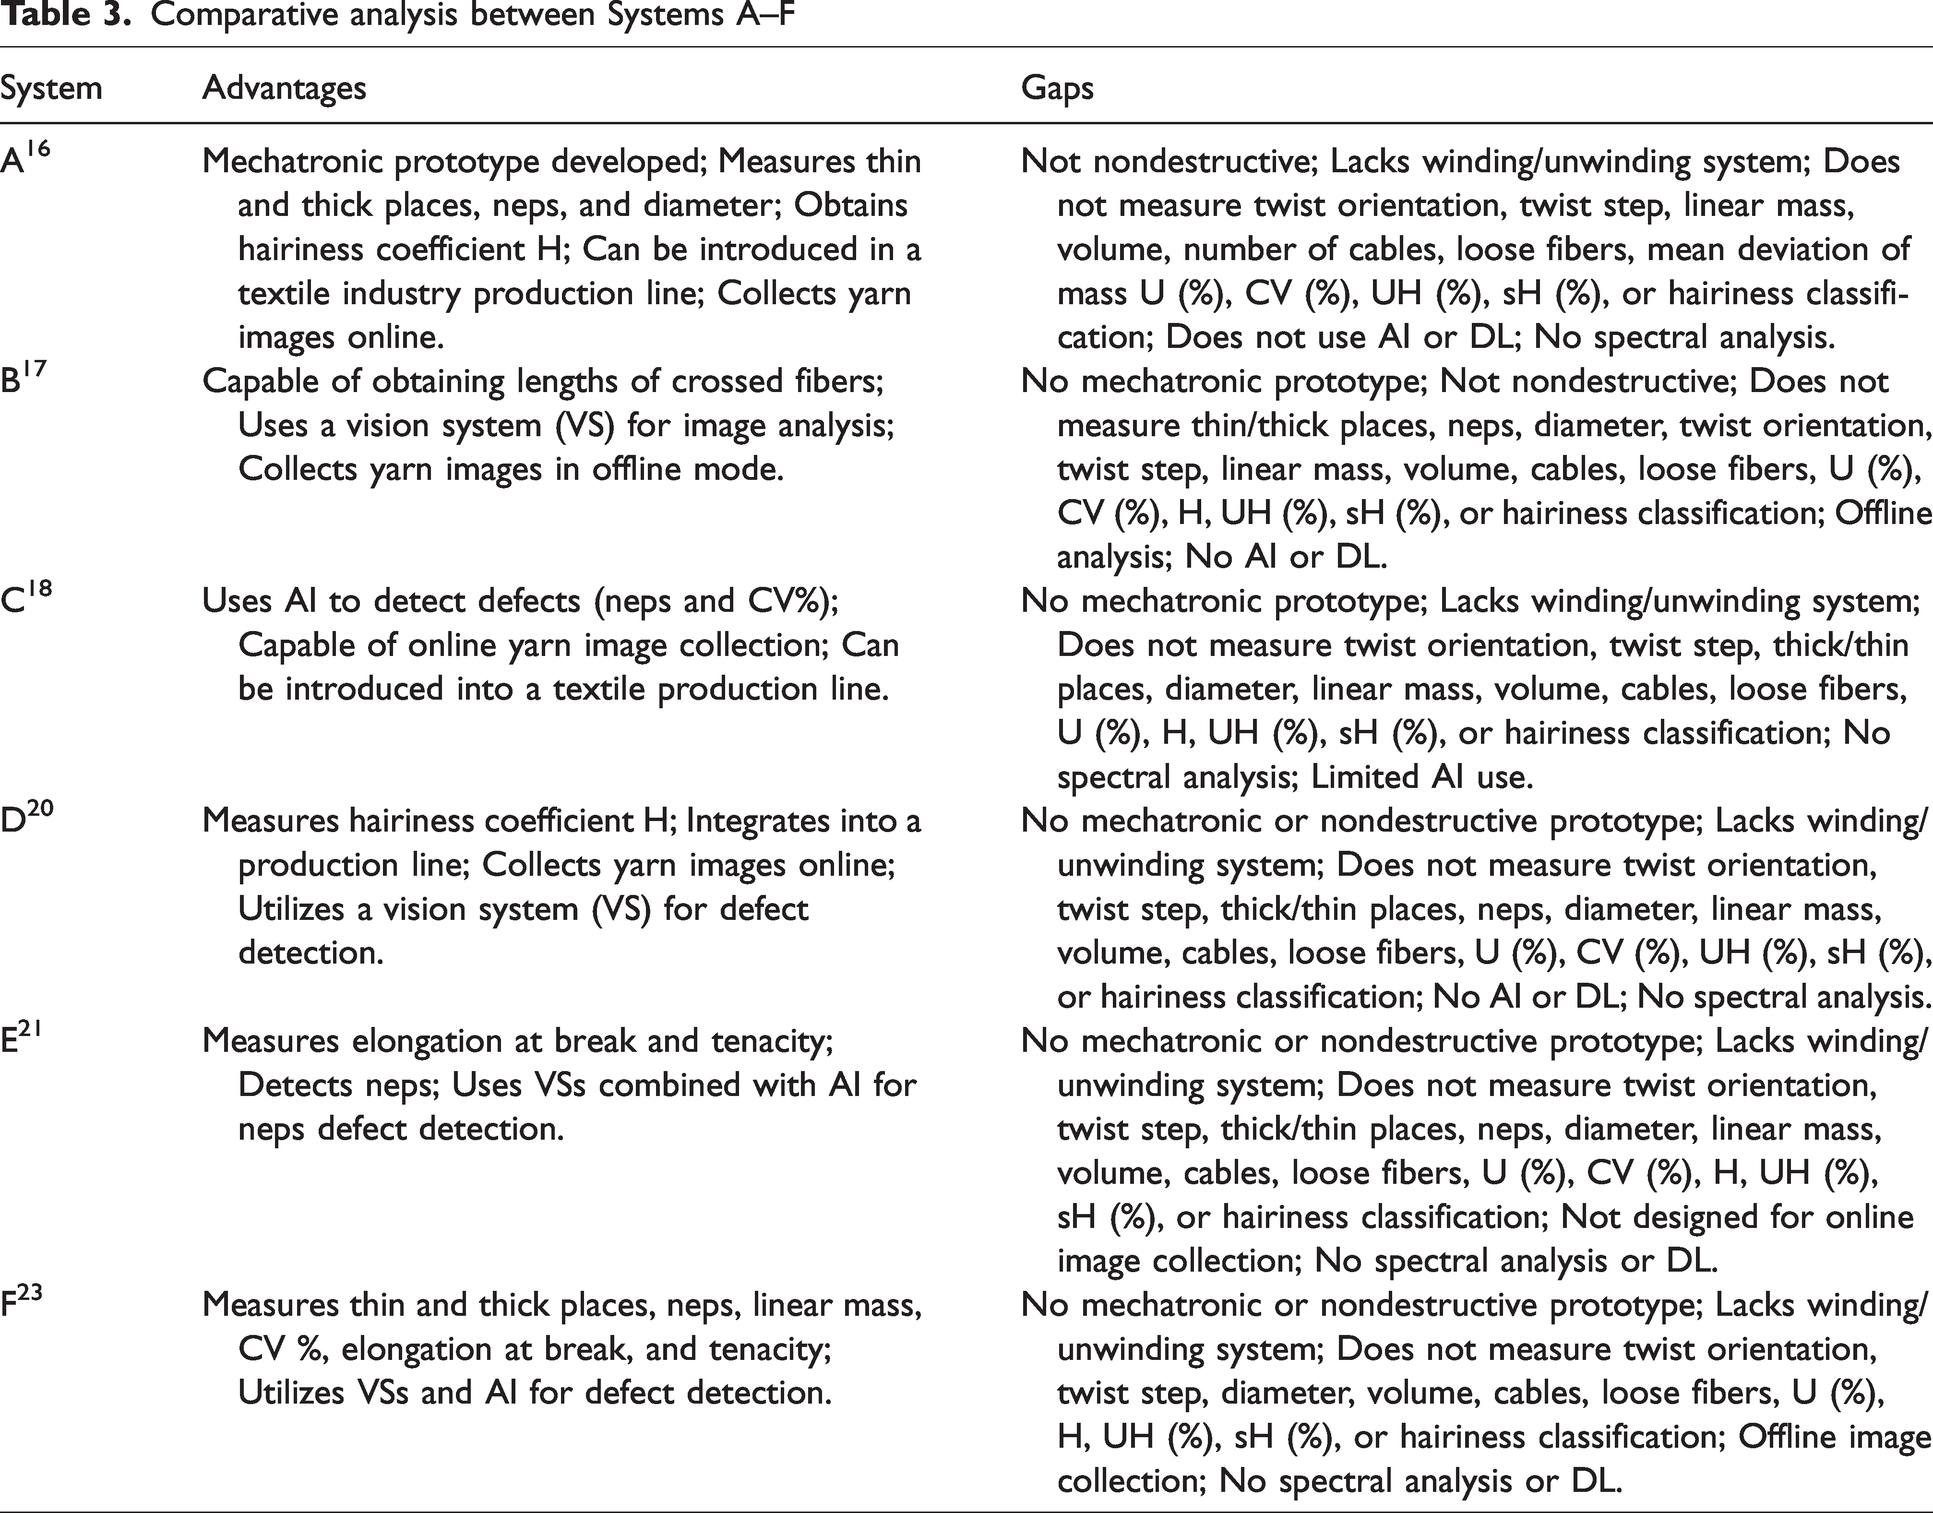
All systems analyzed present gaps at various points, such as accurate defect detection, real-time analysis, and the integration of advanced techniques such as DL. Most systems are limited to basic parameter measurements, without the ability to operate continuously or identify complex defects such as protruding fibers and loop fibers. Furthermore, none of them offers a nondestructive solution or a system that can be completely integrated into the textile industry production lines.
Following this, the system proposed in this paper, which responds to the gaps mentioned and that justified its creation, is described in the following sections. It can serve as a catalyst for innovation in yarn analysis and establishes the introduction of DL for yarn quality assessment with the potential to enable production optimization in the textile industry.
Materials and methods
The textile industry has seen significant advances in the area of yarn quality analysis, which is essential to ensure the production of high-quality textile products.
This section presents the development of an innovative yarn analysis system that combines the advantages of a mechatronic prototype with advanced computer vision and AI techniques. The proposed system was created so that it can be an economical and efficient solution to analyze yarn quality and allow its integration into the textile industry.
Image processing and computer vision system for yarn analysis
Figure 3 illustrates the overall structure of the software designed for yarn quality analysis, showing the interaction between the interface, algorithms, and data processing modules. It highlights how the system combines image and video processing to extract detailed yarn parameters.
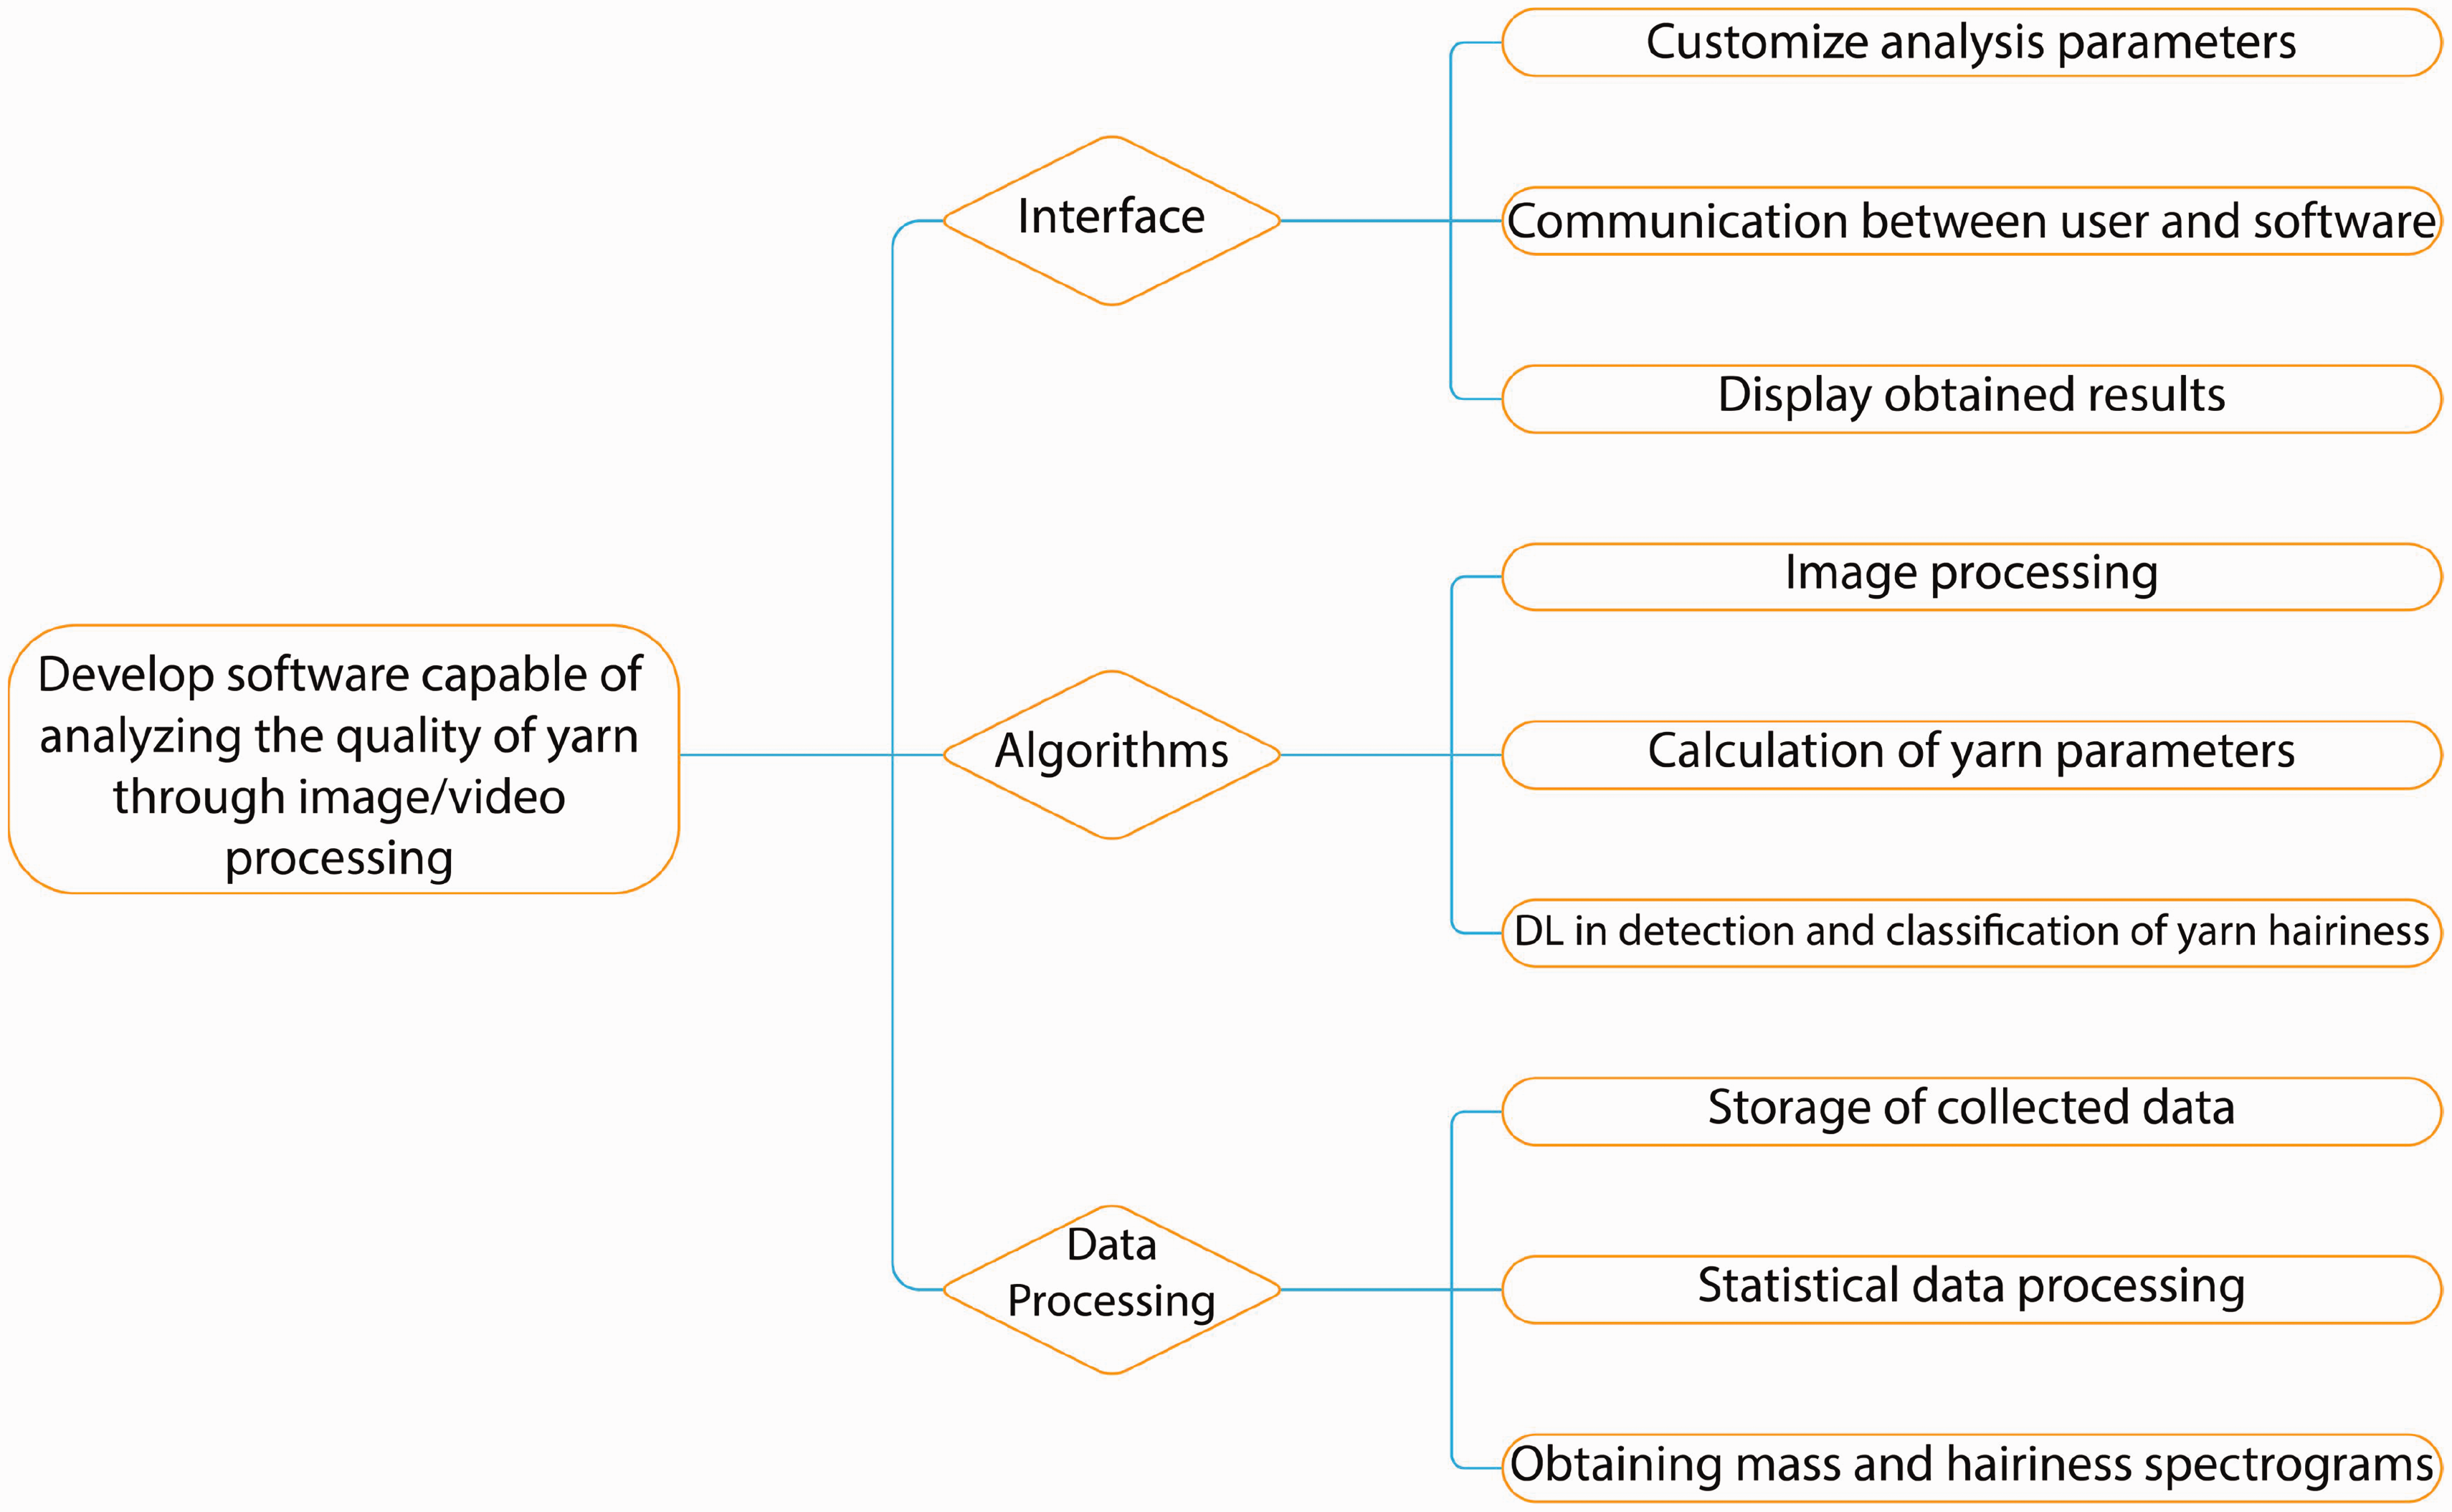
Developed system.
This developed system is divided in four main parts.
A. Image processing and DL integration
The system captures yarn images and stores them in a dataset for training and refining the DL algorithm, focusing specifically on detecting and classifying yarn hairiness. The DL algorithm is integrated into the “Algorithms” module, which includes the detection and classification of hairiness as a core functionality.
B. High-resolution yarn parameter extraction
Ten high-resolution videos were obtained with 100,000 samples, each 1 mm long, and analyzed. This fine resolution allows for precise measurement of critical yarn parameters, such as:
diameter; linear mass; volume; hairiness index and loose fibers; structural features including twist orientation, twist step, and number of cables; defect analysis, including thick places, thin places, and neps. Statistical metrics such as mean deviation of mass, coefficient of variation, and hairiness standard deviation (sH).
C. Interface capabilities
The “Interface” module enables the user to customize analysis parameters, communicate with the software, and display results, as shown in Figure 6. The interface also facilitates spectral analysis, providing a user-friendly visualization of mass and hairiness spectrograms.
D. Comprehensive data processing
The “Data processing” module handles the storage of collected data, its statistical processing, and the generation of detailed outputs like mass and hairiness spectrograms.
The first step performed in yarn image analysis is pre-processing, which prepares the images for defect detection. High-resolution images were obtained through the camera installed on the prototype. These are then converted to grayscale to make the analysis simpler, maintaining important details to detect defects such as hairiness. 32 Then, a Gaussian filter is used to smooth the images and remove any unwanted noise that could affect the analysis of the yarn. Finally, a thresholding method is applied to the images, where the yarn is separated from the background transforming the image into a binary format. The OTSU method 32 is used for this step, as it automatically selects the optimal threshold value based on the image histogram, allowing accurate segmentation of the yarn. 32
In addition to these steps, morphological operations such as erosion and dilation may also be employed after thresholding to further refine the image, ensuring that small imperfections are removed, and the core of the yarn is clearly defined for subsequent analysis. 32 The flowchart in Figure 4 demonstrates the algorithm implemented in this system considering the use of image processing and computer vision for yarn analysis. Figure 5 shows one of the various steps of the proposed algorithm for yarn quality analysis by image processing.
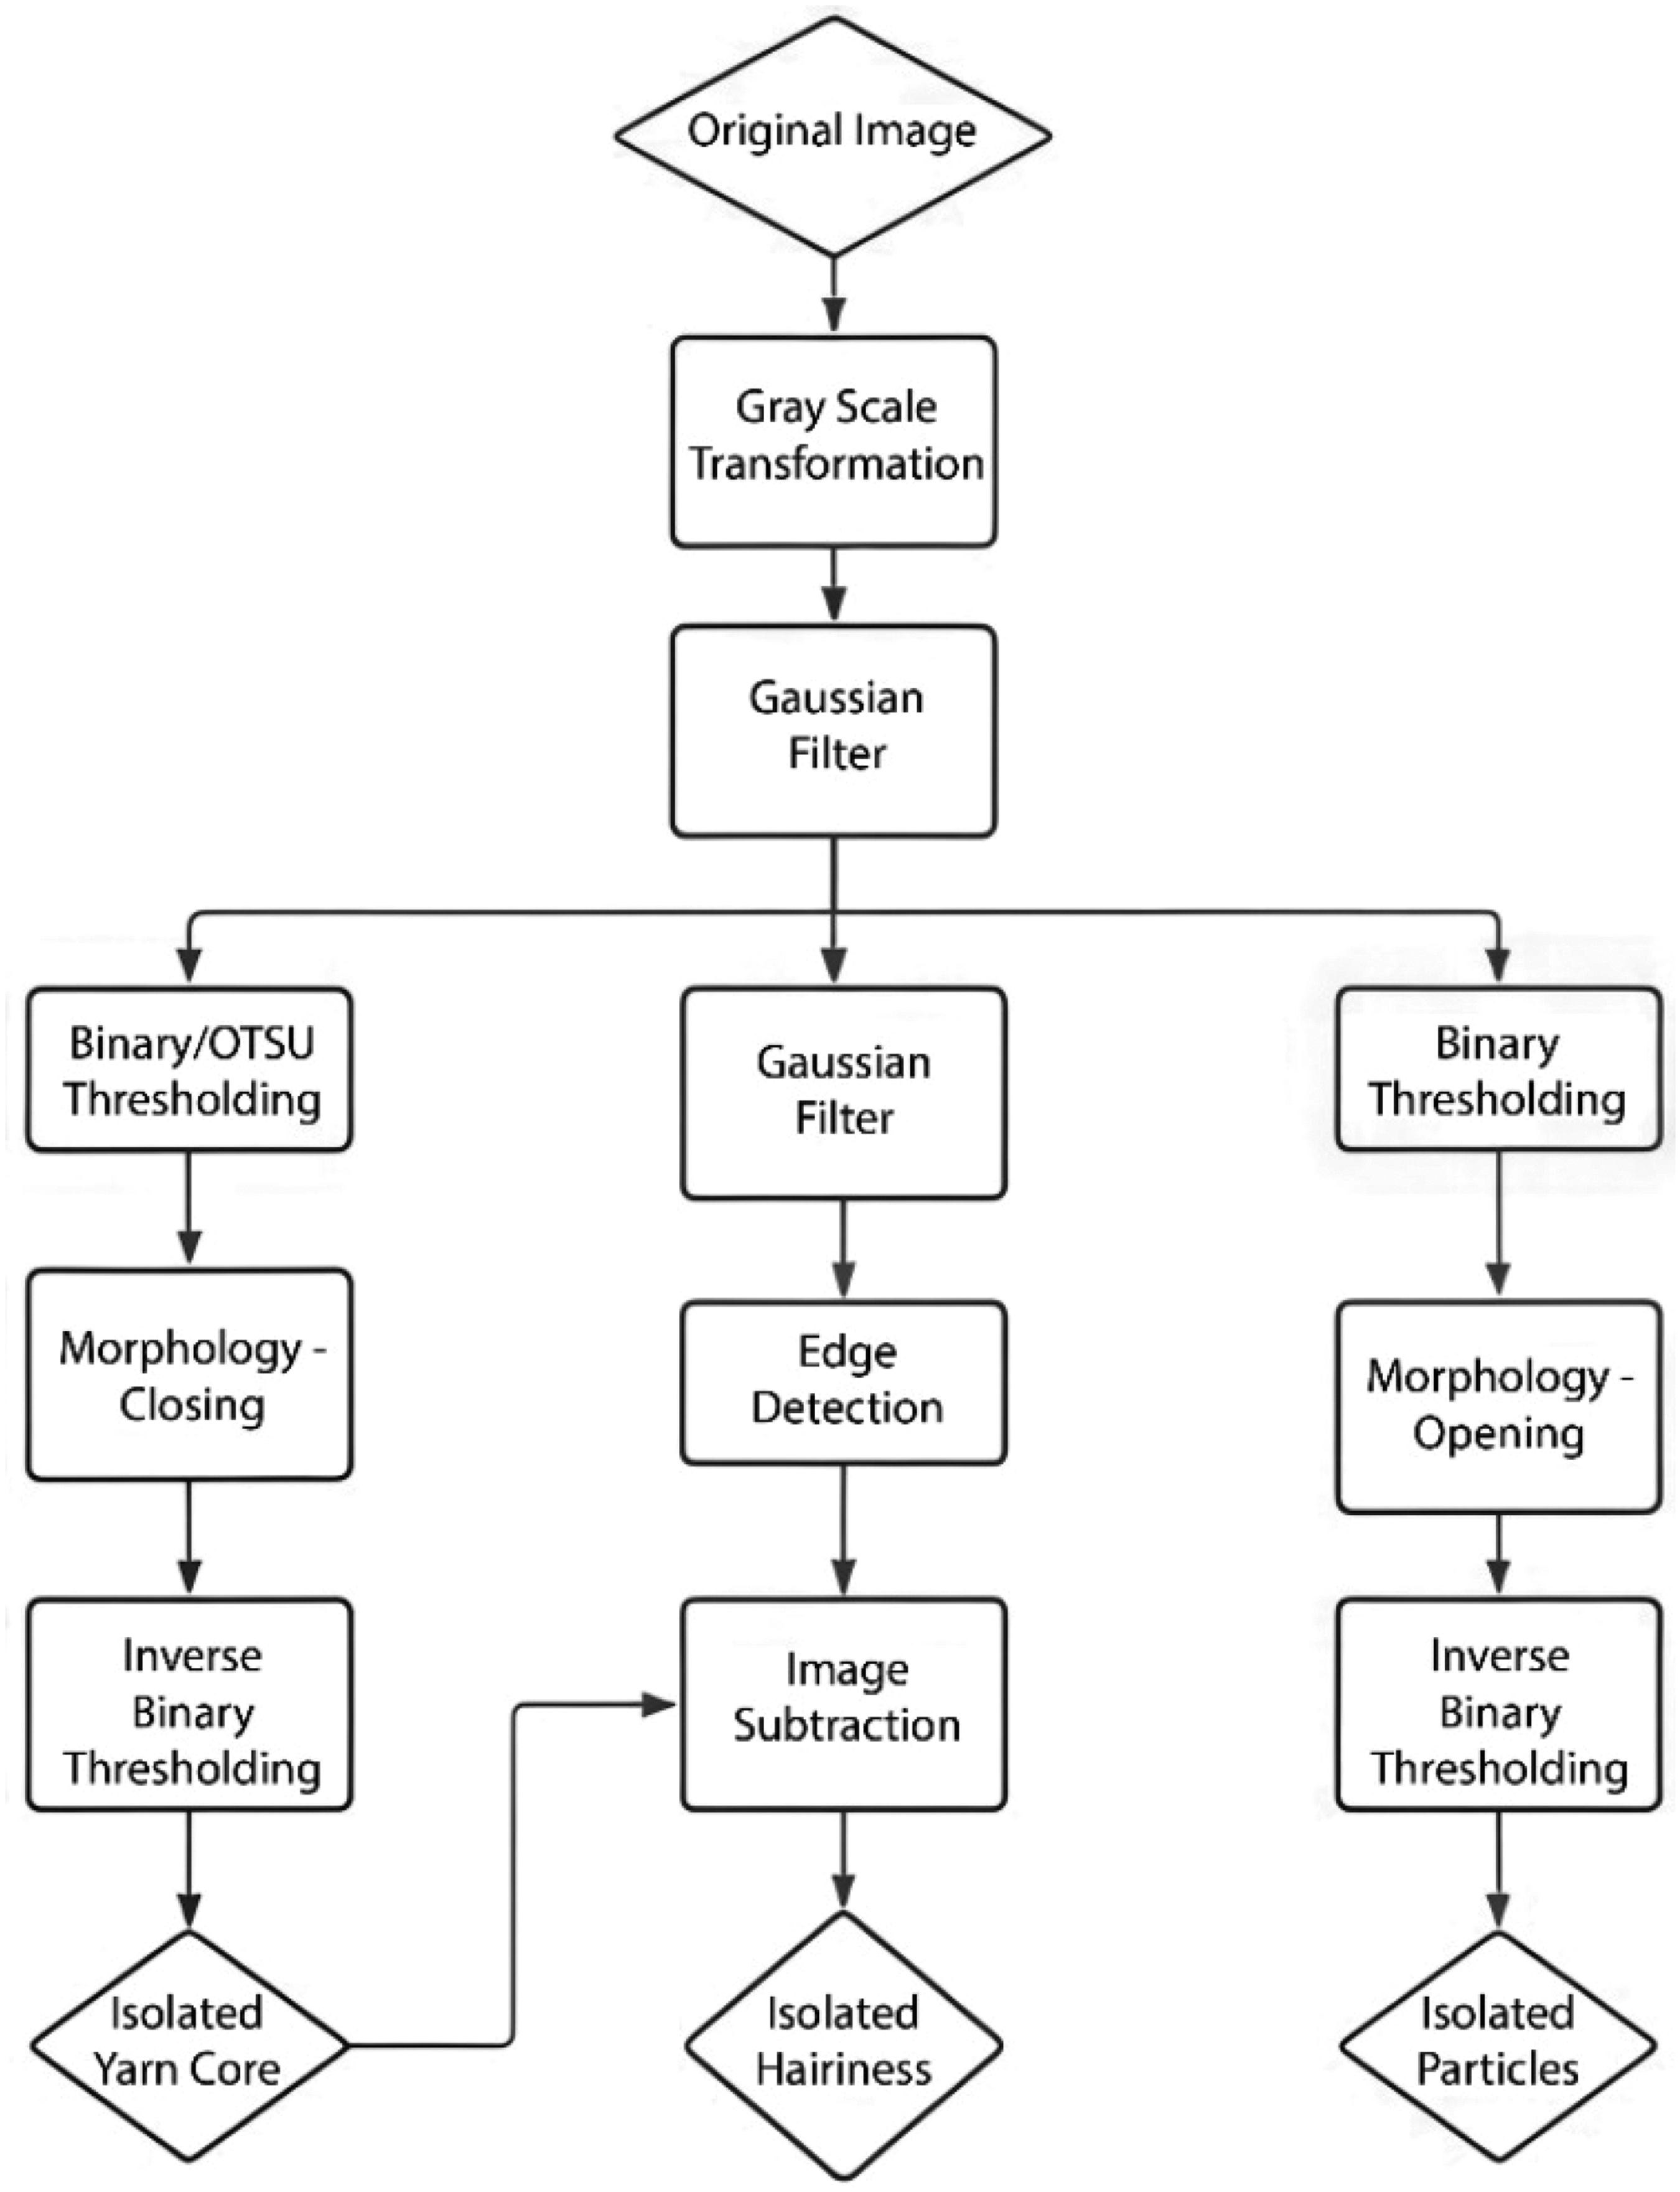
Algorithm flowchart for detecting yarn core and hairiness using image processing. 32
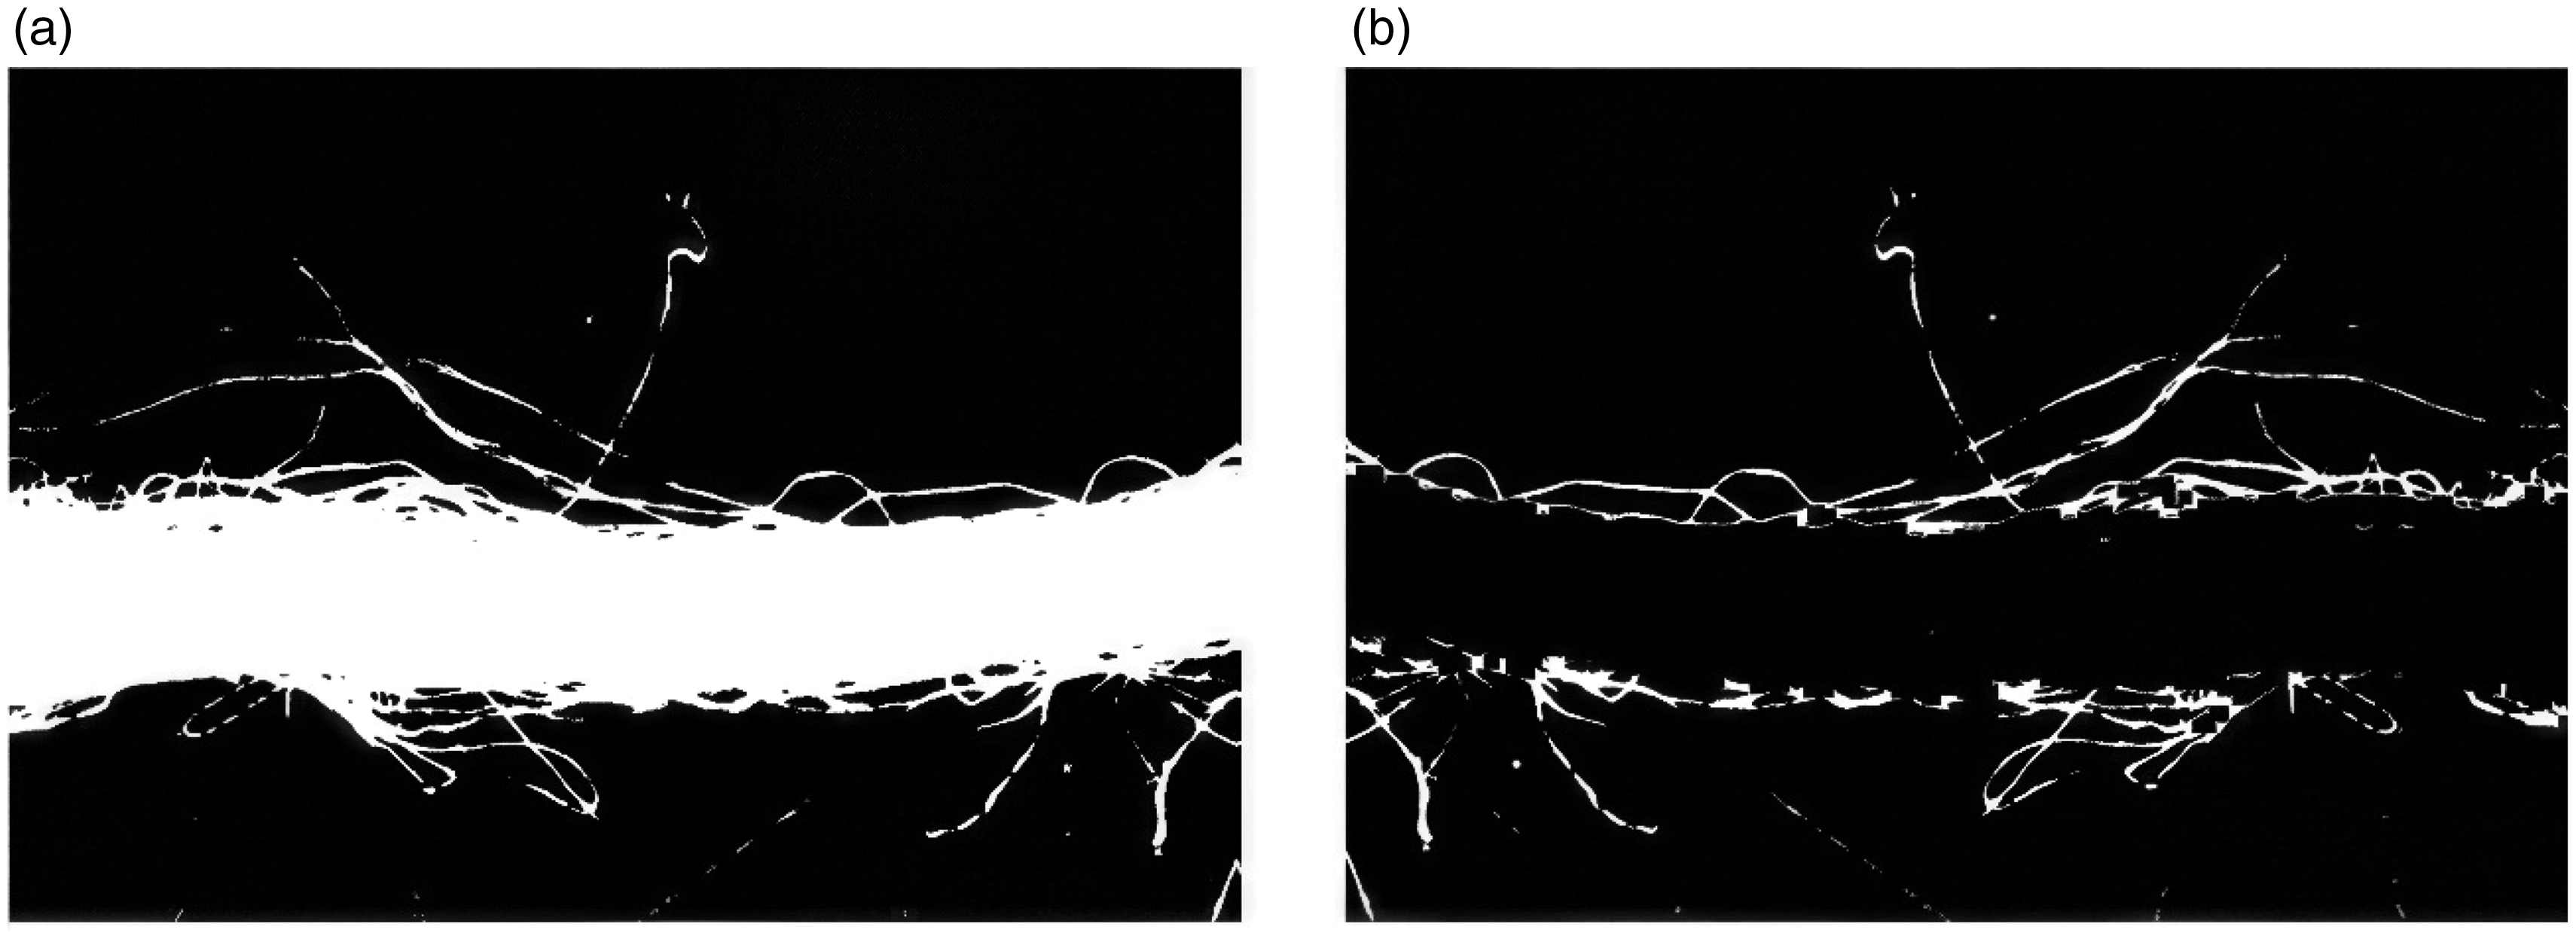
Algorithm of hairiness detection: (a) image linearization for hairiness detection and (b) subtraction of the yarn core to isolate hairiness. 32
The developed system user interface is divided into two parts (blue and red sections), as shown in Figure 6.
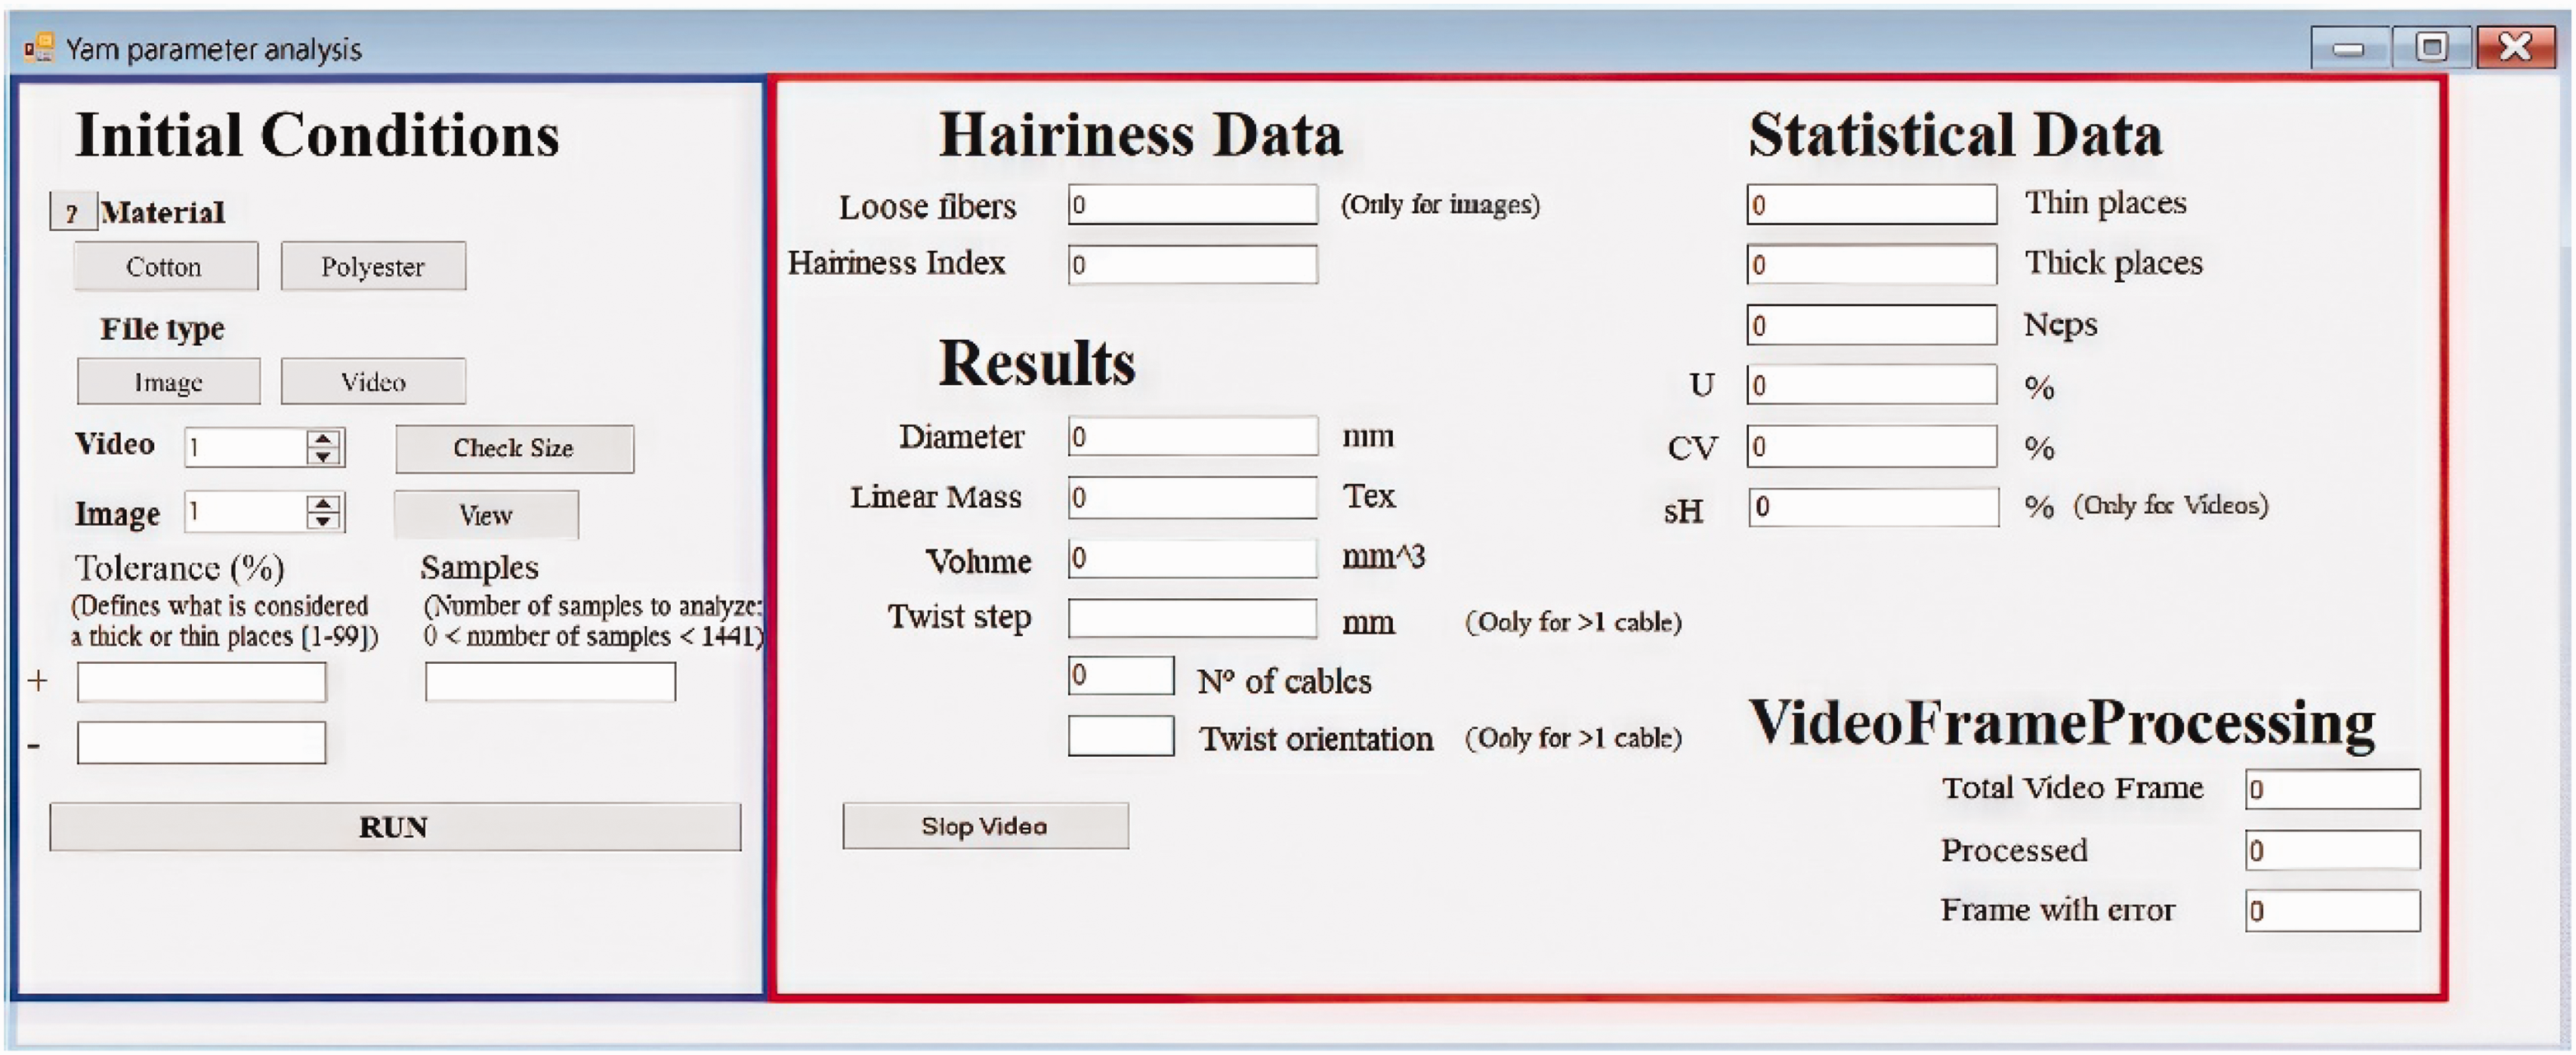
User interface.
As can be seen in Figure 6, the left-hand side of the screen (blue section) displays the input data, which is essential and includes the following.
The results are displayed on the right-hand side of the screen (red section) as can be seen in Figure 6. These results are categorized into four groups as follows.
Basic parameters of the yarn:
○ yarn diameter; ○ linear mass; ○ volume; ○ twist step; ○ number of cables; ○ twist orientation. Specific hairiness data:
○ hairiness index; ○ number of loose fibers (calculated only for images). Fault data and statistical parameters:
○ thin places; ○ thick places; ○ neps; ○ mean mass deviation (U%); ○ coefficient of mass variation (CV%); ○ hairiness standard deviation (sH%; calculated for videos/image sequences). Video and frame processing:
○ total video frames; ○ processed frames; ○ frames with errors.
The proposed system calculates the specific volume of the yarn by combining high-resolution image processing and computer vision techniques. The specific volume is derived using the yarn radius and the linear mass of the yarn, where the specific volume is directly proportional to the square of the yarn radius and inversely proportional to its linear mass. 27 This relationship allows precise determination of the yarn volume, reflecting both the occupied fiber space and the interstitial voids, using high-quality images captured by the mechatronic prototype.
Developed system prototype
The developed system prototype (Figure 7) focuses on combining automation, image processing, and DL techniques. It is equipped with an automated yarn unwinding and winding system that facilitates controlled movement of the yarn through a camera under predefined lighting conditions, ensuring accurate image capture for analysis. The speed of the yarn and its quantity can be controlled using a human–machine interface (HMI) shown in Figure 8. 33
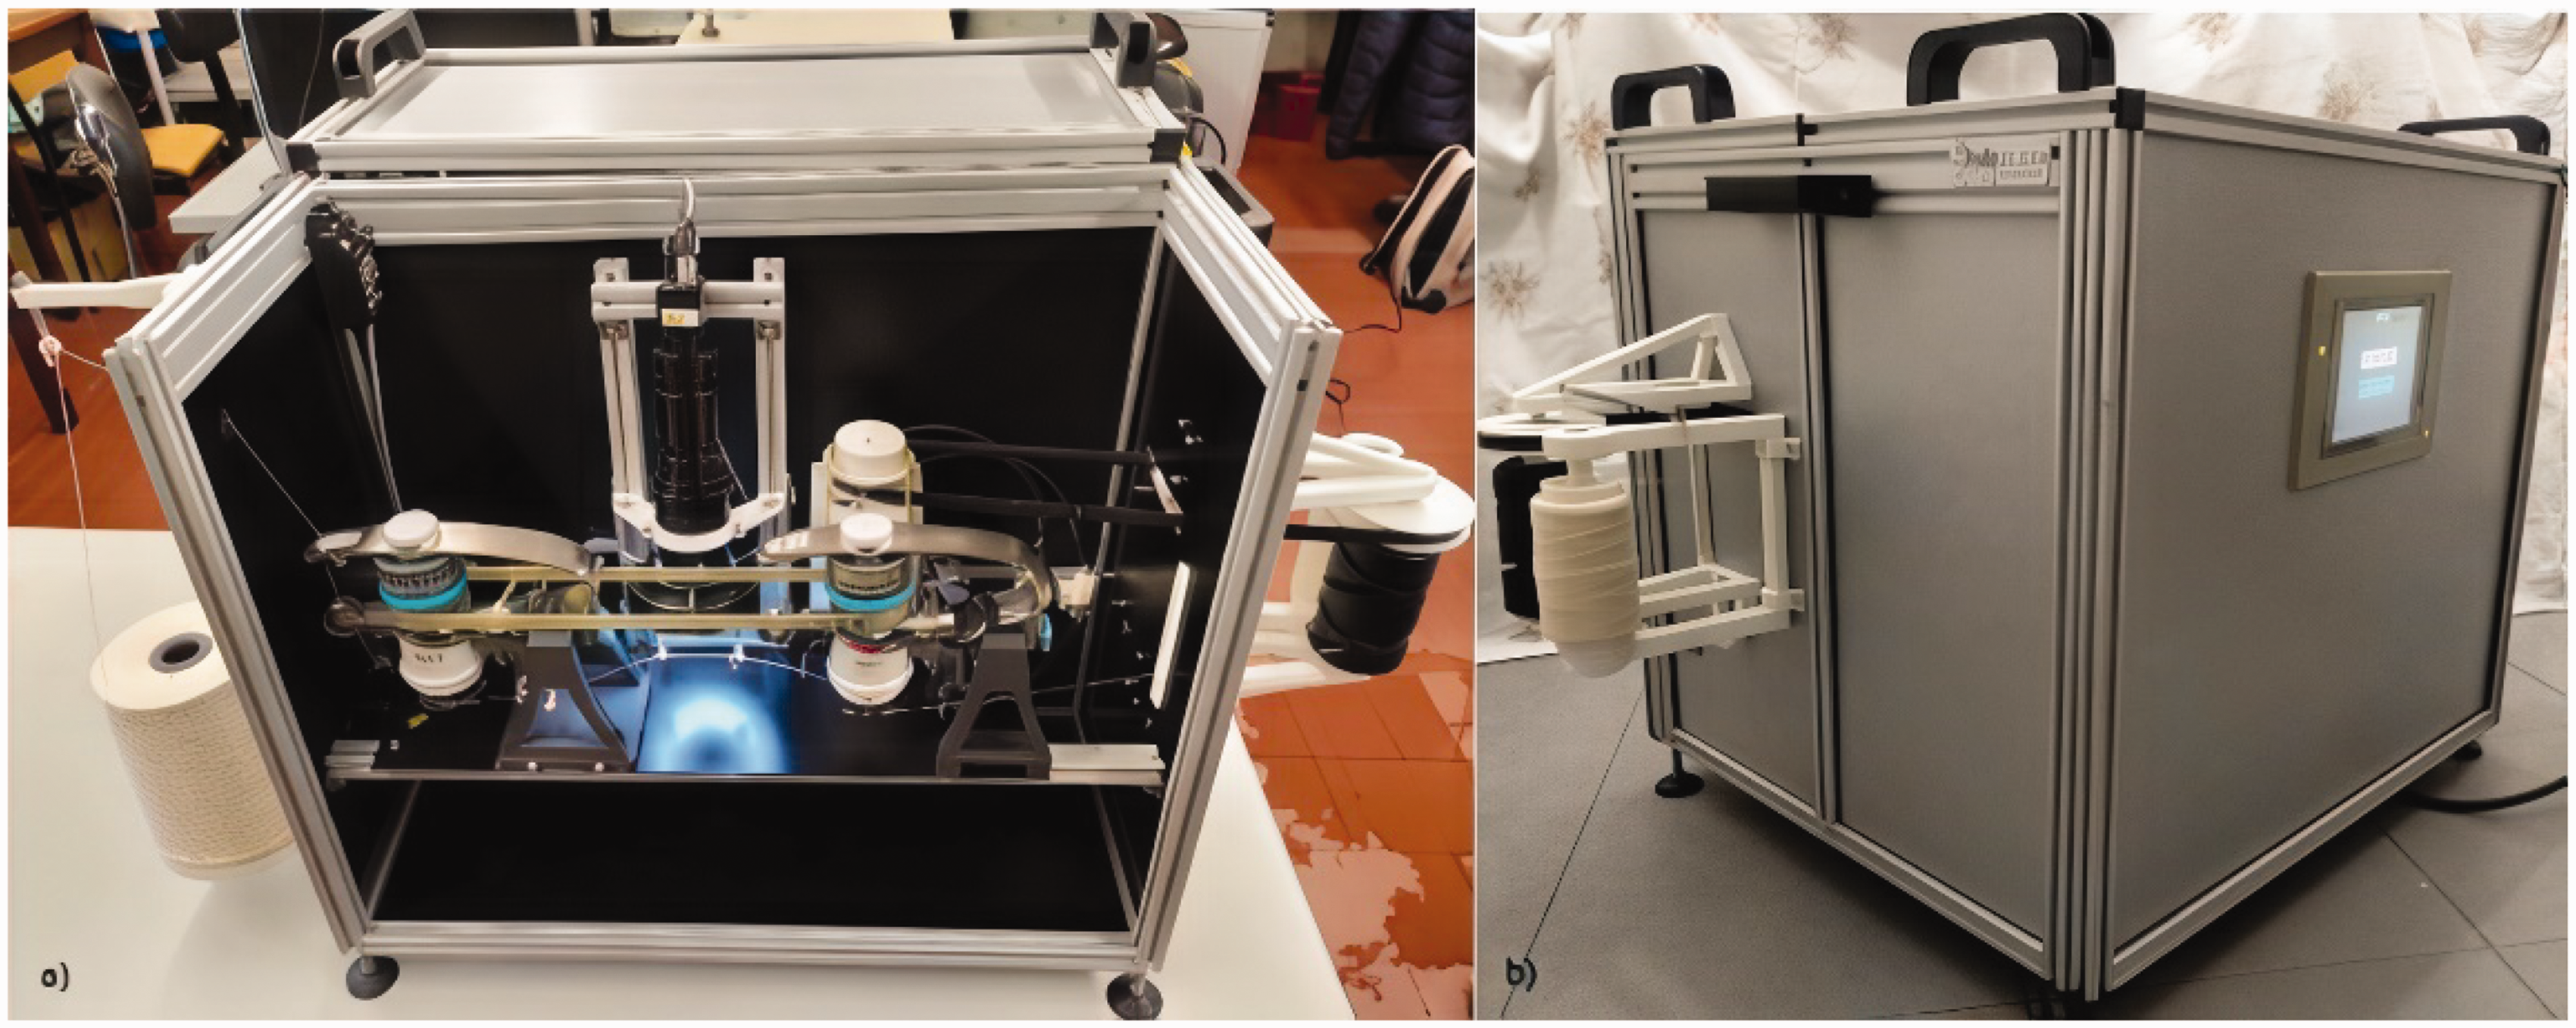
(a) Mechanical system of the developed prototype featuring a camera and servomotors and (b) enclosed prototype with HMI. 33
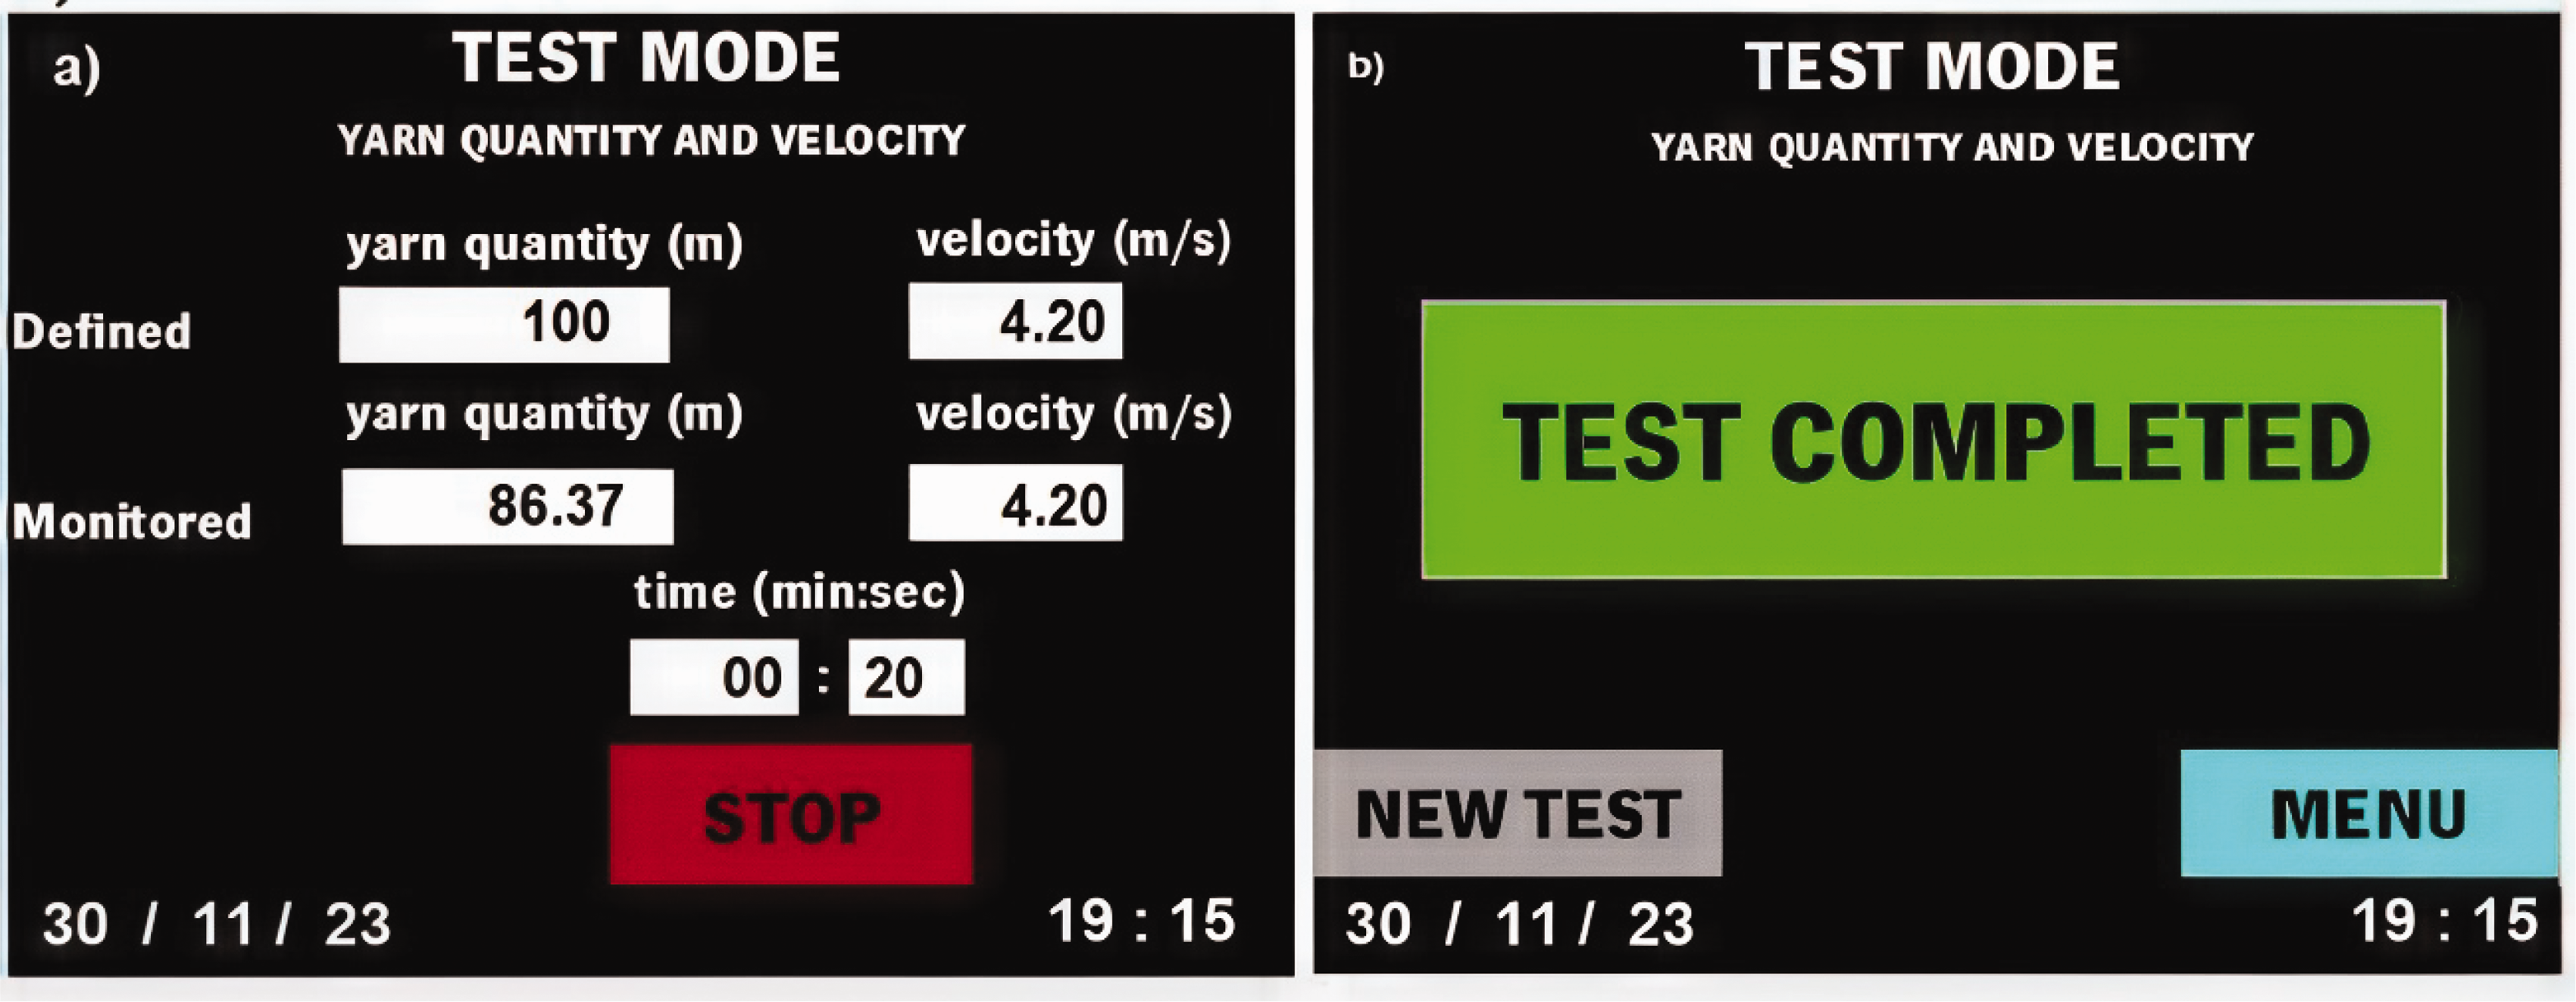
HMI user interface displaying screens for the yarn quantity and speed test (a) and the time and speed test (b). 33
A digital camera from Sentech USB 3.0 (STC-MBS163U3V - OMRON, Japan) 34 was used, featuring the following specifications: 1.6M pixel resolution, monochrome output, 238fps frame rate, 1440 × 1080 effective pixels (HxV), a 1/2.9 sensor size, and a 3.45 × 3.45 µm2 pixel size. It includes a C-mount lens and an IMX273 sensor. 35 Image capture was facilitated by the StViewer software36,37 from the same manufacturer. Image segmentation and preprocessing were performed using OpenCV and Python-based computer vision techniques. In addition, a custom application developed in C# using Visual Studio was used for managing image acquisition and processing. This prototype allows for image and video-based analysis, which distinguishes it from existing systems, and has nondestructive testing capabilities. It also uses DL techniques, specifically the improved YOLOv5s6 algorithm, 38 to detect and classify hairiness more accurately. The YOLOv5s6-Hairiness model was implemented in the PyTorch framework, with training and inference performed in Google Colab using a CUDA-enabled GPU for optimized real-time performance in detecting and classifying yarn hairiness.
The system was designed to be economical, being a low-cost alternative to commercial systems, while being versatile enough to handle different types and sizes of yarns. 33 The prototype includes a secure industrial router that allows remote access and troubleshooting of existing equipment. This configuration allows users to diagnose programmable logic controller (PLC) errors and operate the HMI remotely, significantly reducing costs. By establishing a secure virtual private network (VPN), users can access the system from anywhere using Ethernet or wireless technology (4G or Wi-Fi) without needing advanced IT knowledge. In addition, the system enables video-based yarn spectral analysis, which differentiates it from existing commercial systems. It can measure a variety of yarn parameters at the same time, such as diameter, linear mass, volume, and hairiness, making it a very useful piece of equipment for future use in the textile industry.
The prototype system leverages advanced communication and data management features to ensure security, efficiency, and convenience. The following are the key aspects of the system.
A. Secure communication via VPN.
The Flexy 205 uses a VPN to establish secure communication with remote platforms, such as Talk2M. Data transmitted between field devices (e.g., sensors, cameras, and controllers) and external networks is encrypted using SSL/TLS protocols, ensuring robust protection against unauthorized access or interception. The VPN supports device authentication and access control, allowing only authorized users to access sensitive data, a critical feature for industrial environments.
B. Efficient data storage and retention management.
Data are stored on the Talk2M platform, a secure cloud-based solution that allows centralized access to large volumes of data. The system supports customizable data retention periods, enabling storage configurations based on audit or maintenance requirements. Historical data can be retained for extended periods for analysis or regulatory compliance, with older data accessible or removable according to operational policies.
C. Convenient data tracking and monitoring
The Flexy 205 and Talk2M interface simplify data tracking, providing centralized storage for key metrics such as yarn diameter, defect detection (e.g., neps, thin places, and thick places), and other production characteristics. Timestamped data are associated with operational conditions, such as machine settings and production parameters, enabling efficient tracking and auditing. The user-friendly interface allows intuitive viewing and searching of historical data, supporting trend identification, quality monitoring, and performance evaluations.
Innovations in DL for yarn hairiness analysis
A dataset and an improved DL algorithm were developed to create a new solution for yarn analysis. The use of high-quality images and advanced DL techniques allows the created system to accurately detect defects in the yarn, such as hairiness and variations in mass, going beyond the capabilities of traditional systems such as the USTER TESTER. The improved YOLOv5s6-Hairiness model, 38 adapted specifically for this task, presented a good performance in identifying and classifying hairiness, which will allow it to be an promising tool for improving production efficiency and quality control. This cost-effective and adaptable system has the potential to offer an alternative and more accurate solution for the industry. First, the dataset created has a total of 684 original images that were increased to reach a total of 1644 images with augmentation. These have 11,037 annotations obtained from videos covering 100 meters of purple cotton yarn. These videos were recorded and hosted on Roboflow, 39 as shown in Figure 9. 27
Data augmentation applied to the dataset used in this study (cotton yarn with an average linear mass of 56.4 tex and a magnification factor of 20×). 27
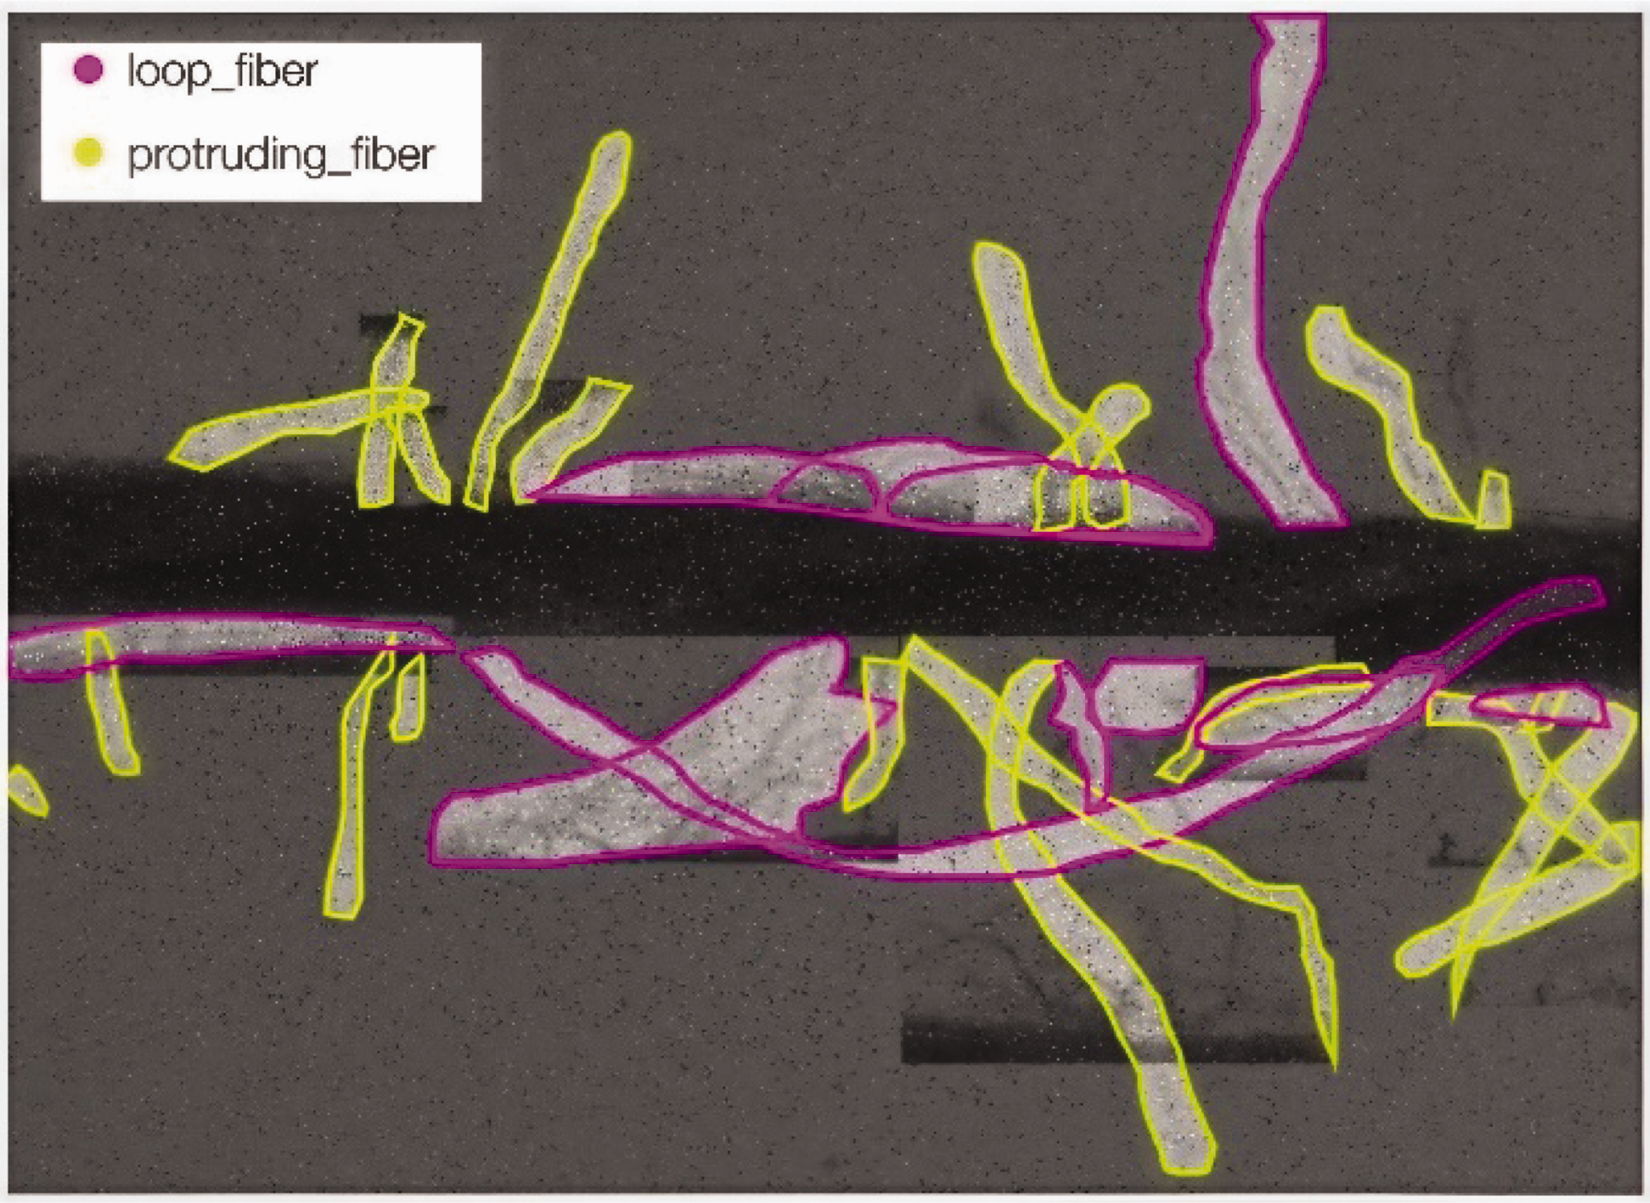
Two distinct annotation categories were established: protruding fibers and loop fibers. Regarding dataset distribution, 70% (480 images) were allocated for training, 20% (138 images) for validation, and 10% (66 images) for testing. On average, each image contains approximately 16 annotations, resulting in 6733 labels for loop fibers and 4304 for protruding fibers.
For training purposes, data augmentation was applied using Roboflow, incorporating the following transformations.
Flipping: horizontal and vertical. Saturation adjustment: variations between −25% and +25%. Blur effect: applied to up to 5% of pixels. Noise addition: limited to 5% of pixels.
This dataset features images of purple cotton yarn with an average linear mass of 56.4 tex, captured using 20× magnification. The images were recorded using a camera with a frame rate of 238fps and a 1.6M pixel resolution integrated into the designed mechatronic prototype, as stated previously. The automated system developed for yarn hairiness identification involves four key steps, exposed in the flowchart of Figure 10. 33
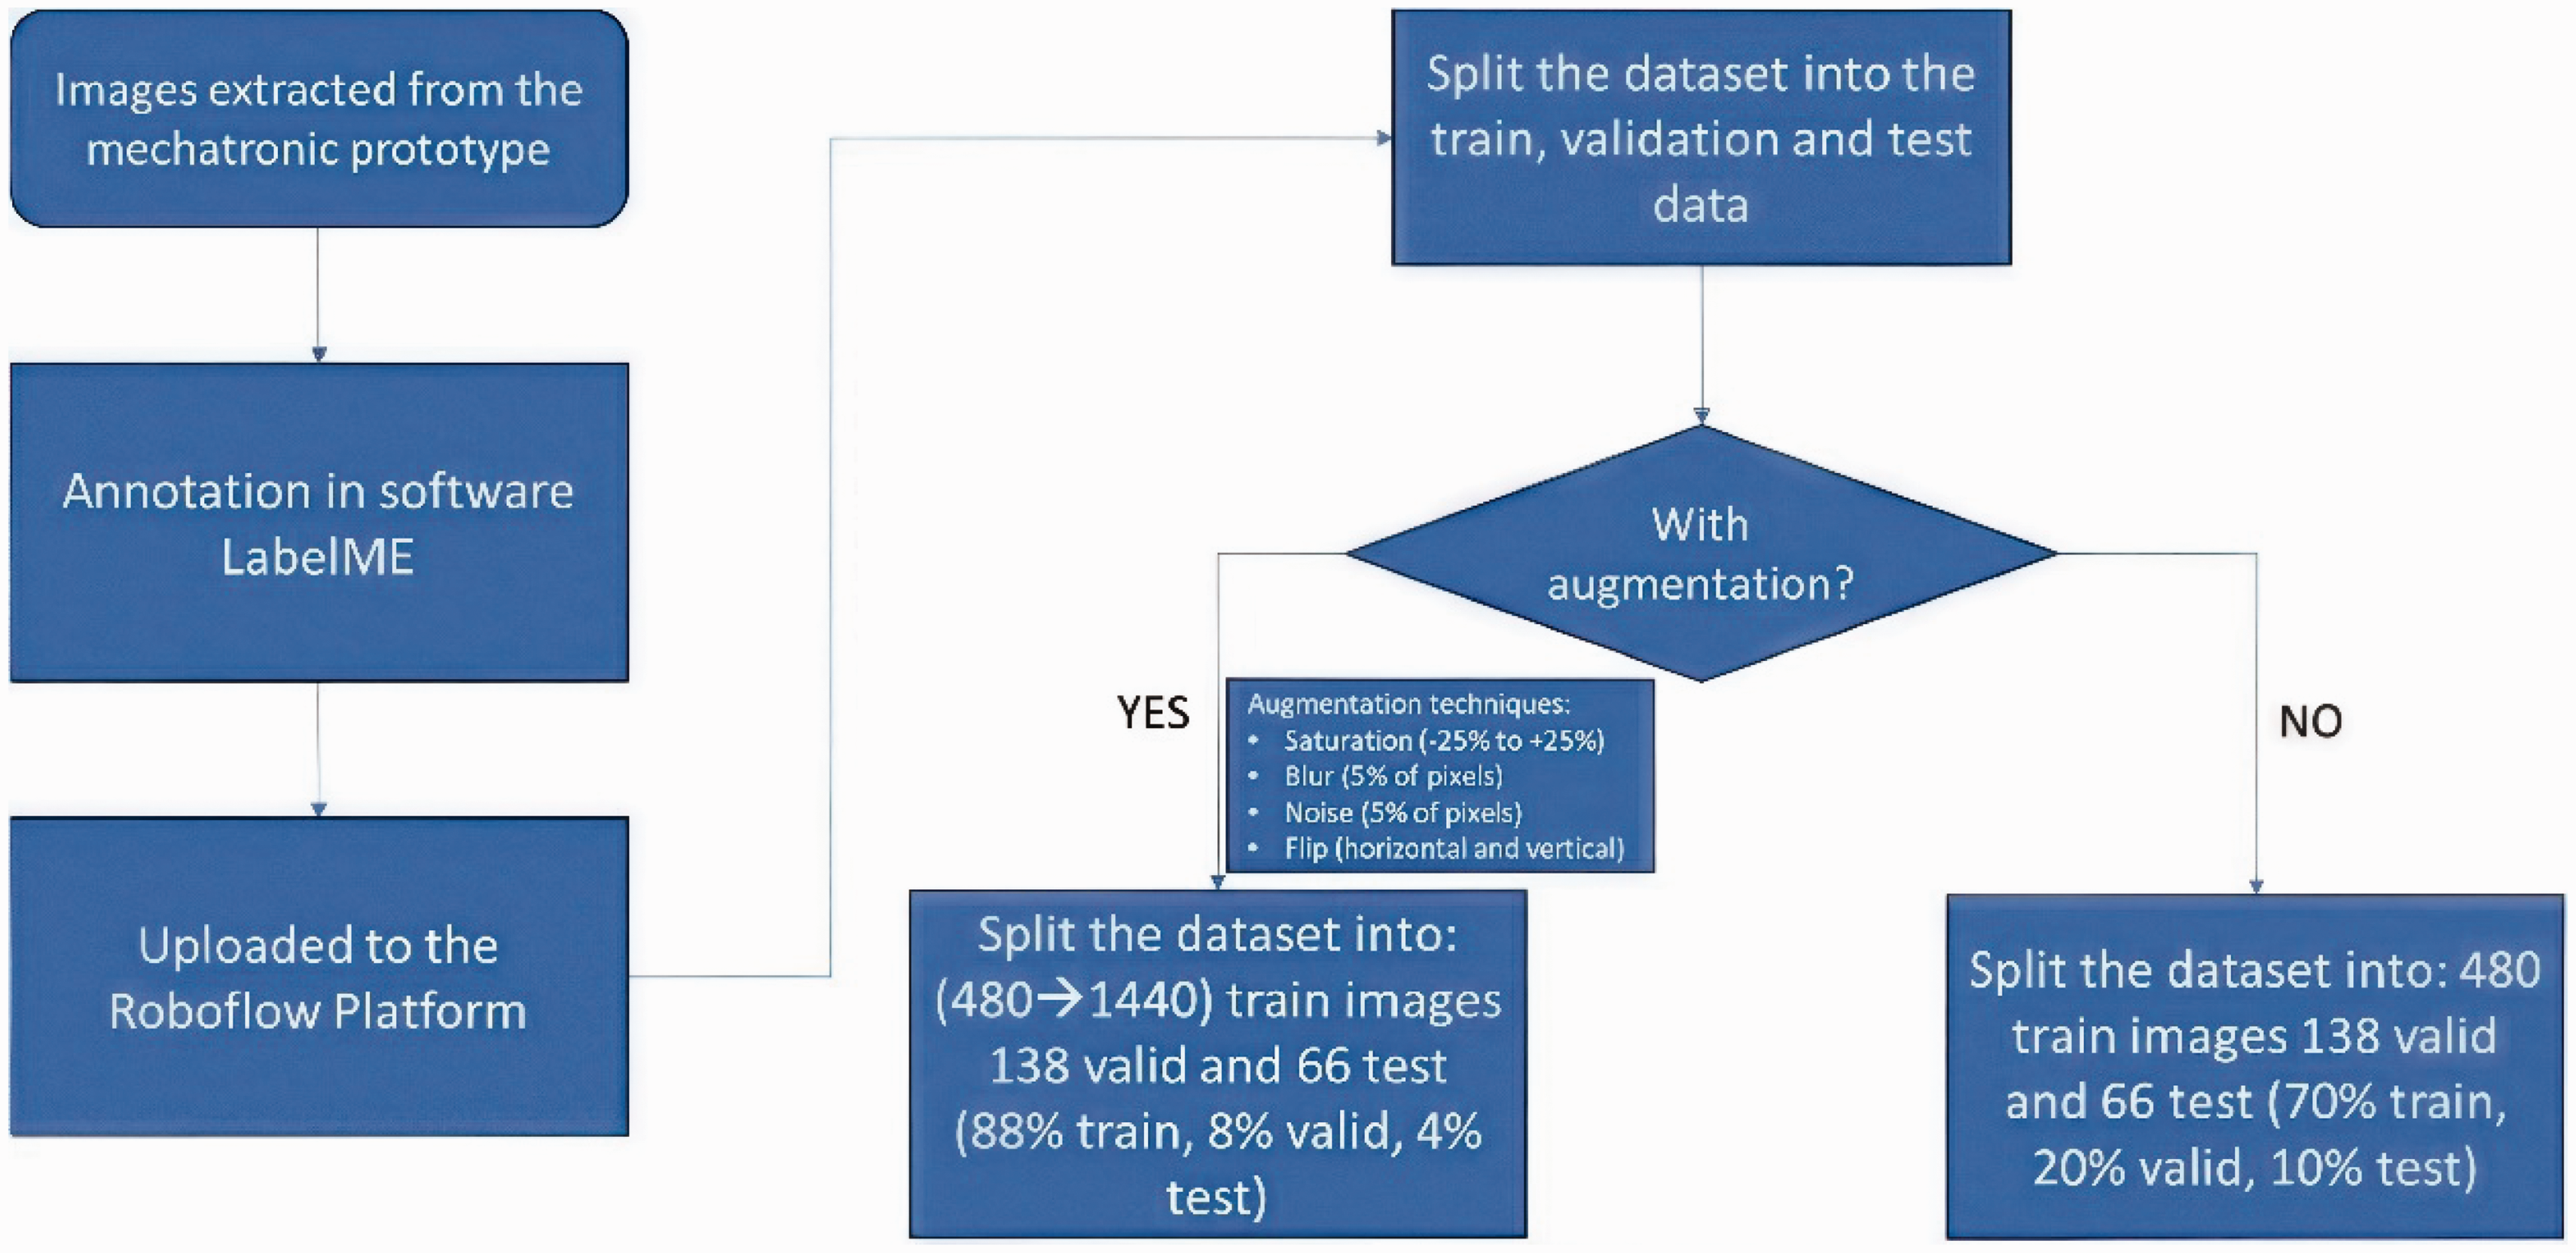
Dataset acquisition process flowchart. 33
Generation of images within the mechatronic prototype.
Annotation of the dataset.
Splitting of the dataset using Roboflow.
Analysis of metrics derived from the dataset.
As stated previously, the created system also has a focus on innovation in which DL techniques were developed and optimized to detect and classify hairiness in the yarn. The chosen and improved architecture, YOLOv5s6, was selected for its balance between performance and speed, improving even other more recent versions, such as the YOLOv8, in terms of efficiency. To increase its enhanced effectiveness in yarn analysis, modifications have been made to its structure, including the integration of Bot-Transformer and C2f (Coarse-to-Fine) modules,40–42 which increase its ability to detect and classify complex defects such as protruding and loop fibers. In addition, the GeLU (Gaussian error Linear Unit)43–45 activation function was implemented to improve training stability and nonlinearity, allowing for better recognition of fine details in hairiness. Figure 11 shows the architecture of the improved algorithm YOLOv5s6-Hairiness. 38
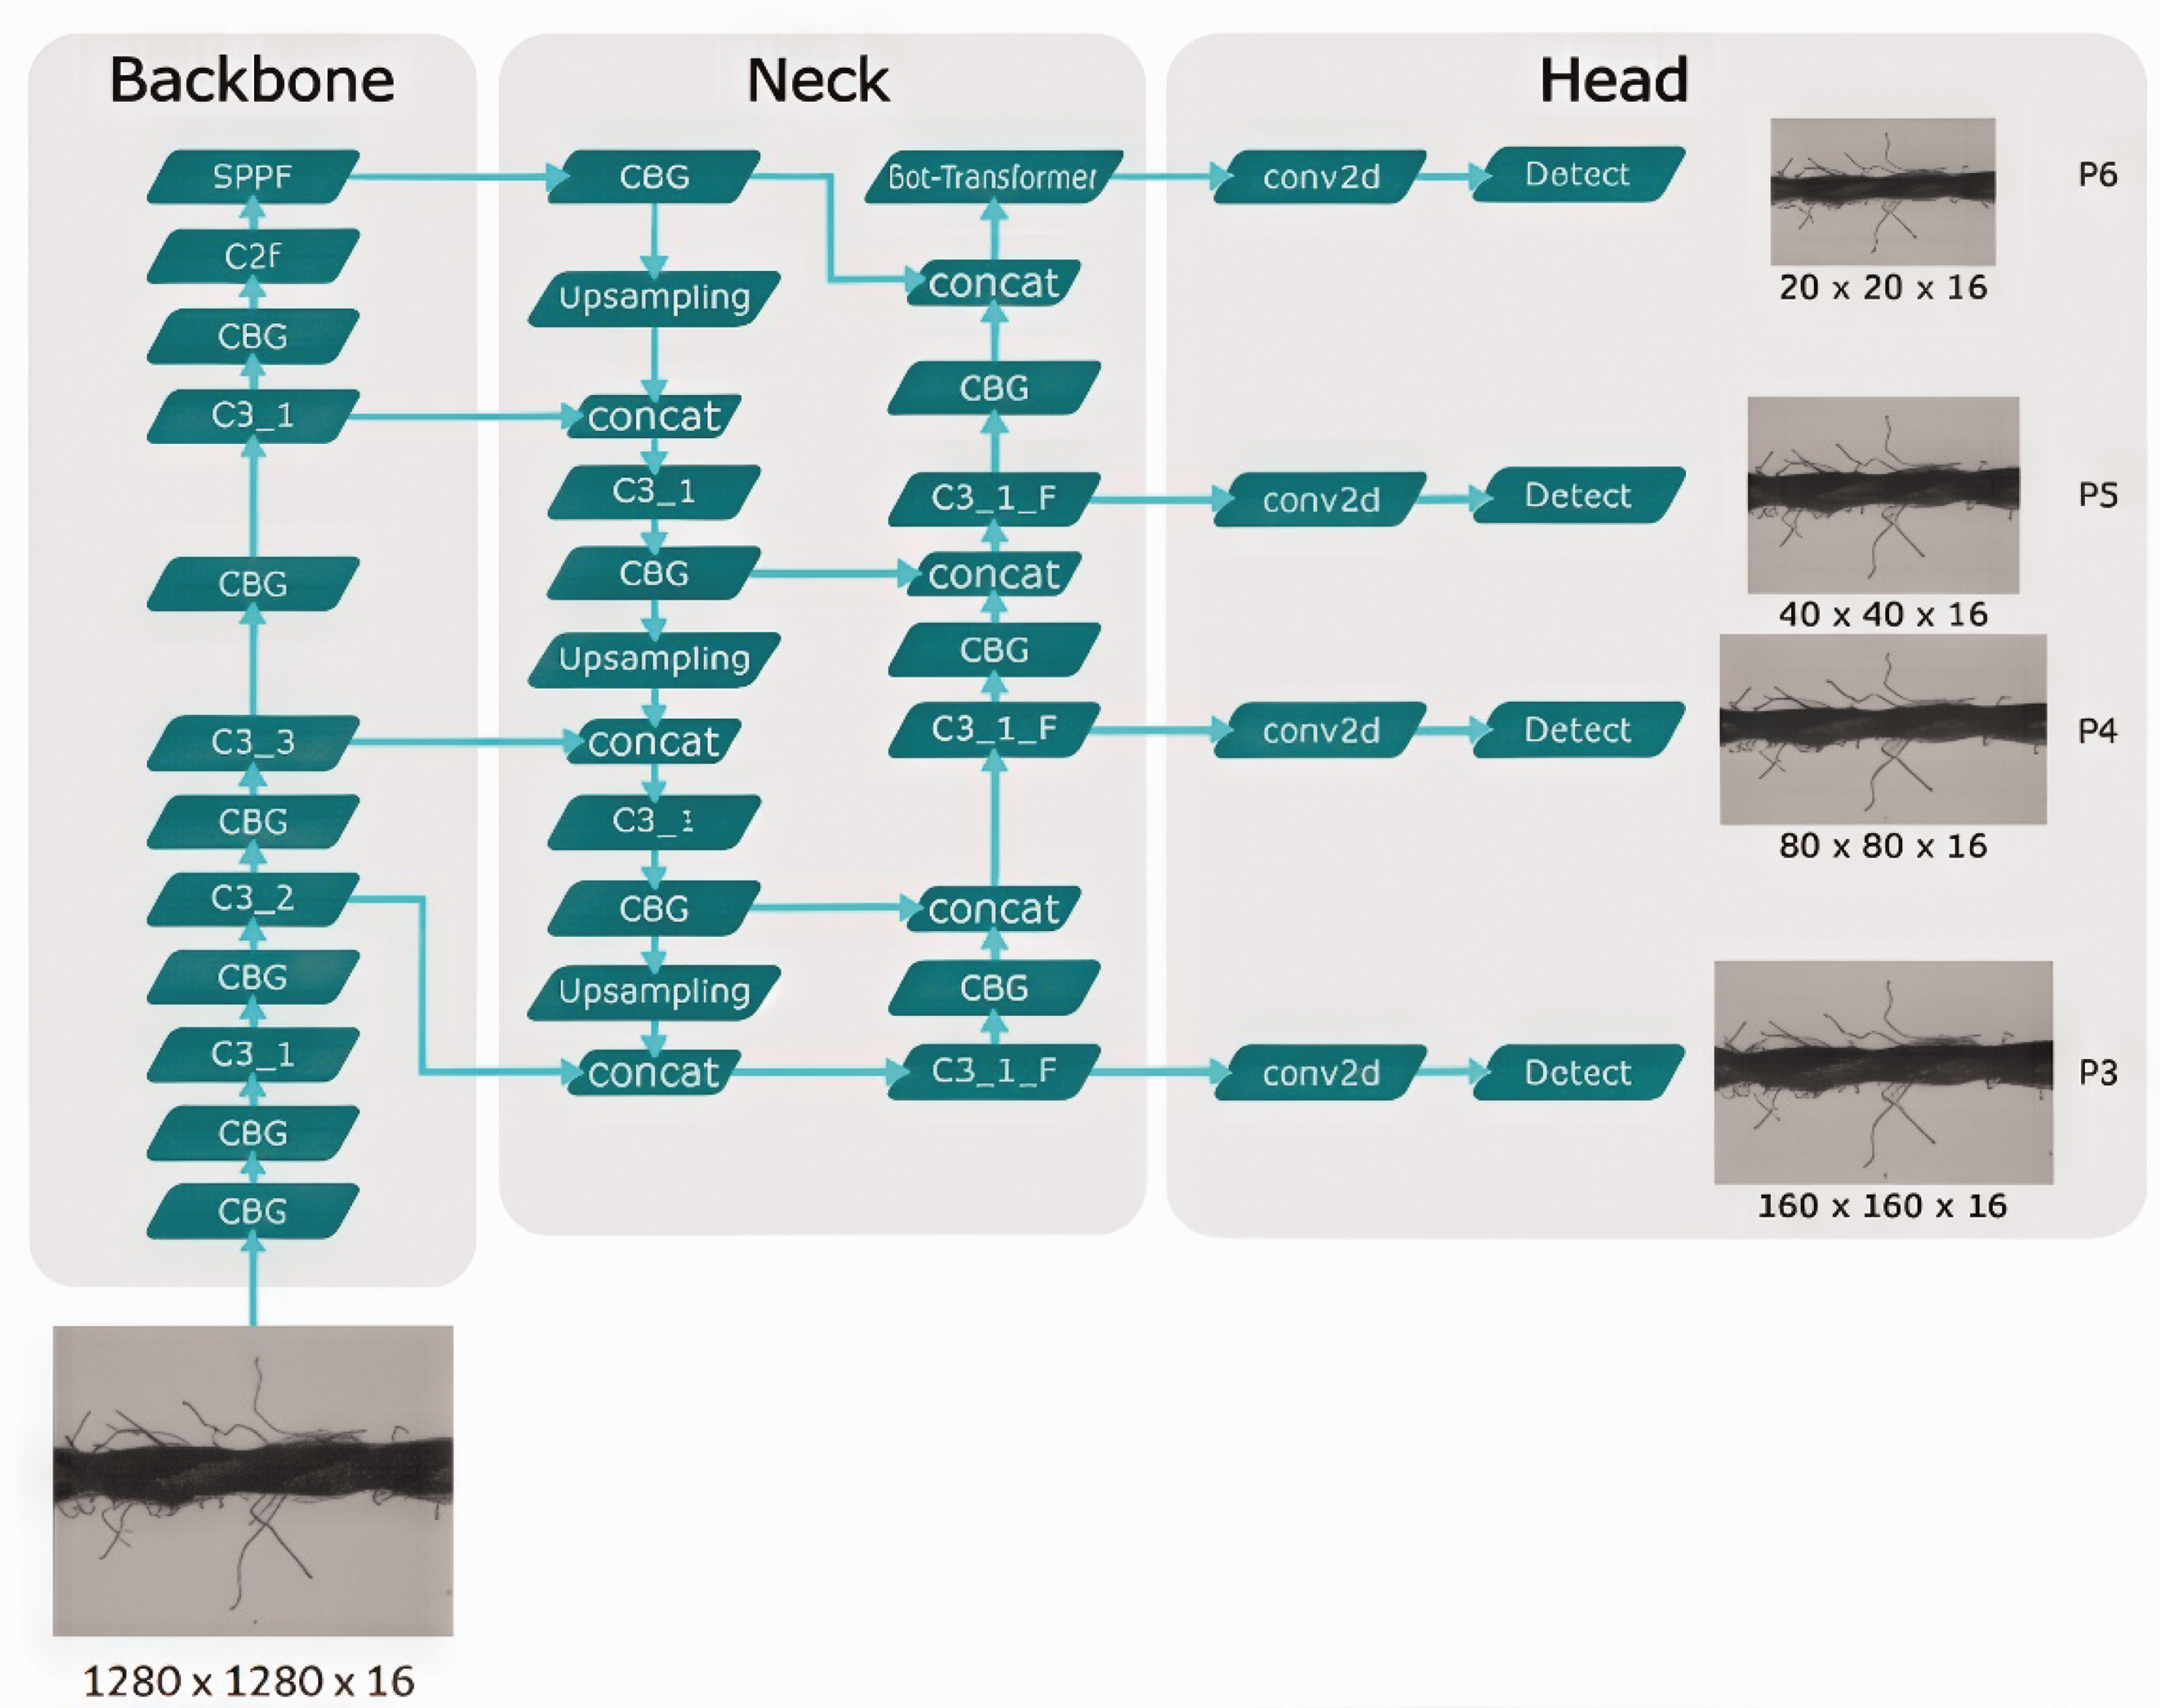
Improved architecture of the YOLOv5s6-Hairiness. 38
The proposed YOLOv5s6-Hairiness model introduced two key innovations: the Bot-Transformer module and the C2f (Coarse-to-Fine) module, both of which play a crucial role in improving hairiness detection and the overall accuracy of the model.
Bot-Transformer
The Bot-Transformer module is an adaptation of the traditional transformer, designed to enhance the model’s ability to efficiently capture and process contextual features. It functions as an attention mechanism, enabling the model to focus on areas of interest along the yarn, especially regions with fine variations such as hairiness. The Bot-Transformer facilitates the detection of overlapping objects, which is critical for hairiness, where fibers and threads may intertwine or exhibit similar characteristics at various scales.
C2f (Coarse-to-Fine)
The C2f module aims to integrate information from different resolution levels. This module allows the model to initially process the image at a lower resolution (coarse) and then refine detection at a higher resolution (fine). This dual-resolution approach captures both large and small details, enhancing the accuracy of detecting hairiness and other defects in textile yarns. In addition, it improves processing efficiency by using the lower resolution to identify general patterns while the higher resolution focuses on intricate details.
Spectral video analysis to identify periodic irregularities in yarn
The system obtains spectral analysis via video to detect periodic irregularities in the yarn, analyzing the frequency components inherent to the structure and movement of the yarn. This process involves capturing continuous video images (Figure 12) as they move across the prototype and applying a Fourier transform to divide the video data into its frequency components.
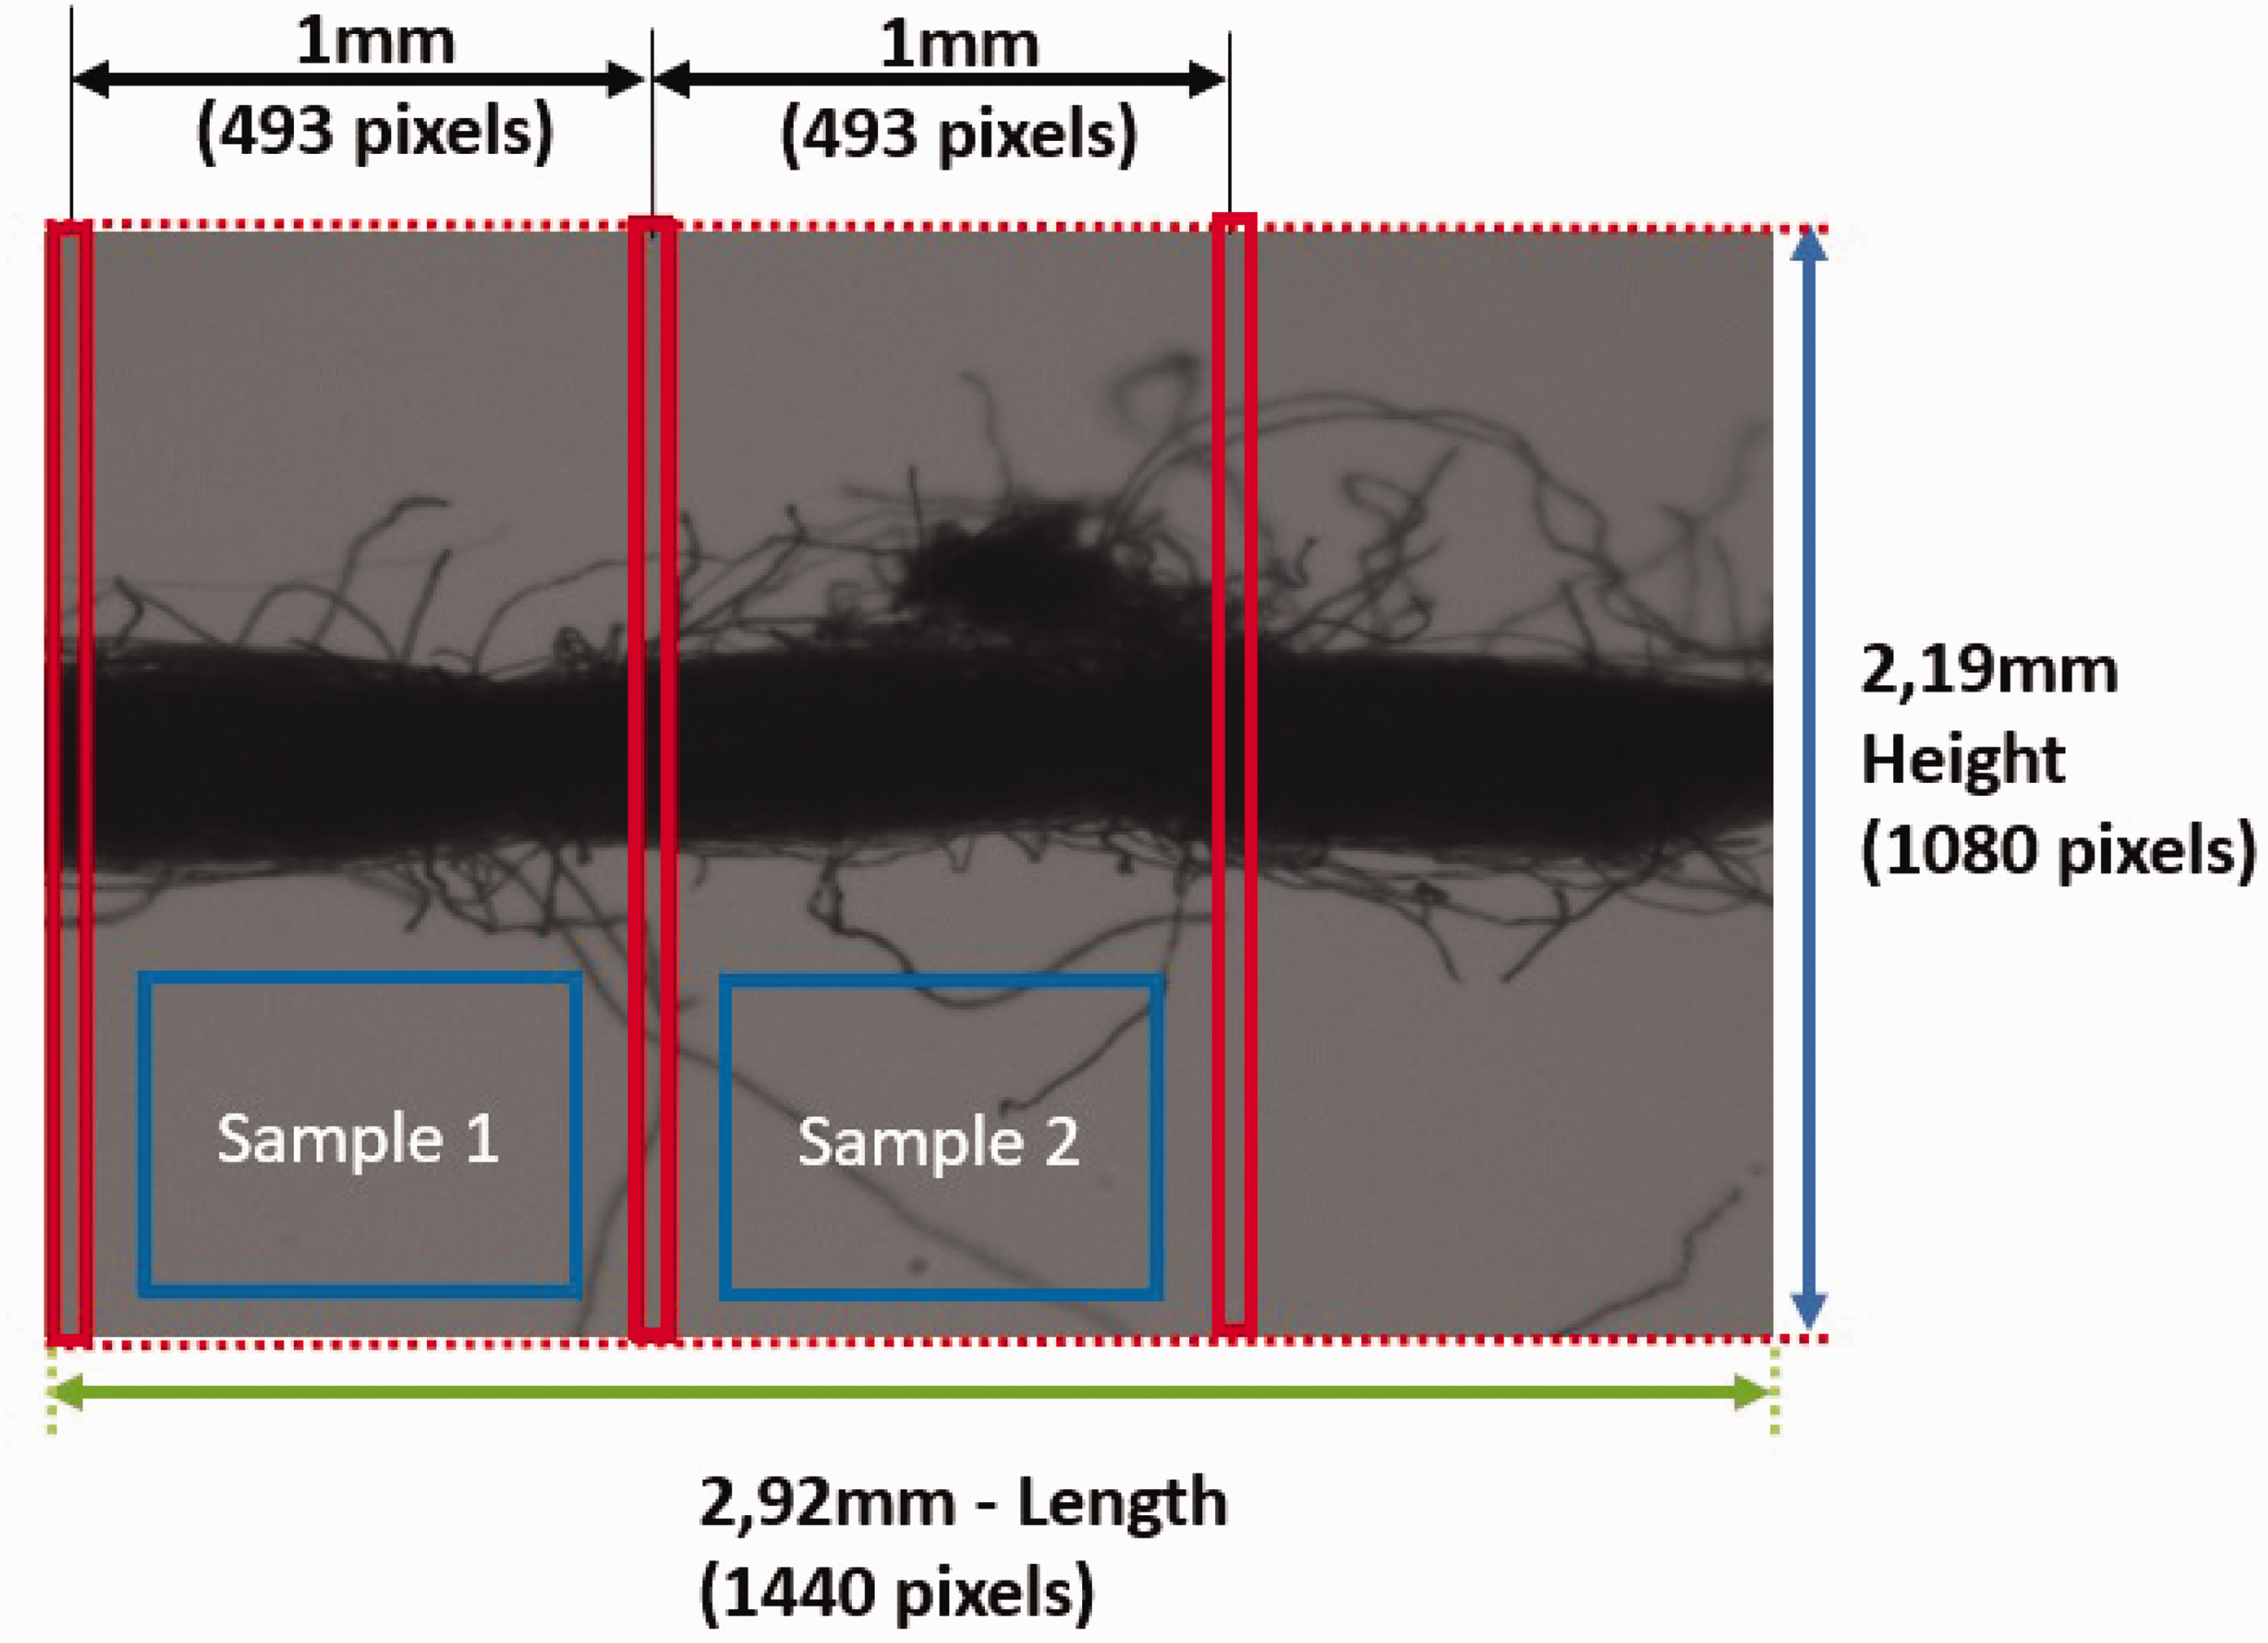
Video samples used for spectral analysis of the yarn.
Spectral analysis is used in the analysis of yarn with a sample width of 1 mm. The sample length during video analysis is determined by the acquisition frequency and capture speed. With an acquisition frequency of 200 Hz and capture speed of 0.2 m/s, 100,000 samples were collected, which made up a total of 100 meters of yarn. Each sample was taken at 1 mm intervals, calculated based on the frequency and speed of acquisition. This means the camera captures a frame every 1/200th of a second, moving 1 mm along the yarn for each frame. This 1 mm sample length per frame is then used to analyze the variation in wavelength with respect to frequency, ensuring accurate analysis of the yarn at the specified length.
However, segments smaller than 1 mm were excluded. This was not an oversight but a deliberate technical choice. The algorithm, however, is designed to allow adjustments to the 1 mm segmentation if needed for specific applications.
This method is very useful, as it allows you to detect defects or repeated patterns that may not be detected in static images. Periodic faults such as thick or thin places, neps, and other defects are more visible in the frequency domain, making them easier to identify and measure. By analyzing these variations in real time, the system provides a more complete and continuous view of yarn quality. Video spectral analysis allows efficient and nondestructive monitoring of yarn production, providing rapid detection and correction of problems without interrupting the manufacturing process. This technique increases the precision and reliability of yarn quality control, differentiating it from traditional systems that rely only on the analysis of static images, by obtaining images through video and passing the yarn at a speed of up to 4.2 m/s.
Competitive advantages
The proposed system allows obtaining a wider range of characteristics, with the ability to detect defects and analyze yarn parameters. The main aspects that differentiate it from other systems are now described.
Cost efficiency
The system provides a much more affordable solution compared with commercial alternatives. By using low-cost components and open-source software, it minimizes both deployment and maintenance expenses. The total estimated cost of the prototype, considering only mechanical and electronic components, was around €1300. This cost is significantly lower compared with commercial systems such as the USTER TESTER 6, which is priced at approximately €200,000 making our prototype a more affordable and scalable alternative for the textile industry.
Ease of use
The system has a friendly and intuitive interface, which makes it easy to use without the need for advanced technical knowledge. Its portability and adaptability allow its use in different areas of textile production lines.
Detection of hairiness in yarn using DL
DL algorithms, which is the case with the improved model used in the system, YOLOv5s6-Hairiness,
38
increase accuracy in detecting and classifying hairiness, including protruding fibers and loop fibers. The system also allows you to obtain other parameters, such as:
loose fibers; number of cables; twisting orientation.
The improved YOLOv5s6-Hairiness model was fully integrated and tested in the developed prototype, ensuring its compatibility with the system’s hardware and computational resources. The model was trained and evaluated using the dataset generated within the prototype, consisting of images and videos captured under controlled conditions.
System versatility
The proposed system is versatile and capable of adapting to different types of yarn and production conditions. It can easily be adjusted to analyze cotton, polyester, or other types of yarn. This adaptability characteristic is important for its integration into the textile industry.
Algorithm customization
Unlike existing commercial solutions, the system created allows advanced adaptations of analysis algorithms. DL algorithms such as YOLOv5s6 can be trained with new data or adjusted as needed to adapt to changes in the production process or specific quality requirements. This point can be considered a differentiator as it allows you to adapt to changes and improvements that may occur in the textile industry.
Scalability
Another important advantage is the scalability of the system. The system created can be implemented in both small and large production lines in the textile industry. The system is capable of processing large volumes of data efficiently.
Integration with IoT and industrial automation
The system’s ability to easily integrate with IoT (Internet of Things) technologies and communication platforms such as OPC-UA (Open Platform Communications Unified Architecture) 43 or MQTT (Message Queuing Telemetry Transport), 43 allows the operating data collected from the prototype to be easily shared with other systems. As one of the characteristics of Industry 4.0/5.0, this facilitates the creation of automated and predictive maintenance solutions.
Reducing environmental impact
Detecting defects in yarn so that it is not inserted into textile production lines significantly reduces material waste. This, in turn, decreases the environmental impact of the production process, since less energy and materials are used to correct errors by eliminating defective end products.
Remote maintenance support
The system offers support for remote maintenance using solutions such as the Industrial Router it has, as it allows connection via VPN for real-time monitoring and maintenance of the equipment that makes up the prototype. This minimizes downtime and the need for in-person interventions, something that is not supported by more traditional commercial systems.
Reduced cost and portability
The proposed system offers advantages in terms of reduced cost (estimated at less than €1300, considering only the used hardware/software components) and portability, because of its compact size and light weight (weighing less than 30 kg and occupying less than 0.27 m³ in volume). The developed system can be easily transported and installed in different production steps in the textile industry. This makes it a system with reduced initial investment and expected low maintenance, making it more accessible to a wide range of companies in the textile industry.
Early detection and quality assessment of yarn defects for enhanced production efficiency
The detection of additional details, including neps, offers valuable insights into yarn quality and serves as an early warning system for production issues. This approach allows for the identification of defects without disrupting the production process, enabling proactive measures to address quality concerns. By detecting defects early, the system helps reduce material waste and ensures that only high-quality yarn proceeds to the fabric production stage. In addition, the analysis generates a comprehensive report through the user interface, which can be utilized in production environments to monitor yarn quality and implement timely interventions before the yarn is integrated into the final fabric production process.
Experimental results
A comparative analysis was conducted between the proposed system and the research center available commercial equipment USTER TESTER 3. The results of the metrics obtained by the modified algorithm YOLOv5s6-Hairiness are presented and compared with the default version and with other models and neural networks. YOLOv5s6-Hairiness algorithm is used only for the detection and classification of yarn hairiness. The detection of neps, thick places, and thin places is currently achieved using image processing techniques only. Furthermore, the training dataset can be expanded to include more defect samples, such as neps and thick/thin places, enhancing the model’s versatility.
Yarn analysis with image processing/computer vision
Three different yarn bobbins, showed in Figure 13, were used: purple cotton yarn, yellow cotton yarn, and white polyester yarn.
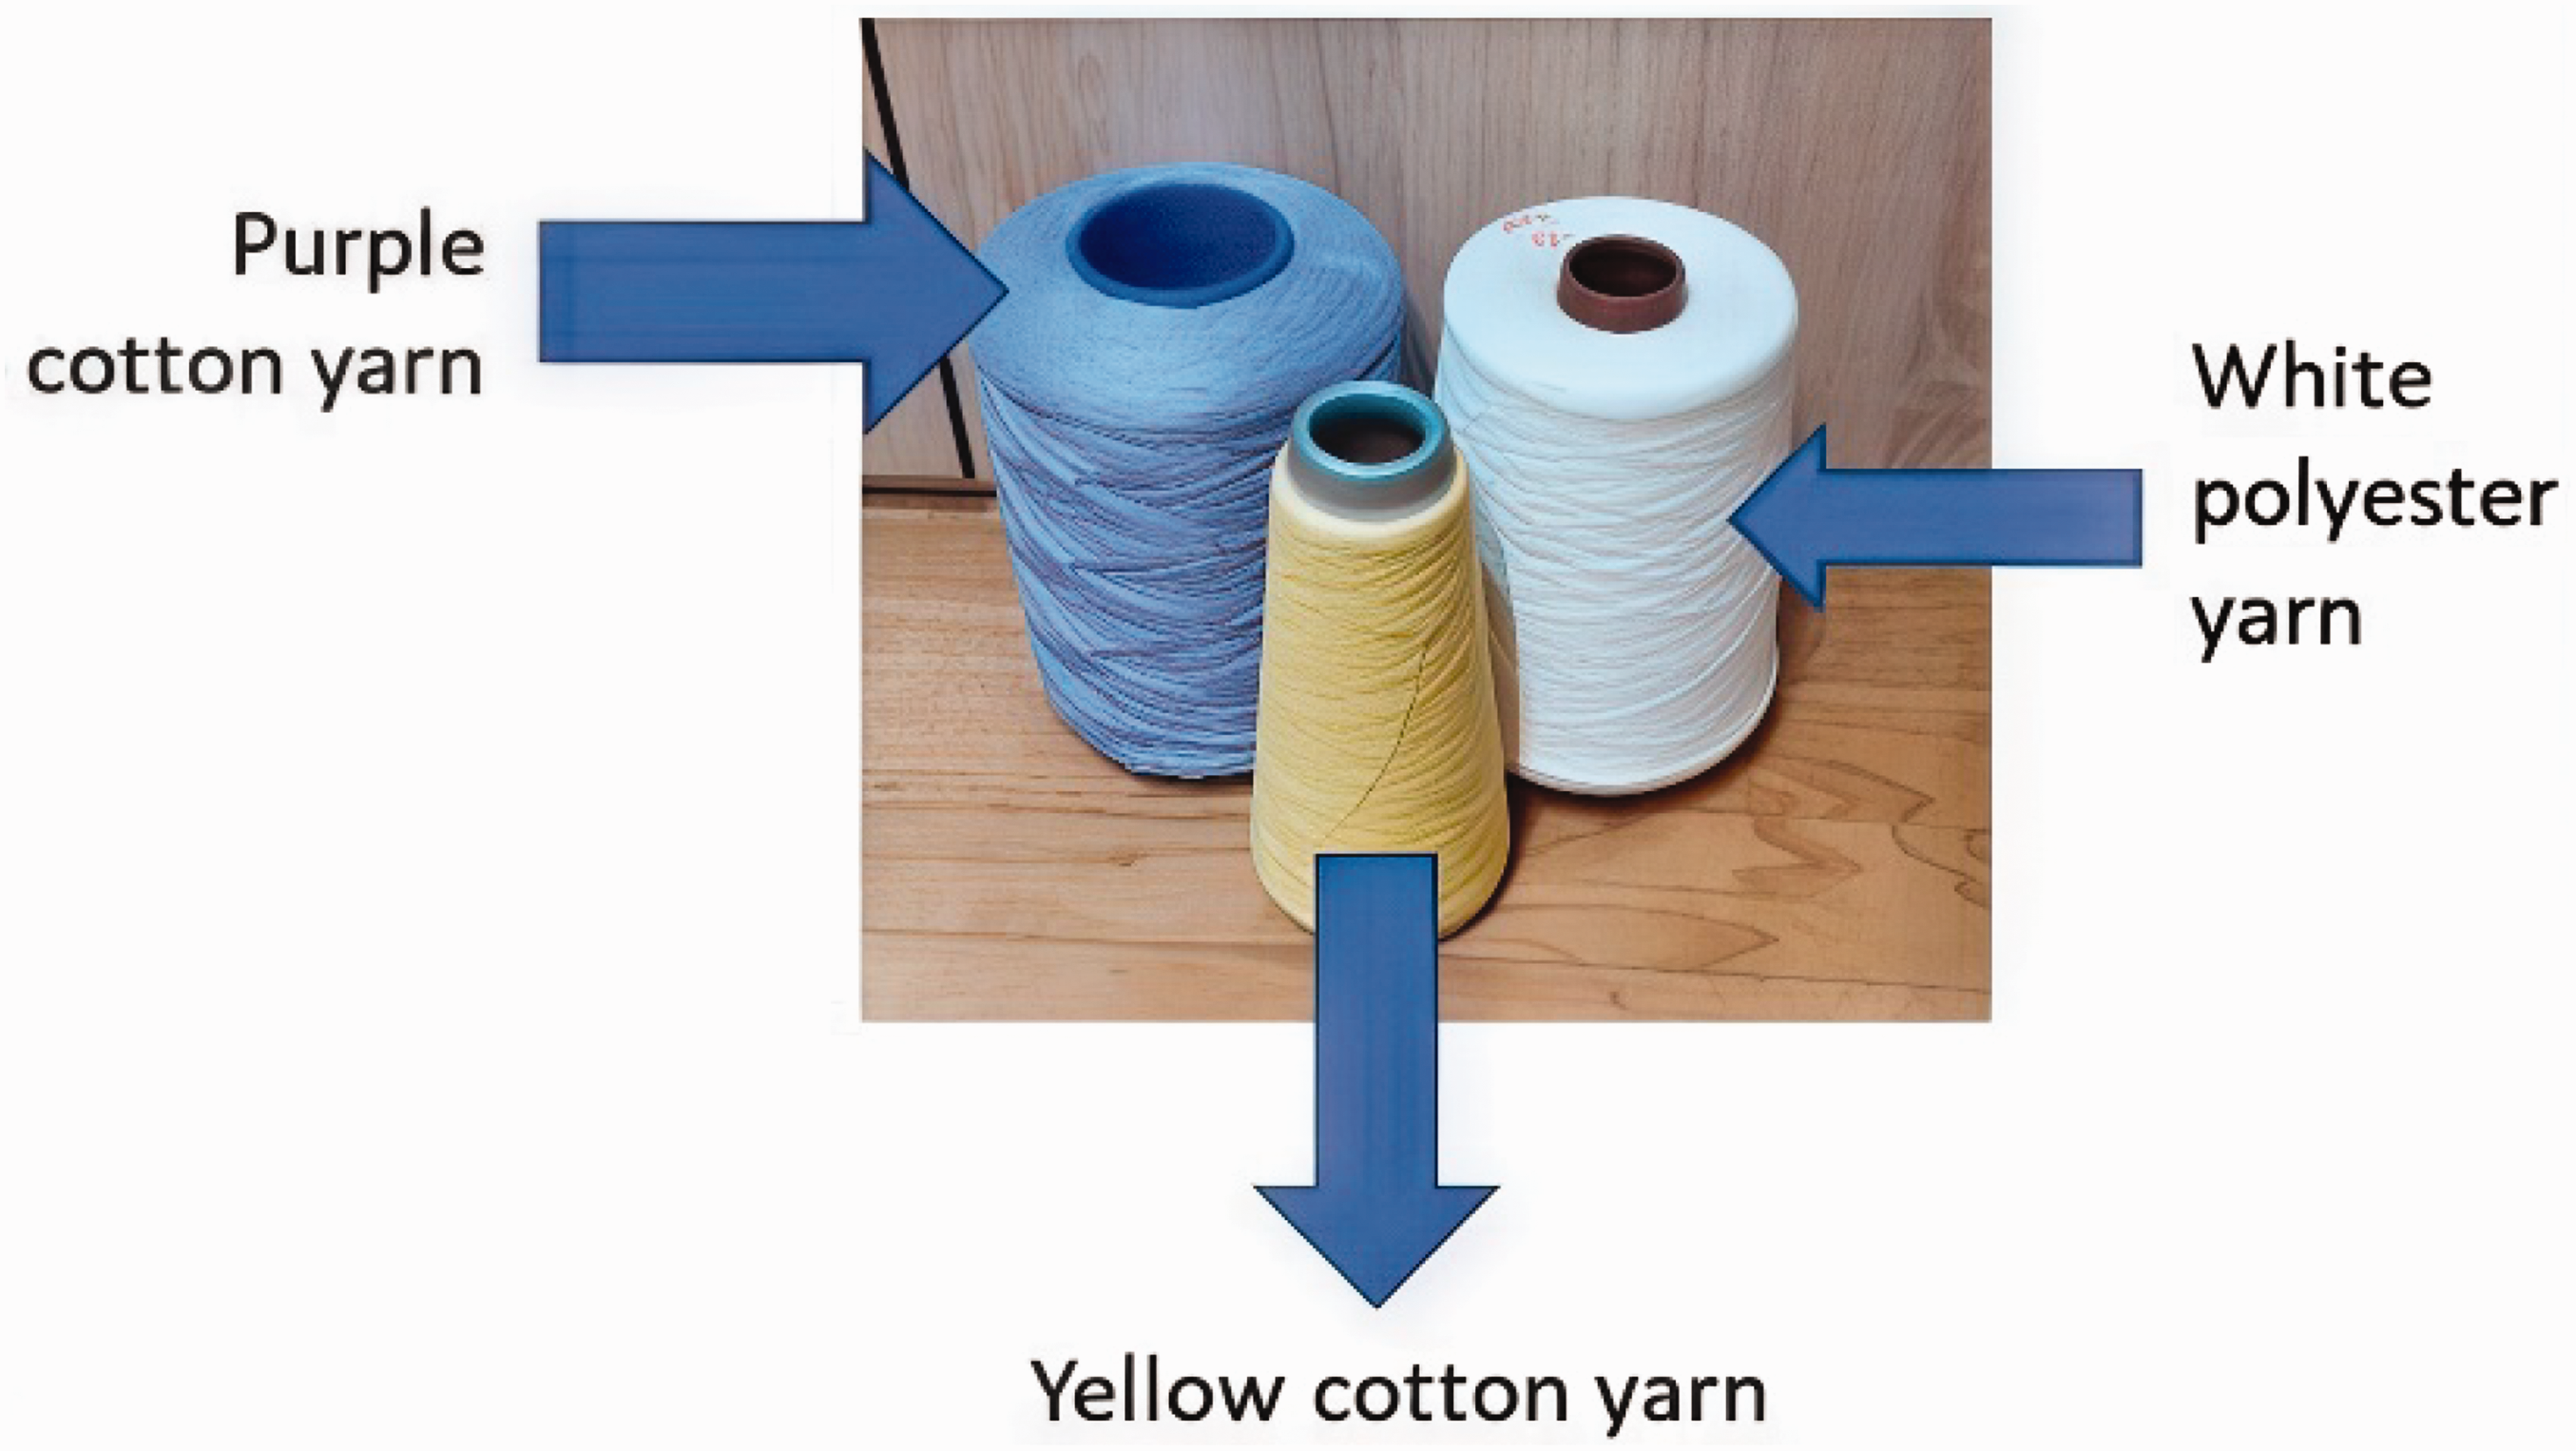
Three different yarn types tested.
The USTER TESTER 3, as the only tool available in the laboratory, served as a reliable instrument for comparison and validation of the final results, proving valuable for traditional yarn measurements despite its limitations. In contrast, the USTER TESTER 6 offers significantly enhanced capabilities, including the ability to measure finer defects such as neps, thin places, thick places, hairiness, yarn length, and fiber uniformity, along with greater precision in measuring diameter and linear mass. Furthermore, it introduces advanced parameters such as tension distribution, spinning quality, and fault length, making it better suited to meet the more demanding requirements of modern textile production. While the USTER TESTER 6 incorporates AI for fabric inspection, its primary focus lies outside yarn defect analysis. Despite the advancements of the USTER TESTER 6, the USTER TESTER 3 remains a robust and valuable tool for specific applications in yarn analysis.
To evaluate the performance of the developed algorithms under diverse conditions, three distinct yarn types were selected, considering variations in parameters such as diameter, linear mass, hairiness, number of cables, and material composition. This selection ensured that the image processing algorithms were tested across a broad spectrum of yarn characteristics, providing a robust assessment of their effectiveness.
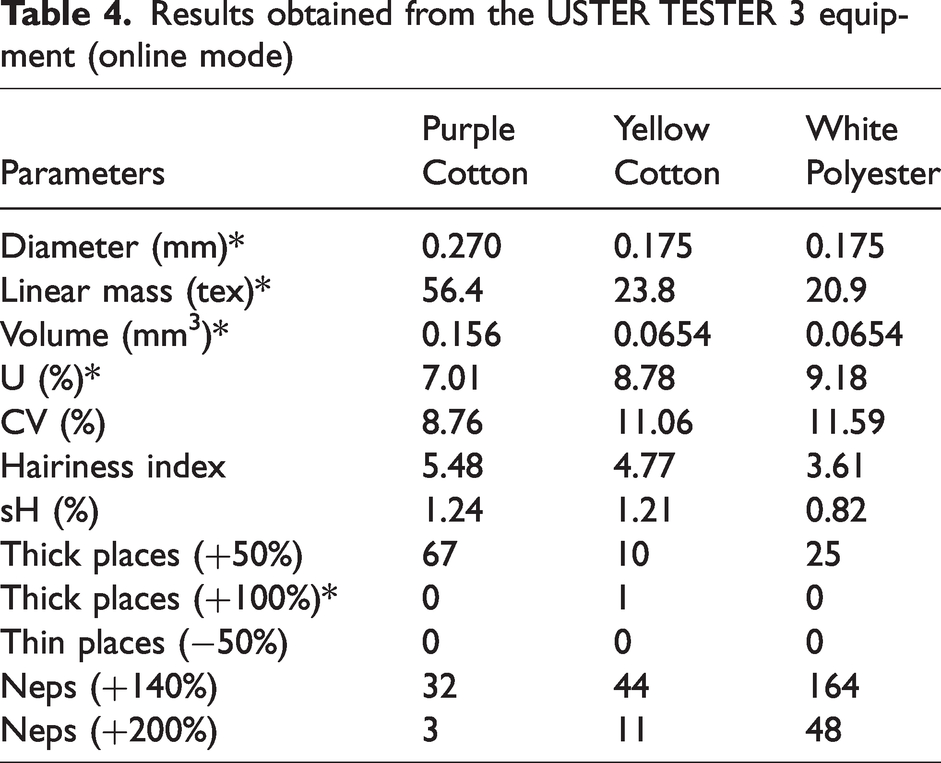
To establish a reference dataset for comparative analysis, 1-km tests were performed on all three yarn types using the USTER TESTER 3. The results from these tests served as a baseline for evaluating the system’s accuracy and sensitivity. Table 4 presents an illustrative set of results from these tests. While most parameters were directly measured by the USTER TESTER 3, some were inferred based on available measurements, as indicated by an asterisk (*). This approach enabled a comprehensive comparison between the proposed system and a widely accepted industry standard.
Results obtained from the USTER TESTER 3 equipment (online mode)
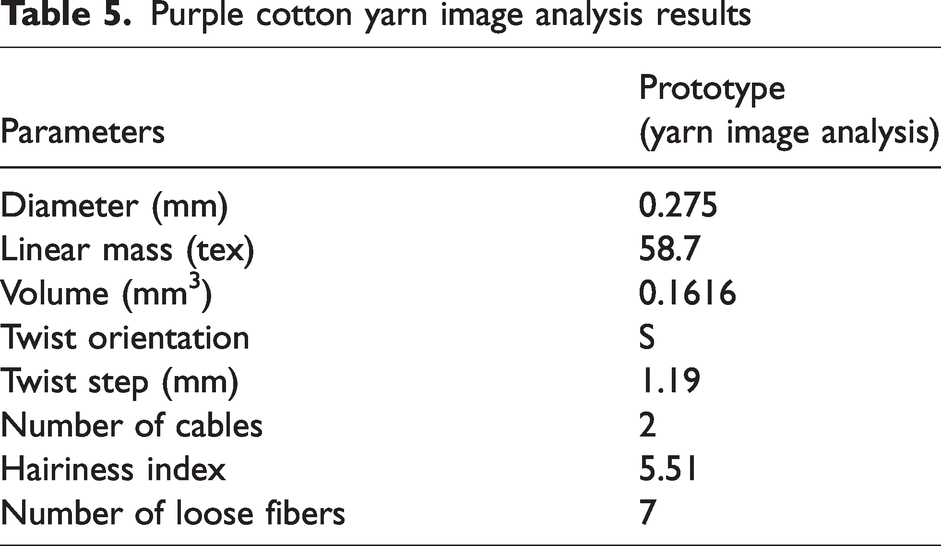
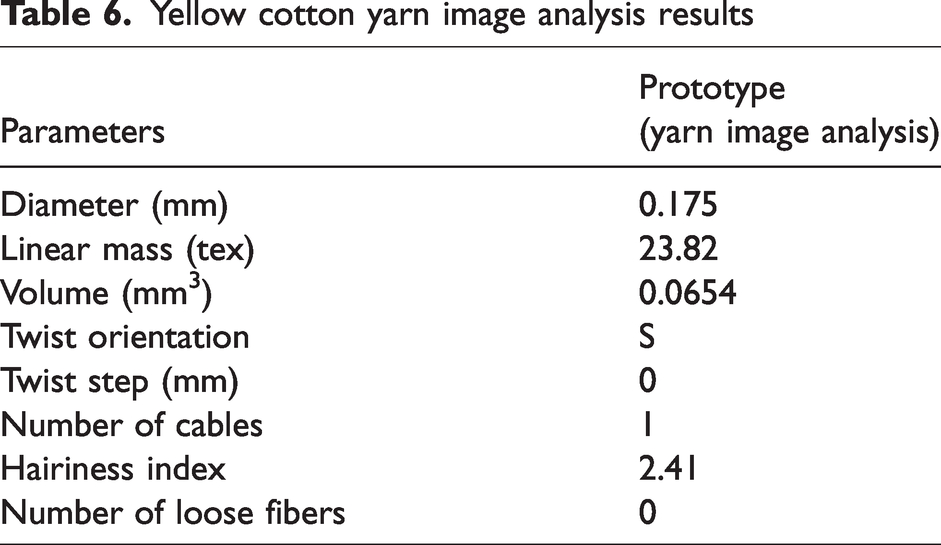
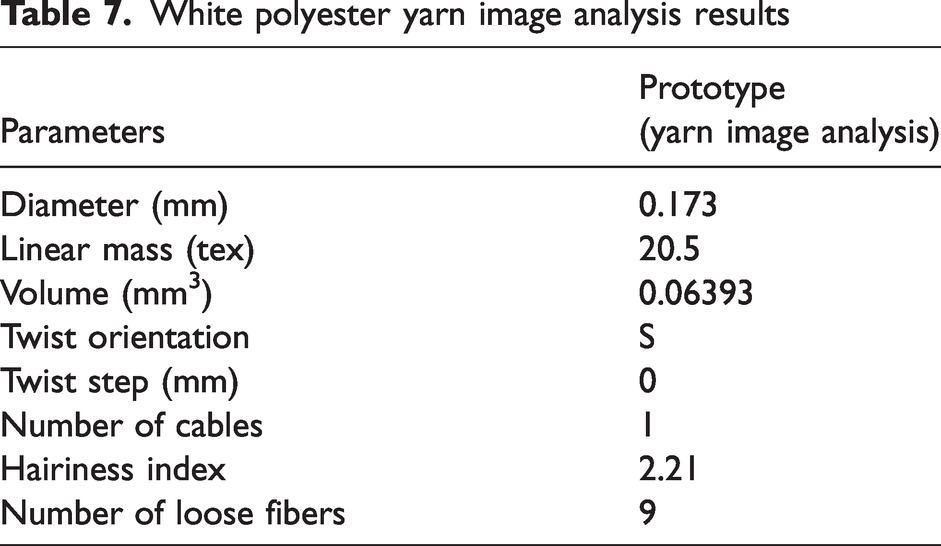
The following results are a product of the analyses conducted on images captured from the accessible yarn samples. These findings will be compared with the benchmark results derived from the USTER TESTER 3 for the purple cotton (Table 5), yellow cotton (Table 6), and white polyester (Table 7). The diameter, linear mass, and volume were measured on the USTER TESTER 3.
Purple cotton yarn image analysis results
Yellow cotton yarn image analysis results
White polyester yarn image analysis results
The prototype demonstrates high accuracy in measuring yarn parameters, closely aligning with the USTER TESTER 3 for diameter, linear mass, and volume, with minor deviations likely due to its higher resolution and smaller sample size. For example, the diameter of purple cotton measured 0.275 mm (prototype) versus 0.270 mm (USTER), while linear mass results for yellow cotton were identical at 23.8 tex.
The prototype also offers unique capabilities, including the measurement of twist orientation, twist step, number of cables, and loose fibers: parameters not assessed by the USTER TESTER 3.
The prototype captures high-resolution images of yarn at a microscopic level, enabling detailed analysis without requiring large yarn samples. This functionality allows the acquisition of isolated images with dimensions of 2.92 mm in a controlled offline mode. Unlike the USTER TESTER 3, which operates in an online mode and requires approximately 1 km of yarn to gather sufficient data, the prototype’s superior resolution eliminates the need for such extensive sample lengths.
In addition to enabling precise analysis through isolated images, the prototype offers the ability to measure a broader range of parameters that the USTER TESTER 3 is unable to determine. These include intricate characteristics such as twist orientation, twist step, number of cables, and number of loose fibers. These measurements are crucial for assessing yarn quality, providing essential insights into its structural properties and overall performance.
In the field of video analysis, a similarity was observed between the values obtained by the prototype and the USTER TESTER 3.
For this analysis, the system results were obtained from 1 km of purple cotton yarn, divided into 10 samples of 100 meters, all captured via video. This approach resulted in 1,000,000 samples, with each sample representing 1 mm in length. In contrast, USTER TESTER 3 uses 8 mm samples measured with capacitive sensors, leading to a total of 125,000 samples for 1 km of yarn.43,44
To verify the accuracy of the results obtained, a comparison was made against reference data derived from USTER TESTER 3. However, to facilitate this comparison, a quantitative method was required. For this purpose, the relative error was employed, as defined by
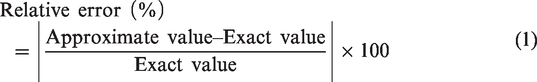
By applying Equation (1), it became possible to quantify and compare the precision of the results. Table 8 presents the findings related to the key yarn parameters, offering a direct comparison between the two systems, while also detailing the relative error, mean deviation, and median values for each parameter.
Results of the video analysis for 1 km of purple cotton
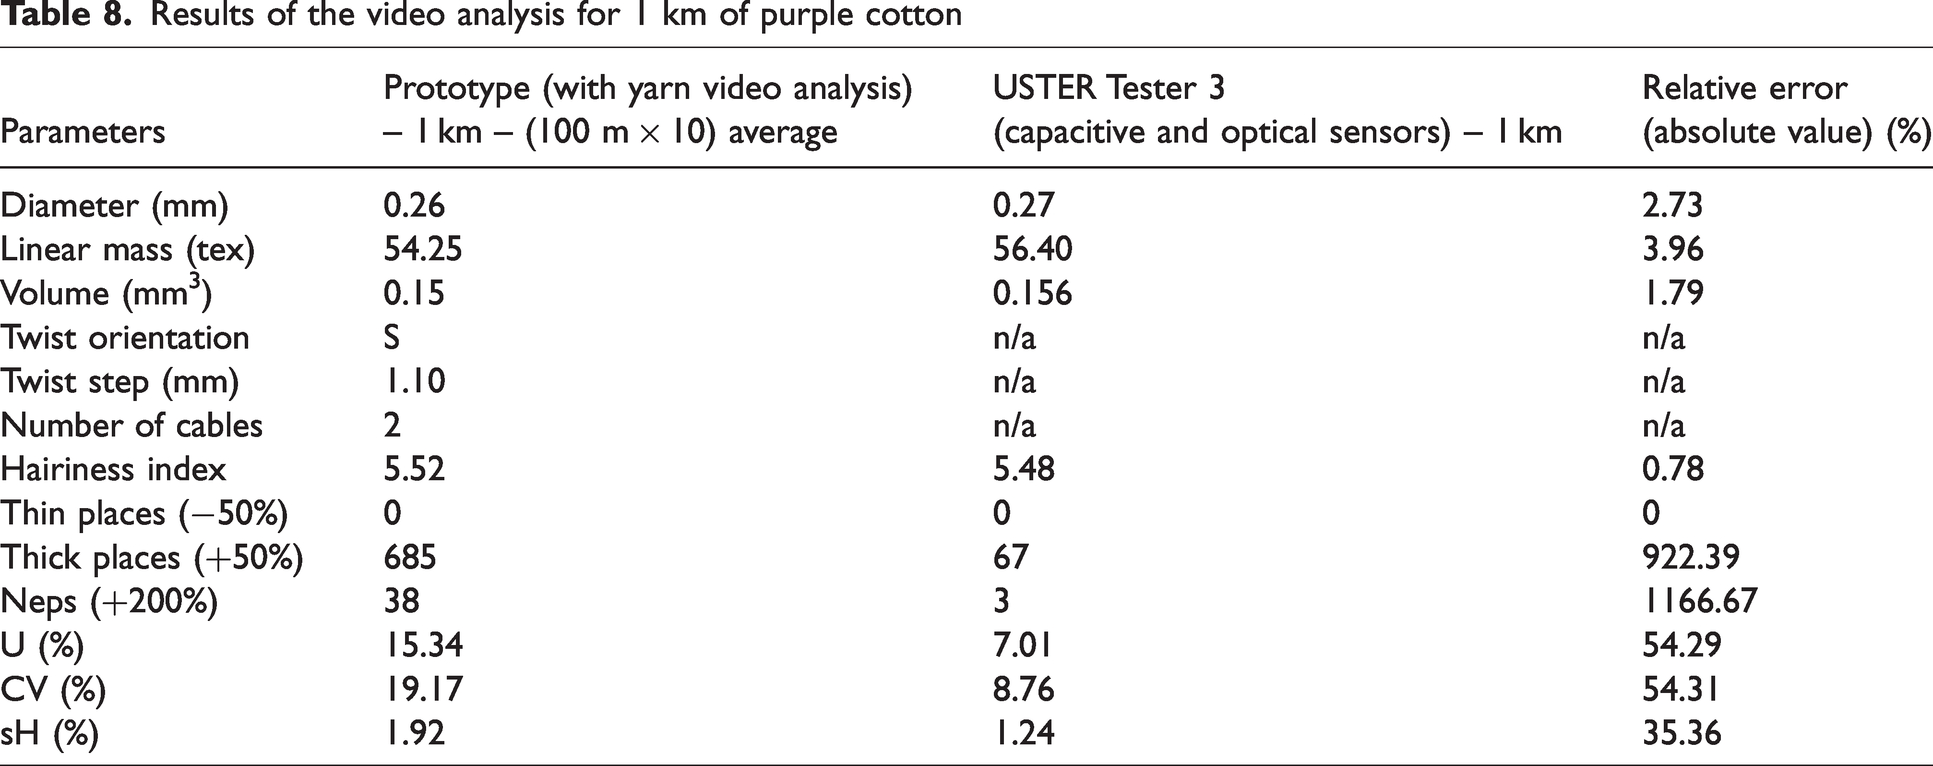
In Table 8, measurements for thin places (−50%), thick places (+50%), and neps (+200%) were taken over 1 km of yarn, using 10 samples of 100 meters each from video analysis and then scaled to 1 km.
The system allows the detection thresholds for defects such as thin places and thick places to be adjusted directly through a user interface, as shown in Figure 5. The threshold value is configured based on a sensitivity/tolerance parameter (%) that, in this case, refers to dimensional tolerance. This defines the point at which a section of yarn is identified as thick or thin. For example, selecting a tolerance of 25% means that sections with a diameter deviation of more than 25% above or below the average value will be classified as thick or thin zones, respectively. By default, neps are identified when exceeding 200% of the average value. This added functionality of the interface provides detailed customization for defect detection, offering greater flexibility in analyzing yarn defects with varying characteristics.
When comparing key yarn parameters such as diameter, linear mass, volume, and hairiness index, the relative error (considering absolute values) was below 4%. However, for statistical parameters such as U, CV, and sH, a higher variation (over 36%) was observed. This is due to the higher resolution of the prototype’s image analysis system compared with the USTER TESTER 3.
The 1 mm resolution of the prototype (compared with the 8 mm resolution of the USTER TESTER 3) allows it to detect smaller irregularities, explaining the higher values in U, CV, and sH. The following is a summary of the findings.
The USTER TESTER 3 was used as a reference for validating the results due to its established reliability in yarn quality analysis.
The differences in statistical parameters (U (%), CV (%), sH (%)) between the prototype and the USTER TESTER 3 device result from several factors.
A potential enhancement to the prototype includes incorporating a method for detecting the extension of defects. This involves registering the index of the initial and final sample of each detected defect, independently of frame boundaries. The difference between these indices corresponds to the defect’s length in millimeters. This approach, tested successfully in prior research, would enable the prototype to capture defects spanning multiple frames, further aligning it with industry standards such as ISO 16549.
Mass results from spectrum analysis
Spectral analysis examines the frequency spectrum of data collected at regular intervals to identify periodic irregularities in the yarn, which show up as energy spikes at specific frequencies. These spikes are detected by creating a spectrogram that displays the wave energy variations across different yarn periodicities. The analysis uses a Fourier transform to convert the signal into the frequency domain, highlighting its frequency components. In this work, we used the fast Fourier transform (FFT) for its efficiency in gathering harmonic information within a focused spectrum where the data are concentrated. We then applied the following equation to compute the energy bands per decade
27
:
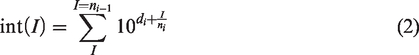
This equation uses a base-10 logarithm to calculate the X-axis coordinates of the X axis (int(I)), which divide the intervals equally over a decade. The wavelengths detected within each energy band are summed and multiplied by the number of intervals, resulting in the final energy band value
27
:
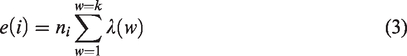
Using the method outlined in Equations (2) and (3), 27 the spectrogram presented in Figure 14 was obtained. This spectrogram is based on a test performed on 100 meters of purple cotton yarn, consisting of 100,000 samples, with an average linear mass of 54.37 tex.
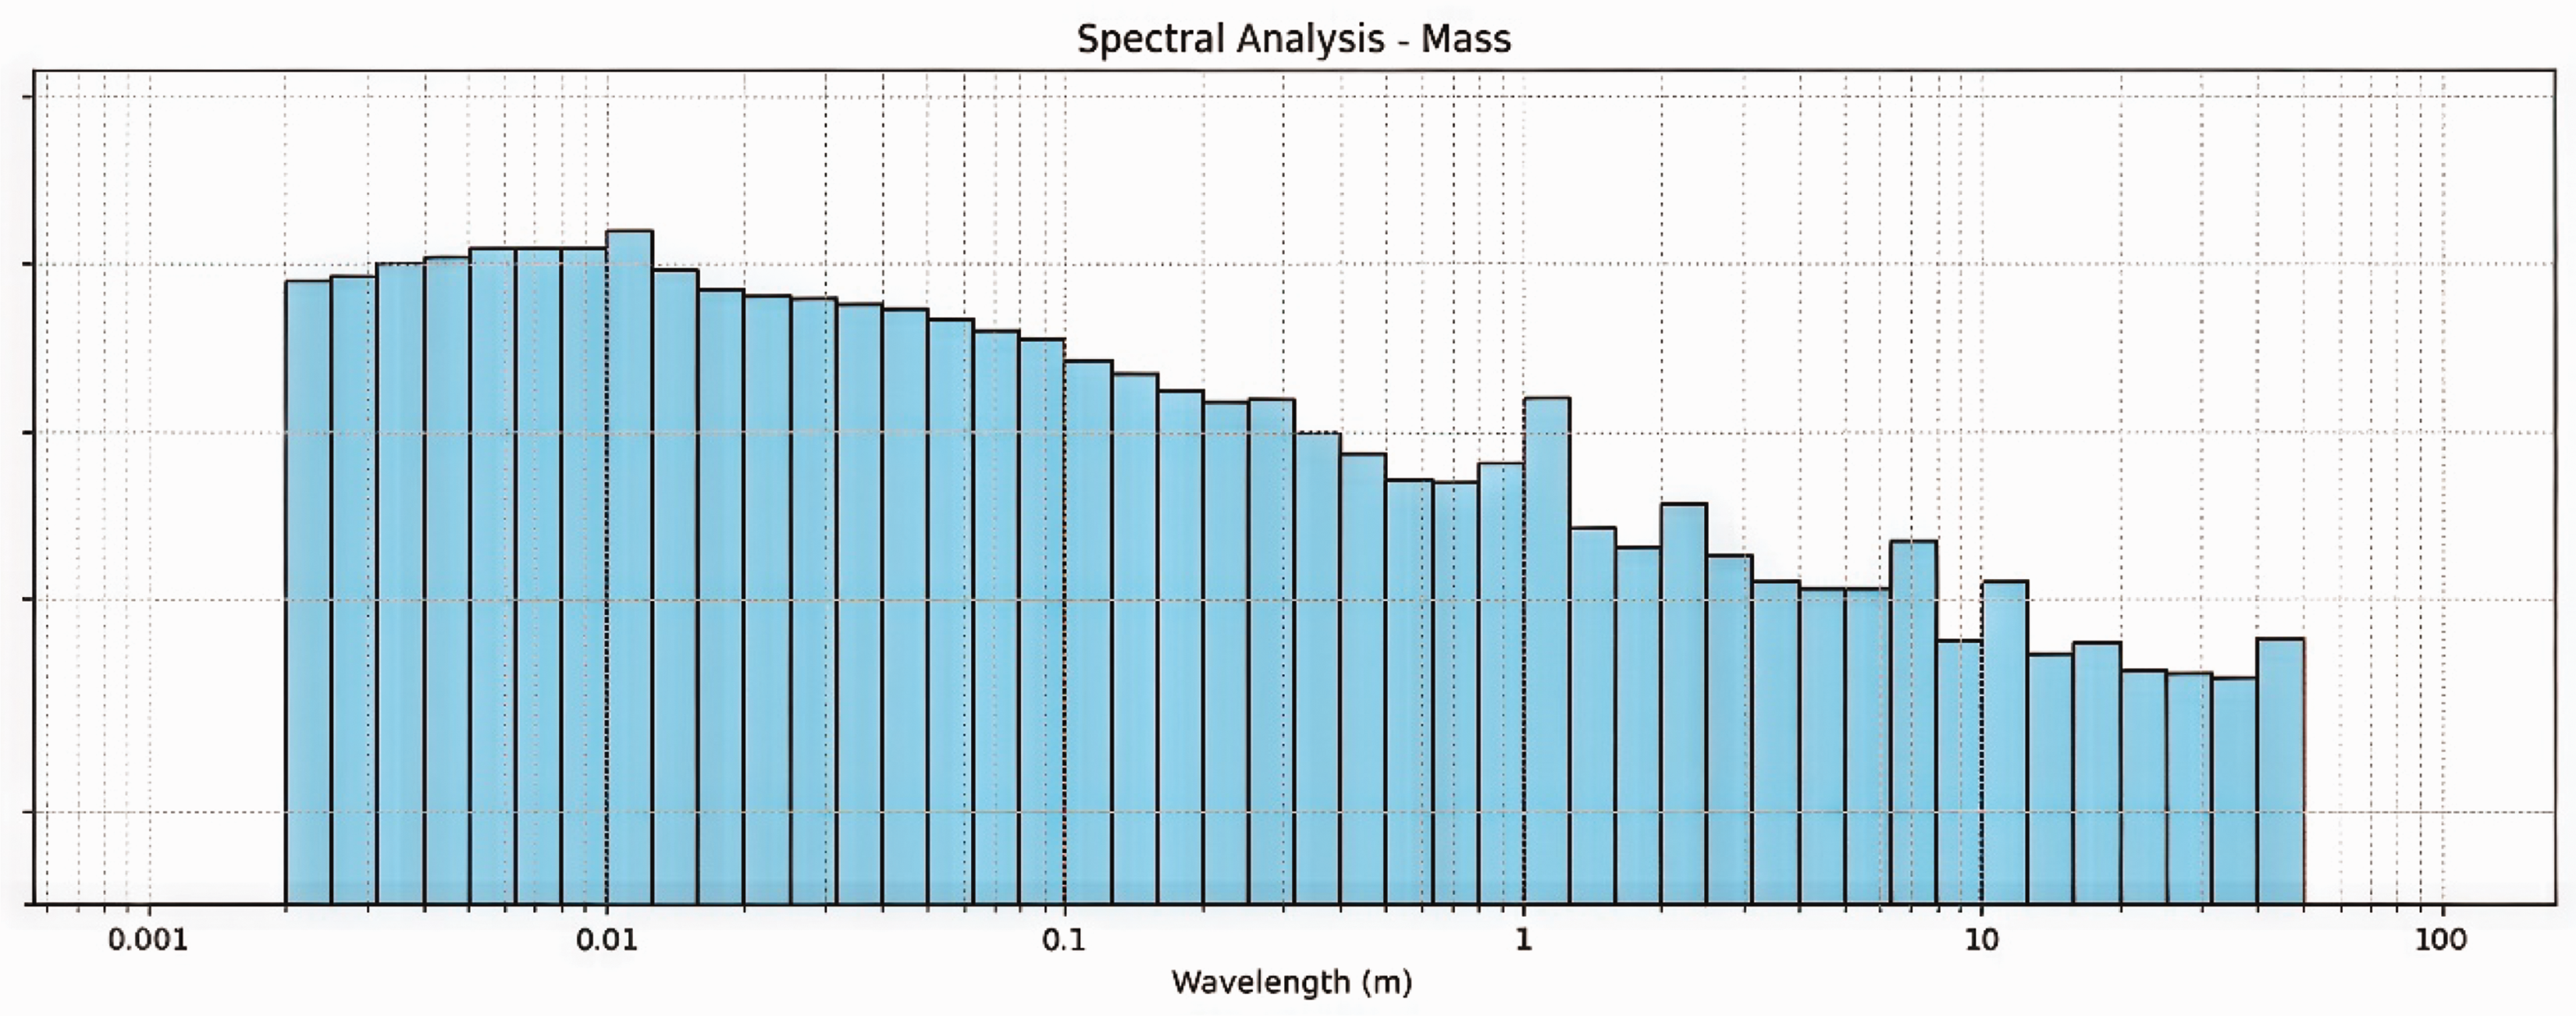
Mass spectrogram obtained by the prototype.
These results can be compared with the data collected from the USTER TESTER 3 device, as shown in Figure 15.
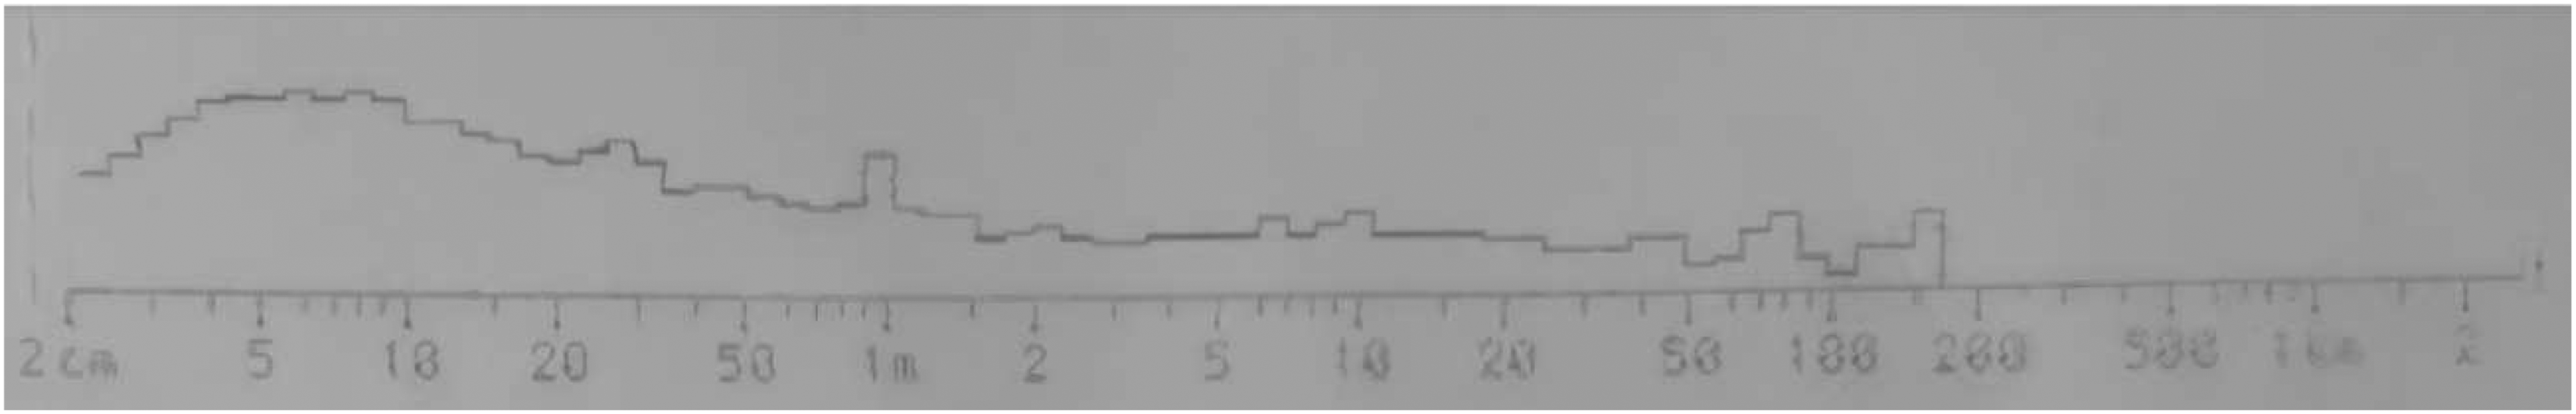
Mass spectrogram obtained by the USTER TESTER 3.
The initial observation when comparing Figures 16 and 17 is that both spectrograms reveal five distinct peaks within the 1-meter, 6-meter, 10-meter, and 40-meter ranges, indicating a consistent periodicity. However, the prototype detected additional peaks in the 1-cm range and exhibited higher amplitude at the 2-meter range. These variations suggest that the prototype may have enhanced sensitivity in identifying more periodic errors across different wavelengths. Despite these differences, both systems confirm their capability to detect periodic errors in yarn mass. Furthermore, these results highlight that the image processing algorithms developed are effective in identifying periodic errors in yarn mass.
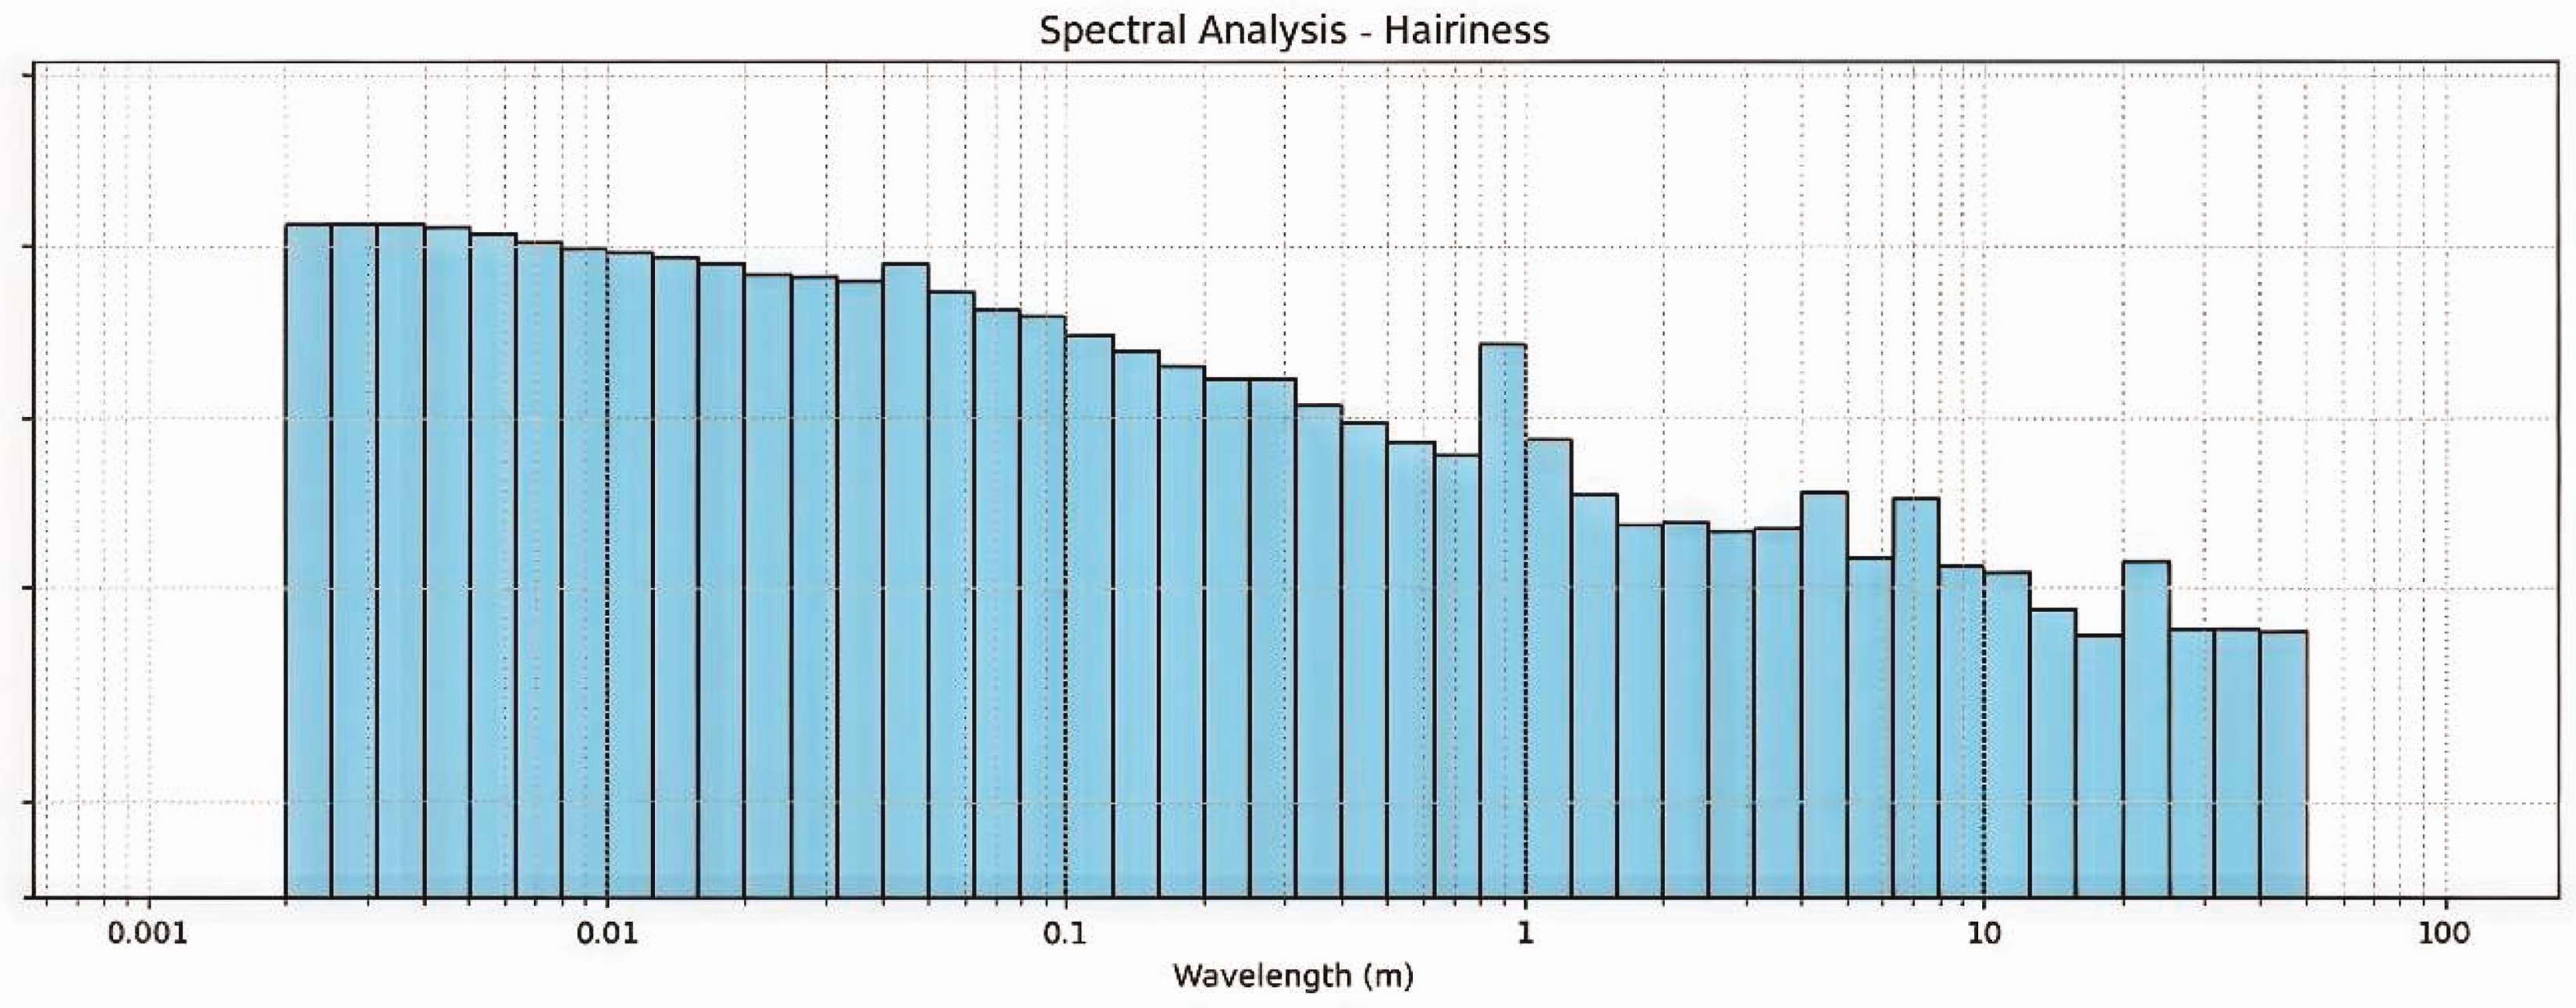
Hairiness spectrogram obtained by the prototype.
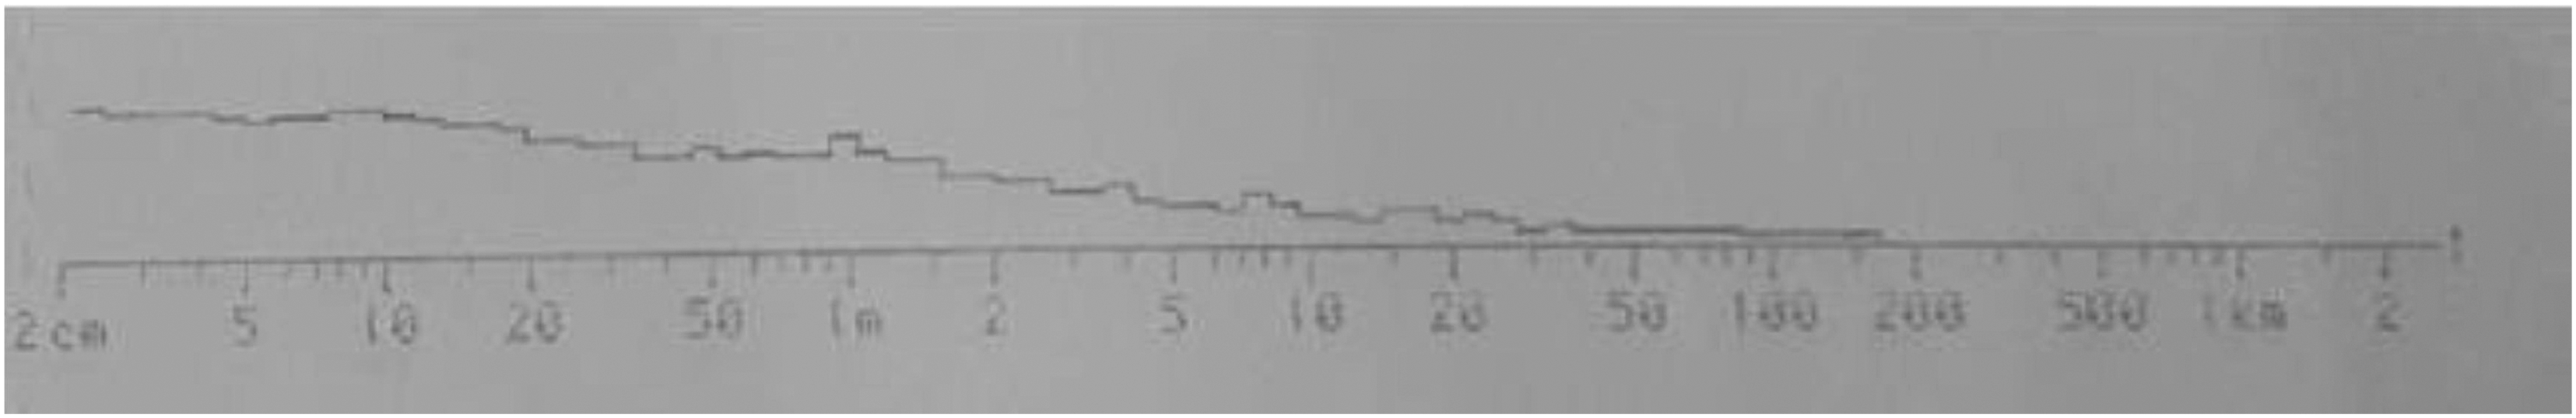
Hairiness spectrogram obtained by USTER TESTER 3.
Hairiness results from spectrum analysis
Using the method described in Equations (2) and (3), the spectrogram presented in Figure 15 was obtained. This spectrogram is based on a test performed on 100 meters of purple cotton yarn, consisting of 100,000 samples, with an average linear mass of 54.37 tex.
An initial comparison of Figures 16 and 17 shows that both spectrograms exhibit three significant peaks at the 1-meter, 4-meter, and 8-meter ranges, indicating consistent periodicity. However, there are notable differences detected by each system. The prototype identified additional peaks in the 4-cm and 20-meter ranges. These discrepancies and variations may suggest that the prototype has a higher sensitivity in detecting periodic errors across different wavelengths. Despite these differences, both systems effectively identify periodic patterns in yarn hairiness.
Performance values for the optimized YOLOv5s6-Hairiness algorithm
The optimized YOLOv5s6-Hairiness model 38 demonstrated improvements in performance metrics, achieving notable gains in mAP (mean average precision) and other detection accuracy metrics compared with the original YOLOv5s6 model. These advances establish the system as an efficient tool for evaluating yarn quality in real time, particularly highlighting hairiness detection. These outcomes are summarized in Table 9, which highlights the improvements in key metrics using the improved YOLOv5s6-Hairiness algorithm.
Metrics evaluating yarn hairiness detection with AUG (augmentation), comparing the default YOLOv5s6 algorithm and the improved YOLOv5s6-Hairiness algorithm38
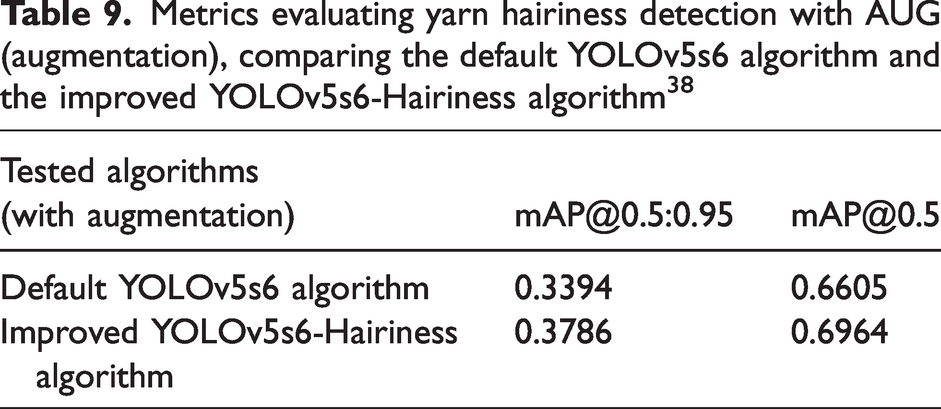
The improved model allowed us to obtain a 5–6% increase in mAP@0.5 and an 11–12% increase in mAP@0.5:0.95 compared with the standard YOLOv5s6. Other metrics also improved, with a 3.71% increase in F1-Score, a 7.36% increase in Recall, a 0.39% gain in Precision, and a 1.11% increase in Accuracy.
To evaluate the effectiveness of the proposed model, ablation experiments were conducted to analyze the individual impact of each module (Bot-Transformer and C2f). The enhanced model achieved the following results compared to the baseline YOLOv5s6.
Key metrics
The following metrics were used to evaluate the enhanced model’s performance.
Table 10 highlights the results of the first implemented improvements in YOLOv5s6-Hairiness, incorporating the C2f and Bot-Transformer modules. Improvements are indicated in bold.
Metrics evaluating the results of the incorporation the C2f and Bot-Transformer modules into the improved YOLOv5s6-Hairiness algorithm38
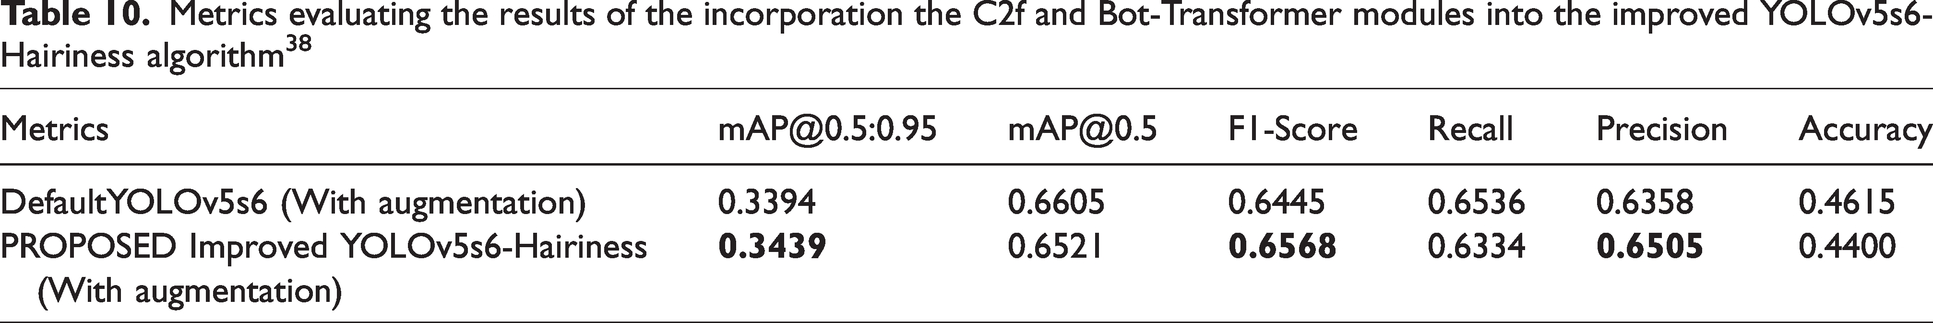
The incorporation of these two modules facilitated the algorithm’s ability to detect overlapping objects more effectively and enabled the combination of information at varying resolution levels. As a consequence, this led to an enhancement in performance:
an improvement of 1.3% in a boost of 1.9% in F1-Score; an increase of 2.3% in Precision compared to the Default YOLOv5s6.
Table 11 presents a comparison of the performance metrics of the enhanced YOLOv5s6-Hairiness model with other models that use data augmentation. 38
Performance metrics comparison of the created YOLOv5s6-Hairiness model with other models using data augmentation38
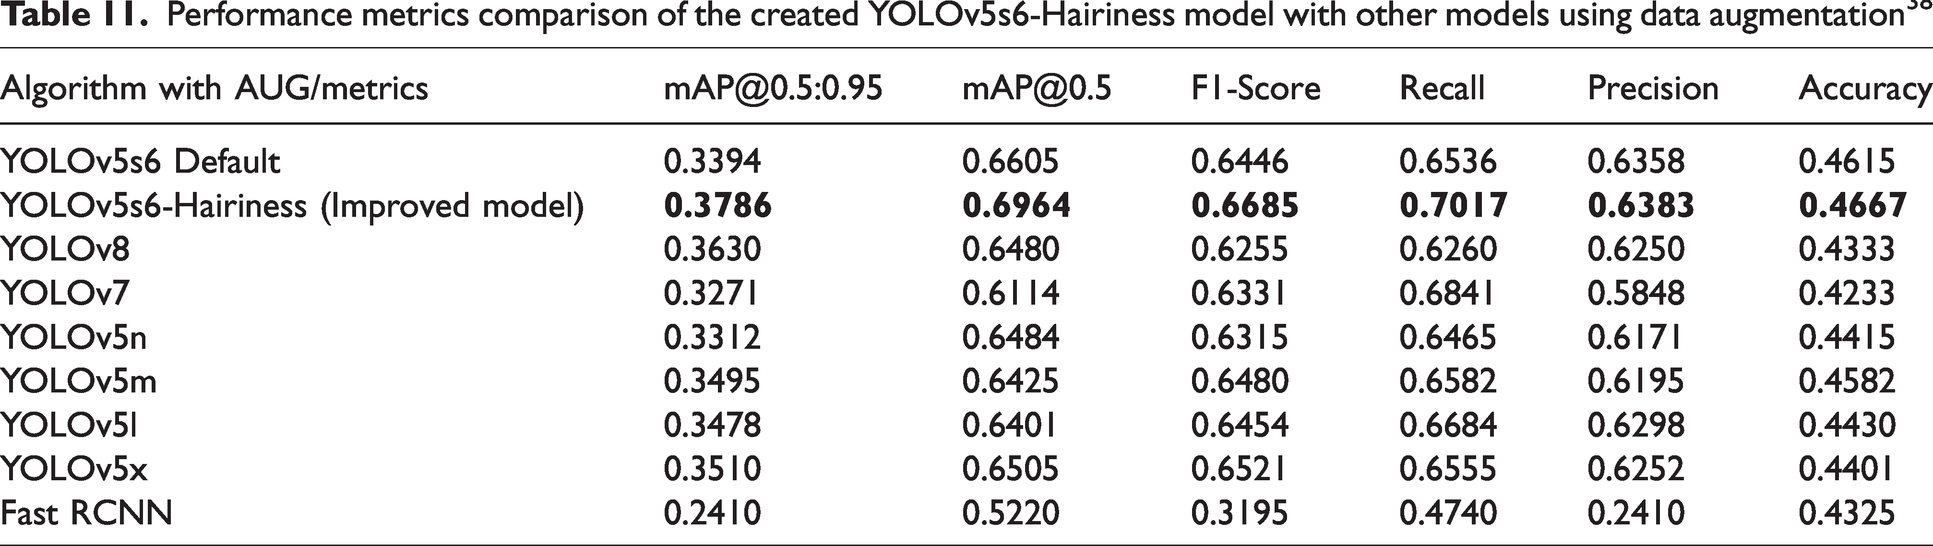
The values presented in Table 11 clearly demonstrate that the accuracy of the YOLOv5s6-Hairiness model is higher compared with other models. The improved YOLOv5s6-Hairiness model with augmentation (AUG) achieved the best results in
Table 12 summarizes the computational metrics of the proposed YOLOv5s6-Hairiness model compared to various DL algorithms, including other YOLO versions and Fast R-CNN. The metrics evaluated include inference time, FPS, model size, and hardware utilization. These results highlight the balance achieved by the proposed model between performance and efficiency, particularly in real-time applications and resource-constrained environments.
Computational metrics comparation of the created YOLOv5s6-Hairiness model with other models using data augmentation38
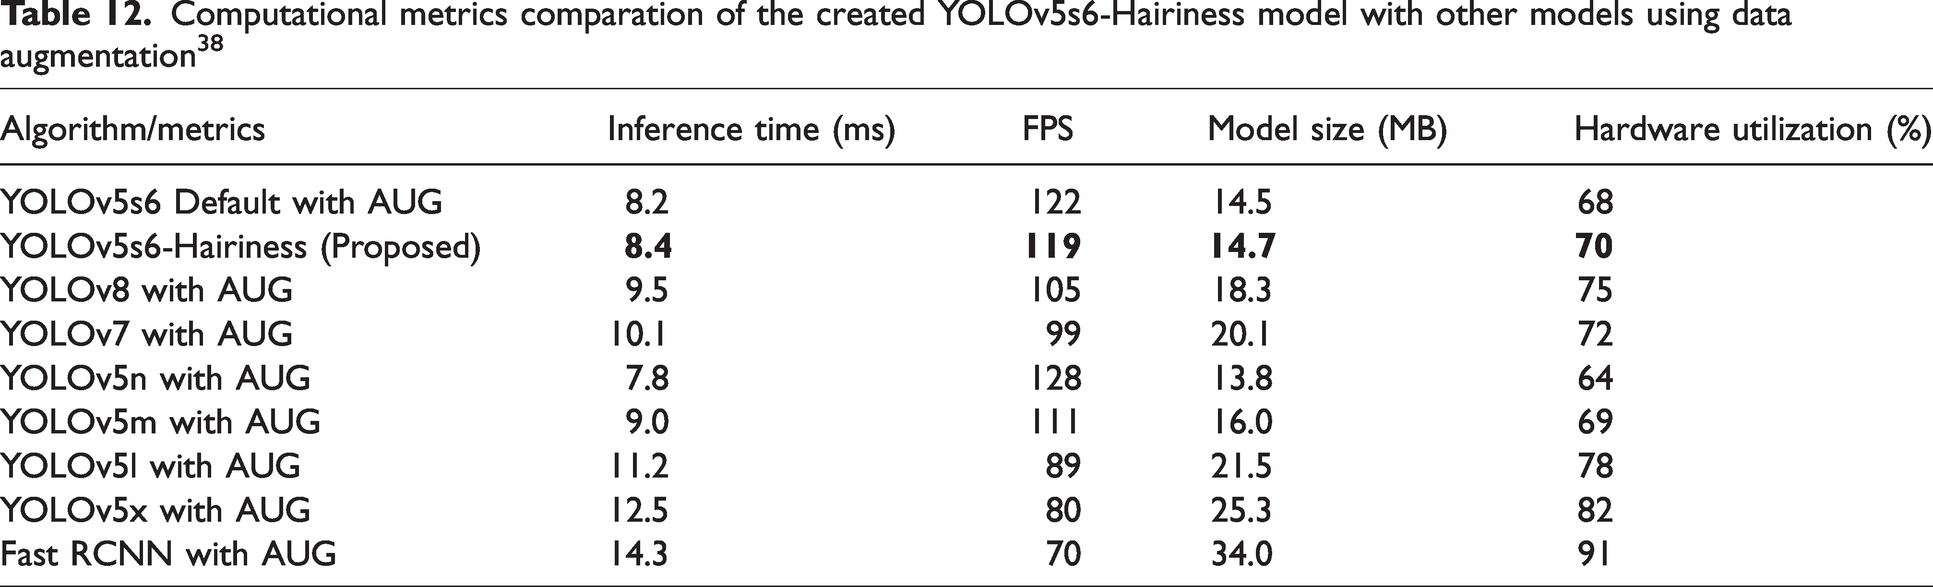
The YOLOv5s6-Hairiness model offers the best combination of speed, efficiency, and task-specific performance, making it the better choice in yarn analysis compared to other tested models.
At the level of computational resources, the YOLOv5s6-Hairiness model was designed to be computationally efficient in terms of processing time and memory usage. However, the integration of the Bot-Transformer and C2f (Coarse-to-Fine) modules slightly increases computational complexity compared with the original YOLOv5s6.
To ensure proper execution of the model, resource evaluations were conducted using a high-performance GPU (such as the NVIDIA Tesla V100 or a similar GPU), capable of handling the additional workload introduced by the advanced modules and the larger dataset. While the model demands more resources due to these enhancements, it remains efficiently executable on systems with robust graphical processing capabilities. This balance between improved accuracy and computational efficiency makes the YOLOv5s6-Hairiness model well-suited for industrial applications requiring precise real-time defect detection.
To evaluate and verify the improved model, a set of images from the test dataset was analyzed. Figure 18 illustrates the detection results generated by the optimized YOLOv5s6-Hairiness algorithm compared with the standard YOLOv5s6 algorithm, with a confidence threshold value set at 0.5.
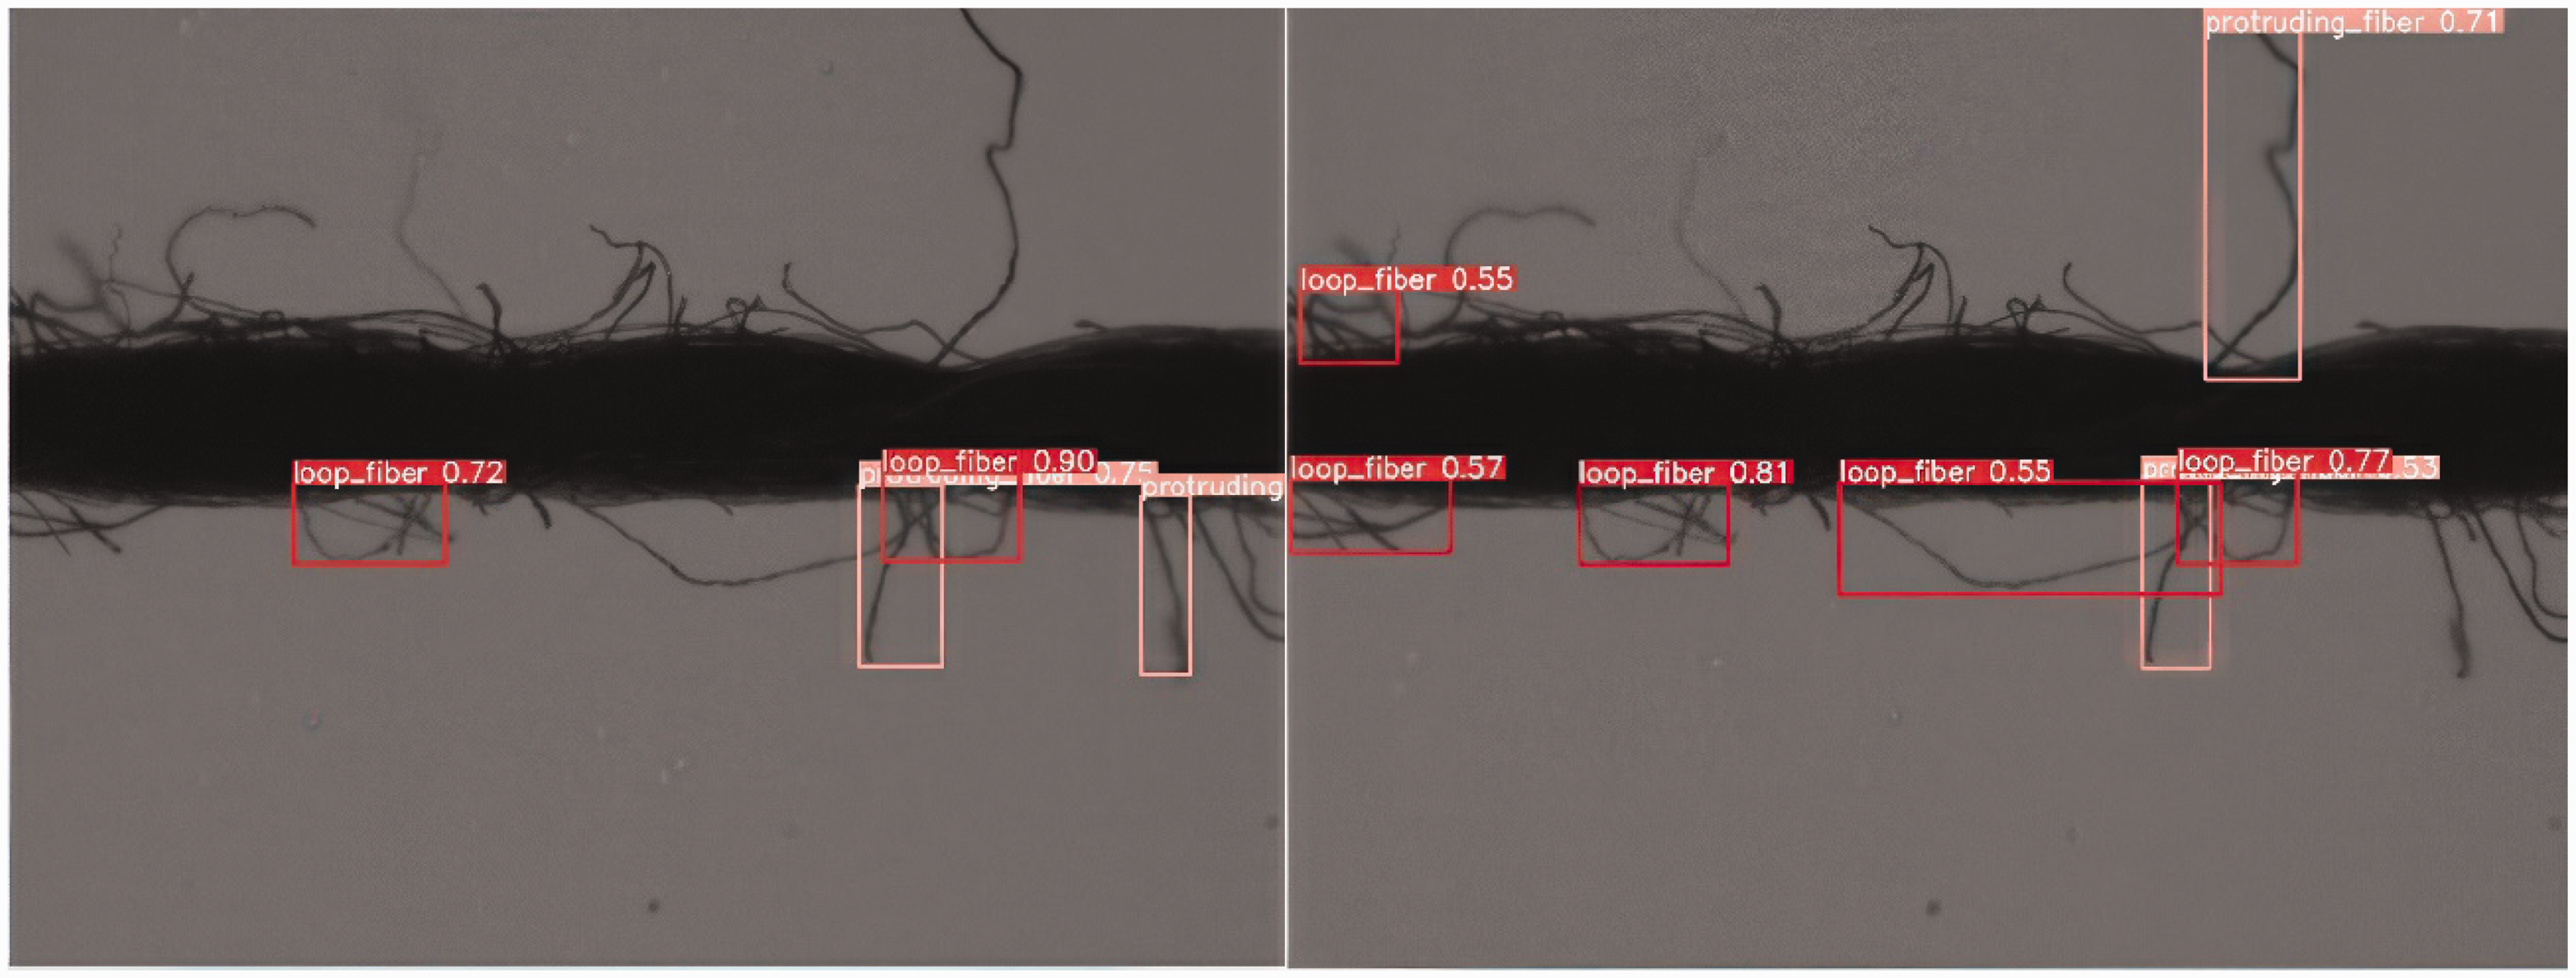
Test results comparing the optimized YOLOv5s6-Hairiness model (right-hand side) with the standard YOLOv5s6 model (left-hand side) at a confidence threshold of 0.5, applied to cotton yarn with an average linear mass of 56.4 tex and magnified 20×. 38
Conclusion and future work
This paper presented an innovative mechatronic prototype using computer vision and DL for yarn analysis aimed to surpass the constraints presented in commercial systems.
The results obtained with the proposed system, regarding the use of DL with the YOLOv5s6-Hairiness algorithm allow us to conclude that a substantial advance was made in relation to conventional methods of yarn analysis, compared with USTER TESTER 3.
The performance metrics indicators evaluated and analyzed in the improved YOLOv5s6-Hairiness algorithm include Accuracy, Precision, Recall, F1-Score, mAP0.5:0.95, and mAP0.5. The experimental results demonstrate substantial improvements, with the proposed algorithm increasing the mAP0.5:0.95 by 11.55%, mAP0.5 by 5.43%, F1-Score by 3.71%, Recall by 7.36%, Precision by 0.39%, and Accuracy by 1.11% compared with the standard YOLOv5s6 model.
Furthermore, the comparative analysis with the USTER TESTER 3 in terms of diameter, linear mass, volume, and hairiness index showed that the relative error (considering absolute values) was less than 4%, demonstrating that the proposed prototype has a lower error and is comparable with industrial equipment. However, statistical parameters such as U (%), CV (%), and sH (%) showed a variation greater than 36% in relative error (considering absolute values), which can be attributed to the higher resolution of the proposed system, sensing technologies, sampling length, and algorithmic differences compared with the USTER TESTER 3.
While the implemented system is optimized for detecting defects within specific ranges, such as thin places (–40%, –50%), thick places (+35%, +50%), and Neps (+140%, +200%), there is room for further enhancements. Future research could explore extending the algorithm to support additional thresholds, such as –30% for thin places, +60% for thick places, or +100% for Neps. In addition, adapting the system to detect a wider range of defects by refining the image processing code and parameter settings for different yarn types and industrial scenarios would be valuable. These improvements could enhance the system’s flexibility and applicability across diverse production environments.
Regarding data augmentation and comparative model evaluations, the experimental setup included:
training and inference conducted in Google Colab using a CUDA-enabled GPU, ensuring efficient processing; evaluation of YOLOv5s6-Hairiness against other DL models, such as YOLOv8, YOLOv5n, YOLOv5m, and Faster-RCNN, with performance metrics demonstrating superior accuracy and real-time efficiency; performance comparison in real-world conditions, where the prototype was tested with 1 km of yarn divided into 10 samples of 100 meters, generating 1,000,000 samples data per test; an inference time of 8.4 ms per frame, achieving a real-time processing rate of 119 FPS while maintaining a balance between speed and accuracy.
The system developed is also capable of performing a detailed spectral analysis, allowing the detection of periodic irregularities in the yarn. When compared with the USTER TESTER 3, the prototype identified additional peaks in the spectral analysis, highlighting its higher sensitivity to variations and defects in the yarn. In addition to the good results presented and the innovation it offers, the developed system presents the following competitive advantages for its future integration in the textile industry.
These advantages make the system not only innovative, but also competitive with existing systems. This has several advantages for the textile industry, which makes it a significant added value.
Looking ahead to future developments in this work, the following actions can be considered in further research.
In summary, this work has presented an innovative system for analyzing yarns that brings several advantages to the textile industry. It uses DL, computer vision, and image processing algorithms, which demonstrates its innovation and reliability in detecting yarn defects. In addition to being more accessible and efficient, the system is adaptable to different types of yarns, which can bring significant improvements in quality control and efficiency in the textile industry.
Footnotes
Declaration of conflicting interests
The author(s) declared no potential conflicts of interest with respect to the research, authorship, and/or publication of this article.
Funding
The author(s) received no financial support for the research, authorship, and/or publication of this article.