
Abstract
Analysis of the basis weight for random fibrous networks is important to understand their microstructure, properties and performance. Two-dimensional microscopical images show in-plane fibers without giving any information on their distribution in three dimensions. This research introduces a fully parametric algorithm for computing the local basis weight of random fibrous networks using three-dimensional images because out-of-plane fiber orientation is important, especially for high-density or thick networks. Voxel models of real nonwoven webs were generated by an X-ray micro-computed tomography system. The developed algorithm could accurately estimate a local basis weight value for random fibrous networks produced with various manufacturing parameters. Numerical results computed with the developed method were compared with those obtained with a physical weight measurement technique. The algorithm was tested and validated for various nonwoven fabrics with different densities. It was observed that the developed method can be used to examine and/or compare the basis weight of a wide range of random fibrous networks. In addition, it can be used to predict the basis weight for fabrics, especially in a new product development process.
Fibrous structures are available in both natural and artificial forms. Fibrous systems, such as cornea, tendons, ligaments, cardiac tissues, collagen and skin are natural biological systems. Wood is another natural fibrous material formed with cellulose fibers. 1 It is important to analyze such fibrous structures at micro-scale to evaluate the properties of a fibrous network. 2 Recent developments in microscopy allowed the acquisition of high-resolution images of complex fibrous structures. Before this, scanning electron microscopy (SEM) did not allow this, while optical microscopy provided only two-dimensional (2D) images, preventing the assessment of the exact number of fiber segments, especially for high-density fibrous networks. In contrast, a high-resolution X-ray micro-computed tomography (µCT) system was used to detect fibers precisely and accurately in three-dimensional (3D) space at micron level.3,4 In addition, image-processing algorithms were used to characterize many different aspects of random fibrous networks (RFNs). For instance, fused images obtained with digital optical microscopy were used to measure the fiber diameter, porosity and orientation distribution function of nonwovens. 5 A new software based on image-processing techniques was employed to generate a computerized average fiber diameter from SEM images, and that technique was flexible even for varying fiber diameters and low-contrast images. 6 A computer-based image-processing tool was developed for a semiquantitative determination procedure for dye analysis using woven and nonwoven fabrics. 7
Structural measurements of nonwovens can be categorized using such characteristics of fabric as their average thickness, uniformity, porosity, fabric weight per unit area (basis weight), density, pore size distribution, orientation distribution function of fibers and fiber-bond distribution. Among those characteristics of nonwoven fabrics, the basis weight is one of the major measuring techniques of nonwoven fabrics, especially in industry, and is defined as ‘mass per unit area of the fabric’. 8 Normally, it is measured in grams per square meter (gsm). Therefore, in this study, a new algorithm is introduced to estimate the fabric density of RFNs such as nonwovens. Also, the developed algorithm can be extended to measure the uniformity of the basis weight of a fabric, which will be discussed elsewhere.
Woven fabrics have a clear repeatability of their microstructure based on their manufacturing technology. In contrast, nonwovens lack this feature. They are formed by the deposition of produced fibers on a conveyor belt and bonding them together in a network, with various technologies, such as thermal calendering (TC) and through-air bonding (TAB), etc. As a result, nonwovens have a unique type of microstructure due to randomly distributed fibers. There are many parameters which affect the uniformity of the basis weight of a nonwoven fabric, especially in the web-formation process, bonding method and fabric finishing process. As a result, web parameters could change across the fabric. Usually, the basis weight changes along and across the nonwoven fabric at different locations of the web. Generally, nonwovens have two principal directions: a machine direction (MD) and a cross direction (CD). The former is the flow direction of the web assembly on the conveyor during the manufacturing process. The latter is perpendicular to the MD in the plane of the conveyor, where the web assembly forms the sheet geometry. The third axis is the thickness direction (TD), which lies along the thickness of a fibrous structure. Large variations in the basis weight within the fibrous network can lead to deterioration in the uniformity of the fibrous structure, and it can be regarded as an indicator of inconsistency of the manufacturing process. As a result, it affects the properties of a nonwoven web, resulting in poor structural performance. In addition to this, it adversely affects many applications, such as filtration, hygiene, and wipes, etc. 9 The basis weight also influences the aesthetic and physical properties of nonwoven fabrics. 10 In addition, uniformity of the basis weight is an important parameter for permeability of nonwoven webs as well as mechanical characteristics such as tensile properties. 11 Many studies have attempted to develop prediction models, which are close to real-life nonwoven webs including such features as non-uniformity.12,13 Consequently, two major measurements were introduced known as: ‘online’ and ‘offline’ methods to determine the web uniformity of nonwovens. Generally, offline methods cannot be performed during the manufacturing process: they include cut-and-weight measurement techniques. However, online methods can be employed during the manufacture and are based on image analysis techniques. In the cut-and-weight method, the basis weight is assessed as follows: fixed-size samples are chosen randomly in different locations, cut and measured with a high-precision scale to compute the basis weights of the nonwoven fabrics. However, it is a time-consuming and destructive technique. So, it is hard to expect a very fine level of basis weight measurements. Beokerman employed and used an online measurement method to compute the basis weight based on an image-processing technique based on transmittance light. 14 Images were captured using a light source located on one side of the fabric and a detector fixed on the other side of the fabric. After the light interacted with the nonwoven fabric, the fraction of incident light passed through the web, and the rest was scattered or absorbed. The detected level of transmitted light was used as a measurement to compute the basis weight. For instance, when the basis weight decreased, the detected level of transmitted light was increased. The intensity of light transmittance was collected by a camera; it was related to the optical density of the nonwoven image after a nonwoven fabric was illuminated. 15 Finally, a charge-coupled device (CCD) camera was used to capture an image for the online basis weight measurement. 16 When a fabric was properly illuminated, mass variation appeared as spatially varying signals superimposed by a high-frequency texture. Hence, the nonuniformity of mass was observed as variations in local image intensity: this would be used to determine the material uniformity in each location of the web. Thus, the image-processing tools can be employed to assess the basis weight of RFNs like nonwoven fabrics. 15 Compared with the offline methods, online methods are efficient, nondestructive and can be applied to various types of RFNs.
Quantification of such complex random objects is still a challenge. In particular, the determination of a basis weight of complex RFNs using 3D models remains underexplored. A parametric algorithm introduced in this study can be used to determine the local levels of the basis weight of RFNs accurately based on validated X-ray µCT models of nonwovens with various density levels, as well as produced with different manufacturing parameters. The following sections present the system set-up, the methodology of the novel algorithm, and the obtained results together with their discussions and conclusions.
System set-up
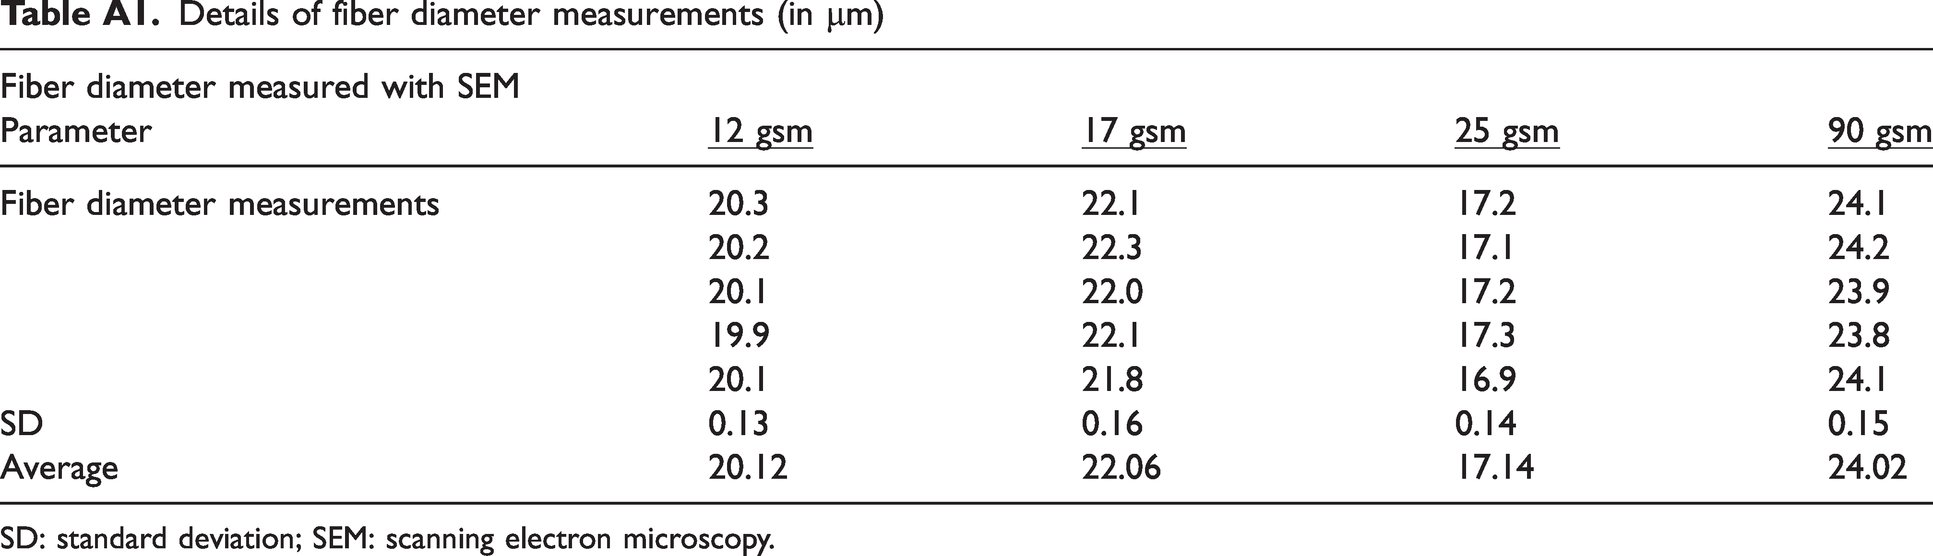
The Nikon XTH 160Xi X-ray µCT system was used in this study integrated with two workstations called image-reconstruction and image reconstruction. A parametric algorithm was developed and tested for nonwovens with various values of densities, produced with different manufacturing parameters. Selected nonwoven fabrics were manufactured with TC and TAB, stacked with a few layers. The fiber diameter was measured in different locations in each fibrous network using SEM. The average fiber diameter is presented in Table A1 and the measurement details are given in the Appendix. TAB fabrics were made from bi-component (combining polypropylene (PP) and polyethylene (PE)) and mono-component (PP) fibers, while TC fabrics were manufactured using only PP (Table 1). The entire experimental process is shown in Figure 1(a); a scanned area of the nonwoven web was 3 mm × 3 mm (Figure 1(b)).
Details of used nonwoven materials
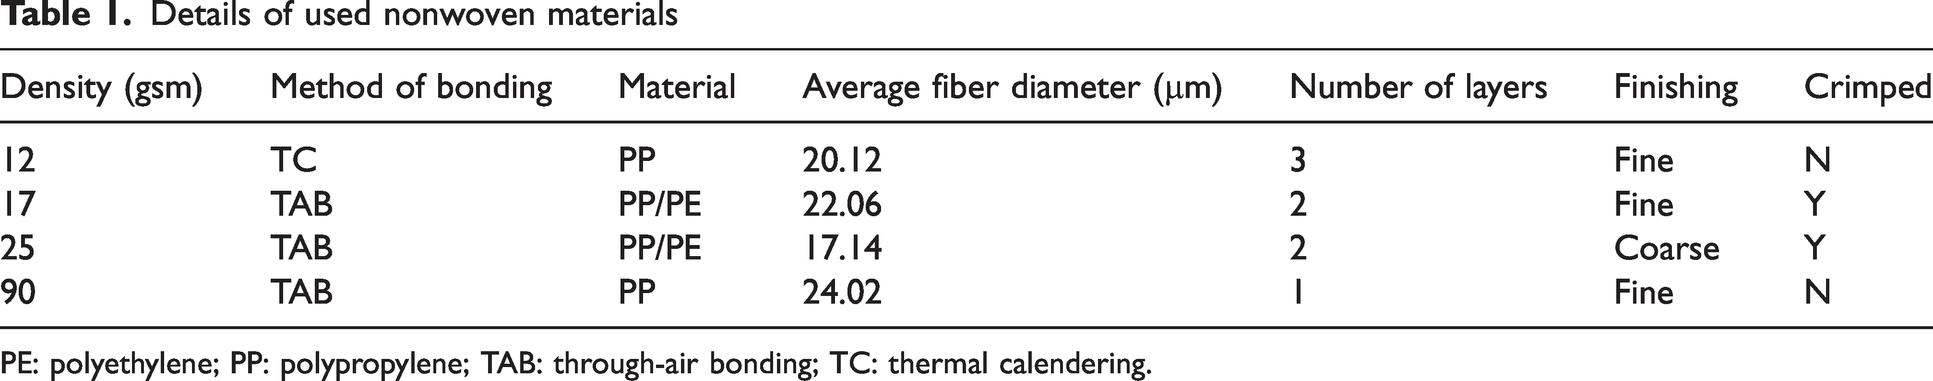
PE: polyethylene; PP: polypropylene; TAB: through-air bonding; TC: thermal calendering.
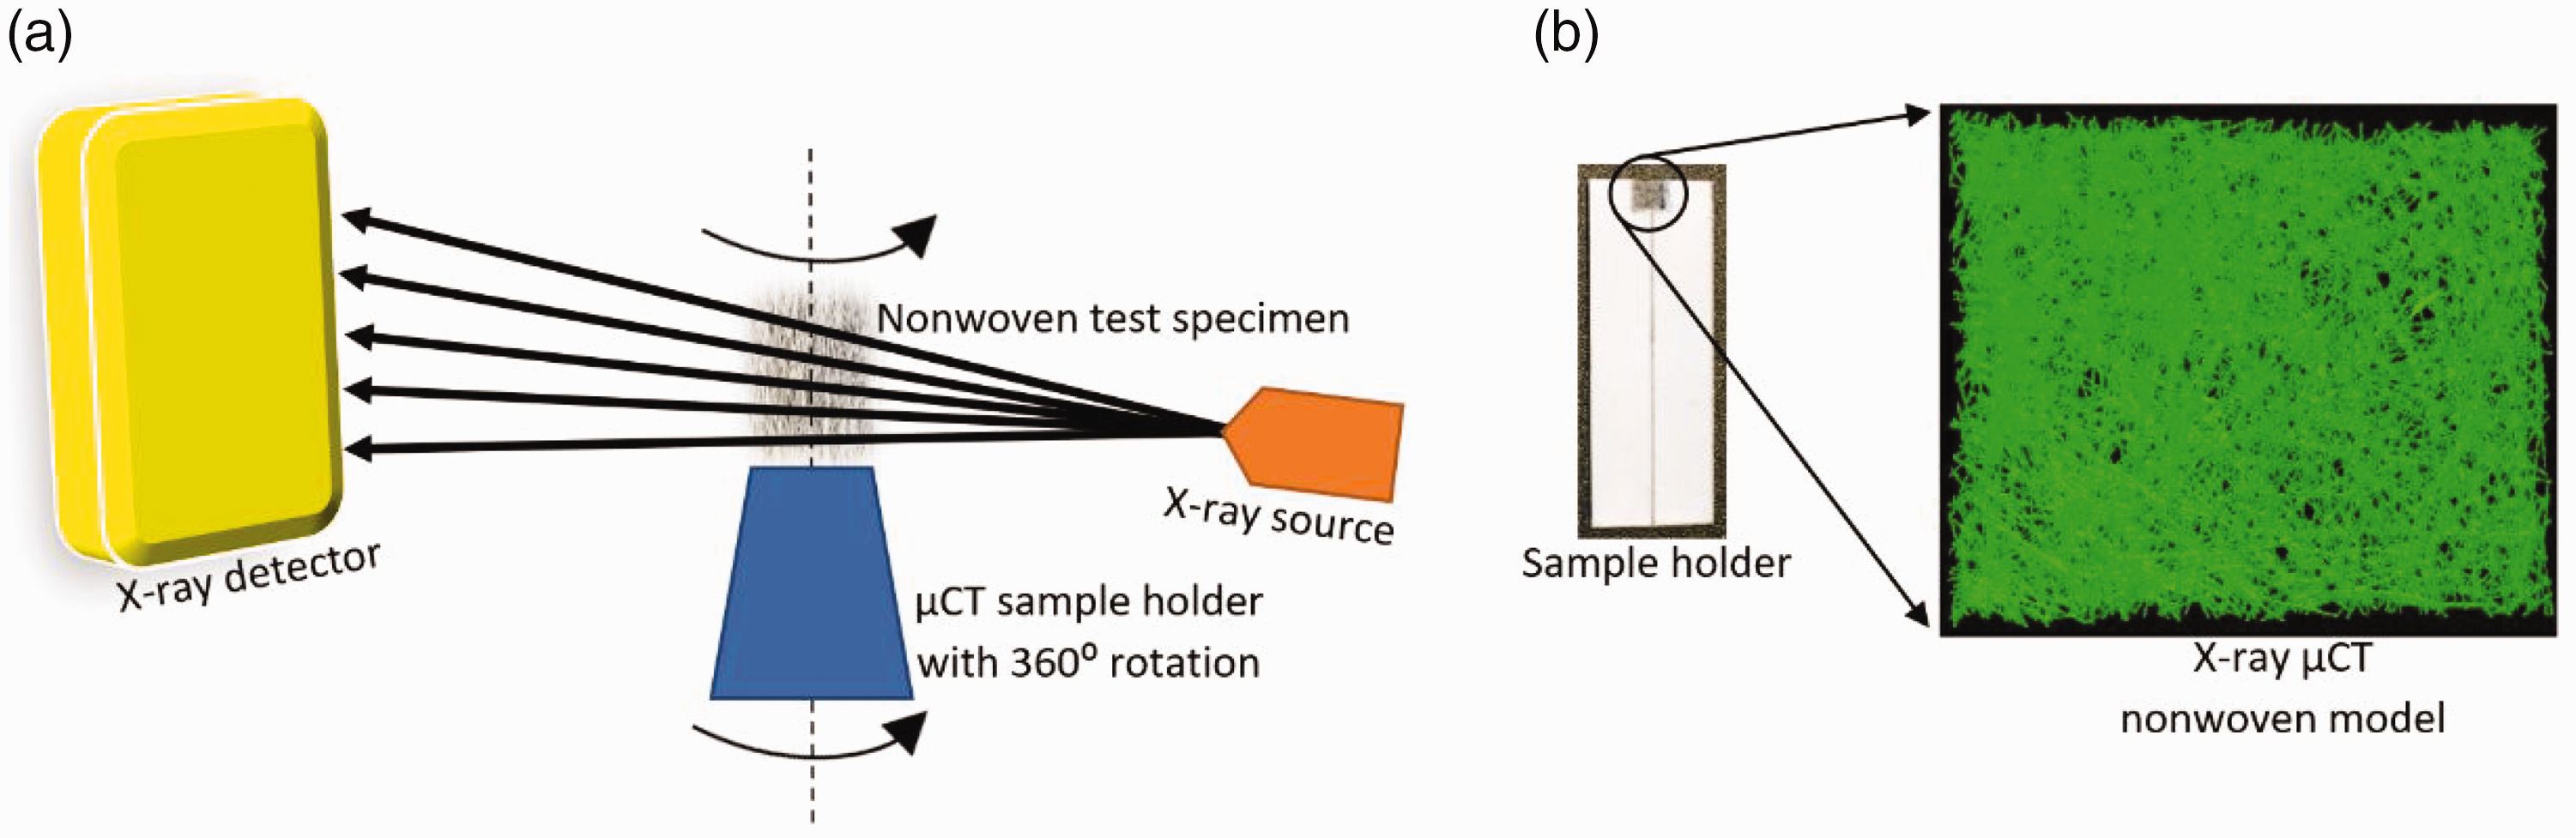
(a) Working principle of X-ray micro-computed tomography (µCT) system; (b) test specimen.
The total scanning time was set at 10.5 h to increase the accuracy of a final volume, with eight frames generated for each projection to create a single tiff image for the final 3D model. As nonwovens are comparatively low-density materials, low-energy conditions were used in the X-ray µCT process (50 kV and 50 µA) to generate a beam spot. Fibers were exposed to X-rays, for 1 s in each projection (exposure time) to detect them properly, while enhancing the sharpness of fiber edges and preventing the generation of discontinuous fiber segments in the final reconstructed image. As a result, a fibrous structure with continuous fiber segments was successfully acquired. In tests, resolution was kept at 2.5 µm to improve the image quality. Once the X-ray µCT model was acquired, it was imported into 3D Matlab interface to post-process the voxel image.
Methods
Initially, the cut-and-weight method was employed according to the ISO 9073 standard to estimate the basis weight of nonwoven fabrics, and the obtained results were used to validate the novel algorithm. Each set of specimens for measurement included five samples (30 cm × 30 cm), and a sensitive scale was used to measure their weights. 17 The area of the sample was measured to calculate the basis weight of the fabric. Samples were taken from the middle of the fabric to avoid any edge effects associated with the manufacturing process. Subsequently, a sample was taken to process the CT experiment on specimens within 3 mm × 3 mm areas due to the resolution of the X-ray µCT device.
A center line was marked on each test specimen to fit the X-ray µCT holder accurately into the system and to make sure that the specimen was always within the range of the X-ray beam, while it was rotated around its axis. The width of the sample should be in a suitable range, which can be fixed to an X-ray sample holder. The maximum width of the test specimen was chosen as 10–15 mm, while its height was maintained at 60 mm. If the sample height is high, it is more likely to bend, leading to a poor focus level between the X-ray source and the X-ray detector. So, the thickness was doubled in the clamping area to provide a proper fit between the sample and the CT sample holder. The thickness of the cardboard was 0.6 mm (Figure 2). The sample preparation process is shown below.
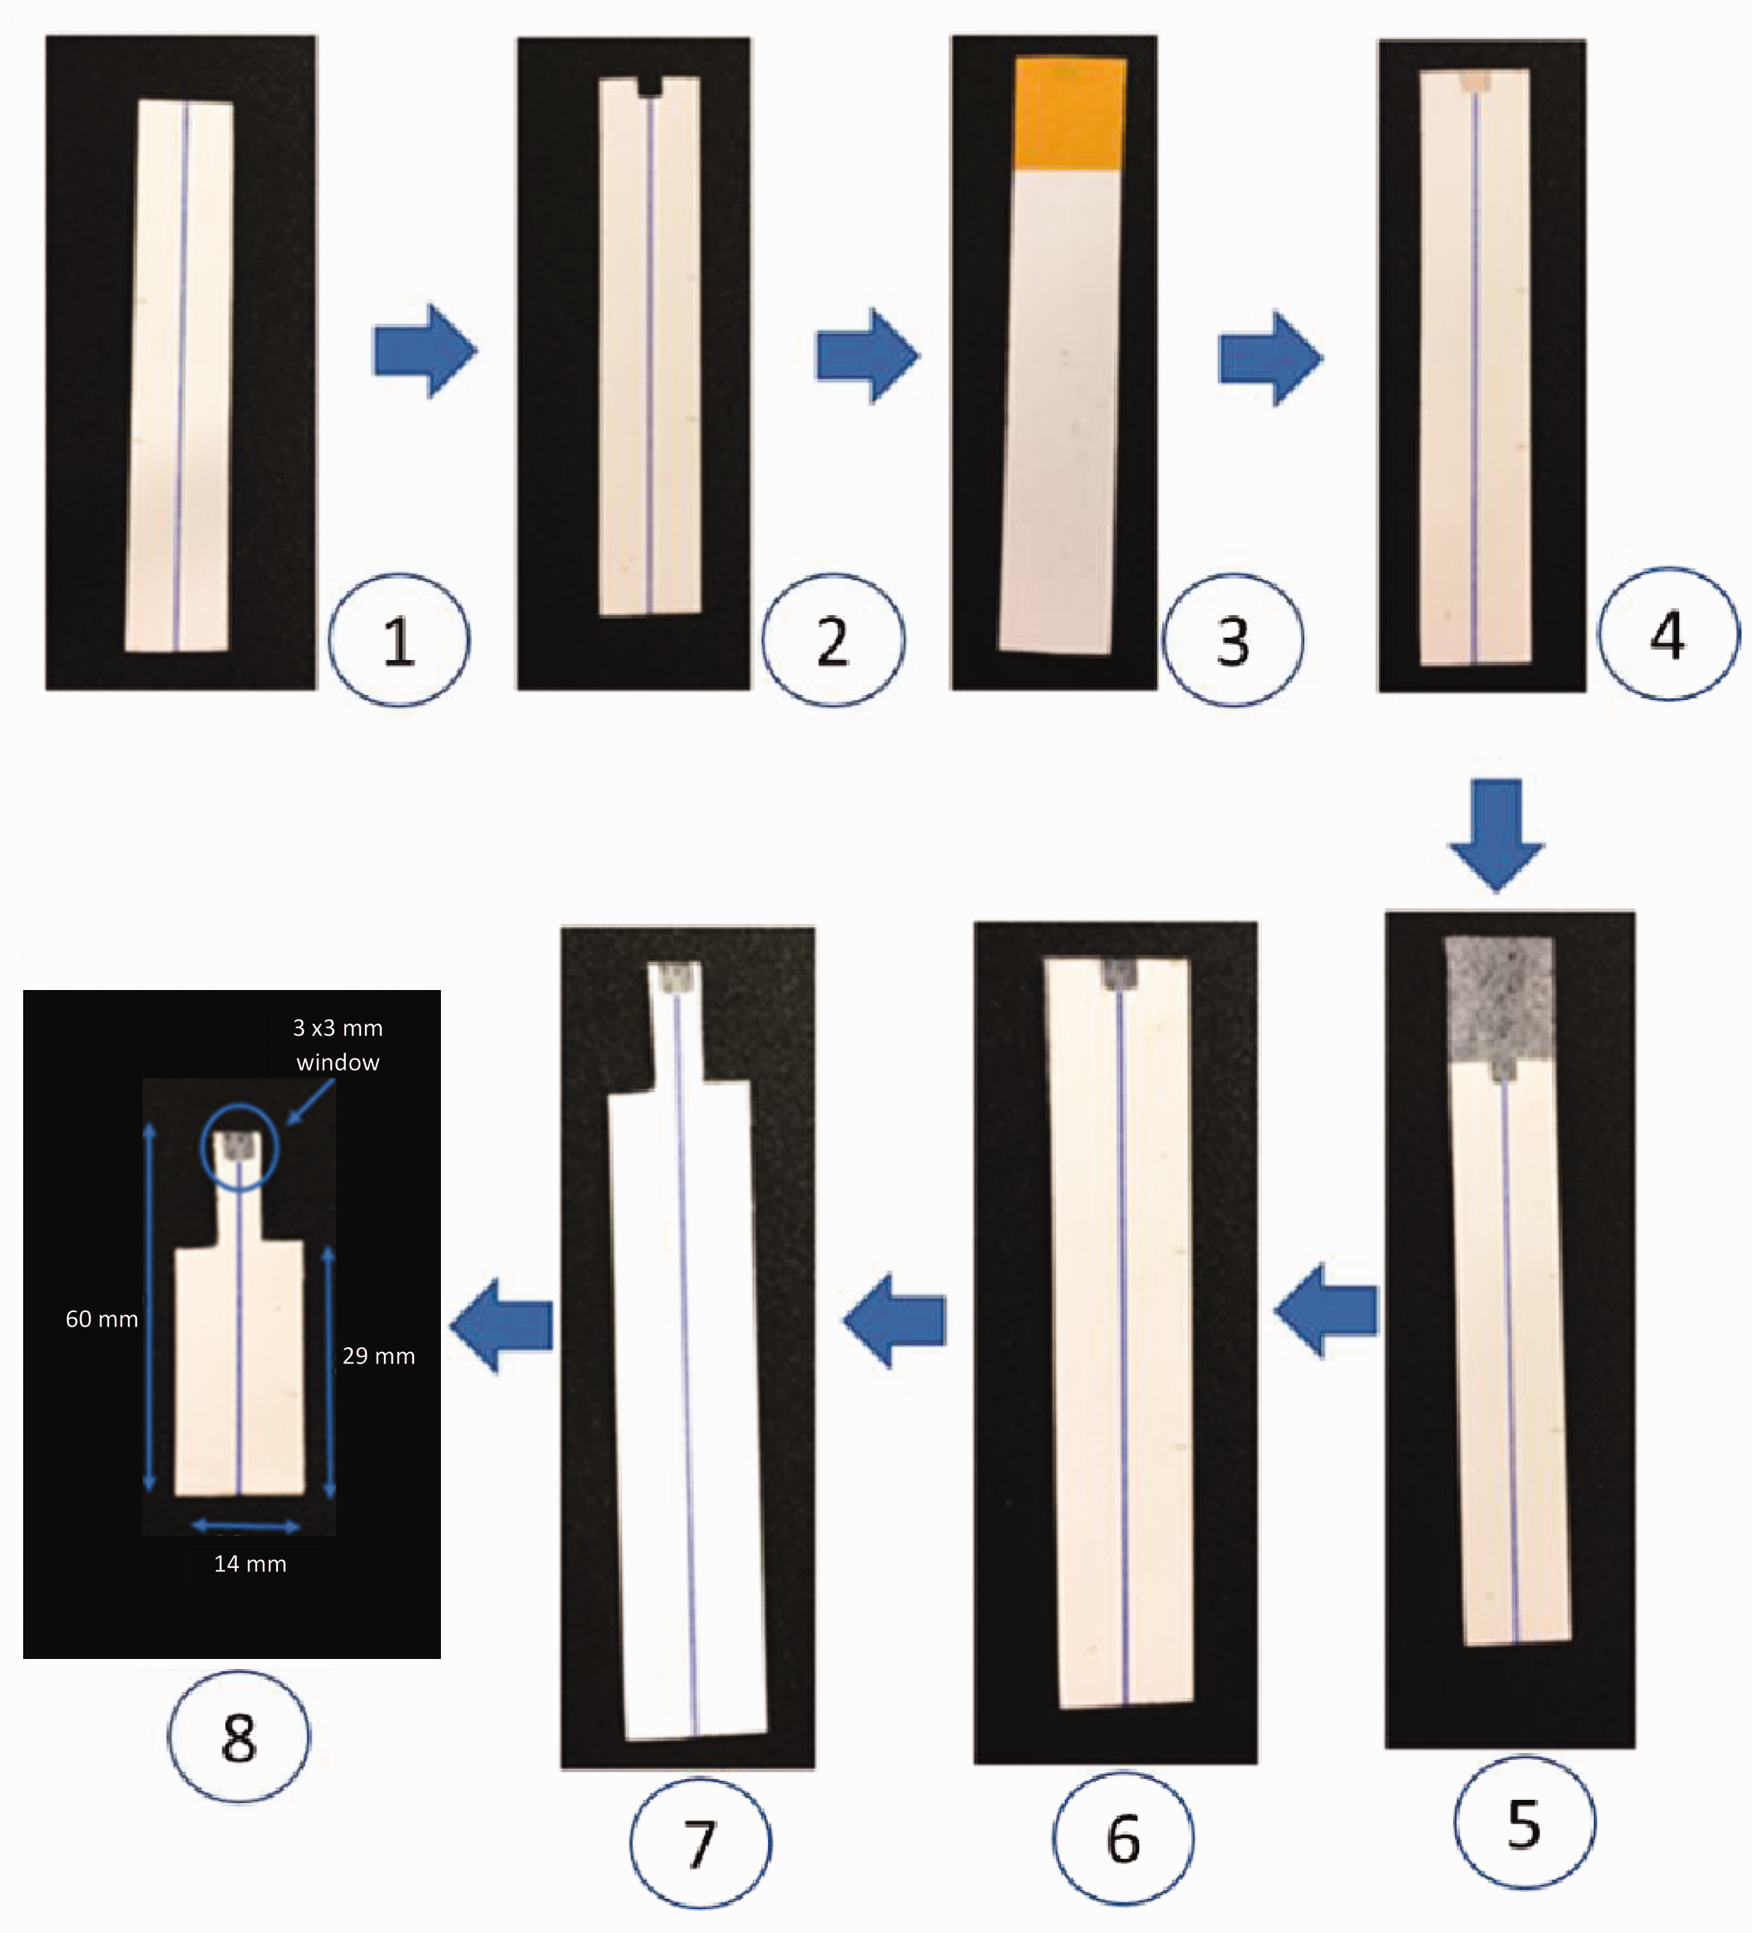
Preparation of nonwoven test specimens.
With the width, height and thickness of the sample confirmed, the center line of the whole test sample was marked (center line of the sample holder was also marked to acquire a precise alignment).
Make a 3 mm × 3 mm slot aligned with the center line with a sharp blade.
A piece of double-sided glue tape was pasted on one side of the sample in the area of the marked window. So the other side could be used to paste the nonwoven fabric.
The window was cleared using a sharp blade removing cardboard including the double-sided glue tape.
A small portion (but bigger than the window size) of the nonwoven sample was carefully removed using scissors from the nonwoven web without damaging it and pasted (parallel to the sample window) on the glue tape. However, the sample was not forced and pressed on the glued surface as the nonwoven thickness could be affected.
Additional pieces of both cardboards and fabrics were removed, which were out of the sample margins using a sharp knife to maximize the resolution within the X-ray beam.
Finally, the test specimen is shortened to the shown dimensions in the last step of Figure 2.
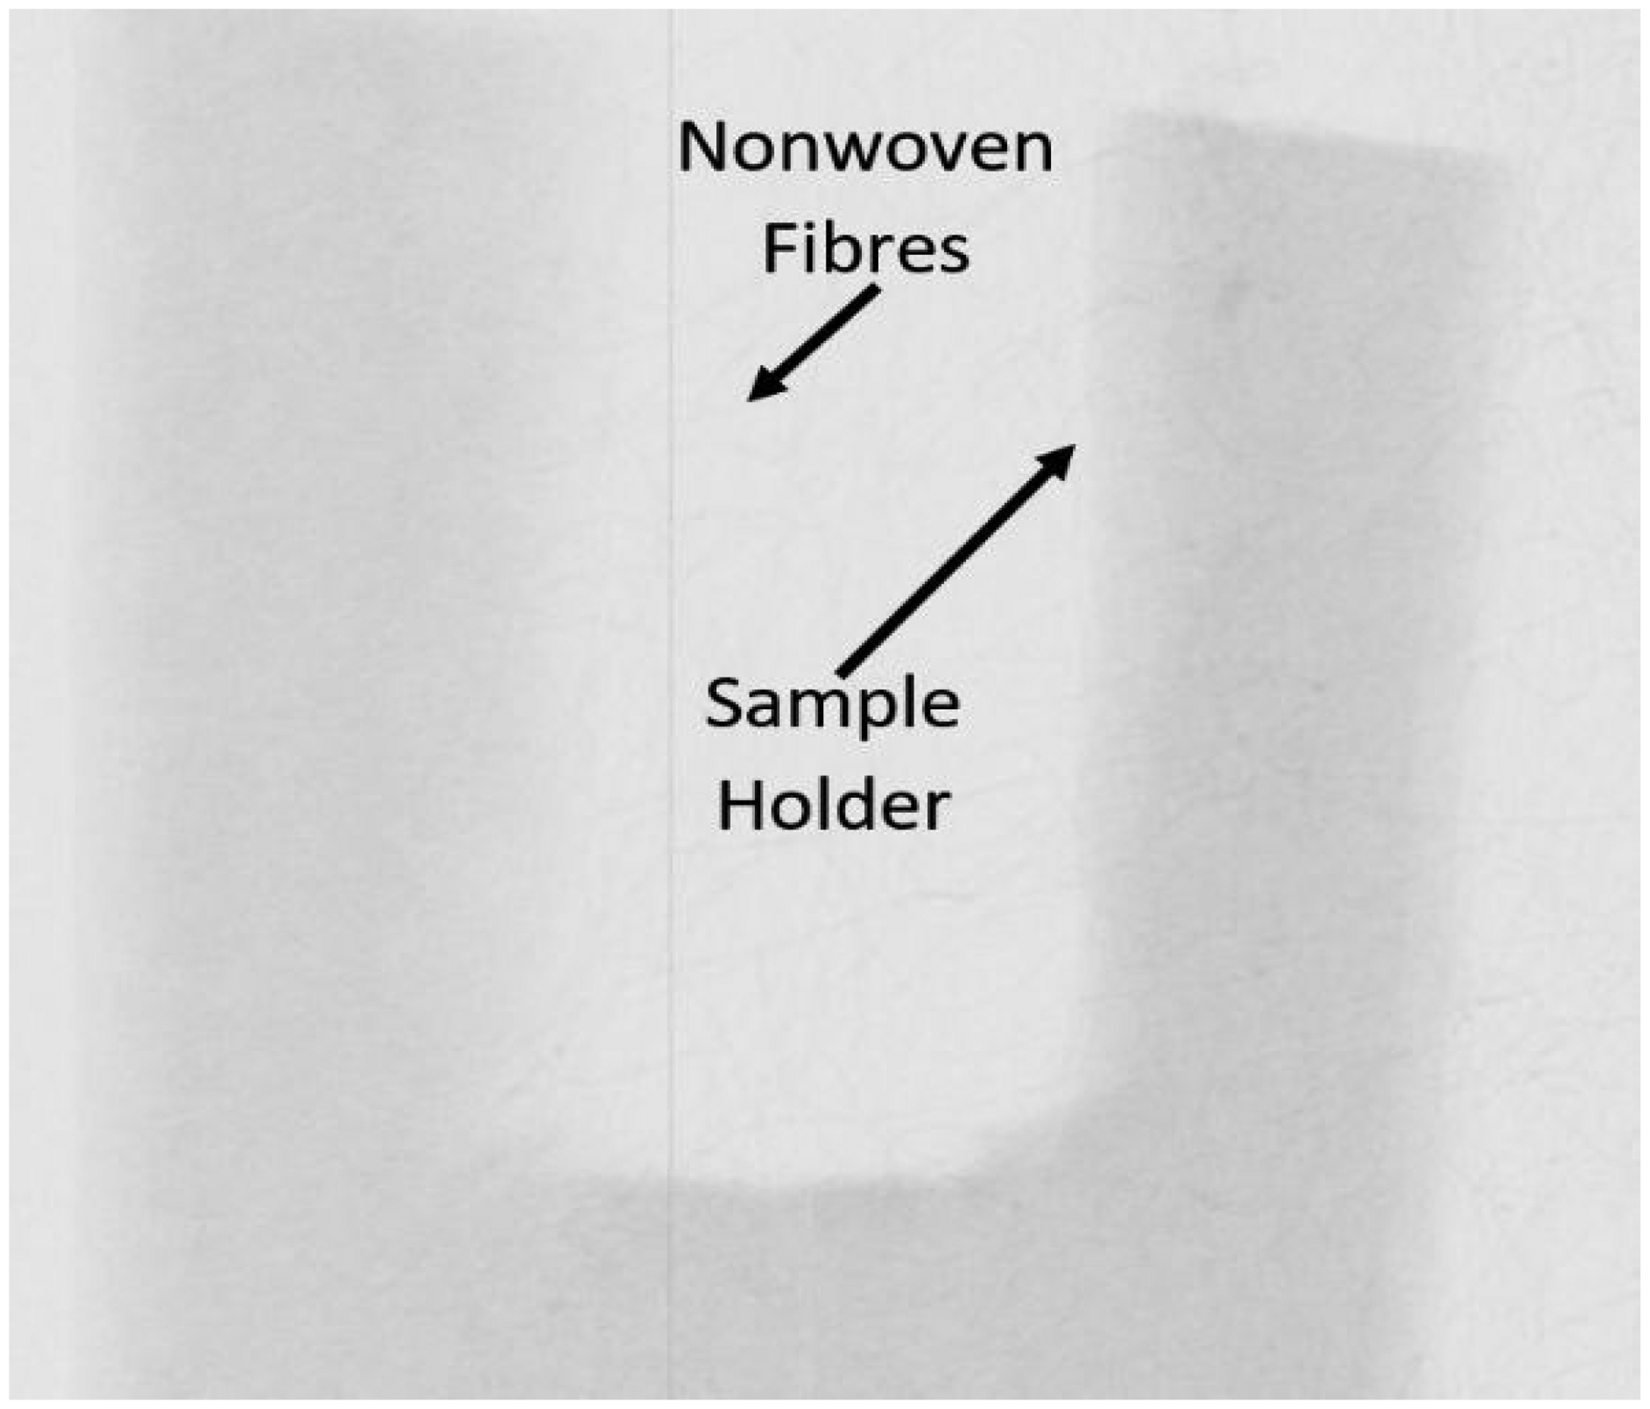
It is important to retain the MD and CD directions of the sample when it was removed from the web. If the test specimen is warped, a user may face difficulties at the stage of choosing a region of interest. When the image needs to be cropped, choosing such a region with desirable features may be difficult as bending is reflected in the final CT image. So, it is important to avoid deformations in the test specimen, making specimens with solid and thick-rigid support material. This reduces potential deformations of the test specimen by providing an additional support to the entire test specimen. In addition, it made it easier to remove the noise like ring artefacts, generated along the center line, because the center of rotation of the entire specimen shifted to the support side for the nonwoven fabric attached to a thick holder. When the resultant image was cropped at the final stage, the holder with ring artefacts was removed. Also, it is always beneficial to center the test specimen with the sample holder, so that the window with the nonwoven fabric (region of interest) was symmetrical with the test specimen. A center line was marked on both faces of the test specimen and the CT sample holder. As the test specimen was almost centered with regard to the sample holder, it could be easily centered with the X-ray beam. So, the test specimen was rotated always within the X-ray beam, without getting the image out of view/focus. Figure 3 shows a test specimen centered with the sample holder using the center lines. Acquired data were gradually transferred from the image-acquisition workstation to an image-reconstruction workstation.
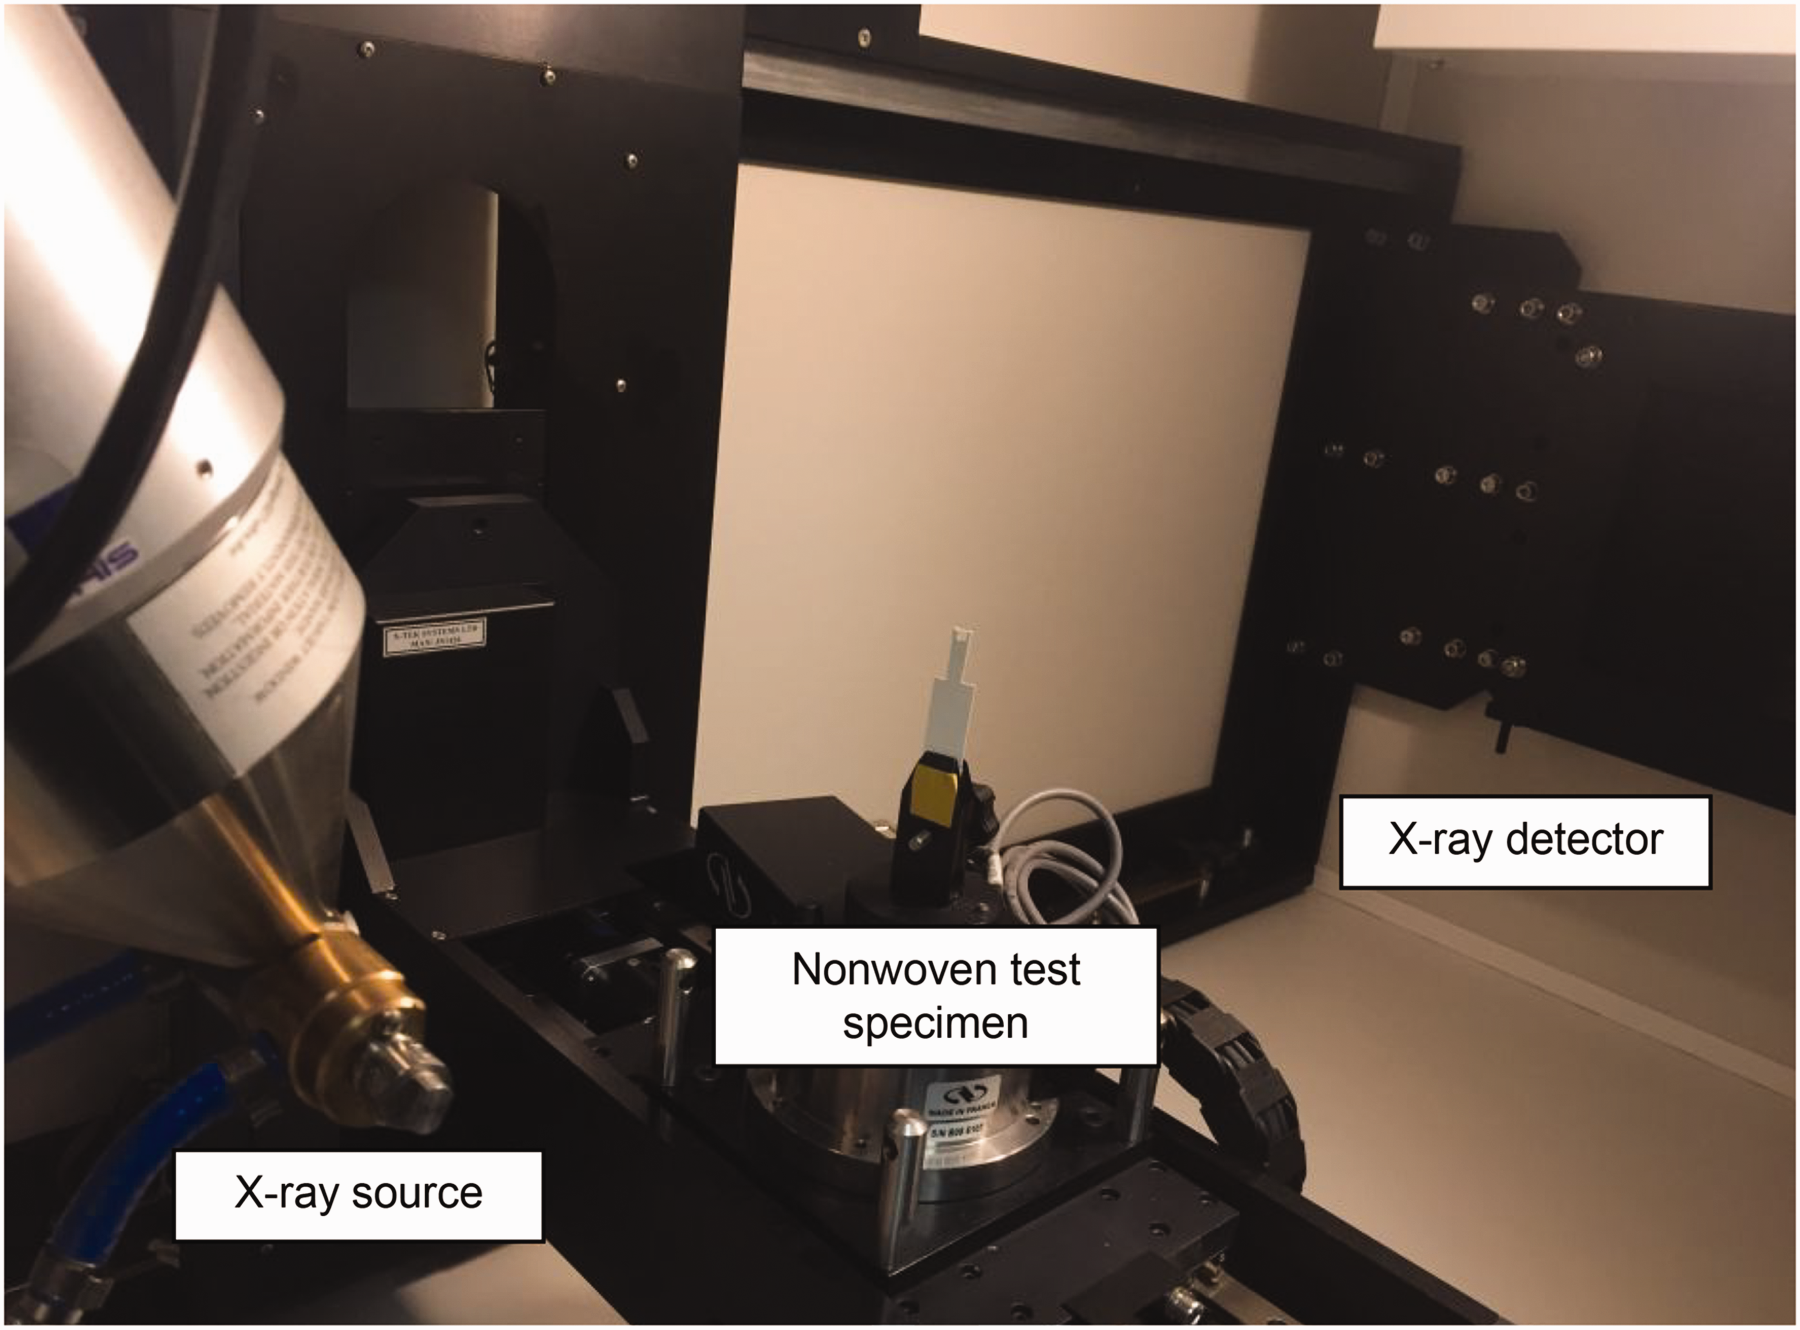
Centered nonwoven test specimen in an X-ray micro-computed tomography (µCT) device.
A 3D model of a specimen was reconstructed combining 3016 of 2D tiff images (Figure 4) produced by the system, with each 2D image created using eight frames per projection, while keeping the specimen rotation angle step at 0.12°.
Two-dimensional (2D) X-ray micro-computed tomography (µCT) tiff nonwoven image.
After 2D slices of the nonwoven model were created, they were sent to a reconstruction workstation. The CTPro3D software was used for the image-reconstruction process, and to determine the optimum center of rotation manually as the automatic feature does not provide accurate results for low-density nonhomogeneous materials like nonwovens. The manual method needs a significant level of experience and implemented with the sharpness of the images (e.g. corners and pores, etc.). The center of rotation was located successfully within 1 voxel length in this study.
The next few steps of the CT reconstruction process were image filtering with 3D Gaussian filters (3 × 3 × 3 kernel size) and enhancements such as pruning mostly available in general image-processing software. In this study, morphological operations such as skeletonization on binary volumes were applied to the image with VGStudio and 3D Matlab image-processing software. The last step of the CT reconstruction process was to choose the region of interest. In this step, the 3D volume was cropped manually using two normal views of the finalized image. The quality of the acquired image was more improved using an option called ’voxel scaling factor’ with the value of 100%. Finally, generation of the 3D volume file based on the parameters chosen in previous steps was confirmed. The purpose of 3D VGStudio file generation in this step was to visualize and evaluate the quality of the final image before taking further analysis in the 3D Matlab interface. CTPro 3D software was employed to crop the image with the region of interest. The generated 3D volume has a unique file ID with its volume by voxels along X, Y and Z axes, and an additional algorithm was developed with Matlab 2021 software to identify the 3D coordinates of the volume, as shown in Figure 5. This algorithm reads the X-ray µCT image by coordinates (X, Y and Z) of voxels and brings it into Matlab software for further analysis (Figure 5).
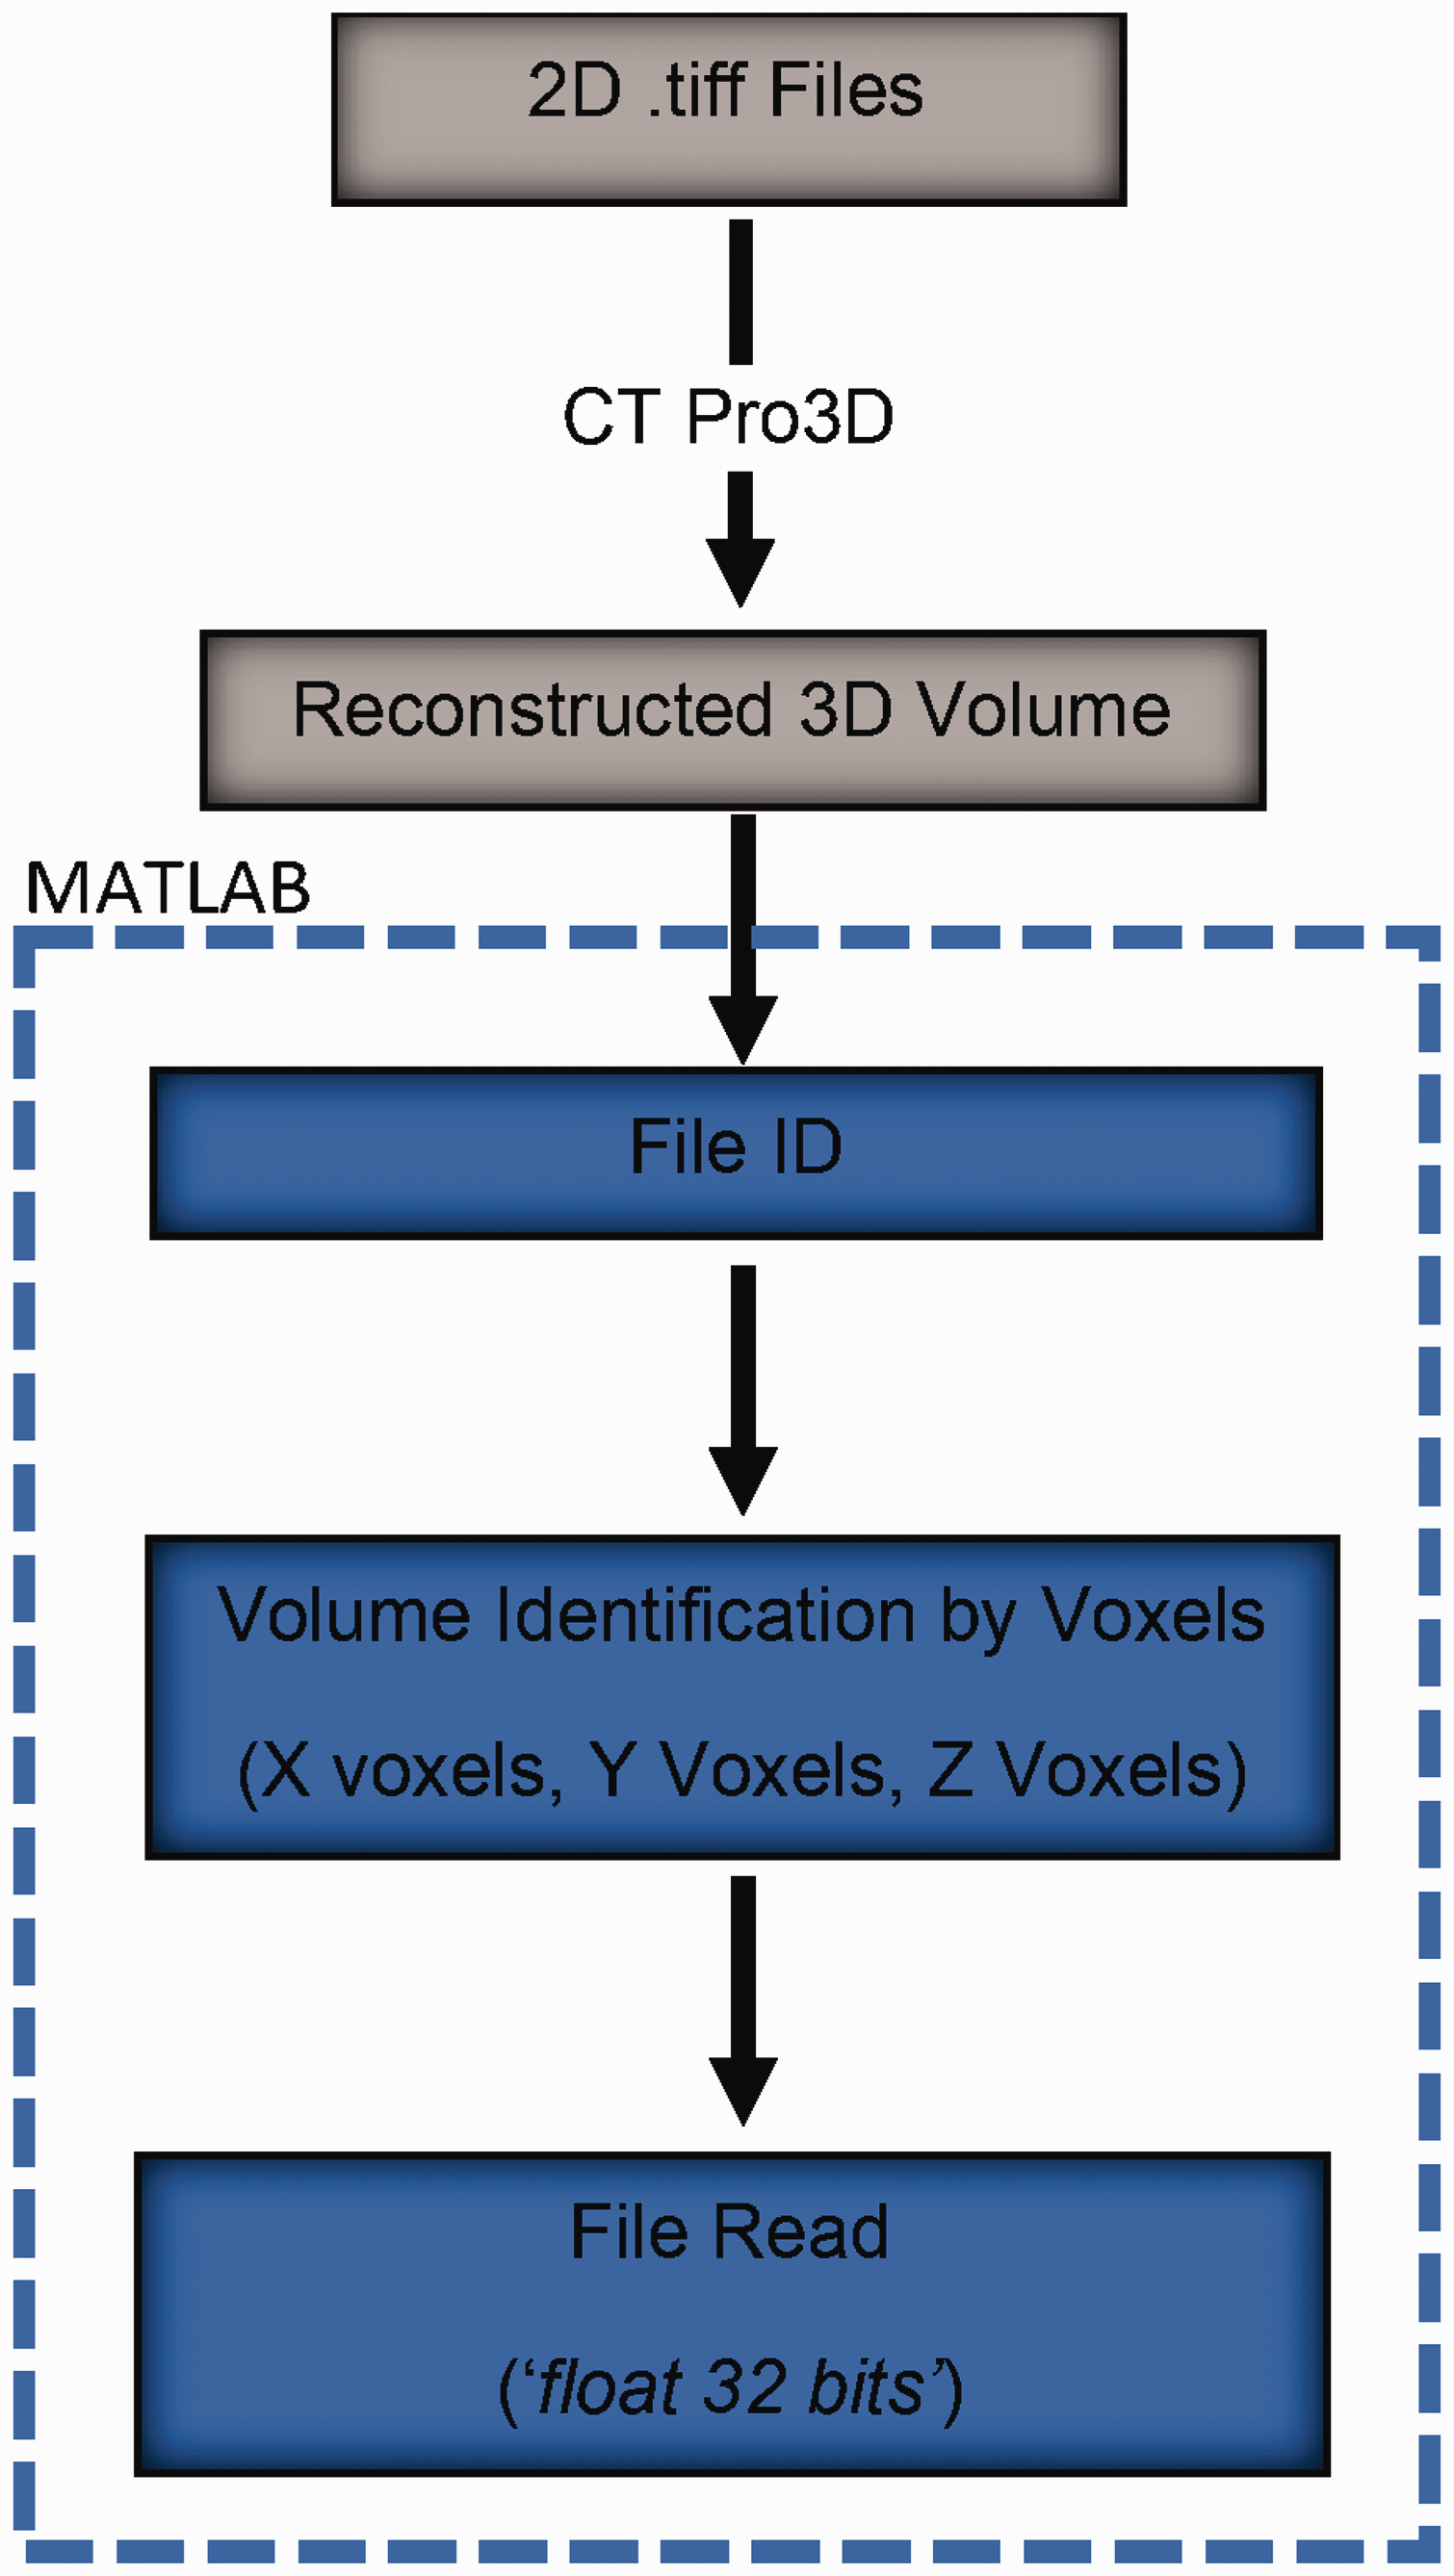
Process of computed tomography (CT) volume import into Matlab software.
The reconstructed image contained some salt-and-pepper noise, and it was filtered using a Gaussian filter. 18 In dense nonwoven fabrics, fibers touch each other, making a structure more complex. As a result, the voxel domain identifies them as single volumes. To resolve this issue, the image of the entire fibrous structure was eroded using a sphere-shaped erosion filter with one voxel radius to clear the borders of touching fibers. 19 VGStudio software, integrated with the X-ray µCT system, was used to find an optimum binarization value for scanned RFNs with the histogram thresholding method. In this research, segmentation of fibers and air was implemented using a histogram thresholding technique. The de-noised image was binarized with voxels contributing to the fibrous structure counted, while the remaining ones considered voids. Then, a pruning operation was implemented to remove unwanted very short particles/branches (less than or equal to 5 voxels); the developed algorithm allowed an adjustment to this threshold value, which controls the minimum branch length. After the pruning operation, short branches were removed.3,4 In Figure 6, blue lines represent fibers, with the orange color showing the spurious fiber segments. After the pruning operation, short branches were removed. This process was implemented with the skeletonization process in the same toolkit: medial axes of the fibrous structure were acquired to track the fiber paths. Skeletonization is a thinning process; it removes the boundary voxels until all the fibers in the image are reduced to one-voxel-wide center lines. A schematic diagram of the entire experimental and computational processes is shown in Figure 7.
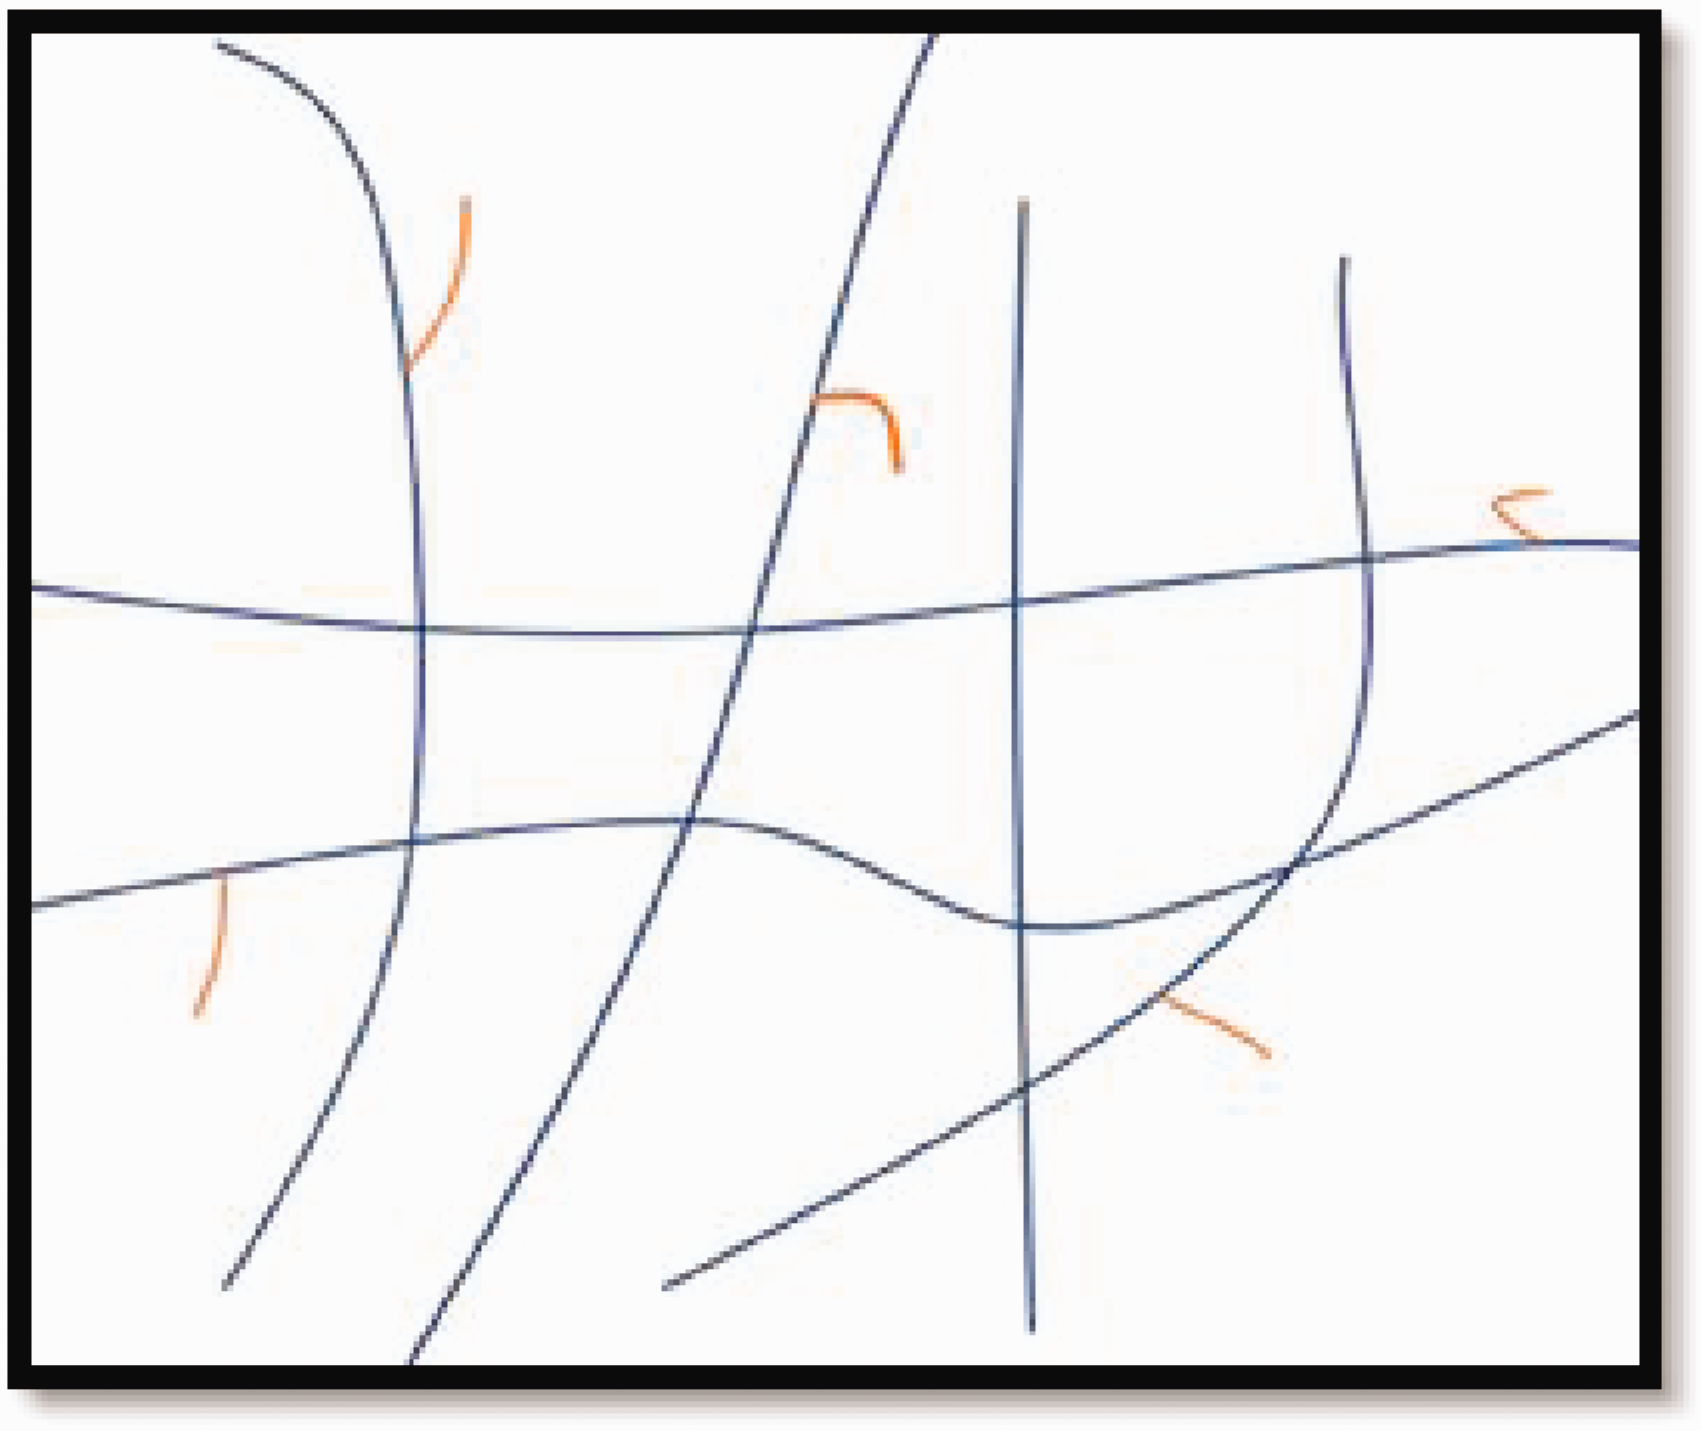
Pruning operation.
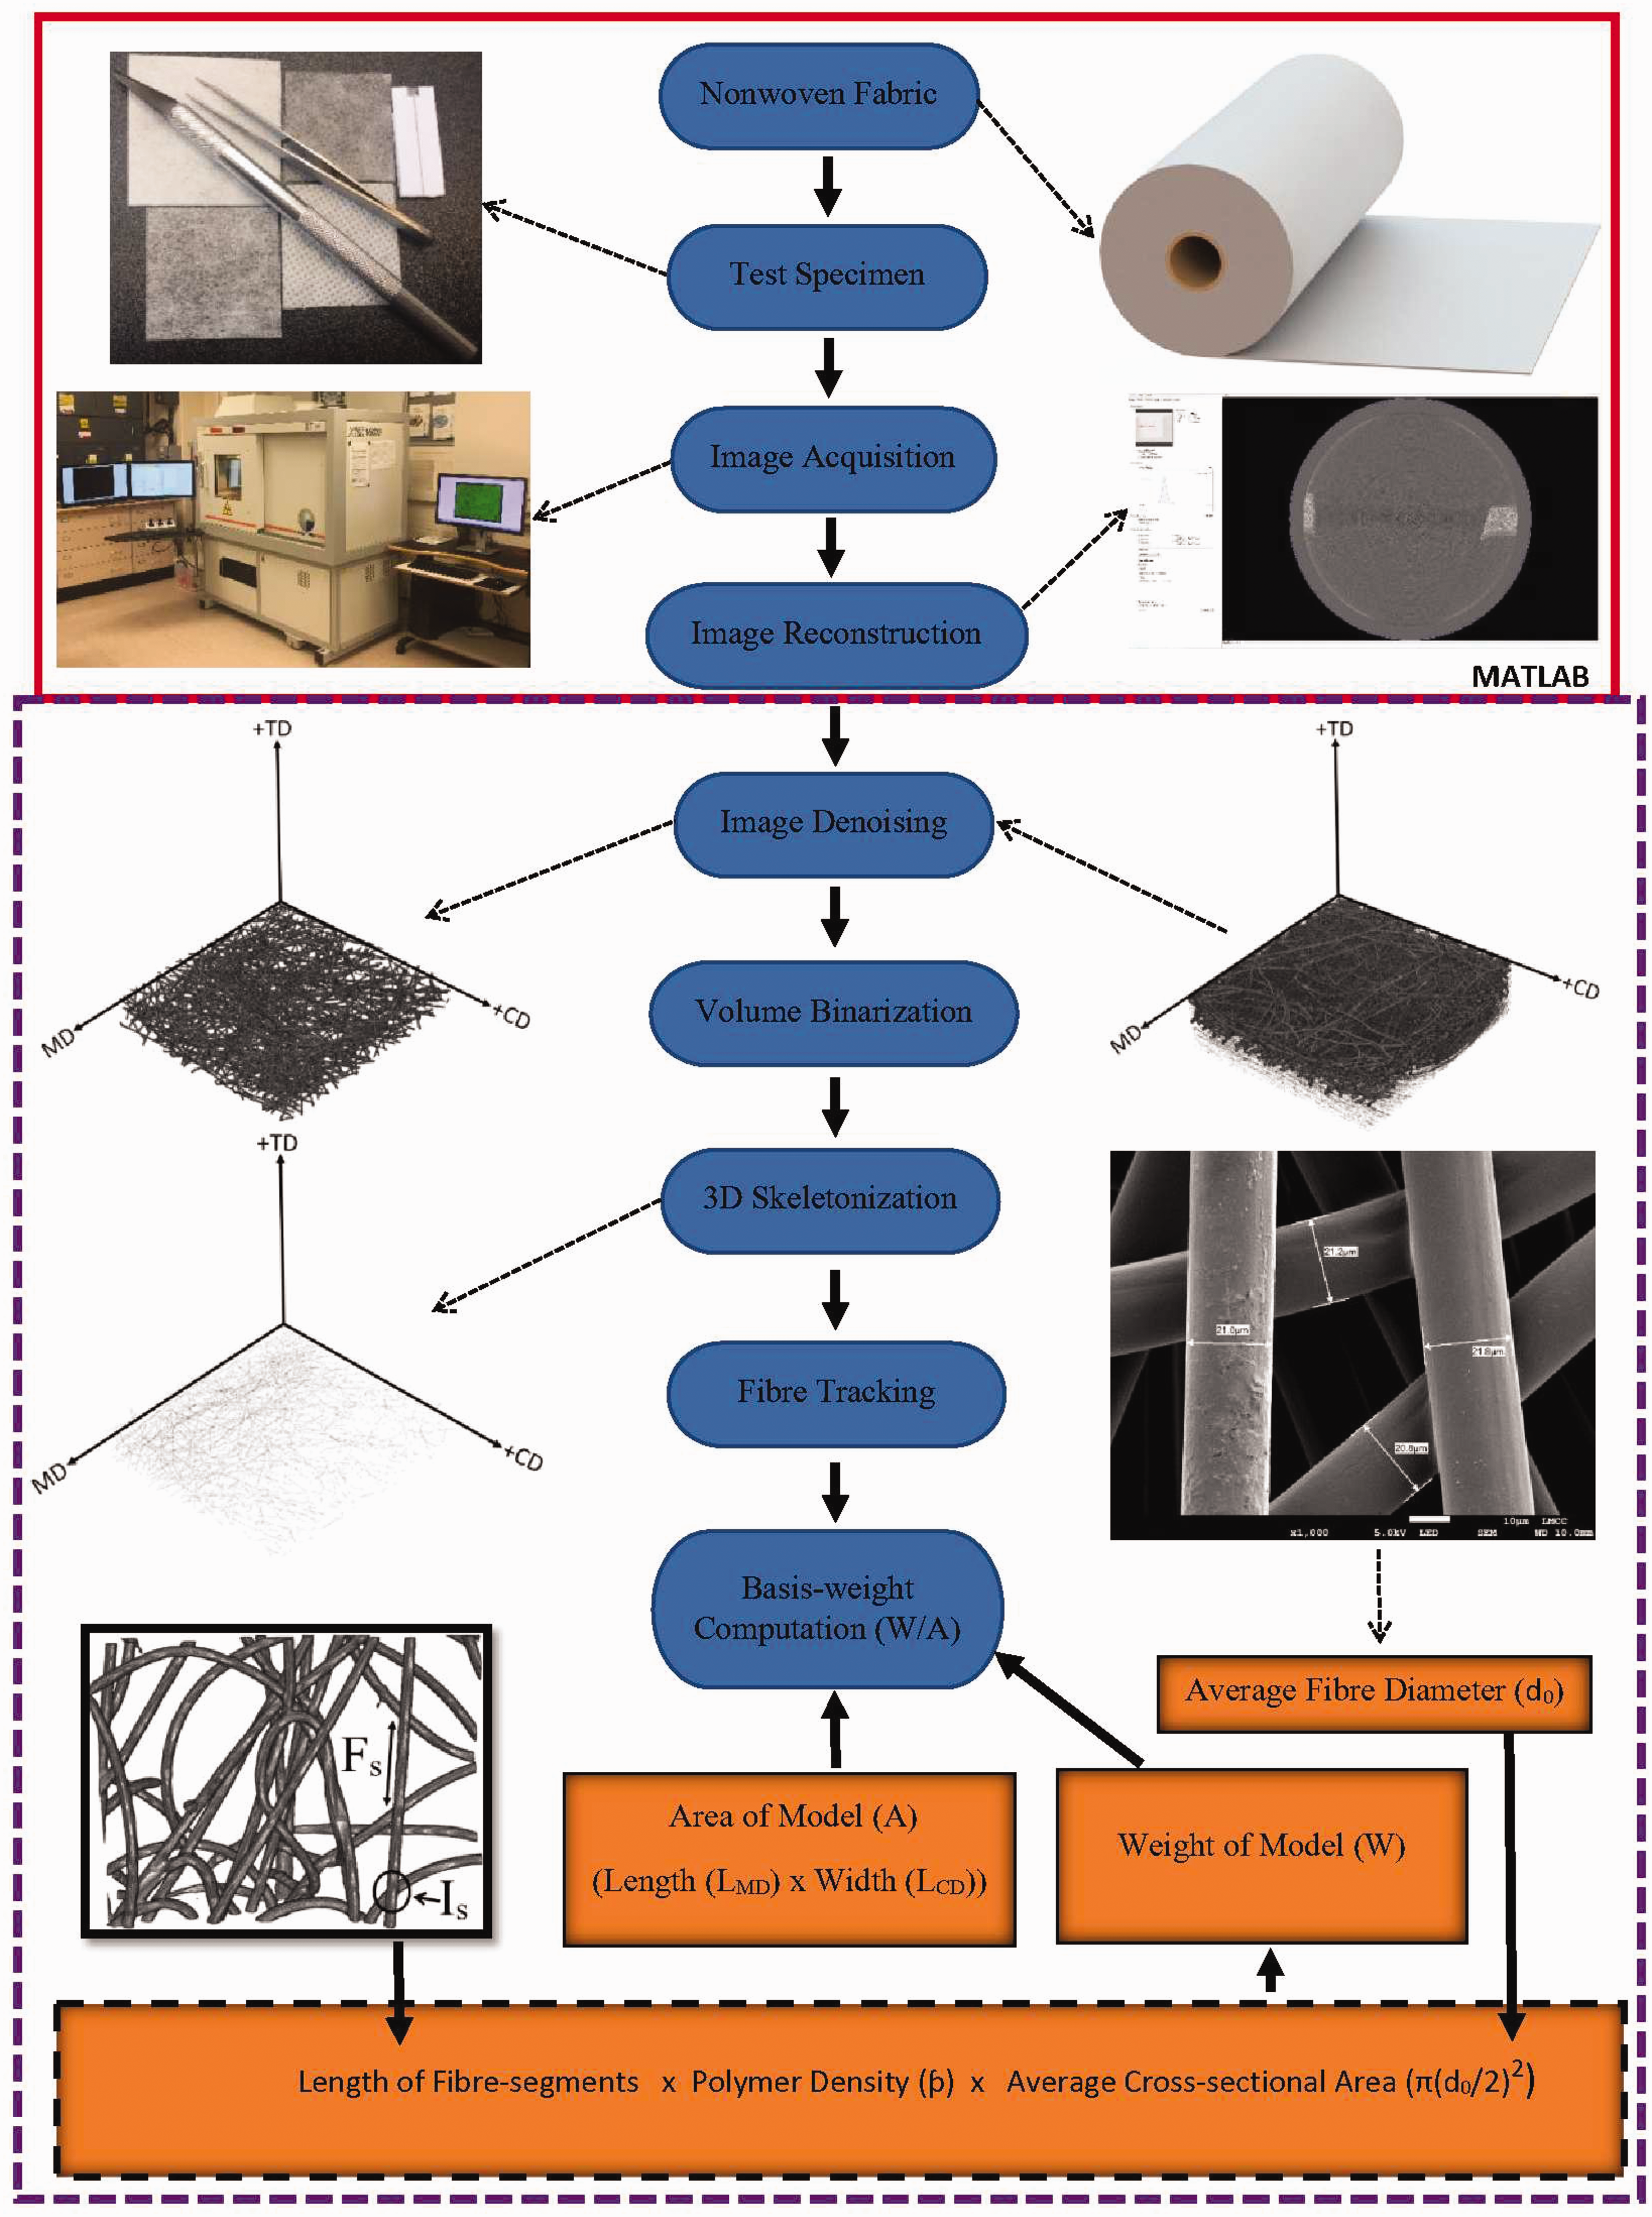
Experimental and computational process.
The skeleton of the de-noised and binarized fibrous structure was acquired using the ‘bwskel’ function in Matlab. The fiber paths were tracked, with endpoints and intersection points of each fiber segments detected to assess their 3D coordinates to compute the orientation distribution function. 3 Morphological functions called ‘end-points’ and ‘branch-points’ were used to access the endpoints and intersection points of the fibrous structure in the 3D domain, respectively. Function ‘regionprops3’ of the volumetric toolbox was used to acquire coordinates of both points. These were used to track the fiber segments to compute the basis weight of the fabric. The fiber-tracking algorithm was developed to track fibers from one intersection (contact) point to another, that is, fiber segments were considered. 20 Intersection points (Is) of the skeletonized model were detected to track the fiber segments (Fs) of the structure. Lengths of fiber segments (Li, where i=1, 2, 3,… N is the number of fiber segments) were calculated using voxels and converted to µm.
An average cross-sectional area (A0) was calculated using an average fiber diameter (d0) acquired from 2D SEM images, and the test sample area (As) was found based on lengths along MD (LMD) and CD (LCD) in voxels and recalculated for µm. The weight of the model was computed by multiplying the polymer density with the average cross-sectional area and the total length of fiber segments (Li) (Figure 7). Finally, the basis weight of the fabric was obtained as the ratio between the weight of the sample (W) and its area (As). The set of the following equations describes the stages of the computation.


A 12 gsm fabric was manufactured using TC, while other specimens were produced with the TAB method. TAB fabrics contain random bond points generated where fiber contacts met hot air. TC fabrics also contain this type of bond points, where fibers are exposed to heat from a metal calendar. However, they have also a specific pattern of bond points formed by a profile on the calendar. The fiber-tracking process scanned the fiber segments individually to compute their weight. A variety of fabrics with mono and bi-component fibers with different diameters were analyzed with the developed approach.
The obtained results demonstrated that the algorithm was flexible for all studied RFNs. The developed method is also suitable for different shapes of cross-section or fiber diameter. Still, maintaining the continuation of fiber paths is rather challenging and important for an assessment of the weight. Fiber segments in CT models were continuous, and the algorithm detected their paths within the model domain thanks to finely tuned scanning parameters.
Results and discussion
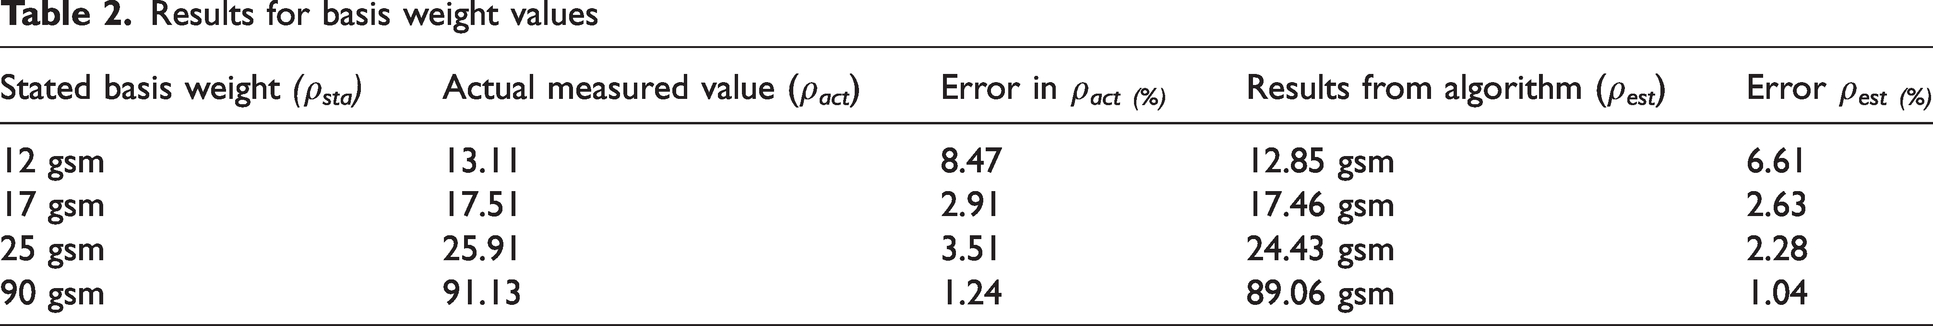
Typical X-ray µCT images of real nonwoven webs with prescribed basis weight values are shown in Figure 8. In this section, results of the developed algorithm are presented. The local basis weight value of nonwovens computed with the algorithm are called the estimated value and that measured using a sensitive scale is denoted as the actual basis weight value. Table 2 indicates both values together with those prescribed by the manufacturer. In addition, two different errors (ρact (%) and ρest (%)) were introduced to determine how much each value was deviated from the manufacturer stated basis weight value, which indicates the full correlation.


Results for basis weight values
As each fabric contains a few stacked layers, it is difficult to determine its density from SEM images as they do not show the layers underneath top layers. So, X-ray µCT models were used to compute the fabric density of each nonwoven web. Generally, coarse fibers are less cloudy in the images than the fine ones, which is apparent in X-ray µCT models for 25 gsm. 21 It seems there are smaller numbers of fiber segments in 25 gsm than those in 12 gsm even though the fabric density was doubled showing the actual geometrical contents of polymer fibers in the fabrics (Figure 8). The X-ray µCT system was capable of capturing this behavior precisely compared with SEM images. When the fabric density is high, it is hard to measure the actual structure of fabrics using 2D microscopical images, especially when fabrics were manufactured with various parameters and finishings. Unlike X-ray µCT models, 2D microscopical images are not capable of providing actual counts of fiber segments in fabrics using 2D image-processing tools especially for highly dense categories. However, SEM images are very useful as they can be magnified up to fine levels on desired layers to evaluate the geometrical parameters. This advantage was used to measure the average fiber diameter used in this study. Generally, the X-ray µCT system cannot detect the fiber diameter unless the beam is extremely fine-tuned and high resolution is used. To overcome this issue, SEM images were used to find the fiber diameter values. In addition, results could be affected by lighting conditions, magnifying levels and other parameters. The model developed in this study was based on 3D microscopical images, and could estimate precise basis weight values for RFNs thus overcoming the limitations and constraints of existing algorithms.
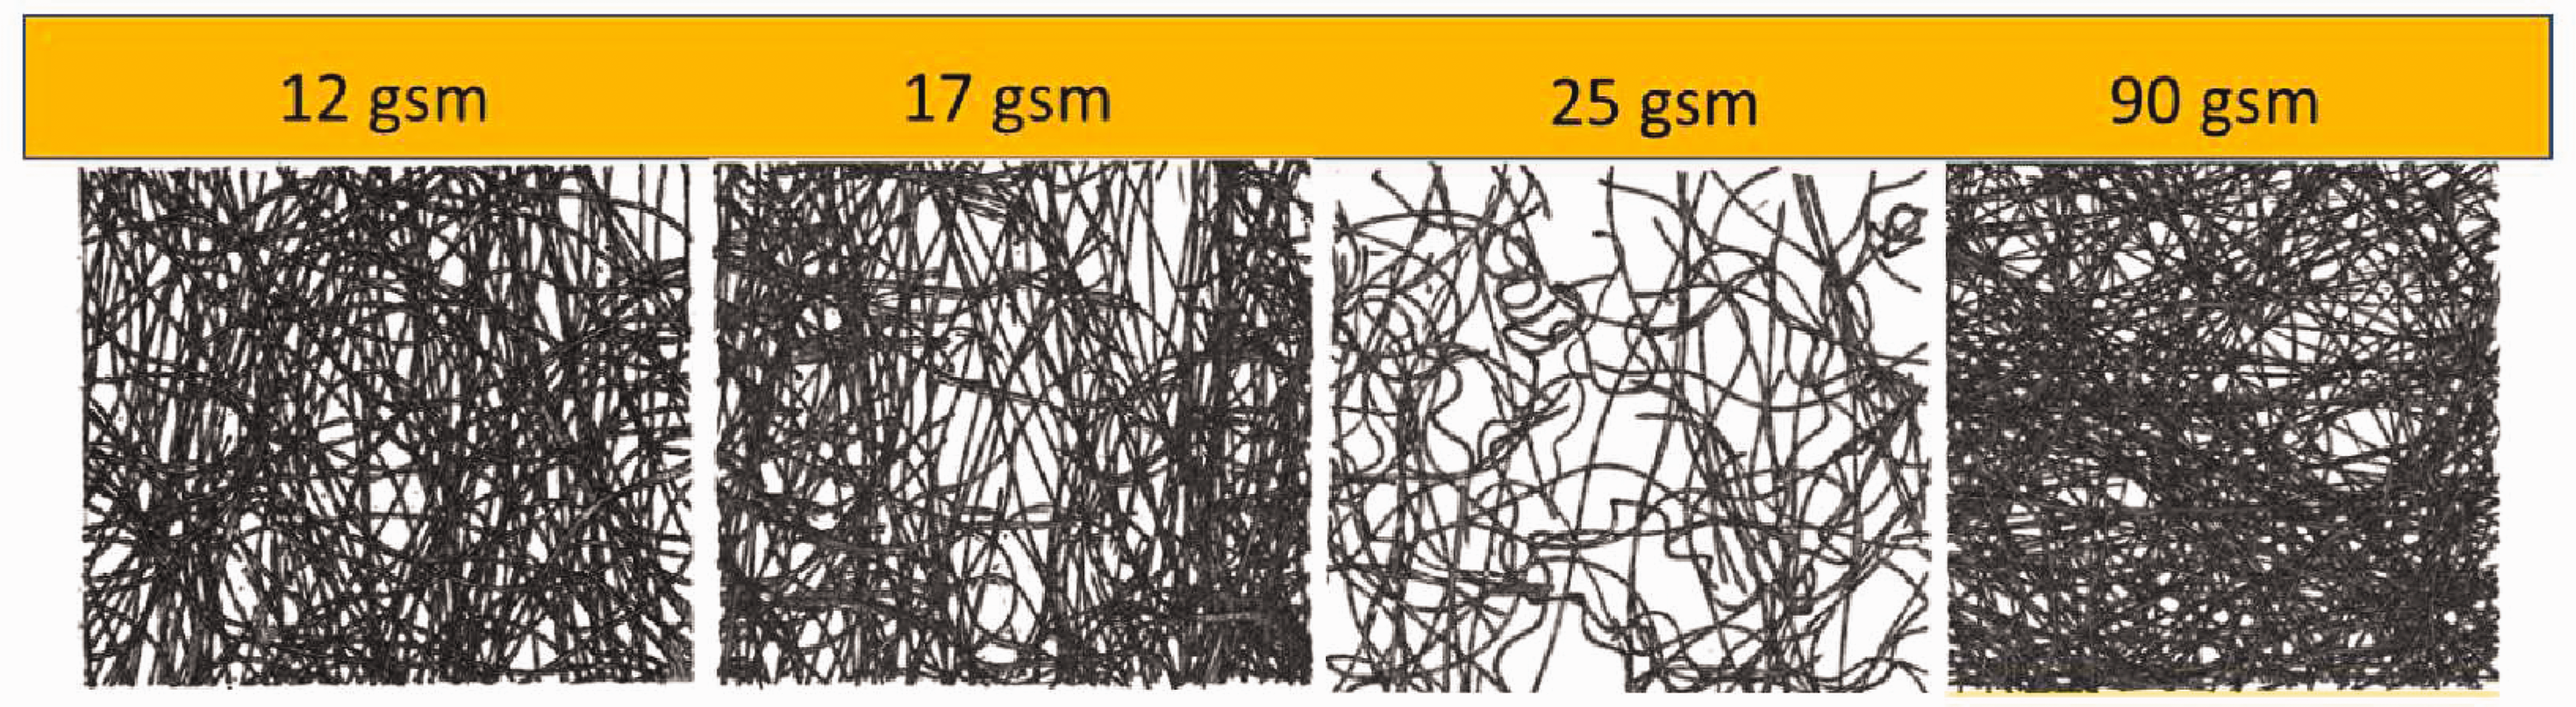
X-ray micro-computed tomography (CT) images of nonwoven webs.
Results with the errors are provided in Table 2. Errors in ρact (%) indicated that the basis weight for all fabrics with a sensitive scale was nearly the same as the manufacturer’s stated value. The values of error in ρest (%) obtained for all fabric samples showed that the basis weight for all fabrics measured with the algorithm provided accurate results compared with the traditional cut-and-weight technique, which shows the accuracy of the developed method. The entire process developed in the algorithm can be used to evaluate and analyze uniformity of fabric-density throughout a web. In addition, the developed tool works efficiently for any RFNs, for various densities and manufacturing techniques, as well as for fine and coarse finishing.
The developed method can also be used to evaluate the basis weight along the specimen’s thickness direction by sectioning a 3D microscopic image that traditional 2D methods could not provide. This will allow us to understand the uniformity of the basis weight through TD. The method also provides the opportunity to evaluate the distribution of basis weight across the web, with such microscopic images showing the 3D geometrical arrangement of fibers, without micro-scale defects in nonwoven webs that traditional methods could not identify.22,23
Deviations of the data obtained with the new method from those with the cut-and-weight technique can be explained by an inherent spatial variability of nonwovens as well as errors due to sample preparation and measurements. The errors for the results given by the algorithm depend on the resolution of the X-ray µCT and the used SEM kit. Lighting conditions, resolution and blurring in SEM could also affect the results. Overall, the developed algorithm provided the results close the manufacturer’s stated basis weight values.
Conclusions
The developed parametric algorithm for basis weight assessment was tested with various RFNs and validated using the cut-and weight testing technique. This novel algorithm was developed to estimate the basis weight of a RFN accurately, using reconstructed X-ray µCT images. It is able to compute and estimate the fabric density not only for nonwovens but also for a broad range of random structures with different densities. Unlike the existing algorithms based on 2D microscopical images used in online techniques, this method was successfully tested for nonwoven webs produced with various manufacturing parameters such as complex bonding in TC fabrics and random patterns of bonding in TAB fabrics. The technique such as cut-and-weight did not depend on microscopical images, and could not reveal whether the measured samples obtained any defects. Traditional methods based on 2D microscopical images such as SEM do not properly account for fibers underneath the top layer, and depend on many parameters such as resolution and lighting conditions, etc. These limitations of methods based on 2D microscopic images are overcome by the developed technique considering 3D microscopic volumes. In addition, it could be applied to structures with different fiber diameter/cross-sections such as metal/polymer fibers, wood, and fibrous systems in biological systems such as collagens, tissues and ligaments, etc. Also, this tool can be used to analyze and evaluate the uniformity of basis weight. The outcome of this research creates new opportunities for the manufacture of new RFNs with a correct basis weight value and provides flexibility to determine the web properties of a structure in any locations. It provides the opportunity to identify the homogeneity across the fibrous structure by identifying the distribution of local values of basis weight, while detailed 3D microscopic images also show the distribution of fibers in the structure that affects filtration, fluid absorption and other specific properties, including material anisotropy. However, there are some limitations to this method such as long processing time, sample preparation time, acquiring fine-tuned parameters and precaution measures which are necessary when dealing with the source of X-rays and should be considered.
The developed algorithm will be used to evaluate and analyze the uniformity of the basis weight of different types of RFNs manufactured with various manufacturing techniques.
Footnotes
Declaration of conflicting interests
The author(s) declare that they have no known competing financial interests or personal relationships that could have influenced the work reported in this paper.
Funding
The author(s) disclosed receipt of the following financial support for the research, authorship, and/or publication of this article: This work was supported by The Nonwovens Institute of North Carolina State University, Raleigh, NC, USA (grant no. 19-234, 2020). Reicofil GmbH (Germany) and Dow (USA) generously provided materials for this study. Mann+Hummel GmbH (Germany) technically supported this project. This support is gratefully acknowledged.
Appendix
Details of fiber diameter measurements (in µm)
| Fiber diameter measured with SEM | ||||
|---|---|---|---|---|
| Parameter |
|
|
|
|
| Fiber diameter measurements | 20.3 | 22.1 | 17.2 | 24.1 |
| 20.2 | 22.3 | 17.1 | 24.2 | |
| 20.1 | 22.0 | 17.2 | 23.9 | |
| 19.9 | 22.1 | 17.3 | 23.8 | |
| 20.1 | 21.8 | 16.9 | 24.1 | |
| SD | 0.13 | 0.16 | 0.14 | 0.15 |
| Average | 20.12 | 22.06 | 17.14 | 24.02 |
SD: standard deviation; SEM: scanning electron microscopy.