
Abstract
Image processing has been employed in a variety of fields since the advent of image processing techniques. One of these fields is textiles. The existence of any defect in a fabric is one of the most important factors affecting the quality of the fabric. There are many types of fabric defects that can occur for various reasons. It is critical to figure out what caused the defect and fix it so that it does not occur again. Automation of fabric defect detection has recently attracted a great deal of interest in view of the development in artificial intelligence technology to be able to discover defects with a high degree of success and to limit the harm to the manufacturer. This study focuses on analyzing different feature extraction methods and different classifiers and discussing the advantages/disadvantages of the combinations and, unlike other studies, using feature fusion for feature extraction. Different cases have been created that handle fabric datasets from different angles and apply different methods of feature extraction (convolution neural network, minimum relevance and maximum redundancy) and classification (ensemble learning (EL), k-nearest neighbor, support vector machine (SVM)) for separating defected and un-defected patterned and un-patterned fabrics. ResNet18 is the convolution neural network-based model with the highest performance in feature extraction, while EL and the SVM allow us to achieve close and highly successful results in classification. When feature fusion is used, ResNet18 & GoogLeNet & SVM is the most successful combination compared to the others (94.66%).
Cloth imperfections alter how fabric appears. Numerous negative effects, including consumer unhappiness and financial loss, result from this. A fabric's price drops by 45–65% if there is a defect in it. 1 Intervention as soon as a defect appears is essential for stopping fabric defects. Traditionally, human eyesight has been used to identify fabric defects. Despite being a ubiquitous sort of control, it has several drawbacks, such as a loss of human power, consumption of time, low success rate, higher cost, and high rate of error. Given the drawbacks, traditional defect control cannot fully live up to expectations. Numerous experiments on autonomous fabric management have been done over the past 20 years to prevent these drawbacks. 2
To automate systems run by human power, defect detection systems have been created. Automatic detection has several benefits, including lessening the loss of human power, cutting down on the time and labor expense needed for control, providing more precise results, and recording the detection process to catch future defects. 3 Some of the automated systems in this field are merely designed to identify problems; others classify them after doing so. Studies to categorize defects only do so for certain defect types due to the vast array of defect types that might exist in textiles.
The objectives of this study can be listed as follows:
to perform fabric defect control, which is traditionally done using human power, with a high accuracy rate via computer vision; to design a lower-cost automated system with higher success, instead of a costly control process with 70% success in the best case; to save the manufacturer, who wants to perform the control process automatically, from foreign dependency and to create a much more affordable domestic system.
This study consists of six sections. The rest of this study is as follows. In the second section, a detailed literature review is included. The third section deals with the materials and the methods used in this study. In the fourth section, the proposed system is included. The fifth section includes experimental results. The conclusion and future works are given in the sixth section.
Related works
There are several types of automated fabric defect detection and classification systems recommended in the literature. It is seen that the artificial neural network (ANN) is used in many studies. Kuo and Lee, 4 Huang and Chen, 5 Kumar, 6 Behera and Mani, 7 Büyükkabasakal, 8 Çelik et al., 9 Jmali et al., 10 and Rebhi et al. 11 propose ANN-based studies. Kuo and Lee 4 employ a feedback neural network with three defect characteristics retrieved (maximum length, maximum breadth, and defect gray level). Huang and Chen 5 create a fuzzy logic-based neural network. Kumar 6 identifies the defects in twill and plain-woven textiles using a feedforward neural network. Behera and Mani 7 use the discrete cosine transform (DCT) in conjunction with a back propagation neural network. Principal component analysis (PCA) has been used by Büyükkabasakal 8 to create a recognition system based on ANNs. Feed-forward neural networks have been employed by Çelik et al. 9 after filtering and morphological operators. The five characteristics (vertical energy, horizontal energy, diagonal energy, energy mean, and energy standard deviation) retrieved from the DCT of H-images (homogeneity images derived from input images) are used by Rebhi et al. 11 In recent years, the popularity of convolutional neural networks (CNNs) has increased and the CNN has been used not only in this field, but also in many studies in different fields. Wei et al. 12 suggest a new approach that combines compressive sensing with the convolutional neural network (CS-CNN). Şeker et al. 13 employed an auto encoder to improve feature extraction performance in their system.
In this study, the public part of the Tilda dataset is used. The studies that will be mentioned next are among the studies using the Tilda dataset. While some of these studies distinguish the images as defected/un-defected, some perform classification according to defect types. Gabor wavelets,14–16 PCA,14,15 independent component analysis (ICA), 17 the local binary pattern (LBP),18,19 the gray level co-occurrence matrix (GLCM),18,19 support vector machines (SVMs),19–23 and k-nearest neighbors (KNN)21,22 are used in the majority of fabric defect detection studies. The methods of the histogram, co-occurrence matrix, and shape descriptor are used for feature extraction, while the SVM is used for classification in the study of Murino et al. 20 Images are divided into sub-windows in the study of Basibuyuk et al. 24 Autoregressive coefficients are calculated using randomly selected un-defected images. Jing et al. 25 use the distance matching function to determine the frequency of repetition of the pattern in patterned fabric, and two properties calculated using the regular band are determined as fabric defects. To detect defects on fabrics with complicated textures, Qu et al. 26 develop a system based on a dual-sale over-complete dictionary. The disadvantage makes it unsuitable for online fabric assessment. Kure et al. 16 investigate homogeneity in fabric images. Local neighborhood analysis is used to measure homogeneity. After partitioning the images into blocks, feature vectors extracted from each block are used in a regression-based method, which is named PG-LSR, in the study of Cao et al. 27 The study of Kaynar et al. 18 is the first study using an ANN on this dataset. Liu et al. 28 use the ELM (extreme learning machine) method after extracting the features from segmented defects in fabrics. Jing et al. 29 use a CNN after division of the images into patches. Jeyeraj and Nadar 30 use a transfer learning-based CNN algorithm called AlexNet. The effect of different block sizes in the study of Cuifang et al. 23 has been examined using a pyramid histogram of edge orientation gradients (PHOG). It is seen that the detection rate increases as the size increases.
It is feasible to expand the number of prior studies mentioned above that are comparable. When looking at the studies using the Tilda dataset, the analyzed studies attempted to identify patterned or non-patterned materials within themselves. Among the studies examined, there was no study that performed classification by bringing together the patterned and un-patterned fabrics in the Tilda dataset. For example, while the samples in the c1r1 folder in cd1 are classified within themselves, the c1r3, c2r2, c2r3 folders are also classified within themselves. In no study were the samples in the c1r1, c1r3, c2r2, c2r3 folders brought together and the methods were not tested as such. When a product that provides fabric control is produced, not only one fabric type, but also fabrics with a large number of patterns and textures, will pass through the control band. Therefore, testing on fabrics of different patterns and textures may be beneficial before converting the developed methods into products. The general contribution of this study is to create different sets by bringing together the patterned and un-patterned fabric samples in the Tilda dataset and to perform many tests on these sets.
Material and methods
Tilda dataset
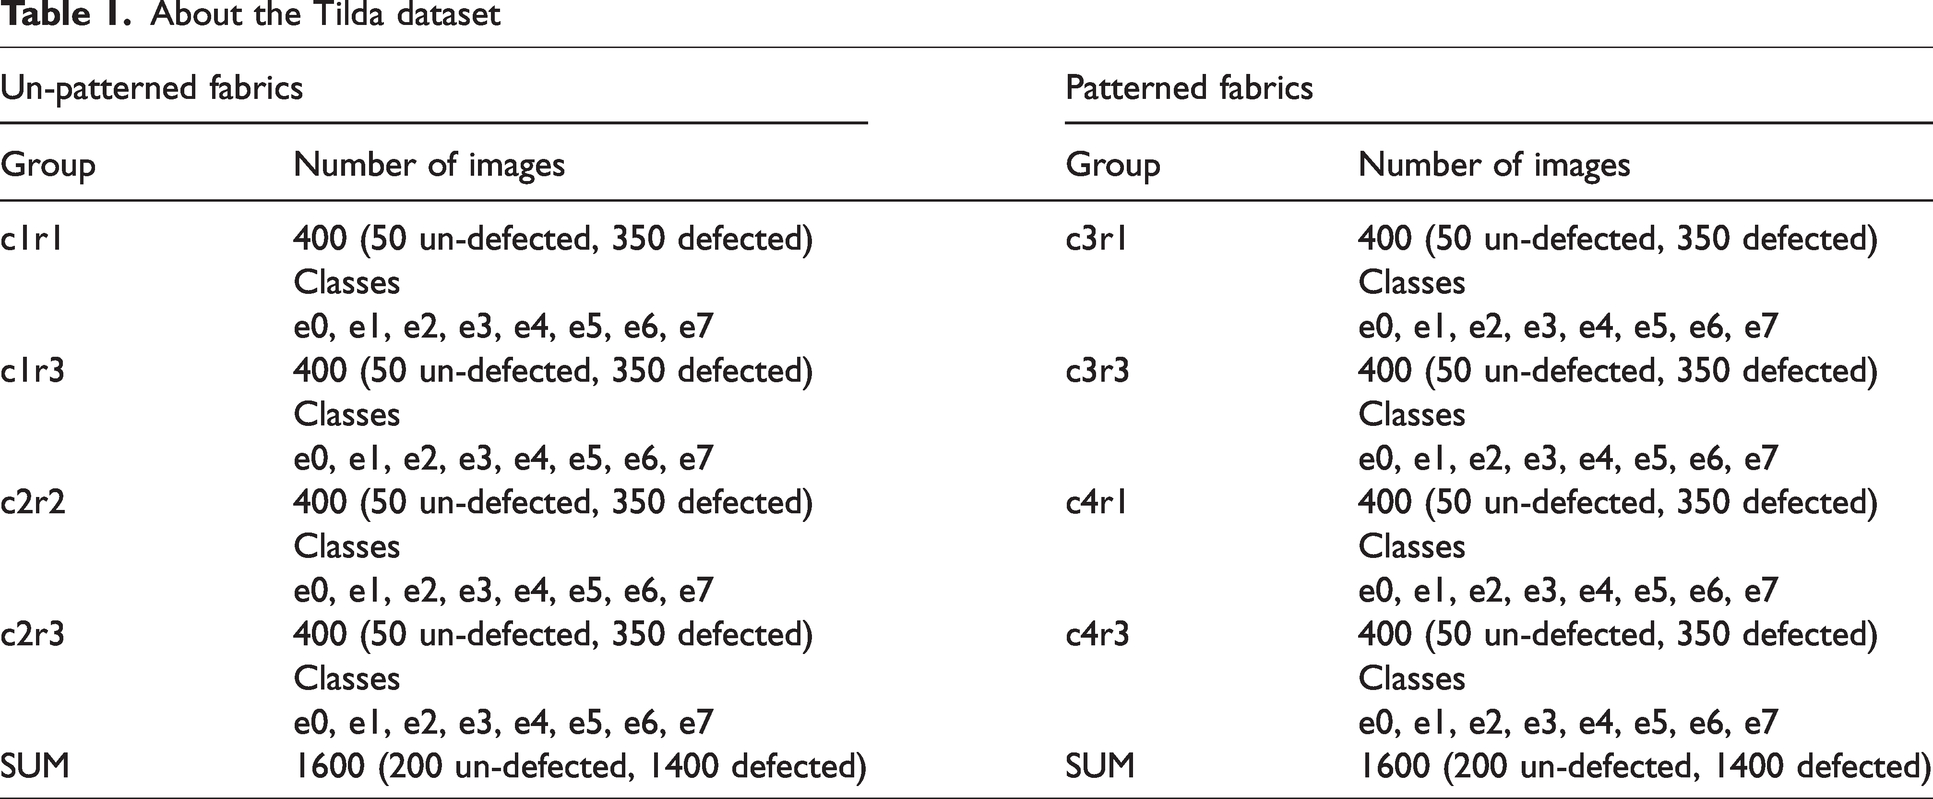
The study is tested on the public part of the Tilda dataset. The Tilda dataset has images with 768 × 512 pixels. Images have been resized before processing operations. The dataset consists of two folders, such as cd1 and cd2 (Figure 1). Both folders consist of four groups (Table 1). While four groups in cd1 (c1r1, c1r3, c2r2, c2r3) consist of un-patterned fabric samples (Figure 2), the other four groups in cd2 (c3r1, c3r3, c4r1, c4r3) contain patterned samples (Figure 3). Each group is divided into eight subdirectories (e0, e1, e2, e3, e4, e5, e6, e7), and each contains 50 samples. Defect-free samples are found in e0, while samples with various types of defects are found in other subdirectories. The un-defected fabric is the fabric in which the texture repetition is not broken.
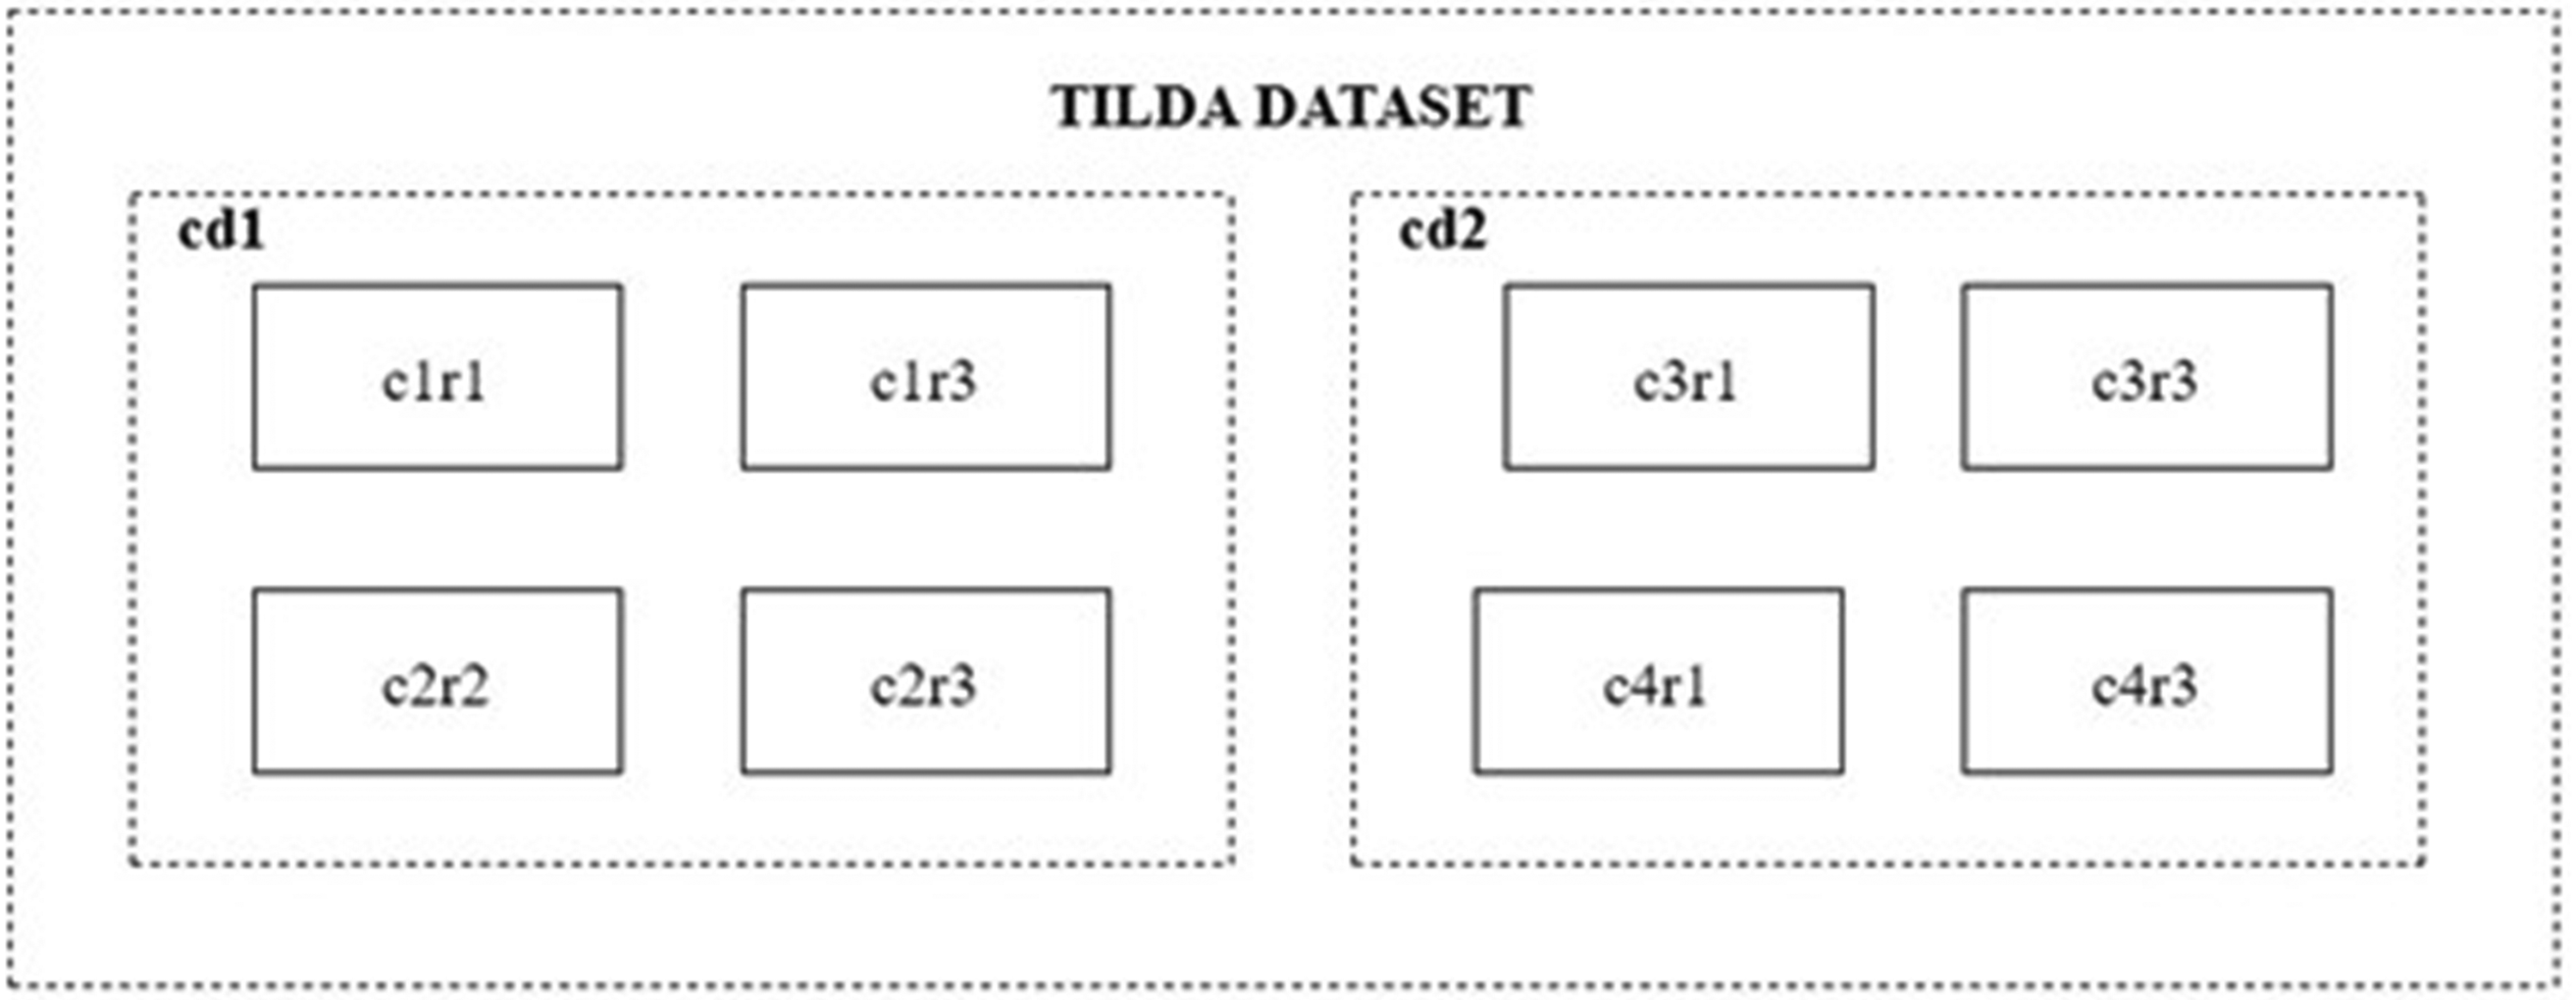
Tilda dataset.
About the Tilda dataset
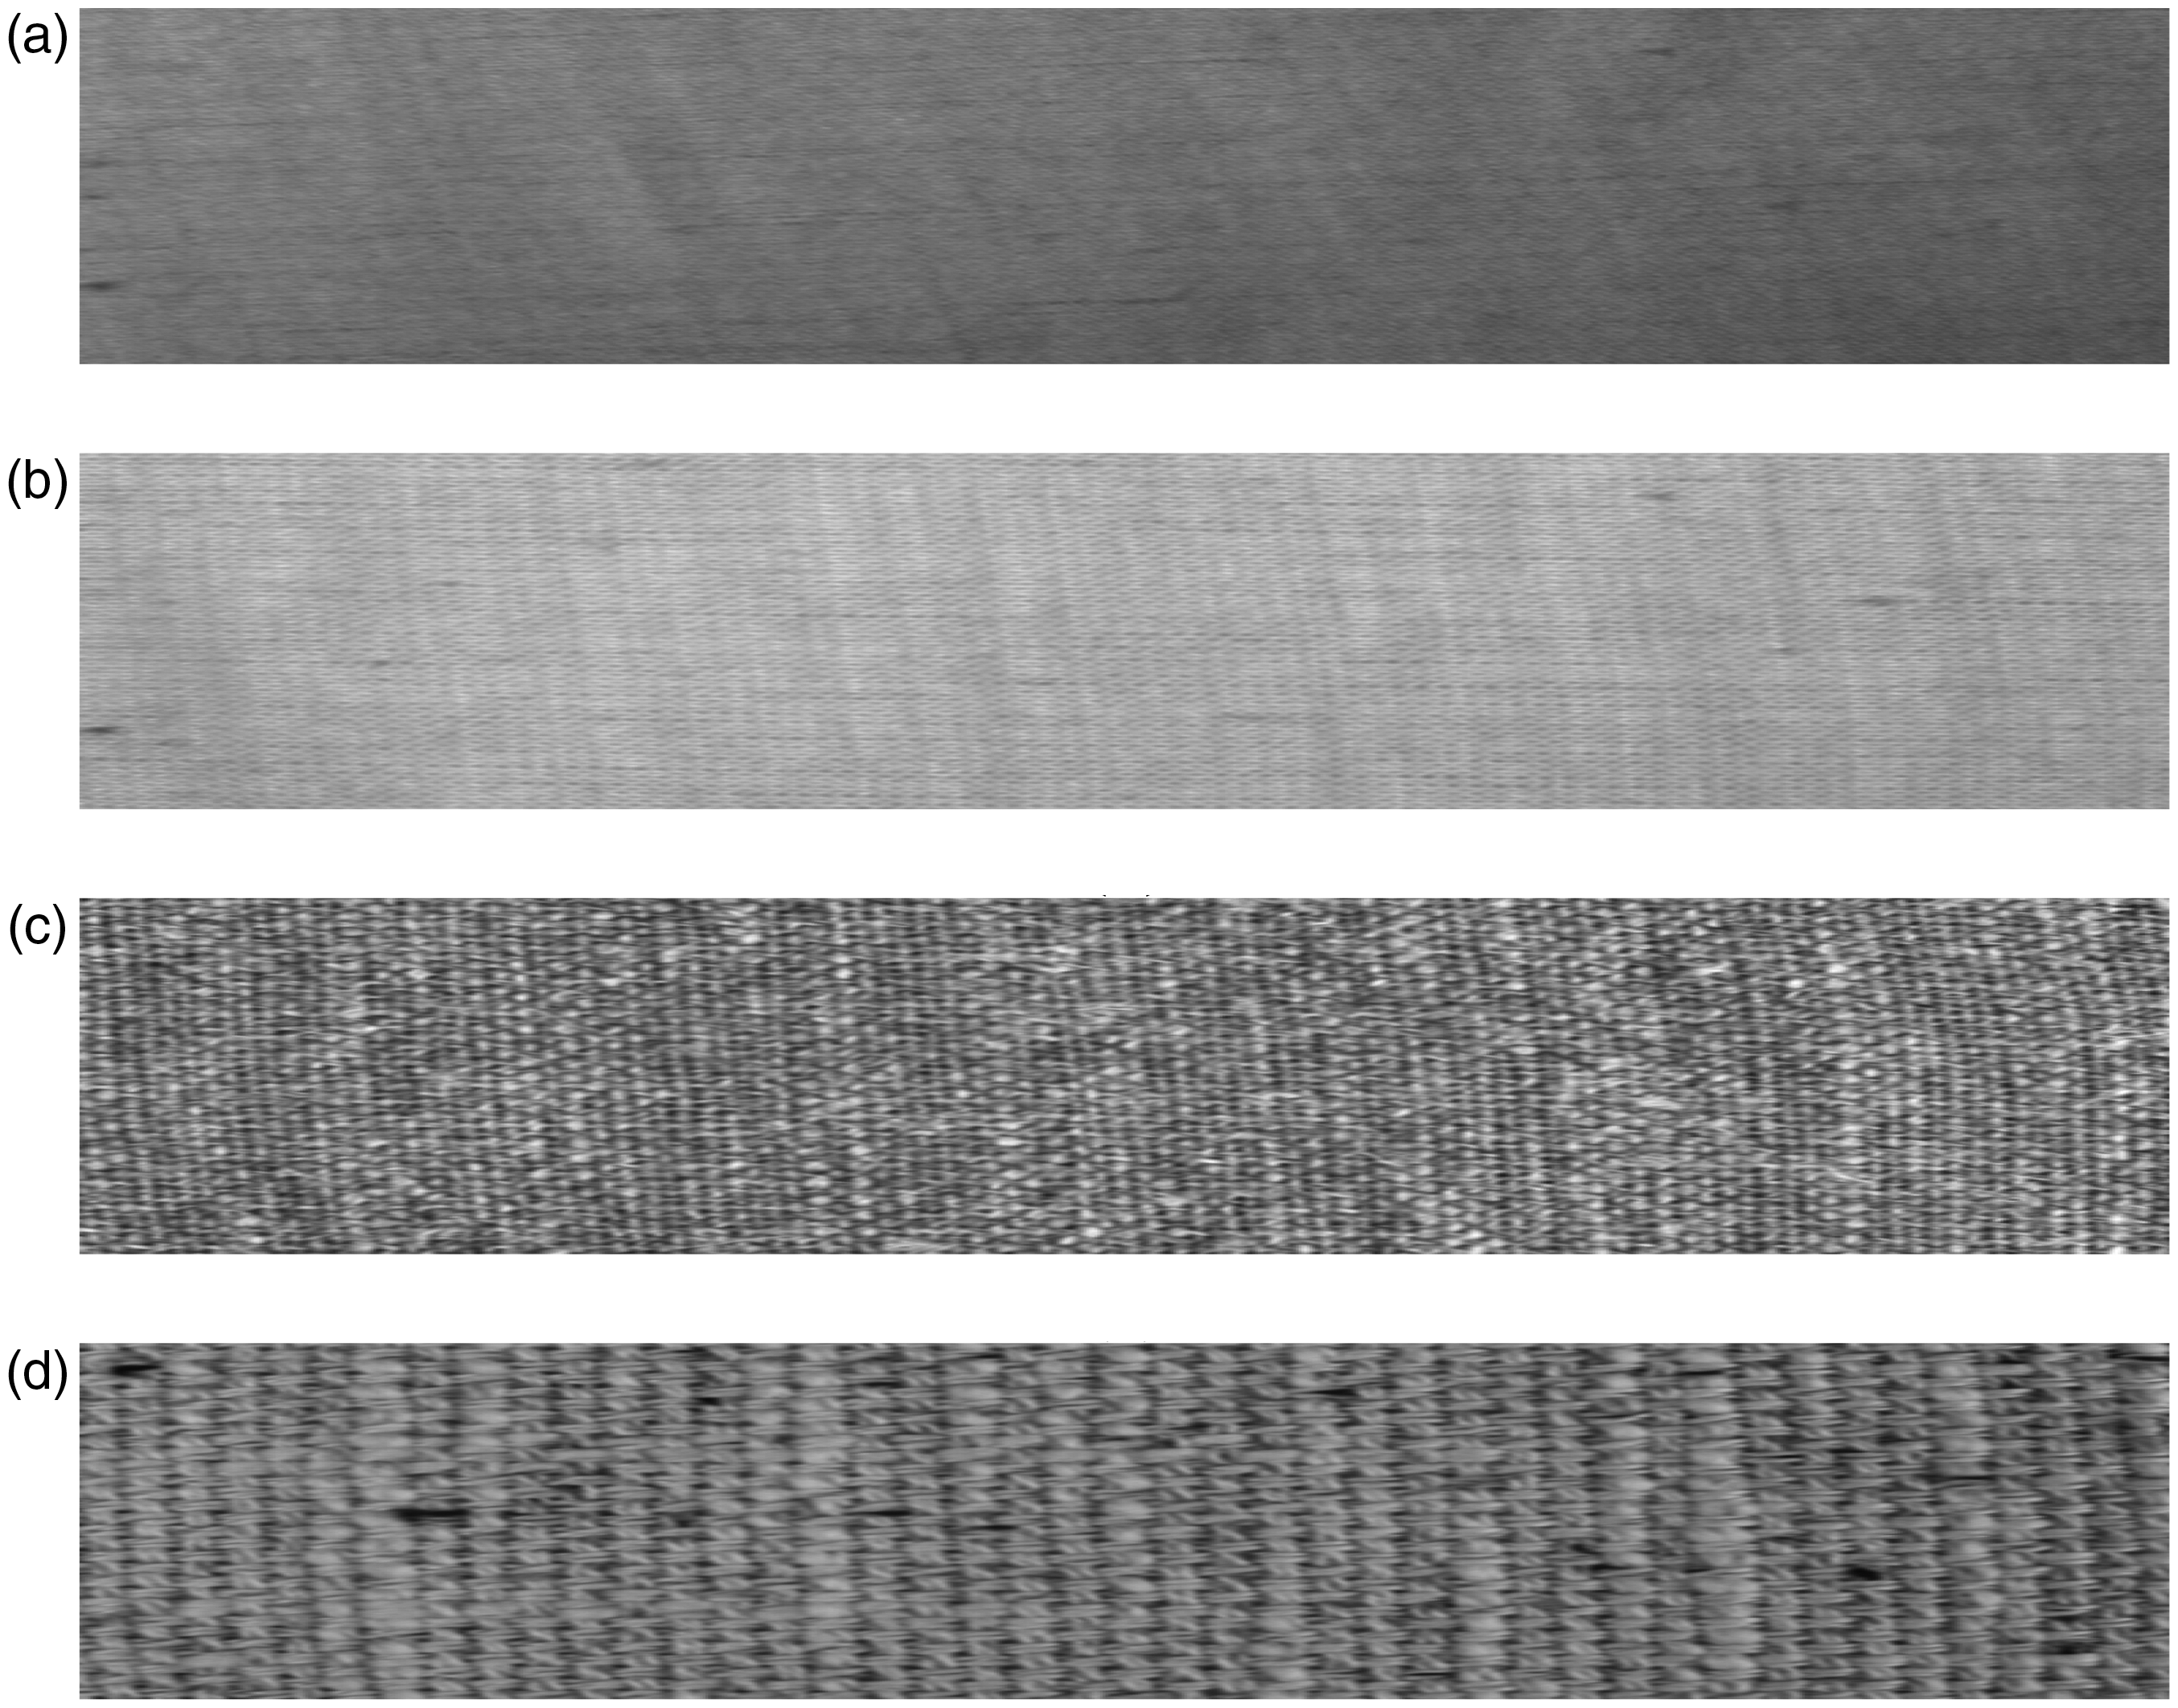
Un-patterned fabric samples of the Tilda dataset: (a) c1r1; (b) c1r3; (c) c2r2 and (d) c2r3.
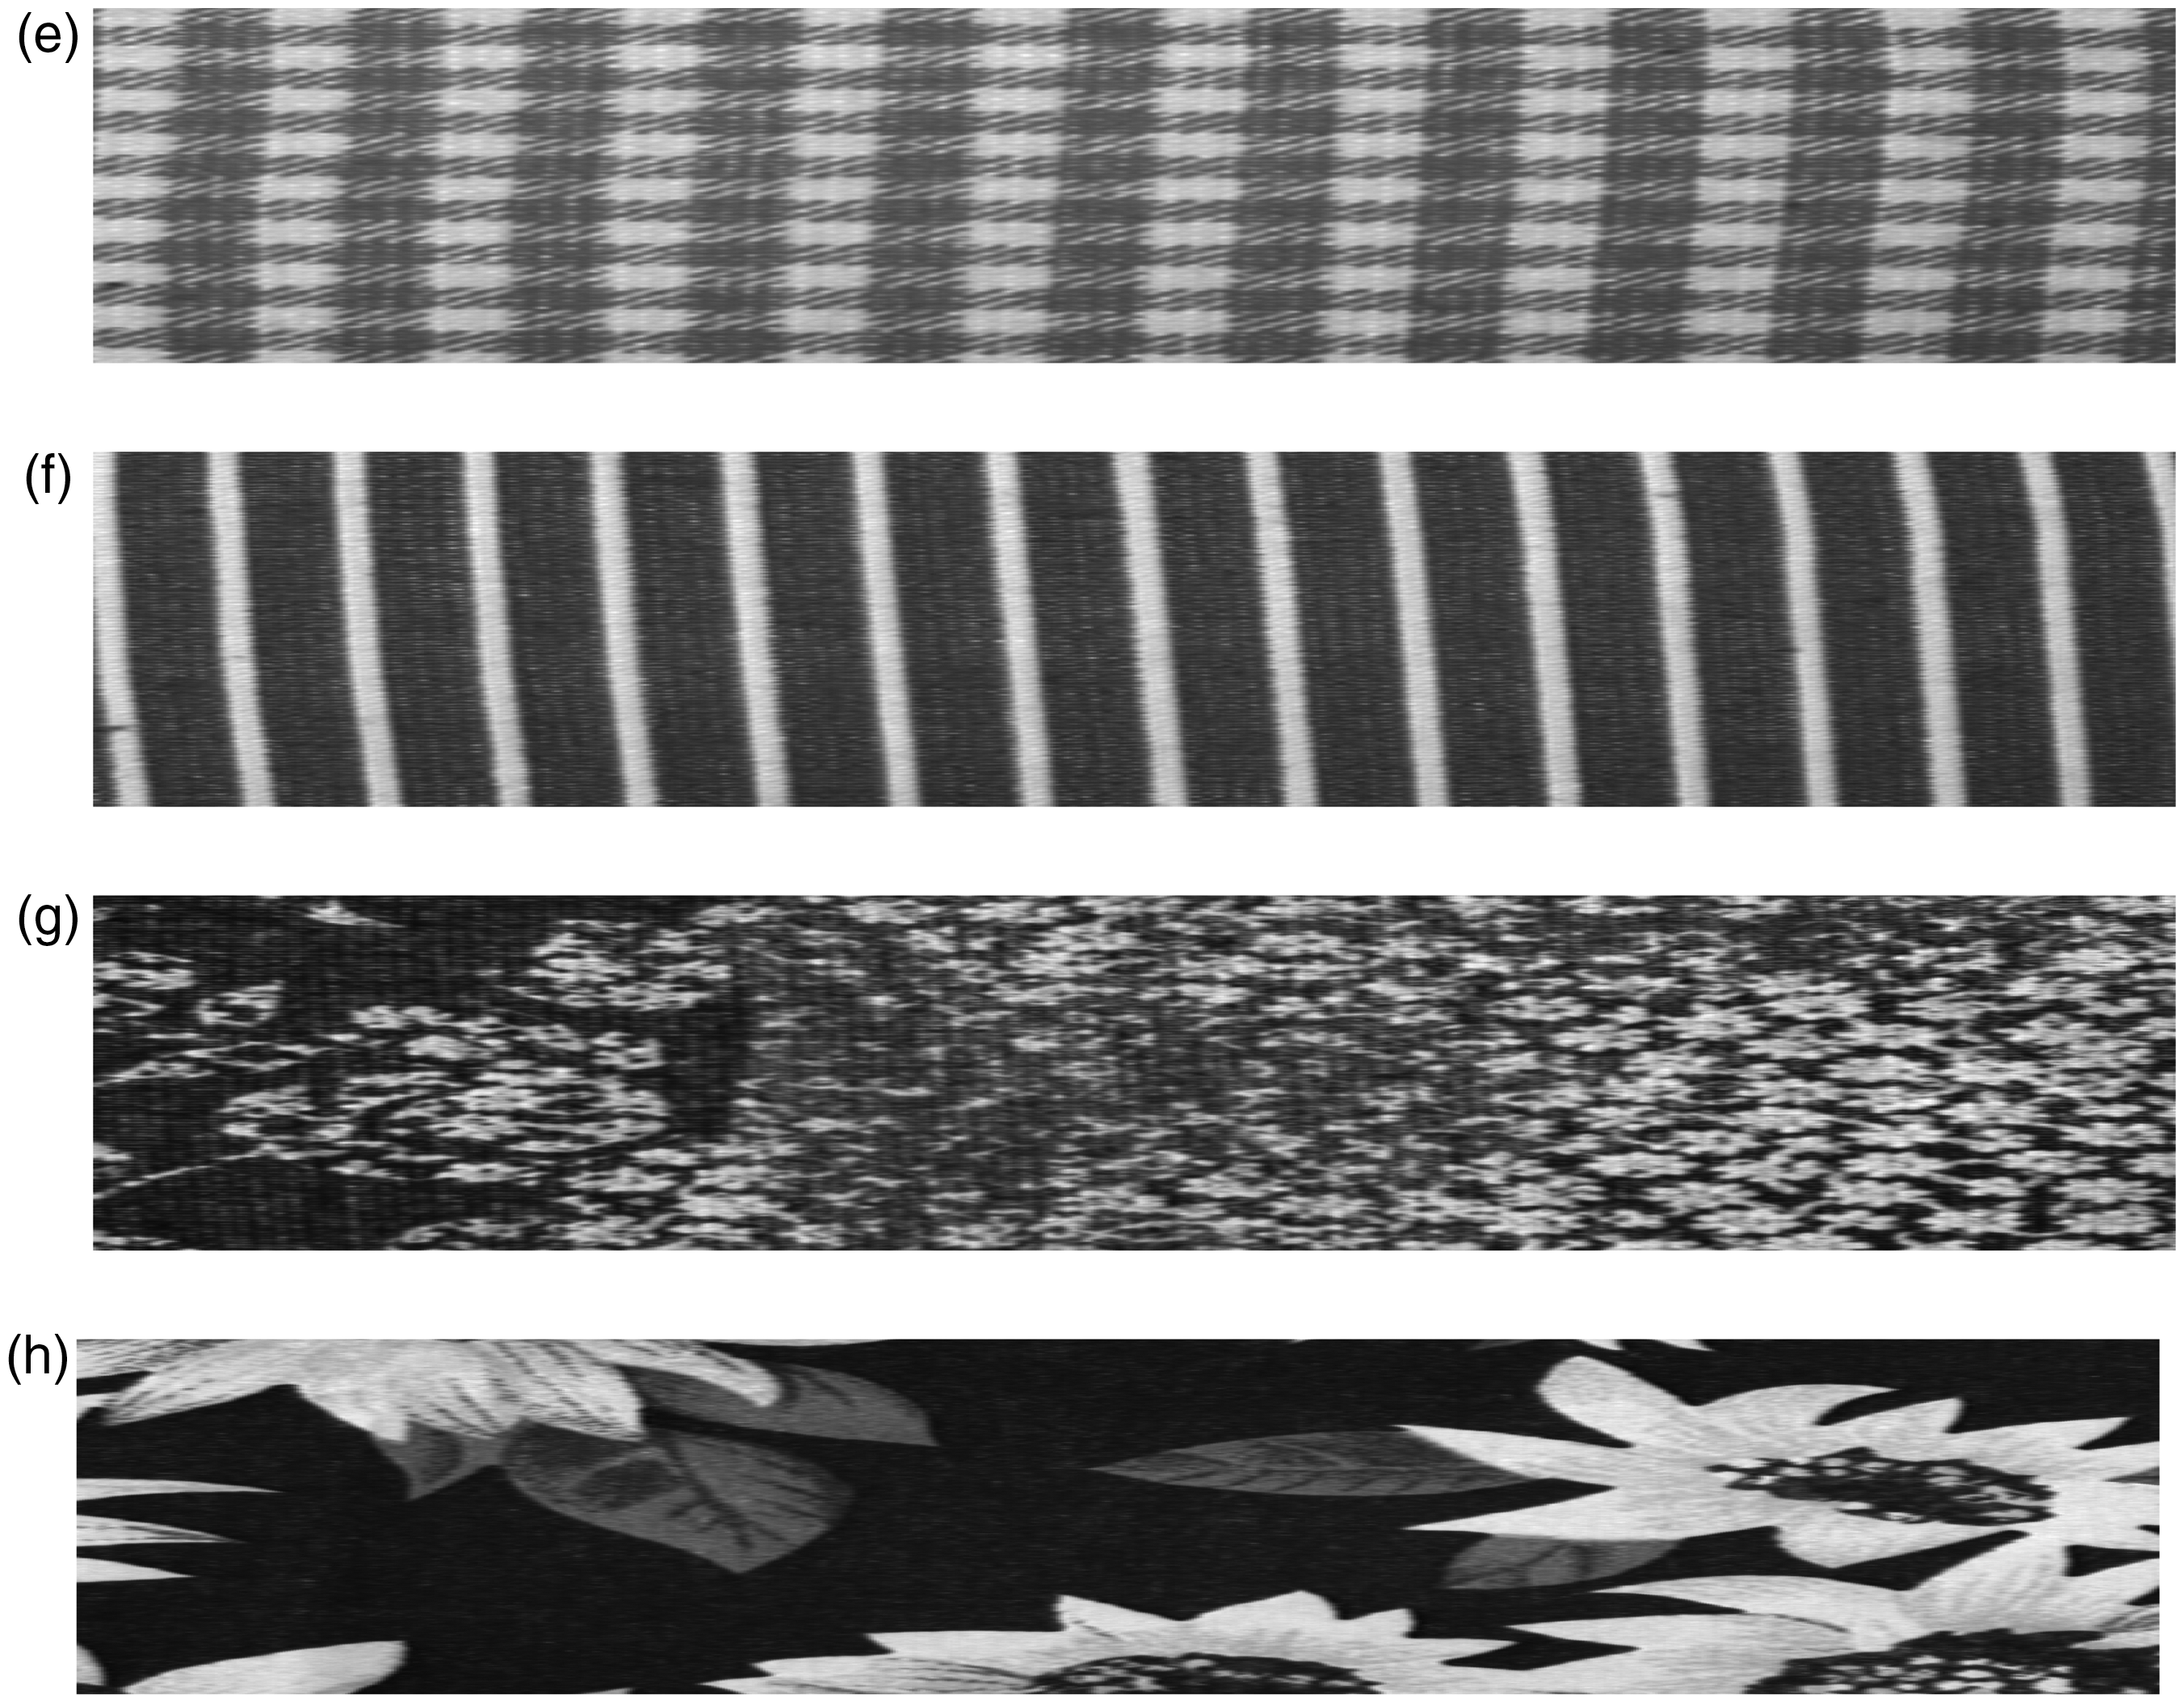
Patterned fabric samples of the Tilda dataset: (e) c3r1; (f) c3r3; (g) c4r1 and (h) c4r3.
CNN-based feature extraction
Deep learning is a sub-group of machine learning and is a multi-layered approach. 31 There are many studies using deep learning in the literature. Deep learning is used in various fields, such as image processing, video processing, signal processing, object recognition, the defense industry, and robotics. It uses many layers of nonlinear processing units for feature extraction and conversion. The output from each previous layer is used by each subsequent layer as input. There are many different types of deep learning architectures established by increasing the number of layers in ANNs. The CNN is one of these architectures. The CNN is a multi-layer ANN model created specifically for computer vision applications. It is an approach that provides higher performance compared to other classification methods. On the other hand, the drawback of the CNN is the requirement for powerful hardware resources. The basic layers of CNN-based models are listed as in Table 2. In our study, we tested the performances of four CNN-based models, namely ResNet18, ResNet50, GoogLeNet, and AlexNet (Figure 4).
Basic layers of the convolutional neural network (CNN)
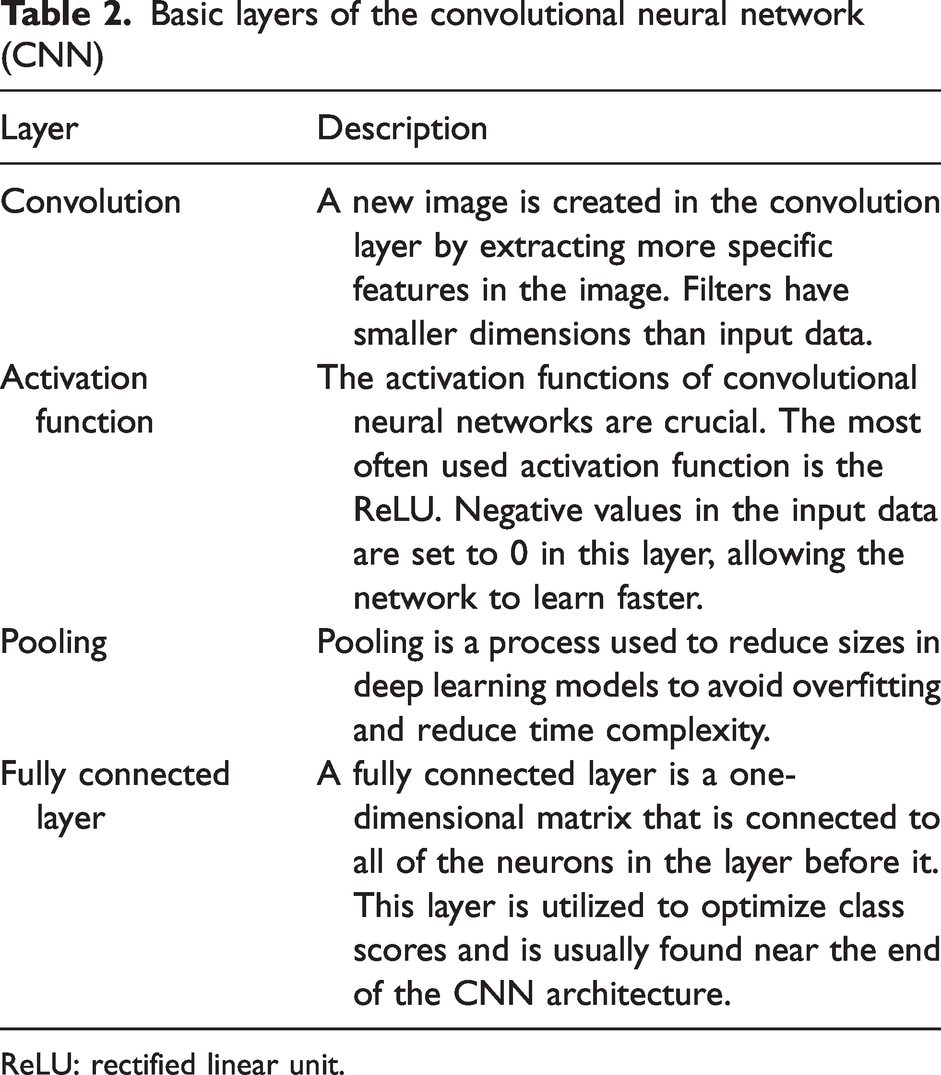
ReLU: rectified linear unit.
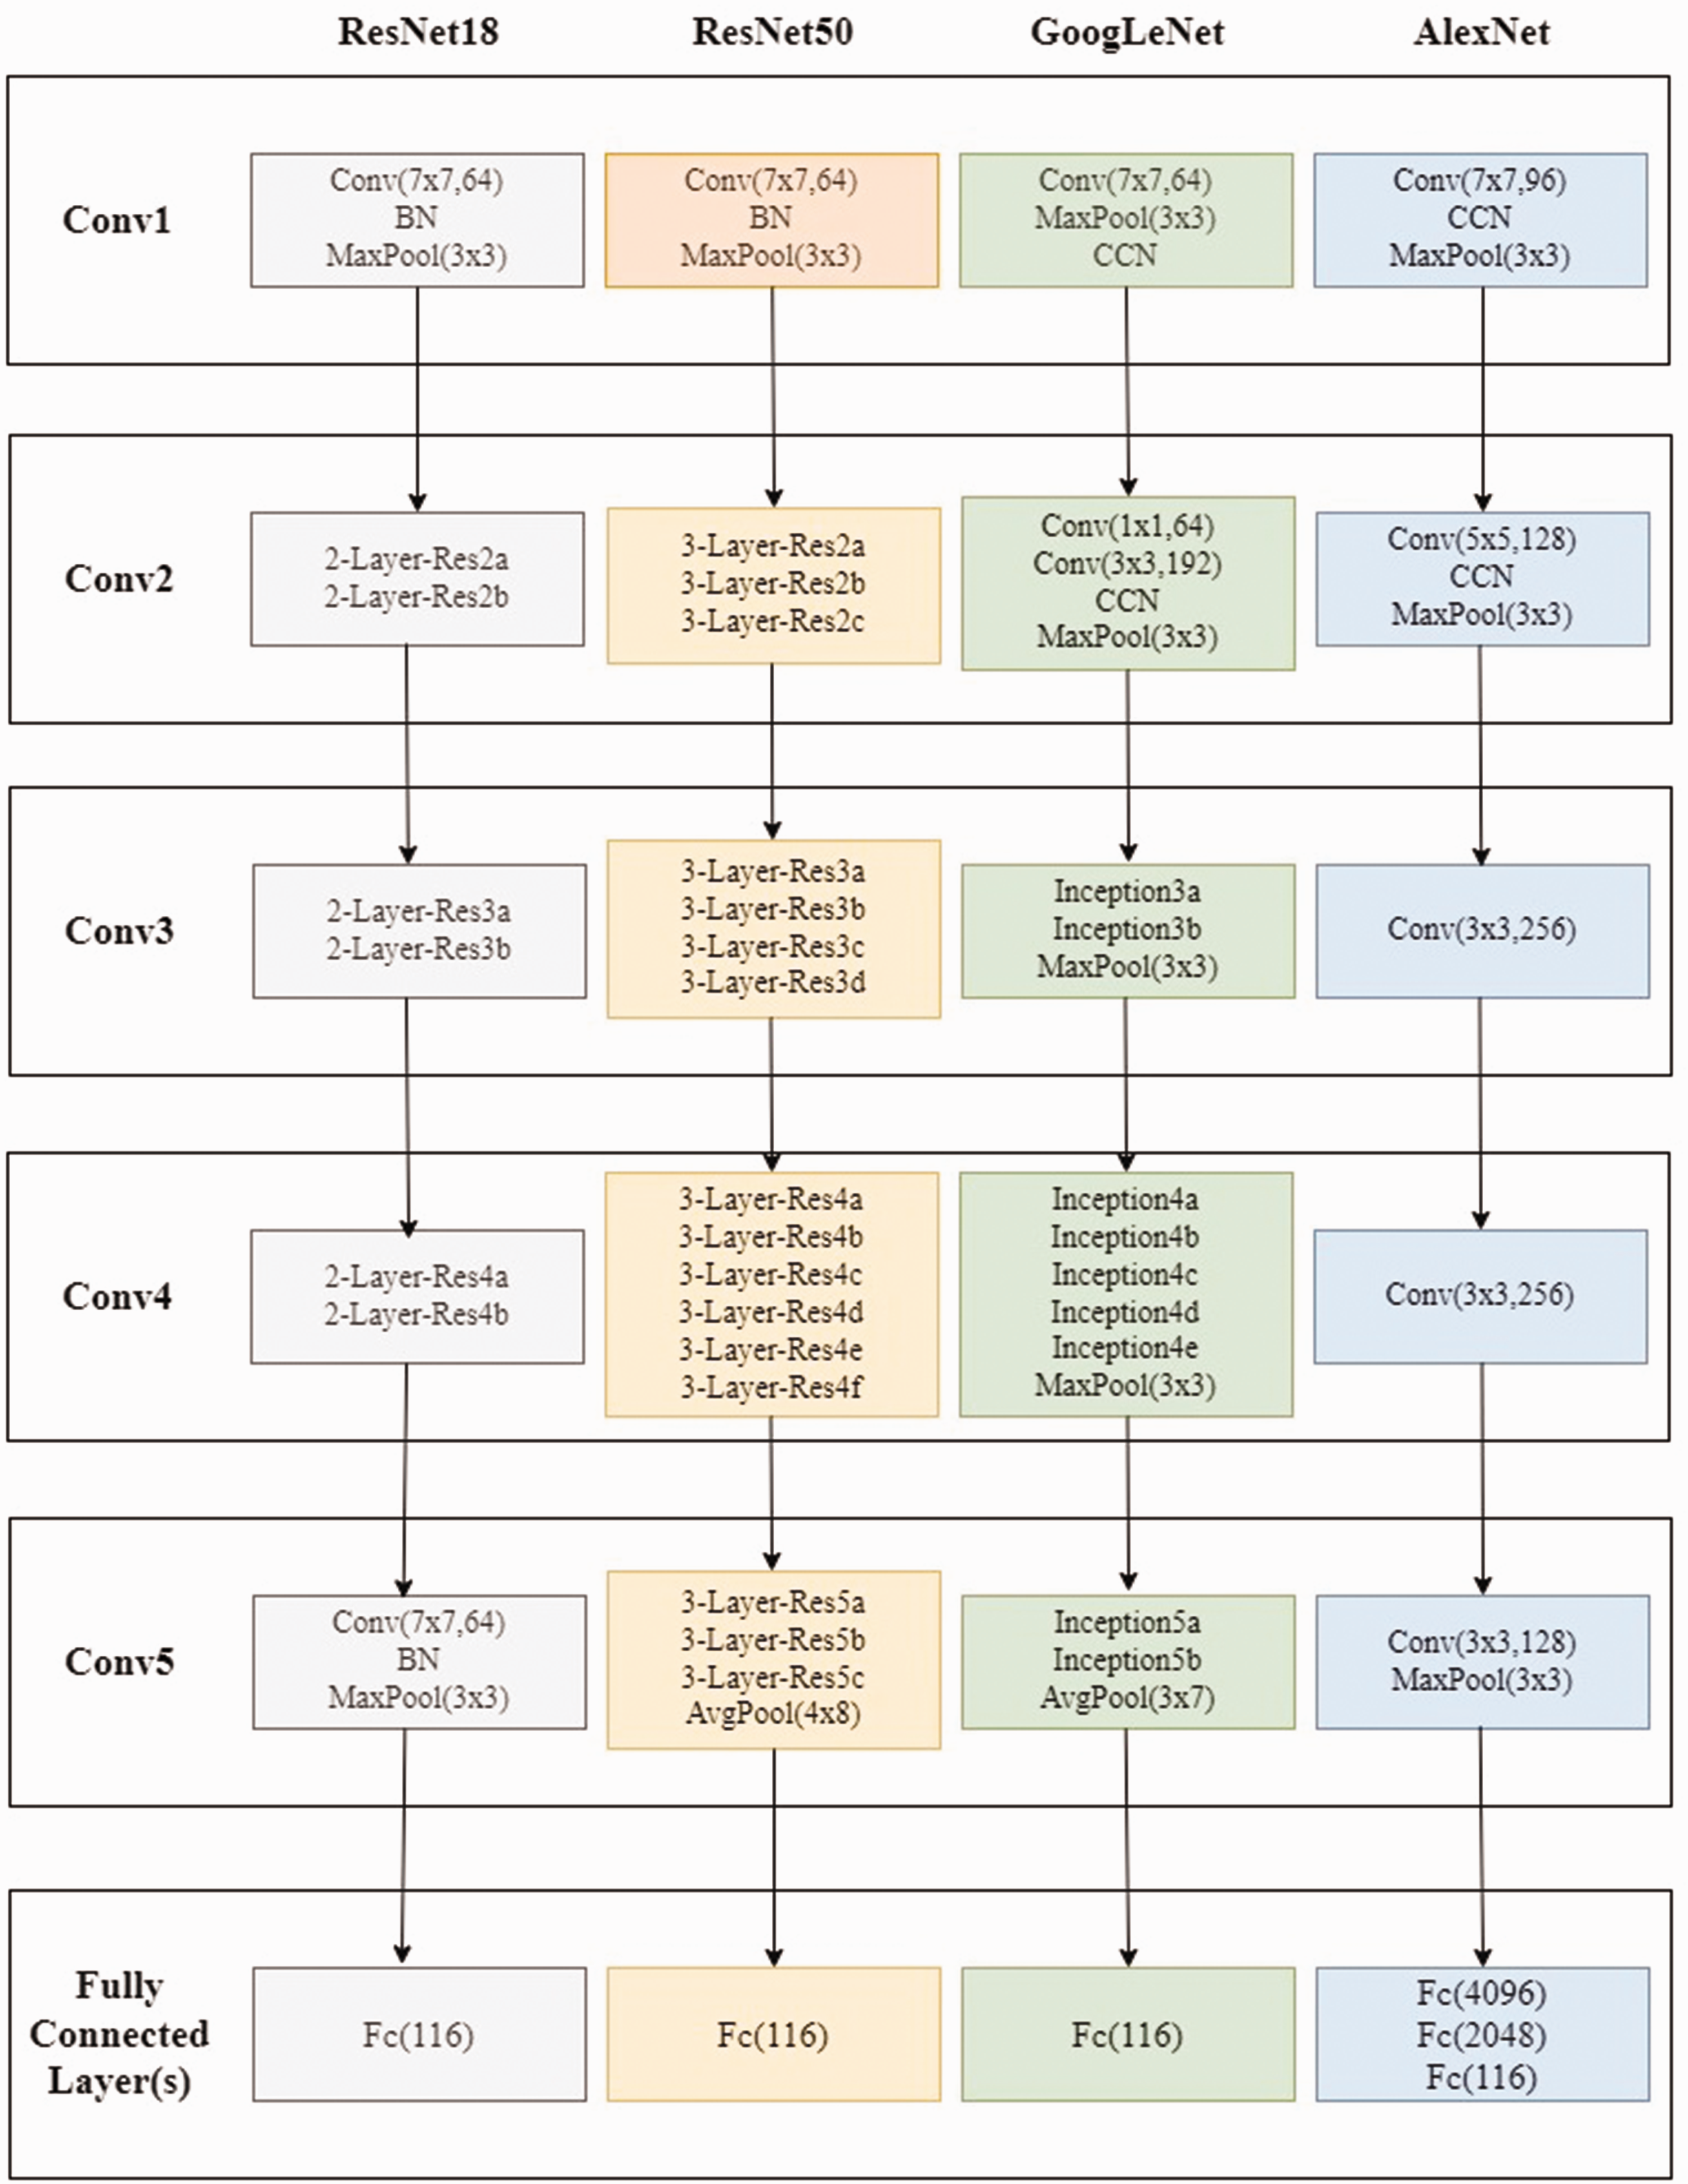
Convolutional neural network (CNN) models used for our study. 32
ResNet
ResNet is a pre-trained CNN algorithm. 33 It has been trained on more than one million images. ResNet is the abbreviated form of residual network. It has different versions, such as ResNet18, ResNet50, ResNet101, and ResNet152. They include 18, 50, 101, and 152 layers, respectively. As the number of layers increases, the accuracy rate increases, and the execution time also increases. The sizes of input images must be 224-by-224 for the ResNet architecture. ResNet18 and ResNet50 have been used in this study.
GoogLeNet
GoogleNet (also known as Inception v1) is a pre-trained CNN algorithm, like ResNet18. 34 The sizes of input images must be 224-by-224 for GoogLeNet. It has an architecture consisting of 22 deeper layers with fewer parameters compared to other networks. 35 Therefore, it gives higher successful results in less time.
AlexNet
The AlexNet architecture, which won the ImageNet 2012 competition, is a type of CNN designed by Krizhevsky et al. 36 AlexNet is very similar to the LeNet network. However, it differs from LeNet in that it has more layers. The input dimensions should be 227 × 227 × 3 for AlexNet. Local response normalization (LRN) and dropout are new additions to this network. 37
Maximum relevance and minimum redundancy-based feature selection
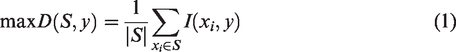
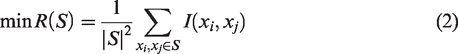
The maximum relevance and minimum redundancy (mRMR) method is developed by Peng et al.
38
Its main goal is to choose the best features. The mRMR feature set is generated by maximizing D(S, y) and minimizing R(S) for a feature set S. Equations (1) and (2) must be met concurrently:
Machine learning-based classification
Ensemble learning
Ensemble learning (EL) is a method for performing classification based on predictions and decisions from multiple classifiers. 39 It uses more than one classifier's information at the same time to apply each classifier's conclusion by consensus. This method outperforms a single classifier in most cases. The fact that the classifiers' mistakes differ from one another improves ensemble classification performance. Different subsets of the training dataset are used to achieve differences in the classifiers' predictions. To produce and train subsets of the training dataset, the bootstrap approach is utilized.
The predictions from the trained networks must be combined to arrive at an outcome. The choice of the right combined approach for the predictions has an impact on the classification performance in the EL method. The selection of the proper approach for the classifiers should be considered when choosing the combination technique. According to the combined procedures, sample selection for the training dataset, and processing processes, there are many EL approaches. Bagging, boosting, and voting are examples of these approaches.
k-nearest neighbor
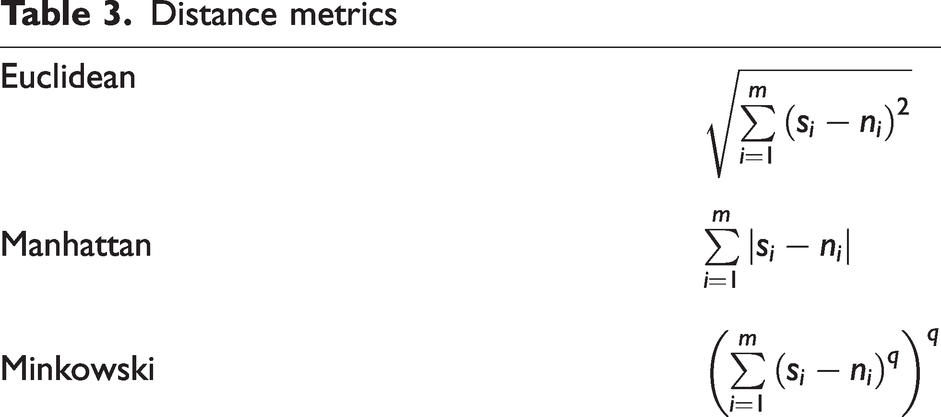
The KNN algorithm is one of the simplest and most widely used classification algorithms. A k value is determined for the operation of the algorithm. This k value means the number of elements to look at for classification. The distances between the sample element and the other elements in the dataset are calculated using different distance metrics. 40 Euclidean, Manhattan, and Minkowski are among the most known distance metrics. In Table 3, their equations are given for the m feature. In these equations, s is the sample and n is the neighbor. In the equation of the Minkowski metric, q is an integer number greater than 0 and the value for q is determined by experiments. To estimate which class the sample element in the dataset belongs to, the nearest k-neighbors of the element are used. The element is assigned to the class to which most neighbors belong.
Distance metrics
Support vector machine
The SVM is a machine learning technique proposed for classification problems in datasets where the patterns between variables are not known. It is a non-parametric classifier. This technique is also used for regression analysis, such as decision trees (DTs).
The dataset is separated into two classes: the training set and the test set. In this technique, the optimal hyperplane separating the classes is found using a labeled training set. 41 There may be more than one plane separating the two classes. An optimal hyperplane is the farthest plane to the nearest data points of the classes.
If the problem is two-dimensional, the hyperplane is a line. As the number of dimensions increases, it becomes difficult to find the optimal hyperplane.
Proposed system: multi-feature fusion
The ultimate objective of a classification system is to create the best classification model for a given task, such as classification of fabrics. There is more than one metric for a system to be considered successful. In addition to statistical-based performance metrics, such as accuracy, precision, recall, and the f1-measure, the system's classification time performance of a sample is also important.
An essential stage in an image classification system is feature extraction. The performance of the entire system is impacted by the choice of feature extractor. It is thought that statistical-based performance can be improved when the features of two different types of CNN-based models are combined. Simply concatenating the separately extracted features using multiple models has been named feature-level fusion. Thus, it is aimed to increase the system performance and to take advantage of the different features of different models.
The features extracted using Method 1 are represented by vector X, and the features extracted using Method 2 are represented by vector Y. The feature fusion is obtained by adding the Y vector after the last element of the X vector (Equation (3)). The visualized version of the proposed system is in Figure 5:

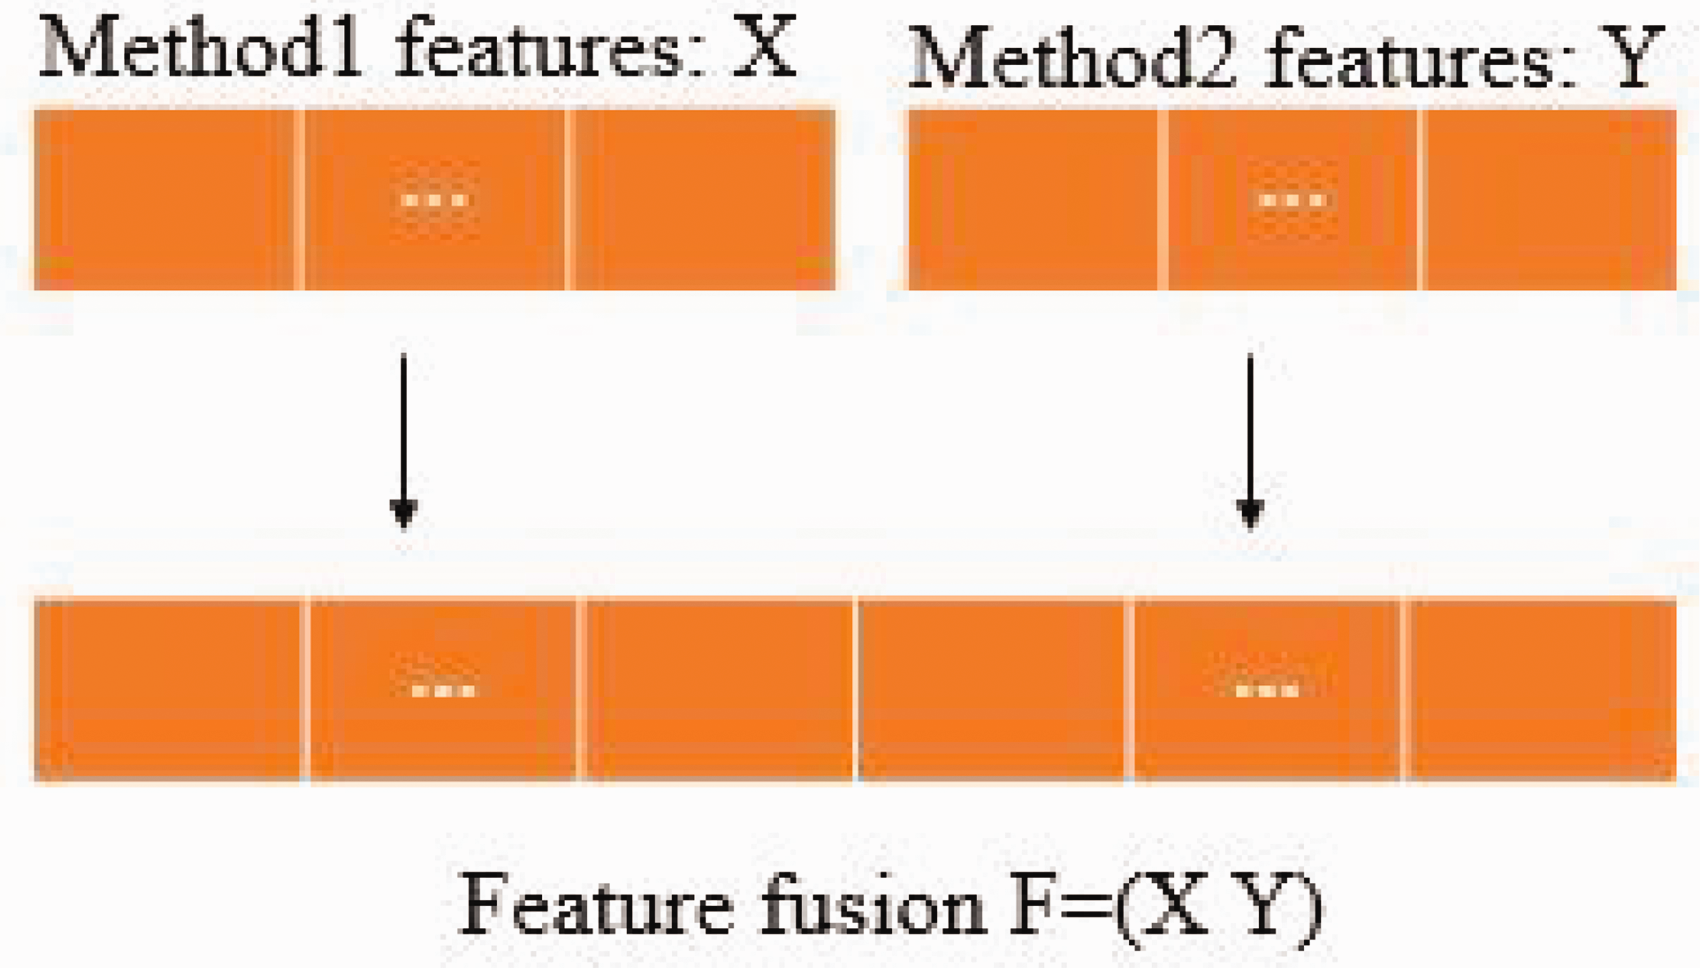
The procedure of the method proposed.
Multi-feature fusion increases the dimensionality of feature space, which leads to the problems of dimensionality and overfitting. 42 As a result, combining all of the features in this level is not possible. Therefore, mRMR-based feature selection is used after feature fusion to reduce feature size and computational cost. Then, the selected features are classified using a classifier. Three algorithms, namely EL, KNN, and the SVM, have been tested in the classification step.
Experimental details
Evaluation metrics
In this study, the experimental results have been compared in terms of precision, recall, and F-measure. These indicators are calculated using the true positive (TP), true negative (TN), false positive (FP), and false negative (FN). Precision investigates how many fabrics labeled defected are defected. Recall investigates how many TPs are correctly identified. The harmonic mean of precision and recall gives the F-measure.
The models' classification performance has been evaluated using 10-fold cross-validation. Thus, the dataset is split into ten equal parts as D1, D2, …, D10. 43 The training and testing processes are repeated 10 times. Partition Di for iteration i is used for testing while the remaining partitions are used for training (Figure 6). The arithmetic average of the results obtained from each partition gives the success of the method.
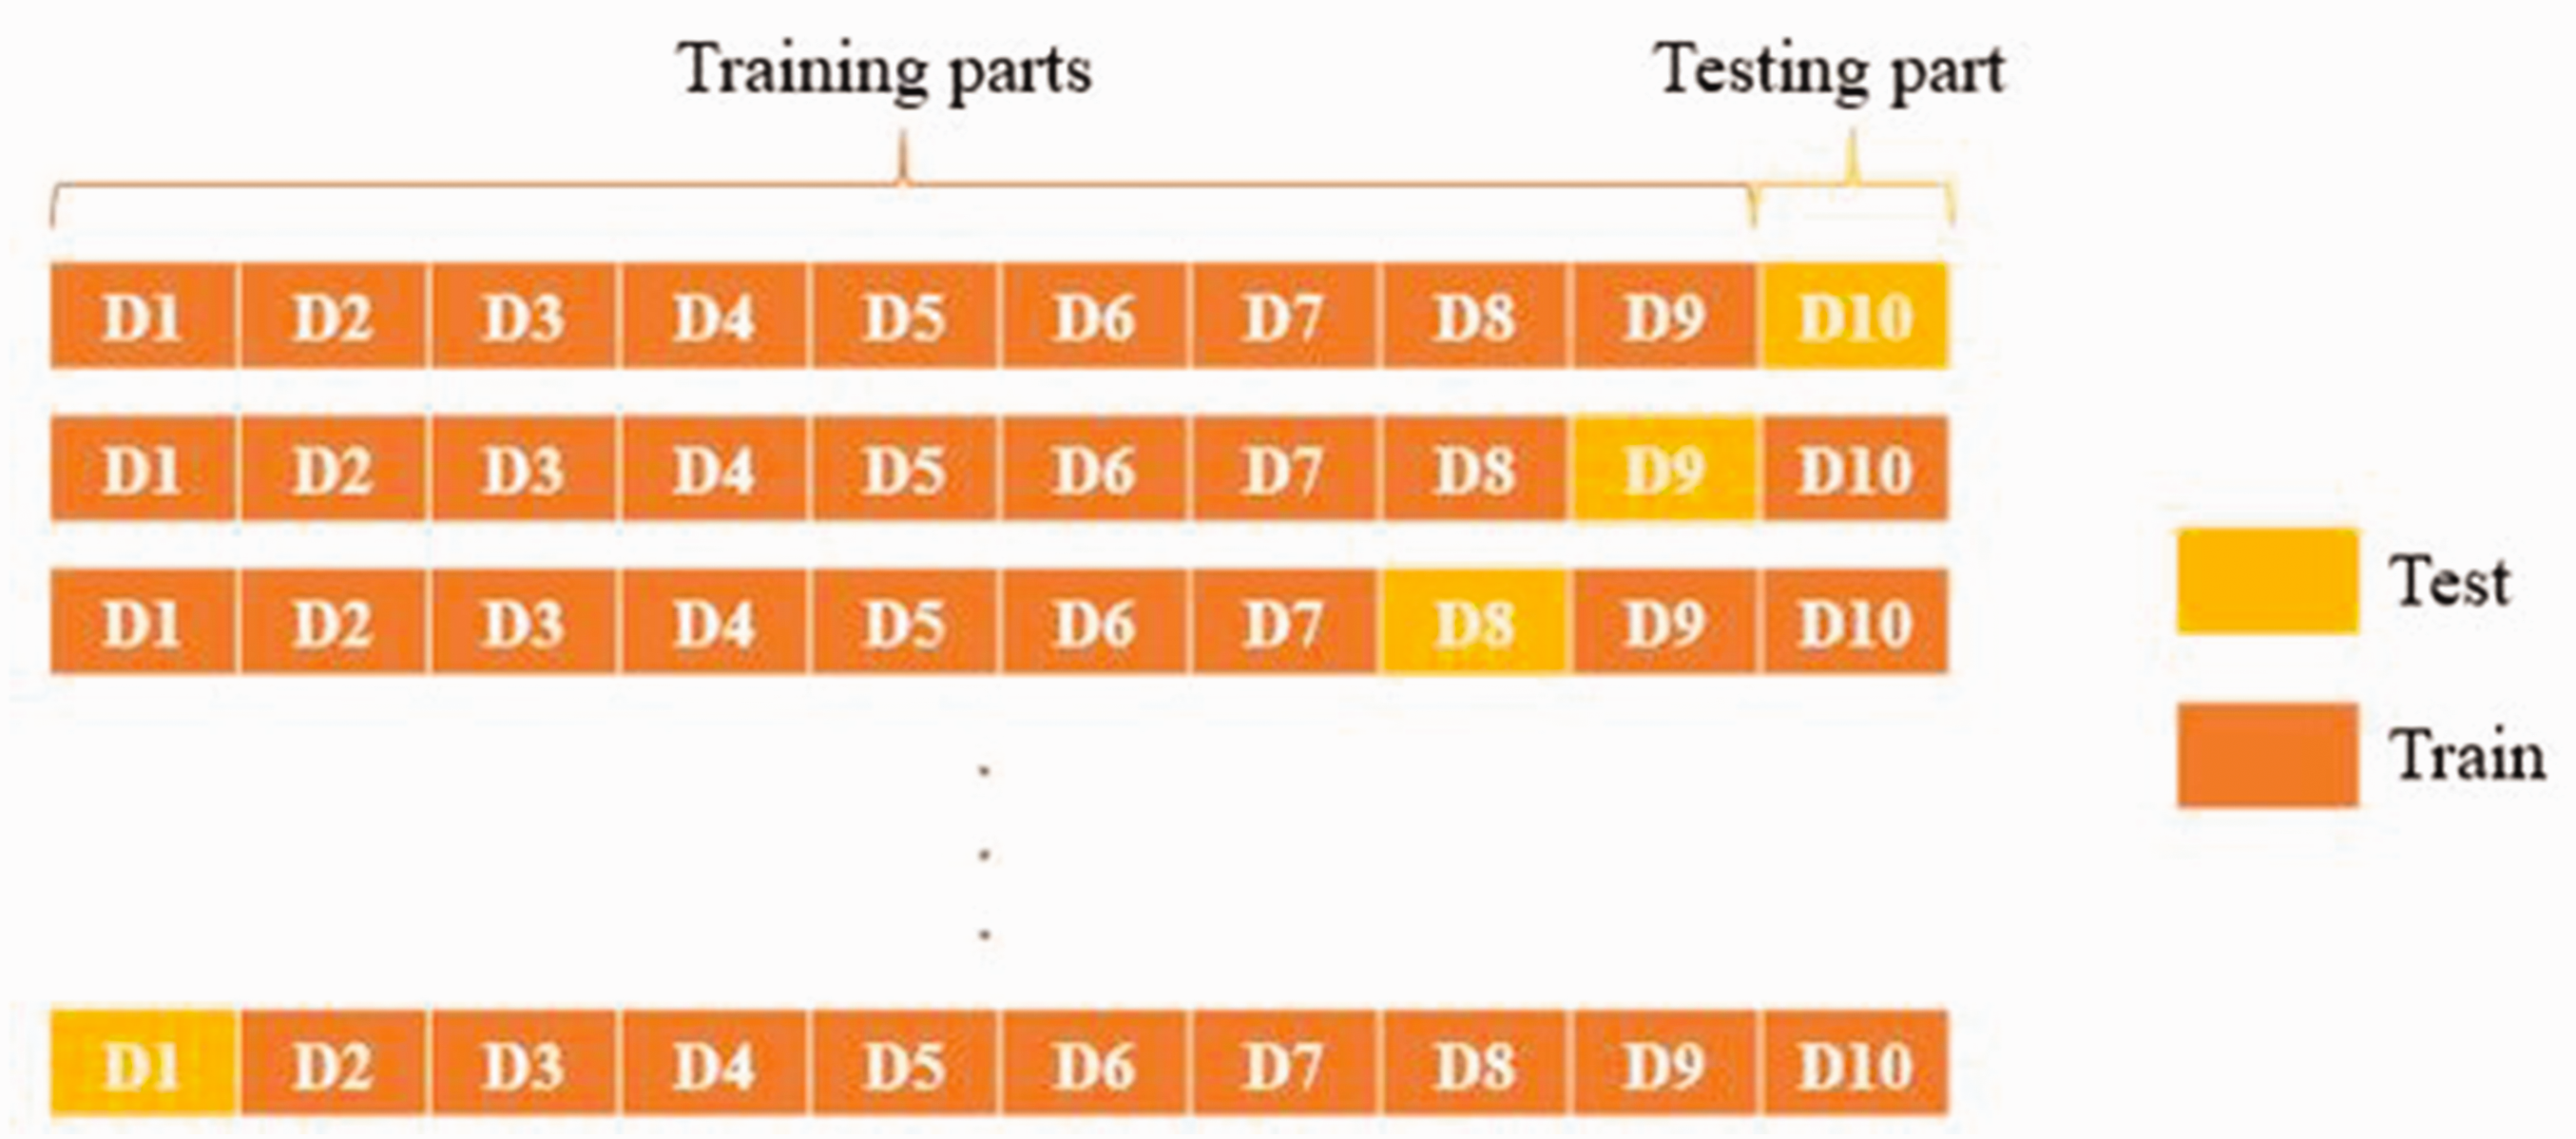
Ten-fold cross-validation.
Preliminaries to experiments
If CNN-based methods are used only for feature extraction, there is no need to split the dataset into training and testing. So, the entire database may be used for training in such studies. However, 70% of the database is reserved for training and 30% for testing to make comparisons in this study.
Classification of features drawn from previous layers of the CNN is generally less successful. Therefore, the features taken from the last layers were used in this study. Layers of ‘pool5,’ ‘avg_pool,’ ‘pool5-drop_7x7_s1,’ and ‘pool5’ have been used to extract the features for the methods of ResNet18, ResNet50, GoogLeNet, and AlexNet, respectively.
Results and evaluations
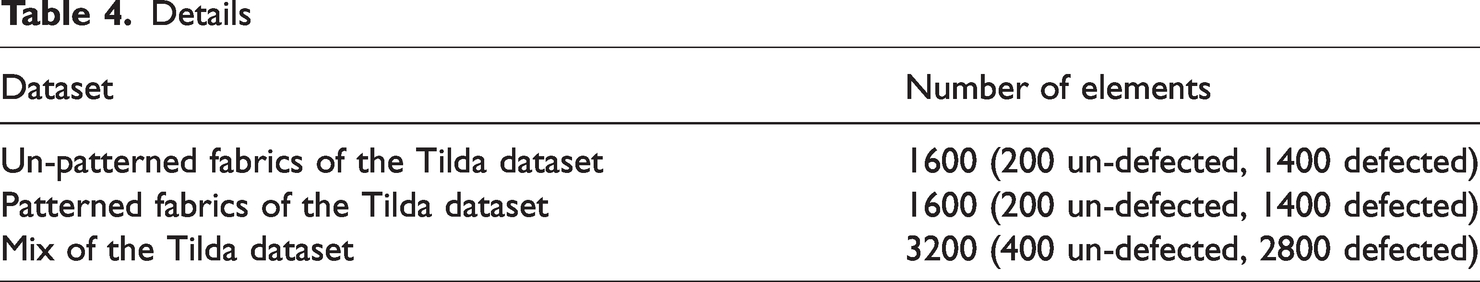
In this section, the Tilda dataset has been handled in three different ways, as shown in Table 4 (the sets of un-patterned fabrics, patterned fabrics, and mixed). Each of the three sets consists of two different classes, one containing defected fabrics and one containing un-defected fabrics. The sets of c1r1, c1r3, c2r2, and c2r3 in the cd1 folder have been brought together to create an un-patterned fabric dataset. There are 1400 defected images and 200 un-defected images. Among the un-patterned fabric images, it is attempted to classify fabrics as defected/un-defected (Figure 7). The sets of c3r1, c3r3, c4r1, and c4r3 in the cd2 folder have been brought together to create a patterned fabric dataset. There are 1400 defected images and 200 un-defected images. Among the patterned fabric images, fabrics, it is attempted to classify fabrics as defected/un-defected. The third set consists of all the fabric images in both the cd1 and cd2 folders. There are 2800 defected images and 400 un-defected images. Among the fabric images (un-patterned and patterned), it is attempted to classify fabrics as defected/un-defected. The main goal of this study is to see how well un-patterned, patterned, and both un-patterned and patterned fabrics in the sets can be classified. The success of the system in distinguishing defected fabrics from un-defected fabrics has been investigated in a set with different fabric types. This makes this study closer to a real-life problem compared to other studies.
Details
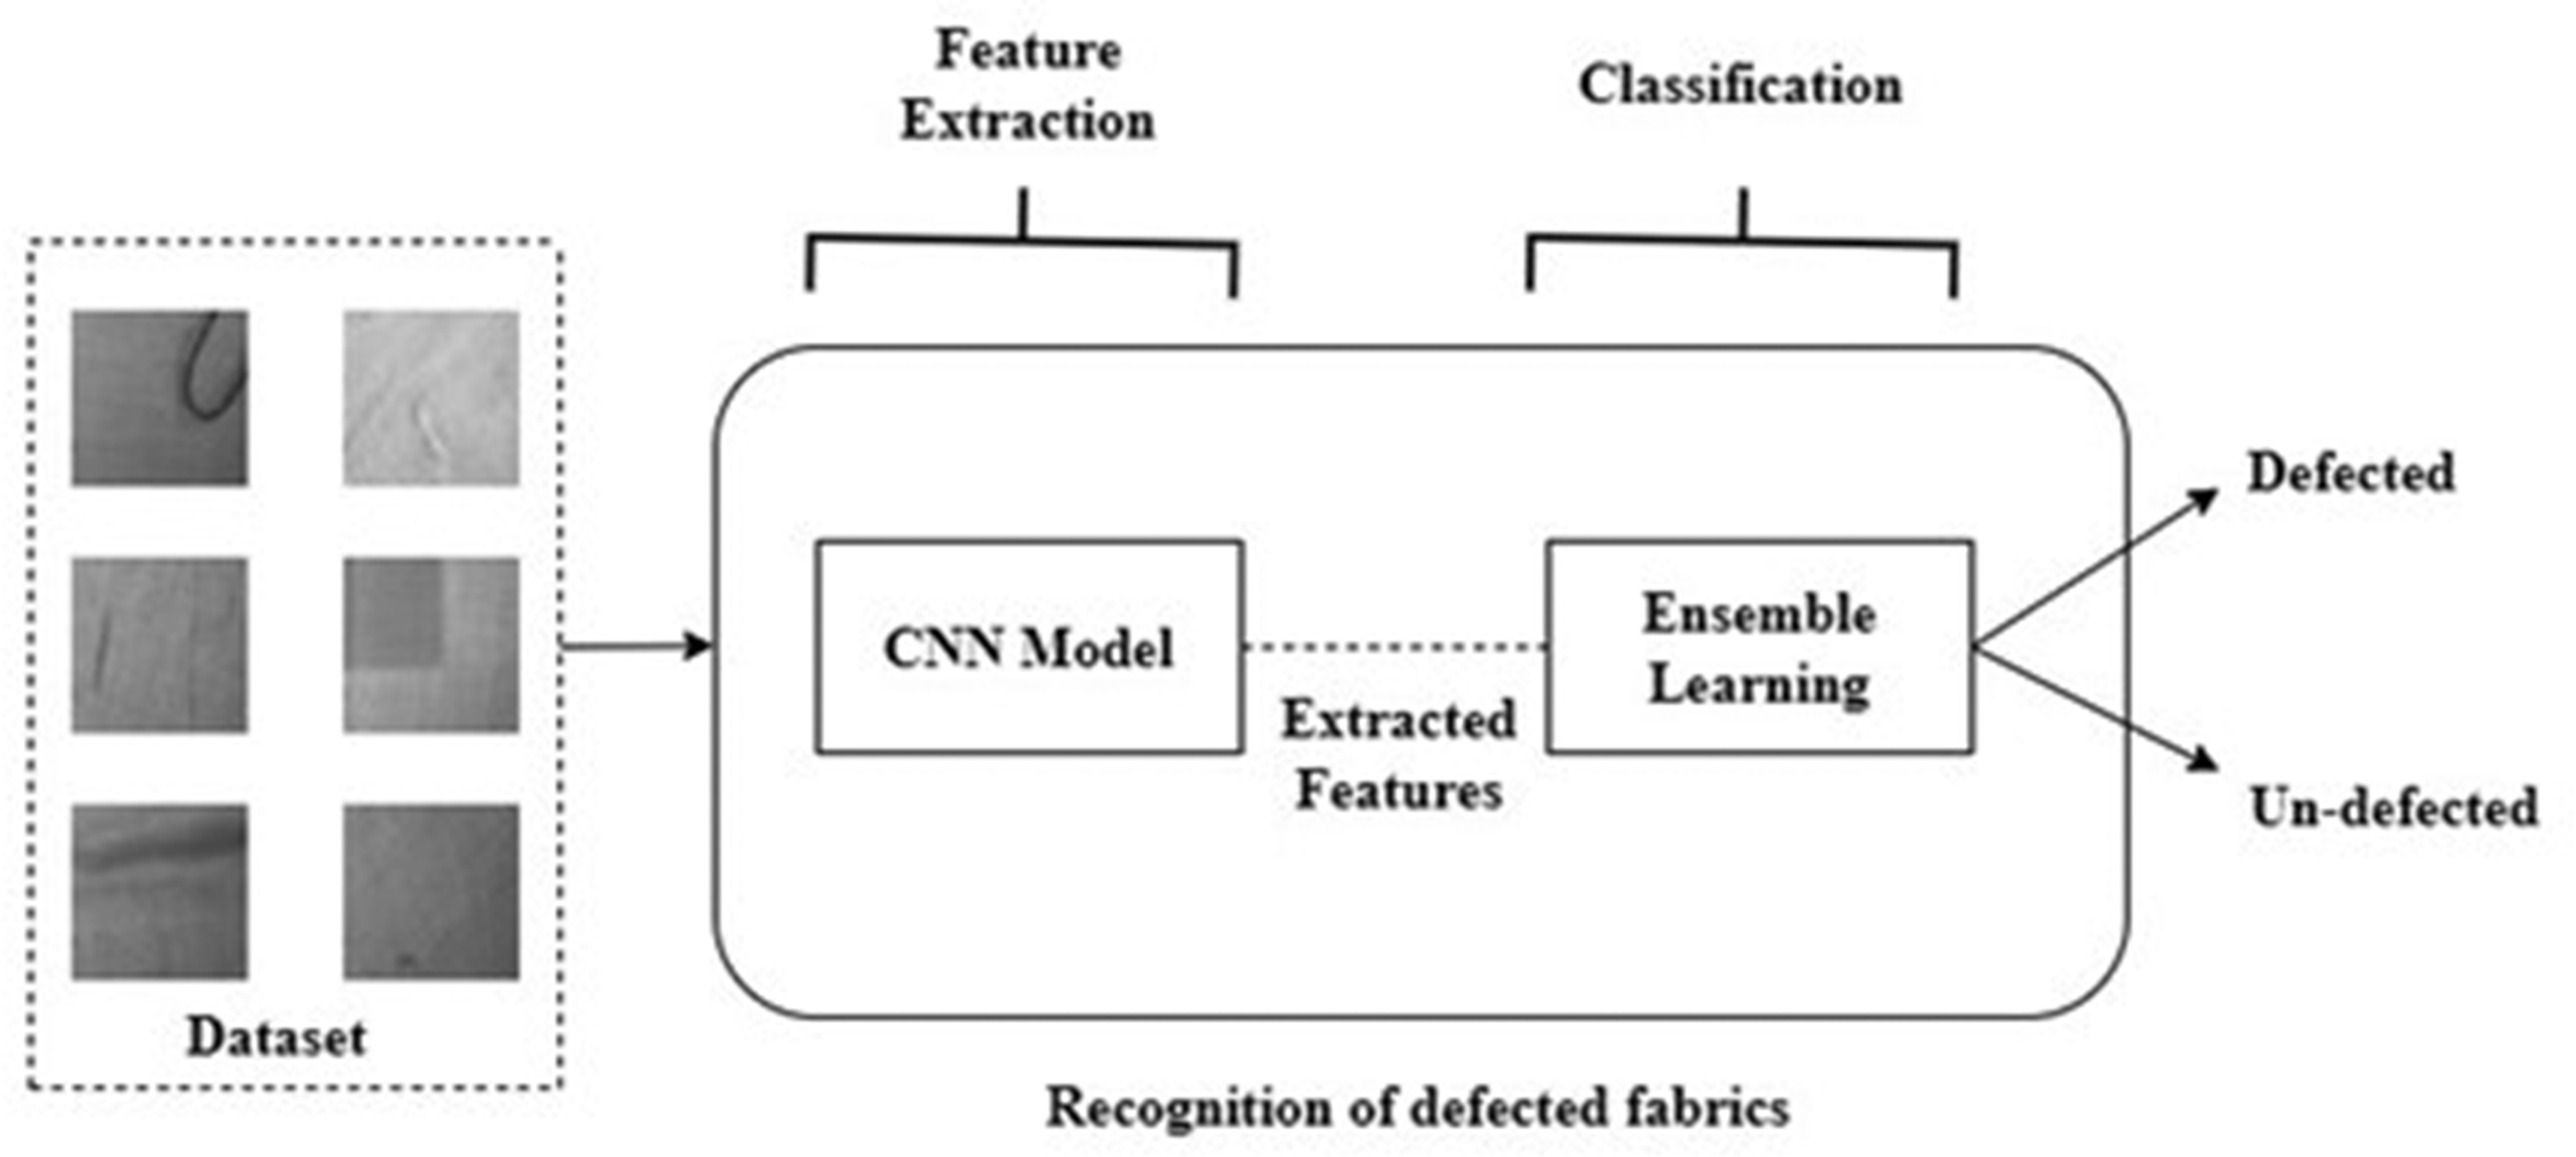
Sample visualization for defect detection. CNN: convolutional neural network.
The experiments in this study have been carried out considering two different cases. In Case 1, features have been extracted with the help of a CNN-based model and classified after feature selection using mRMR. In Case 2, the performance of the proposed feature fusion process in the study has been investigated.
Case 1: using the CNN and machine learning (ML)
Table 5 shows the performances of the methods. When a classifier-based comparison is performed, the average f-measures for EL, KNN, and the SVM are 0.9374, 0.9281, and 0.9357, respectively. It can be said that the patterned fabrics dataset has the lowest classification success rate compared to the others. While the average f-measure value of patterned fabrics is 0.9297, the average f-measure value of non-patterned fabrics is 0.9363, and the average f-measure value of mixed fabrics is 0.9378.
Classification results (%)
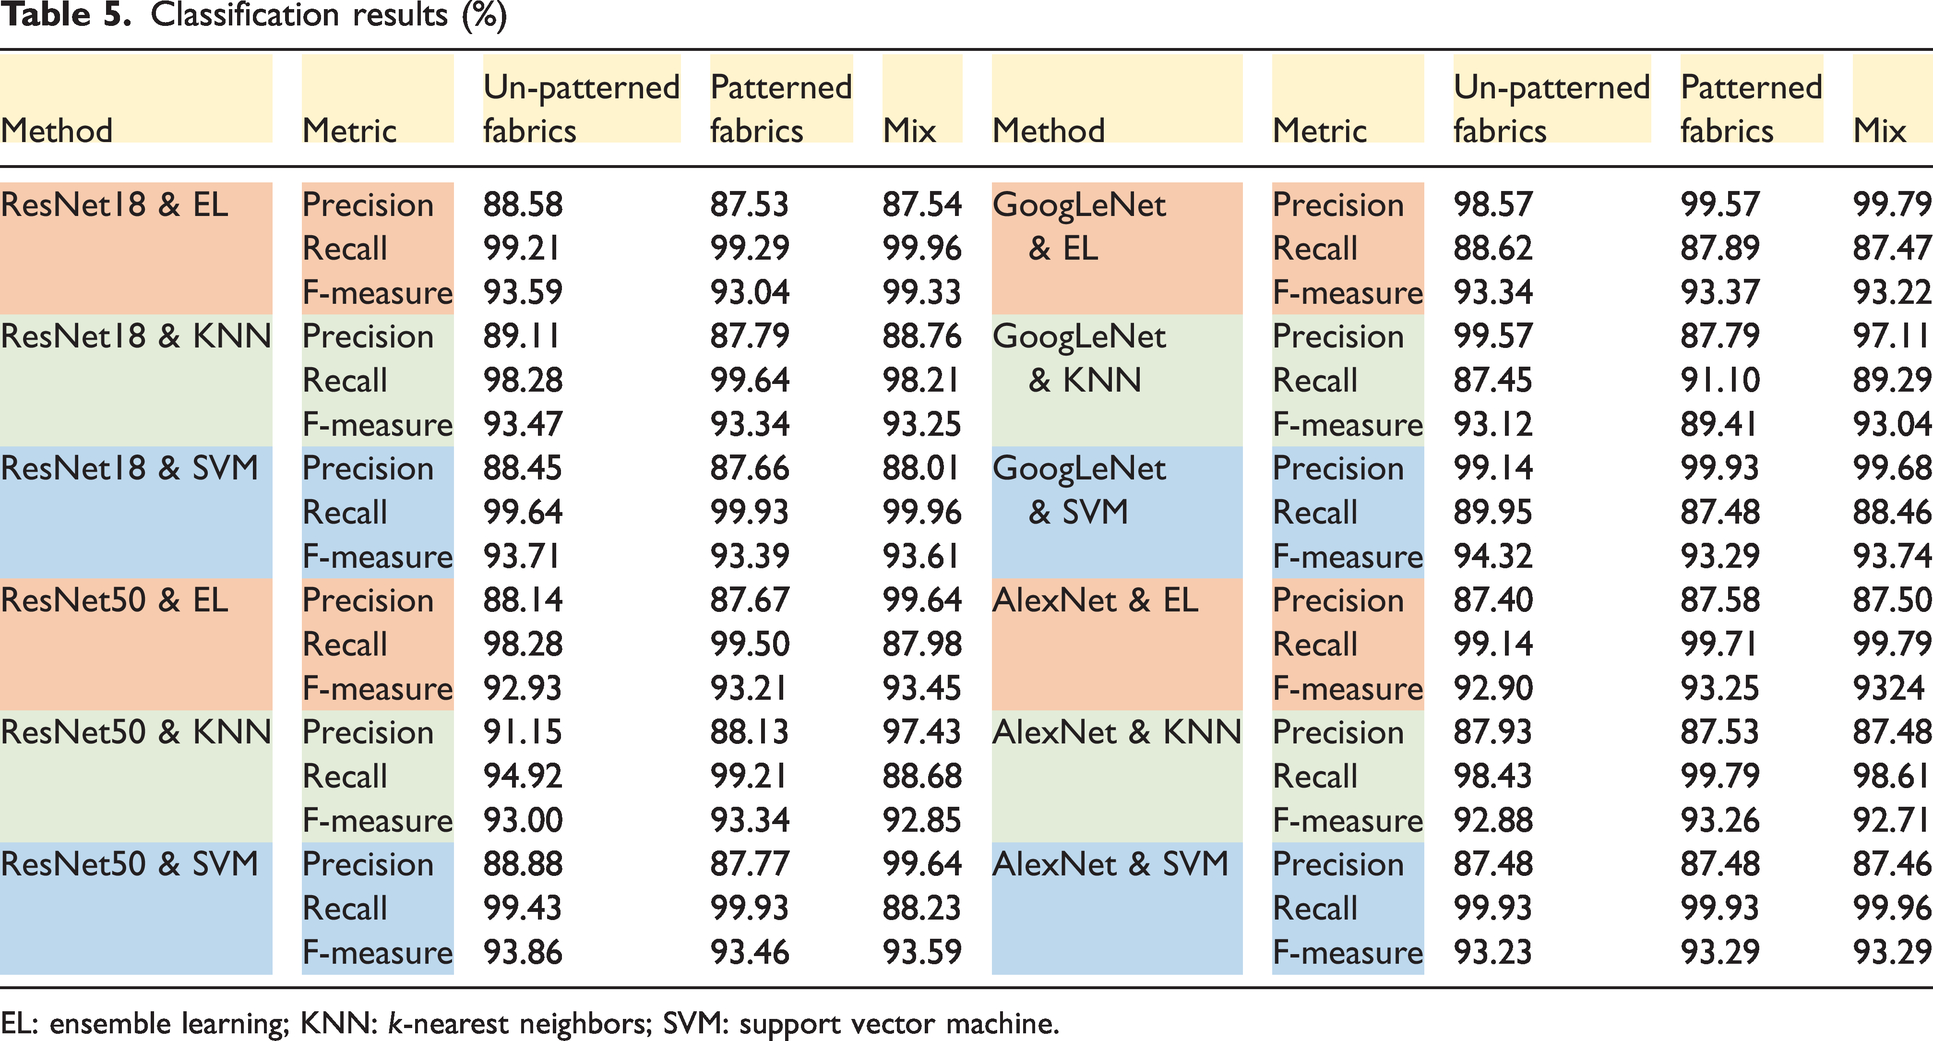
EL: ensemble learning; KNN: k-nearest neighbors; SVM: support vector machine.
Since classification was performed for 100 features as a result of feature selection in this study, classification time comparisons only show the performance of the classifiers. Average classification times for EL, KNN, and the SVM are 12, 5.43, and 22.52 seconds, respectively (Table 6). For only 100 features, the SVM takes an average of 22.52 seconds to classify, which may be problematic for larger datasets. It is an interesting detail here that the classification times of the classifiers for the mixed dataset are higher (18.72 seconds) compared to the un-patterned (10.09 seconds) and patterned datasets (11.13 seconds).
Classification times (seconds)
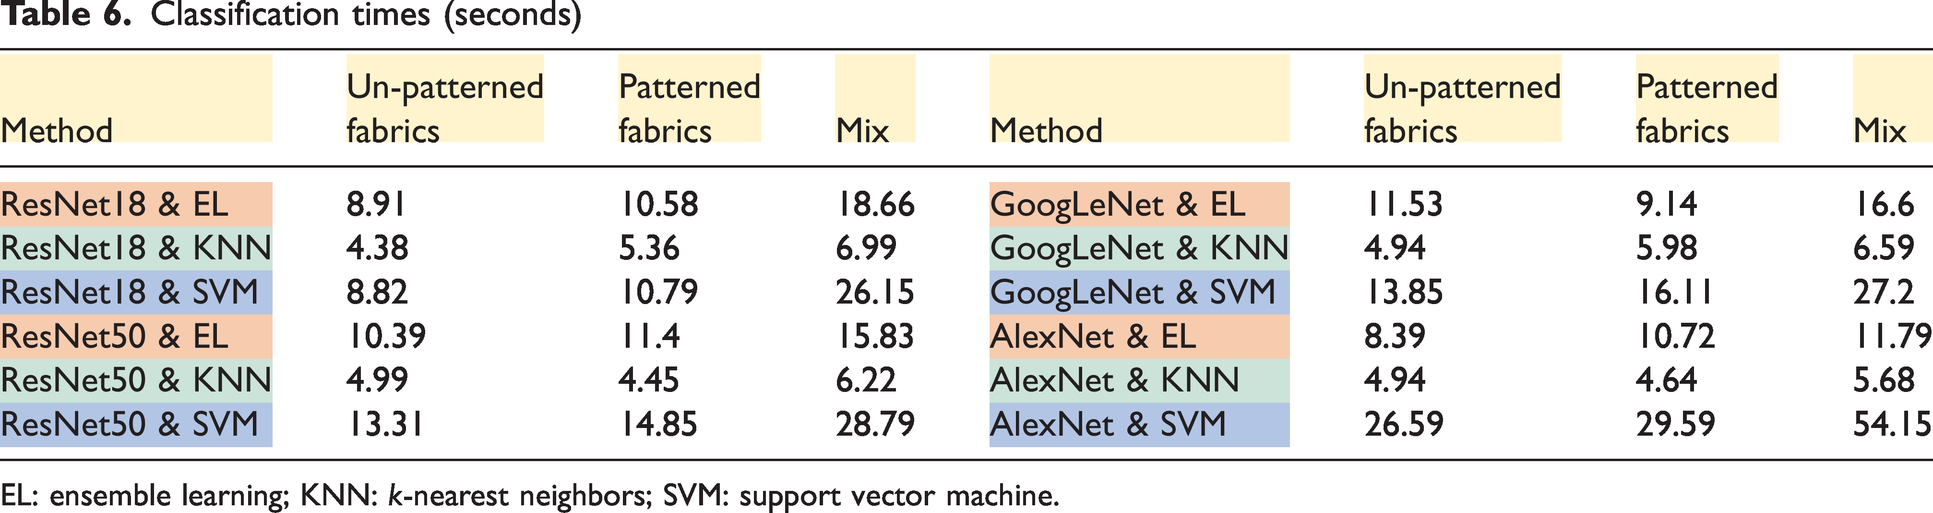
EL: ensemble learning; KNN: k-nearest neighbors; SVM: support vector machine.
Case 2: using feature fusion and machine learning (ML)
When the performance results given in Table 7 are examined, it is seen that classification can be performed with an average f-measure rate of about 93.34%. The average f-measure rates of the classifiers of EL, KNN, and the SVM are 93.20%, 93.10%, and 93.72%, respectively. The average f-measure rate of each fusion combination is between 93% and 94%. The average f-measure rate of ResNet18 & GoogLeNet-based classification is 94.37% for the mixed dataset.
Classification results for feature fusion (%)
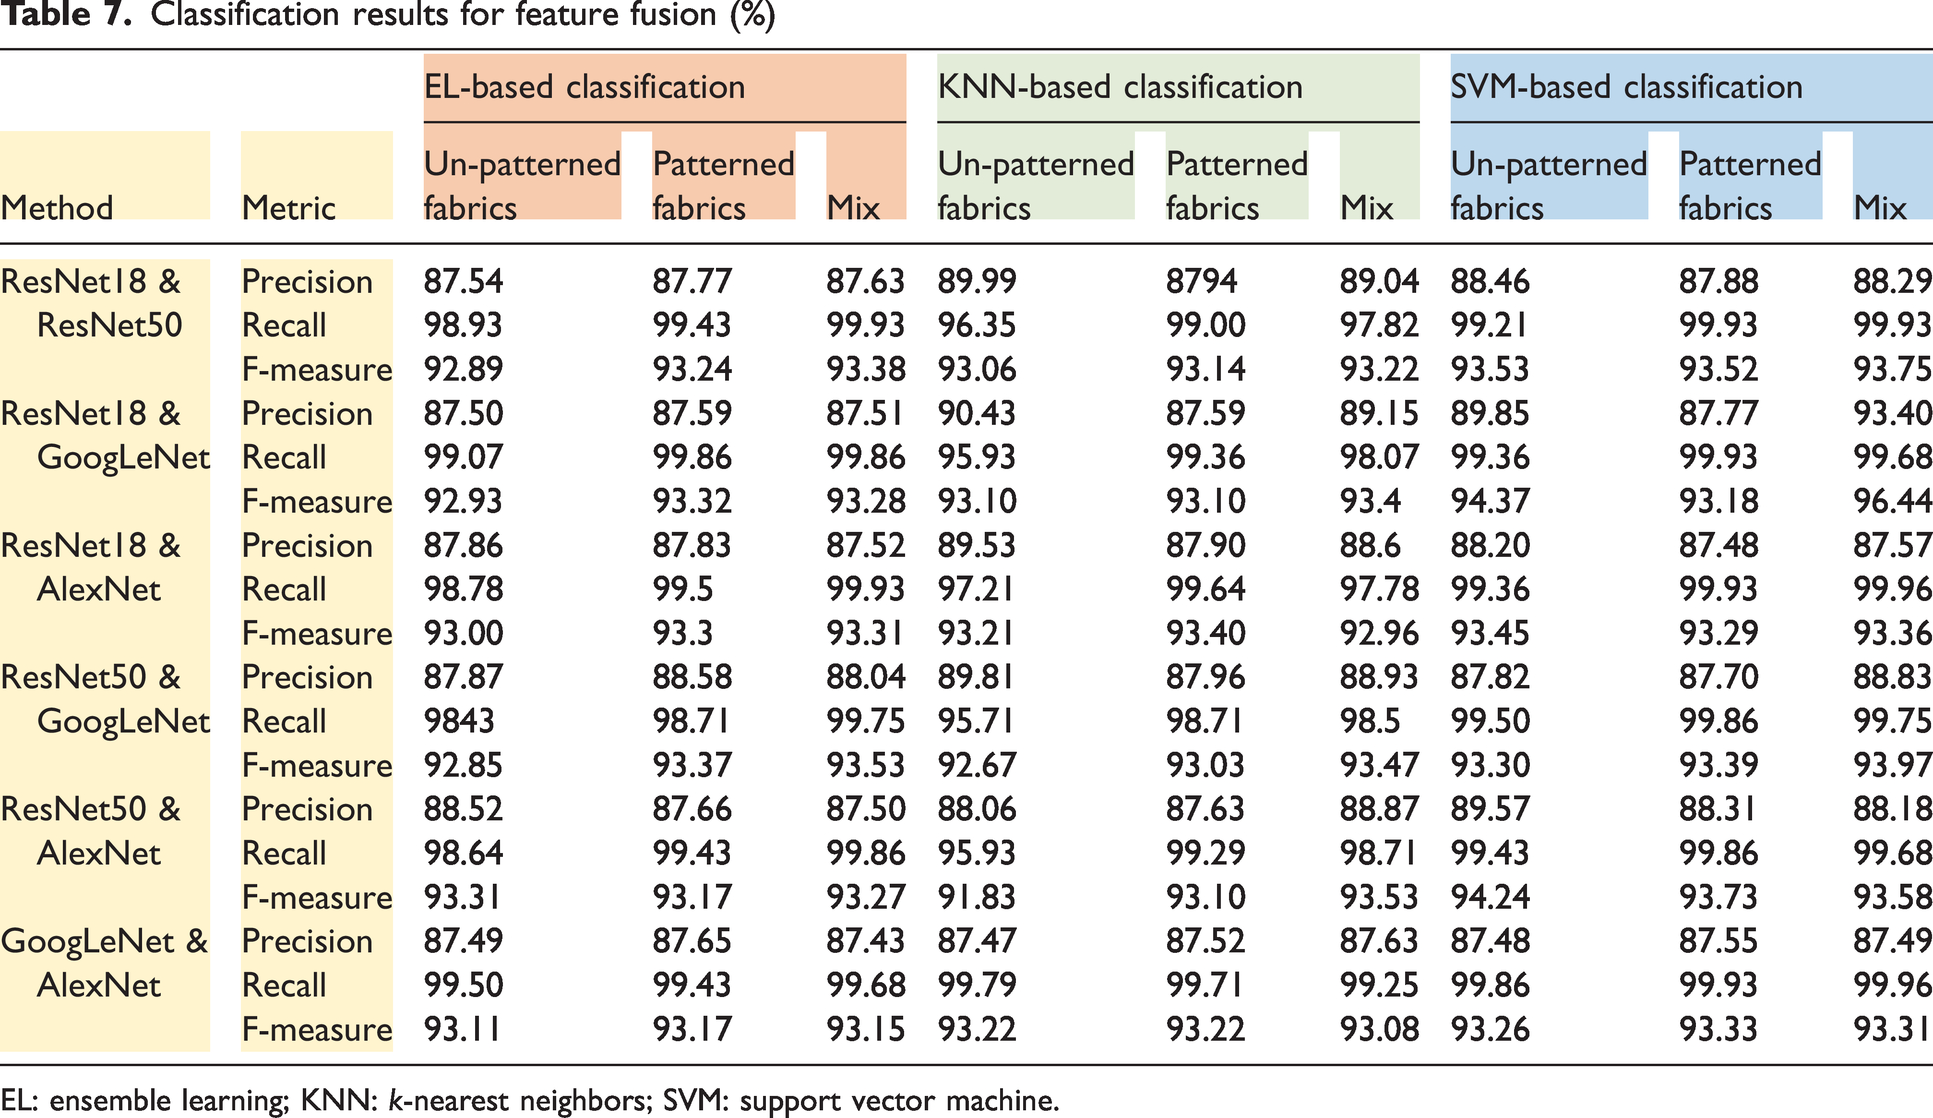
EL: ensemble learning; KNN: k-nearest neighbors; SVM: support vector machine.
Average classification times for EL, KNN, and the SVM are 11.47, 5.45, and 19.86 seconds, respectively (Table 8). The classification times of the classifiers for the mixed dataset are higher (16.54 seconds) compared to the un-patterned (9.71 seconds) and patterned datasets (9.86 seconds).
Classification times for feature fusion (seconds)
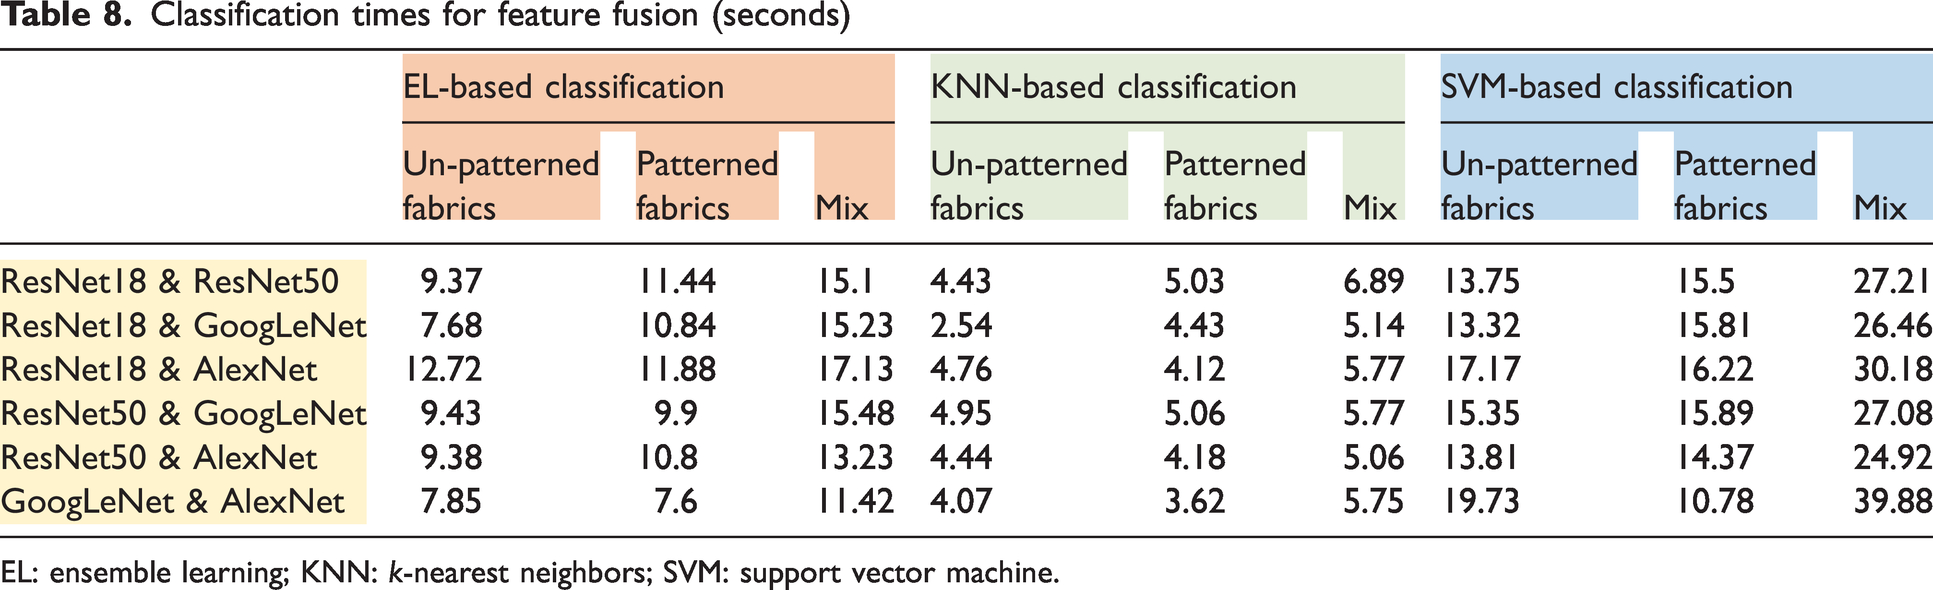
EL: ensemble learning; KNN: k-nearest neighbors; SVM: support vector machine.
The results of Cases 1 and 2 are given together in Figure 8. In the first case, ResNet18 is the network with the highest average f-measure value (0.9408), while GoogLeNet has the lowest (0.9298). When the features extracted with ResNet18 are classified with EL, 95.32% success is achieved (the highest success). The lowest success was obtained with the combination of GoogLeNet & KNN (92.98%). In the second case, a success of 94.66% has been achieved when the features obtained from the fusion of ResNet18 & GoogleNet are classified with the SVM. In both cases, it is seen that generally the lowest performance is obtained when KNN is used (on average 92.98%). The SVM is the classifier with the highest average in both cases (93.66%), while EL is second in performance (93.42%). As can be seen from this graph, the results obtained on average are quite successful.
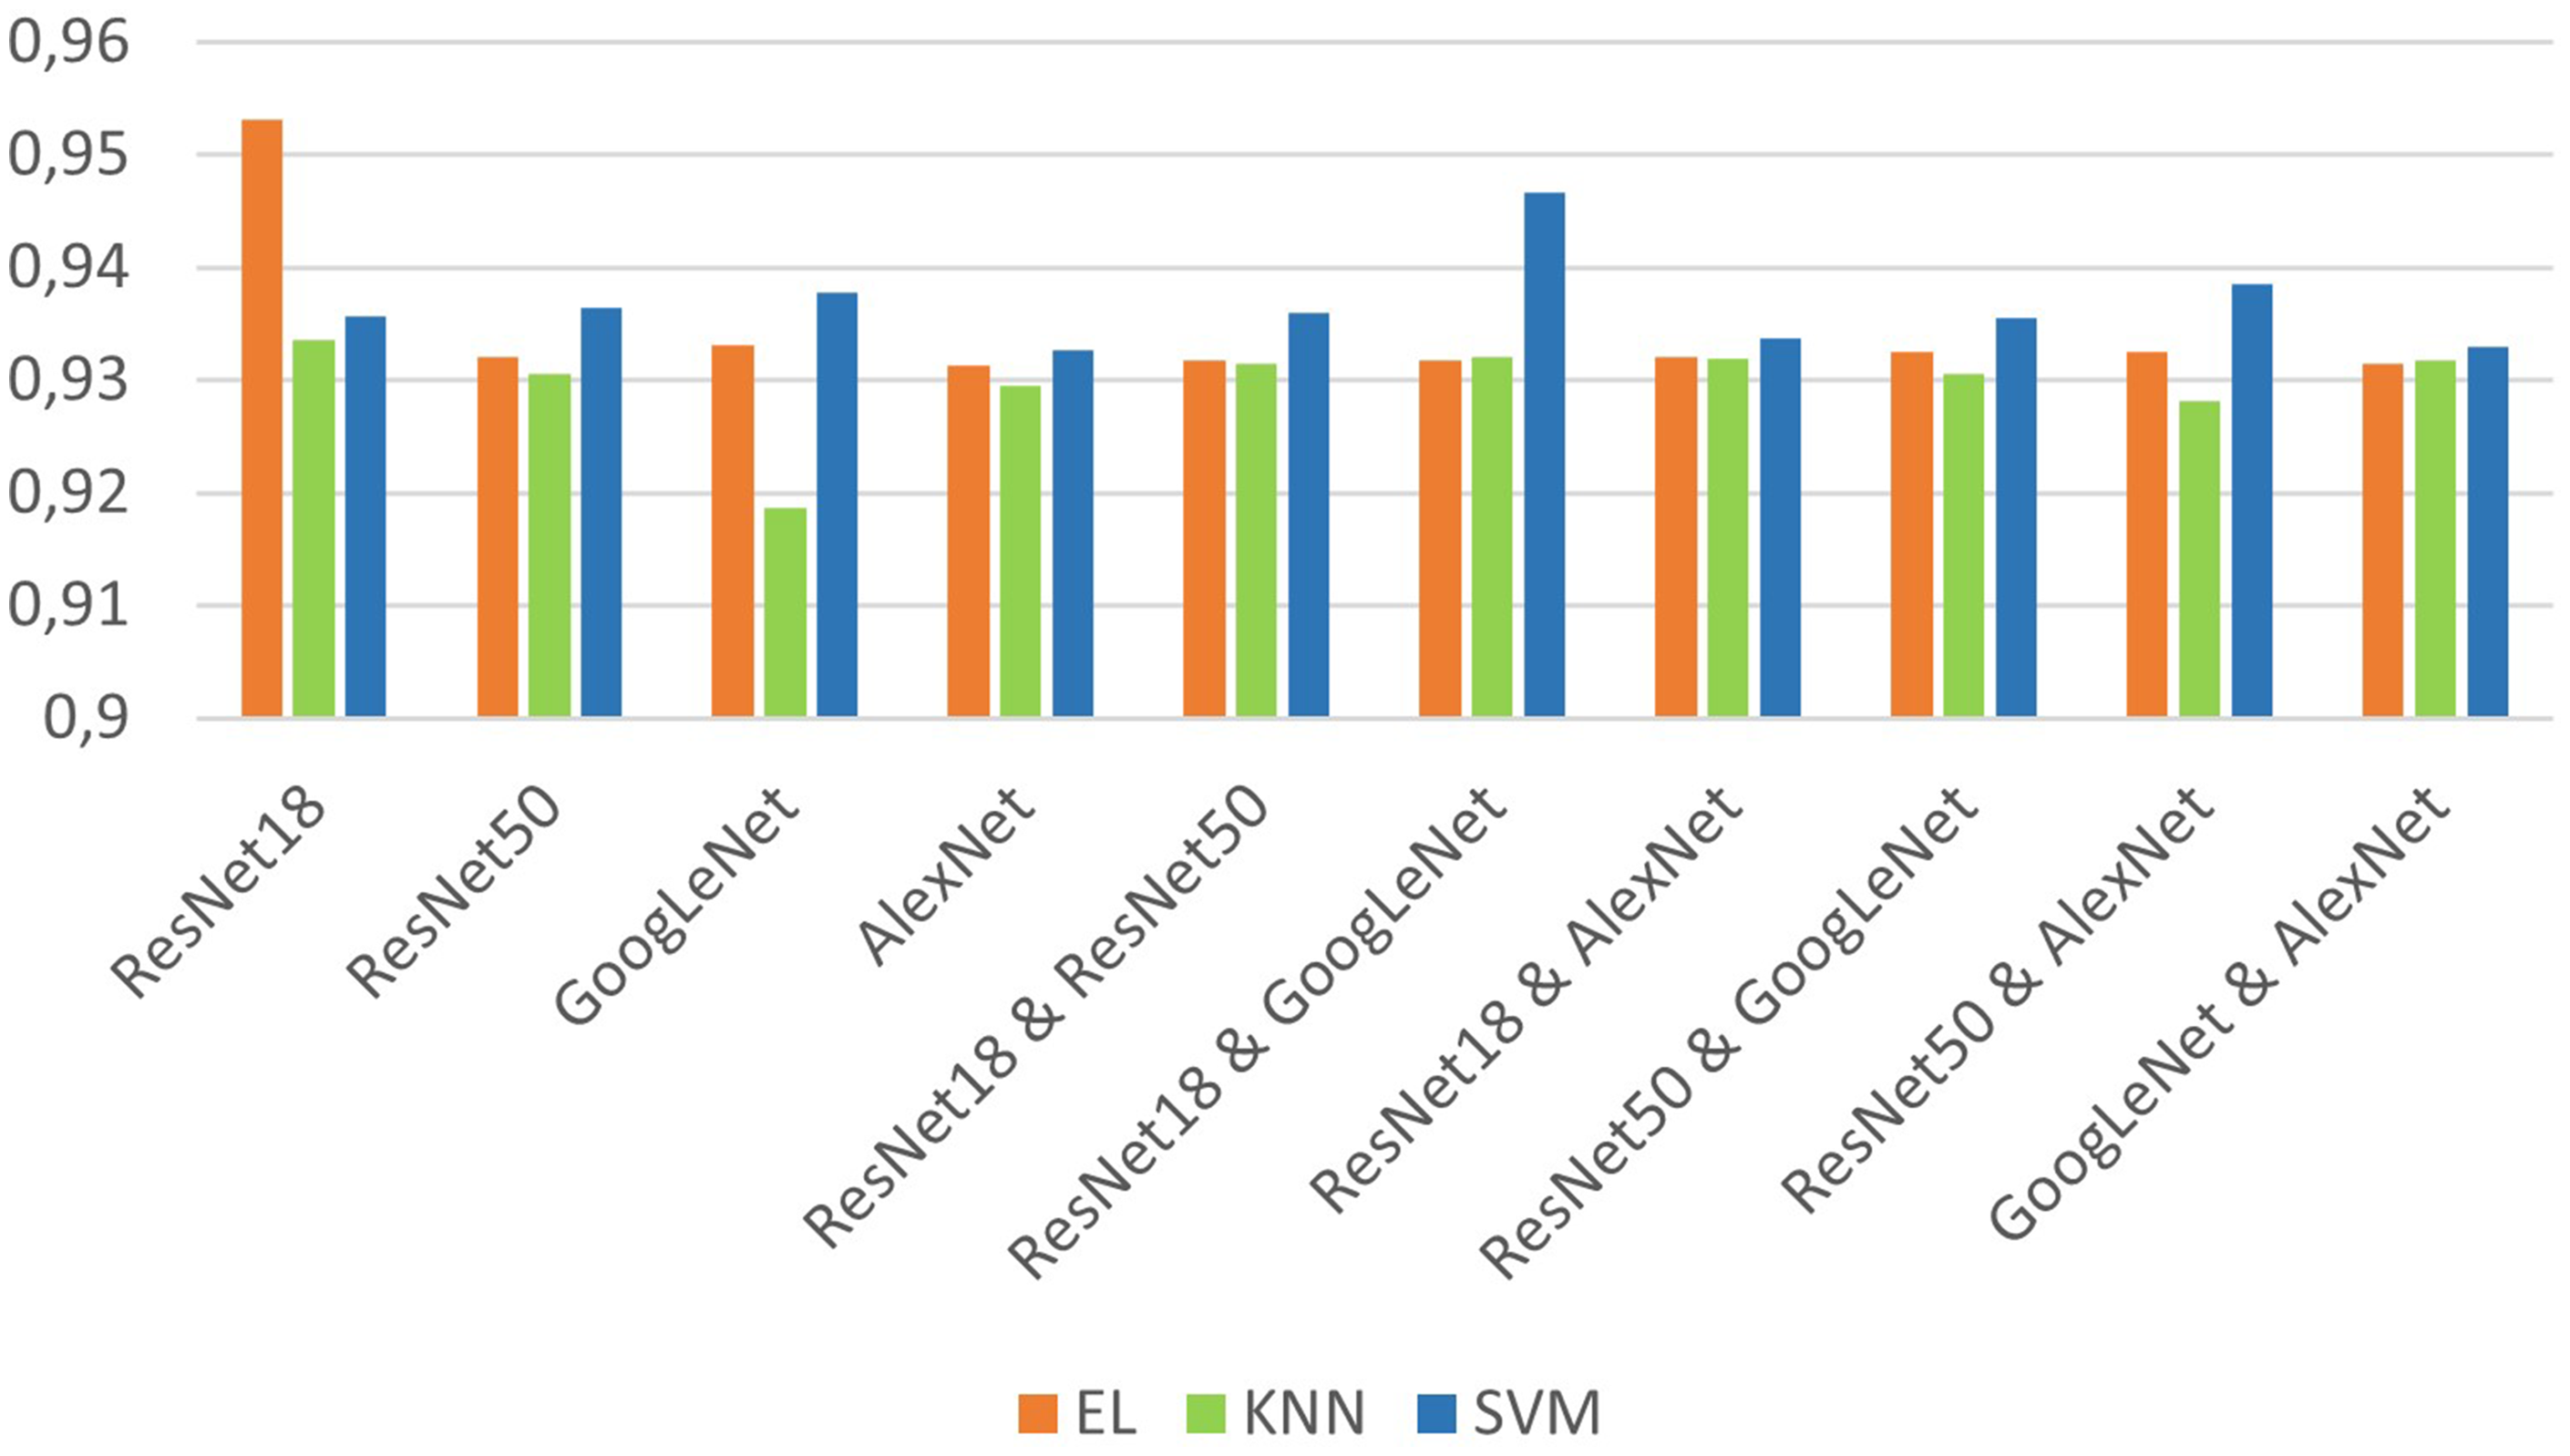
Comparison based on the f-measure. EL: ensemble learning; KNN: k-nearest neighbors; SVM: support vector machine.
Conclusions and future works
Given the recent developing technology, automatic fabric defect detection systems have attracted a great deal of attention. They are required for a variety of reasons, including increased product quality.
Particularly in recent years, the use of CNN-based models has been very popular not only in this field but also in all fields. It is obvious that the CNN has advantages as well as disadvantages. However, the disadvantages of the CNN are not enough to stain its popularity. In the literature, it is seen that CNN models developed by considering their weak points are presented. This study aims to present a system that will give results of feature extraction and classification in less time and is at least as successful as the CNN. For these purposes, a comprehensive analysis has been carried out in this study.
The Tilda database has been used for testing the methods. Subdirectories other than e0 have been collected in one directory, since it has been attempted to classify fabric samples as defected or non-defected. As a consequence, for un-patterned fabrics, we have 200 non-defected images and 1400 defected images. On the other hand, the number of images we have for patterned fabrics is the same as the number of images for un-patterned fabrics. In addition to all of these, the study looked into the performance of classification in a dataset that included both patterned and un-patterned fabrics. This dataset is called ‘mix’ and it consists of 400 un-defected images and 2800 defected images from the preceding two datasets. Images with and without patterns, as well as various textures, have all been identified as defected or un-defected in this way. The performances of three sets (un-patterned, patterned, mixed) have been analyzed and compared separately. The study consists of two cases. One feature extraction method and one classifier are used in Case 1, while fusion features are obtained and classified in Case 2. In both cases, the features obtained in the feature extraction process have been passed through the feature selection process before classification.
Different approaches using four CNN-based models, namely ResNet18, ResNet50, GoogLeNet, and AlexNet, have been used in the feature extraction step, while EL, KNN, and the SVM have been used in the classification step. In this study, unlike other studies, feature fusion has been used for feature extraction. In feature fusion for Case 2, binary combinations of ResNet18, ResNet50, GoogLeNet, and AlexNet (ResNet18 & ResNet50, ResNet18 & GoogLeNet, ResNet18 & AlexNet, ResNet50 & GoogLeNet, ResNet50 & AlexNet, GoogLeNet & AlexNet) are preferred.
If we reach the following conclusions for the cases mentioned above.
ResNet18 & EL has the highest performance in the first case (95.32%). Considering their average performances, EL (93.74%) and the SVM (93.57%) have close values while KNN's value is slightly lower (92.81%). KNN is a classifier that is sensitive to variables, and therefore not robust. In the second case, ResNet18 & GoogLeNet & SVM achieved 94.66%, on average. The SVM is the highest performing classifier (93.72%), and EL is the second (93.20%). Here, as in Case 1, the lowest performance was obtained when using KNN (93.10%).
The following issues can be solved in the future.
Converting the system into a product as a real-time defect detecting system on weaving machines will close the gap in this area and will be economical, as it is a domestic solution. It is obvious that there is a dataset problem in this area. In the future, it is aimed to create a large database containing a large number of fabric defect samples.
Footnotes
Declaration of conflicting interests
The author(s) declared no potential conflicts of interest with respect to the research, authorship, and/or publication of this article.
Funding
The author(s) received no financial support for the research, authorship, and/or publication of this article.