
Abstract
Producing a wide scope of weave colors is challenging in modern Jacquard weaving with limited weft color variety. The subtractive primary color yarns (cyan, magenta, yellow and black) are used to replicate varied Jacquard designs, but there is potential to improve the color reproduction quality by expanding a feasible weave color scope. Therefore, this research examined weave colors that are created by combining two sets of primary colors from different color systems. In color printing, six color pigments (i.e., cyan [C], magenta [M], yellow [Y], red [R], green [G] and blue [B]) are popularly used as primary colors for color reproduction. Therefore, weft yarn colors are selected in line with the six colors and a feasible weave color scope is inspected. The group of yarns is paired, and 225 weave color samples are produced to examine the color effects. The weave color samples are measured by a spectrophotometer and described by the CIELAB color space. The results show that the CIELAB color space was expanded by adding [R], [G] and [B] colored yarns. The hue and chroma ranges of the fabric samples were expanded compared with the fabrics produced by only [C], [M] and [Y] yarn colors. In this research, the possibilities in color reproduction are explored and the findings suggest great potential in producing a wide scope of weave colors by using primary yarn colors.
Keywords
Weave colors are created by interweaving weft and warp yarn colors.1,2 Weave structures also play an important role in producing various colors of woven fabrics, as the number of weft yarn colors is limited when applied to production. 3 Therefore, producing a large number of weave colors with a small variety of weft yarns is important in modern digital Jacquard weaving.
According to recent research from Kim et al.,4,5 using the subtractive CMYK color model is suggested for a wide scope of weave color reproduction. The CMYK model refers to four colors – cyan [C], magenta [M], yellow [Y] and black [K] 6 – and its color gamut can display approximately 56% of the colors that are perceived by the human eye. 7 Thus, theoretically, there is a limited numbers of colors that are produced via mixing C, M, Y and K (black) pigments. In color printing, the four primary color pigments (CMYK) are widely used, but red [R], green [G] and blue [B] colors are also considered to enhance color reproduction quality. Therefore, this study aims to inspect the weave color effects when a pair of the two primary color sets is mixed. From previous research, it was discovered that [K] yarns only affect levels of chroma and lightness values. 4 Therefore, this research excludes the black color yarn and mainly focuses on six primary colors (i.e., [C], [M], [Y], [R], [G] and [B]) to investigate hue changes.
Modern computer-aided design (CAD) systems provide a variety of design tools that are designed based on the standardized color database.8–10 CAD systems offer varied methods for colorful Jacquard textile reproduction.11,12 One of the significant design tools is a simulation that can provide a preview of woven fabric colors. However, due to the limited color database, it is difficult to simulate and display actual colors of woven fabrics on the screen. Therefore, color measurement has been important to describe colors quantitatively in the textile industry. One of the important color systems is the CIELAB system, which is based on colorimetry.13–15 The International Commission on Illumination (CIE) introduced the L*, a* and b* chromaticity coordinates, which are now widely used to describe colors.16,17 A representation of the CIELAB color space is shown in Figure 1(b). The L* values are the measure of lightness, which vary from 0 (black) to 100 (white). Positive a* values indicate the strength of the red component, while negative a* values correlate with the green sensation. Positive values of b* give measurements of yellowness and negative b* values indicate the strength of blue.
18
The L*C*h color space uses the same diagram as the L*a*b* color space, but it uses cylindrical coordinates instead of rectangular coordinates (Figure 1). The hue angle (h) in the a*b* plane is a measure of hue, and the chroma is given the symbol C*.
19
Hue is the attribute of color sensation that is dependent on its dominant wavelength, and the hue angle (h) can be calculated by Equation (1). Chroma (C*) represents the colorfulness of an area judged as a proportion of the brightness of a similarly illuminated area that appears white. The value of chroma is expressed by Equation (2).
20
In this study, the weave color experiment results are described in CIELAB values


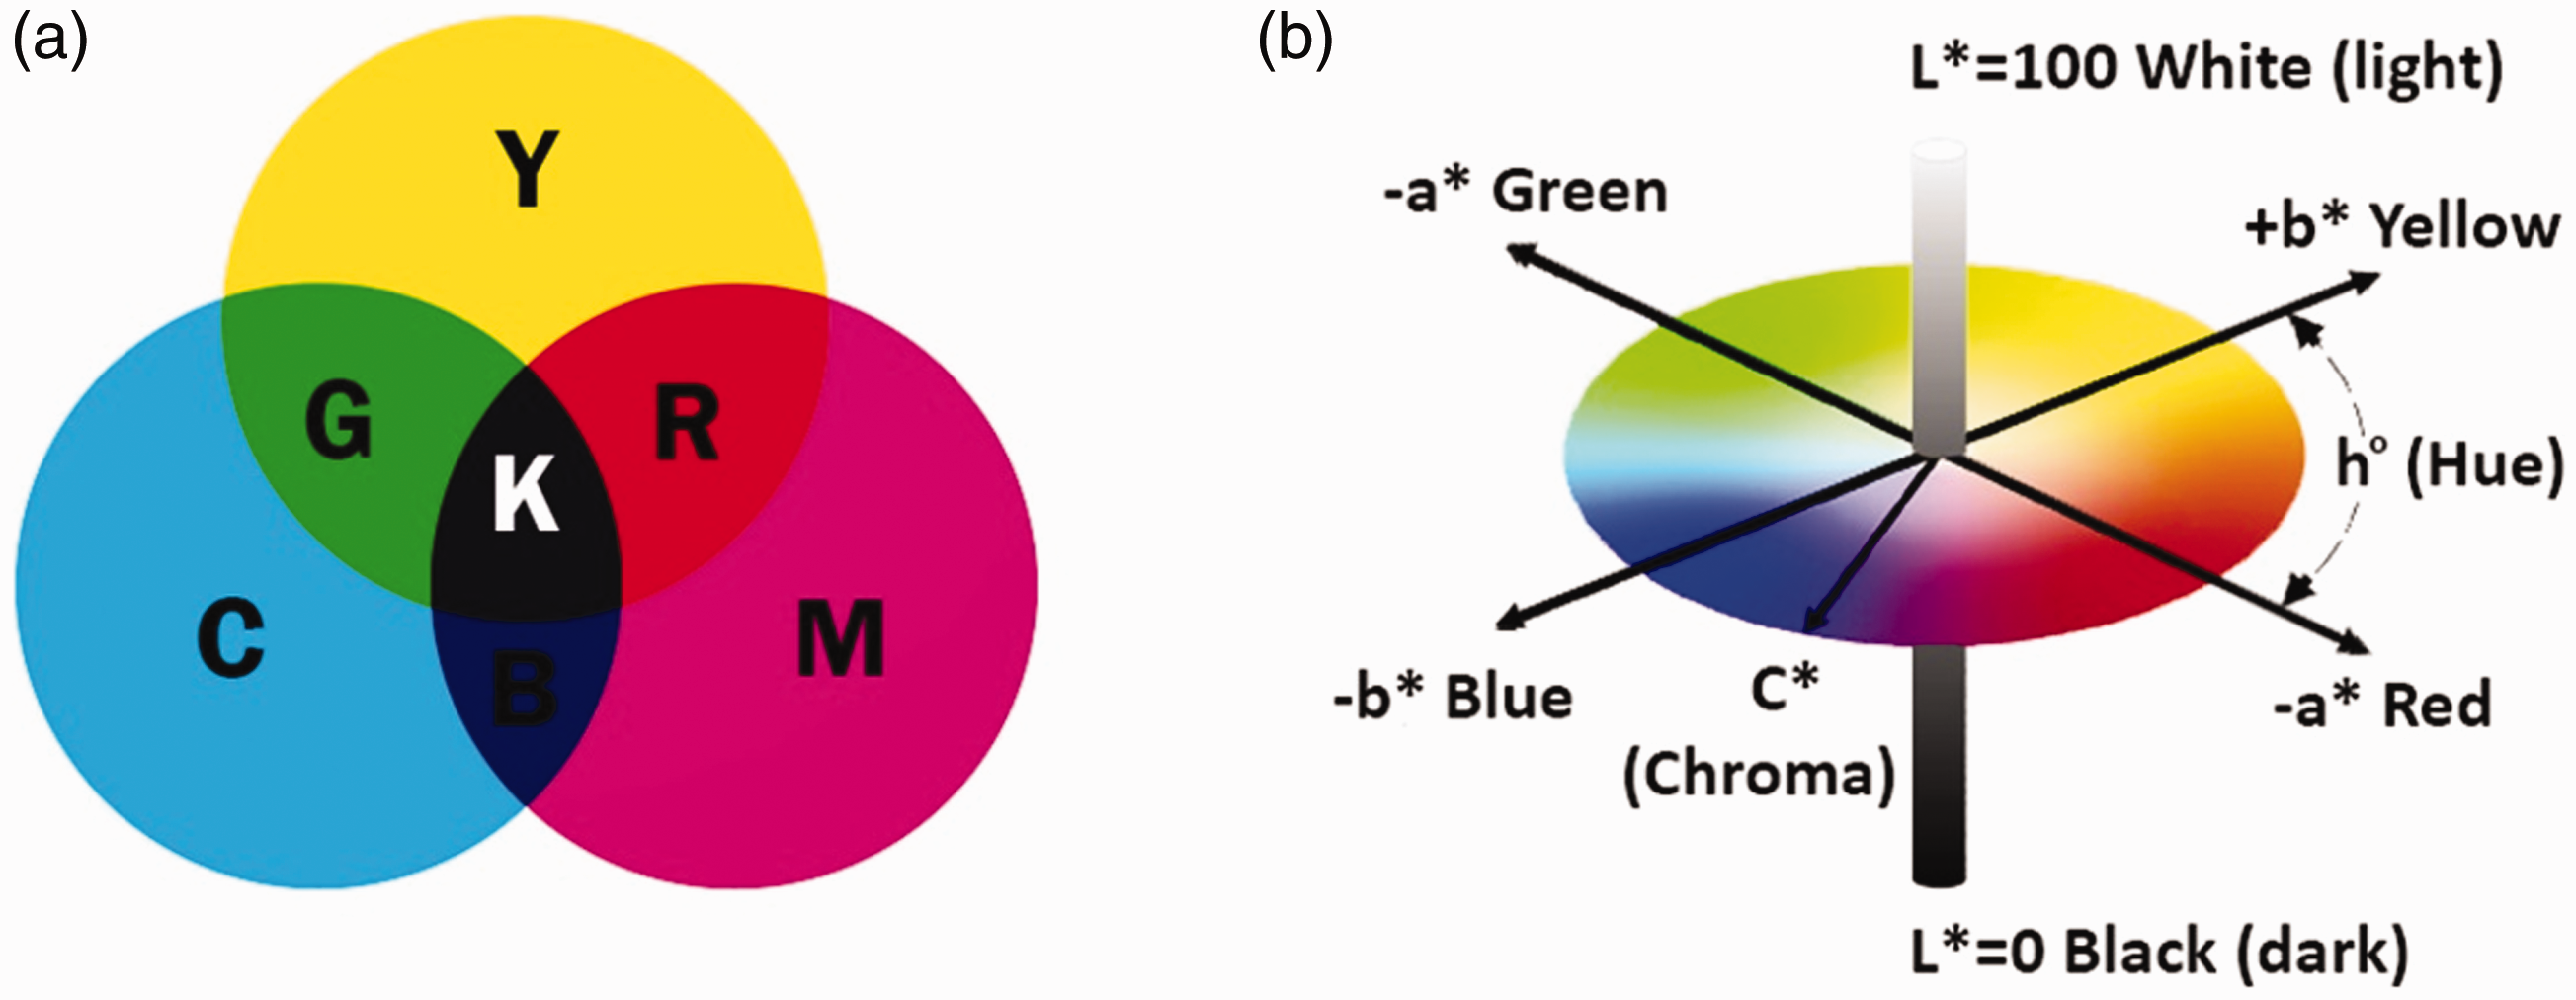
(a) The subtractive CMYK color model. (b) International Commission on Illumination L*a*b* color space. 21
For weaving experiments, six yarn colors ([C], [M], [Y], [R], [G] and [B]) are applied and 225 prototypes of weave color samples are produced and measured. This study aims to define a feasible weave scope if red, green and blue are added to Jacquard color reproduction and the details of weaving experiment results are introduced.
Materials and methodology
Materials and color measurements
The weft yarns used in this research are 100% multifilament polyester semi-dull color yarns, which was purchased from Able Shiny Co. The pantone printing colors are referenced to select the six yarn colors as close as possible to the primary colors (i.e., cyan [C], magenta [M], yellow [Y], red [R], green [G] and blue [B]). Images of [C], [M], [Y], [R], [G] and [B] yarns are shown in Figure 2. For fabrication, a Bonas Jacquard machine is used that is set with 150 denier off-white cotton yarns. The total ends of the warp are 3456 and 96 ends are placed per inch. As fine yarns are advantageous for natural color presentation, 22 50 denier yarns are applied to the weft and the weft density is set to 110 picks/inch.
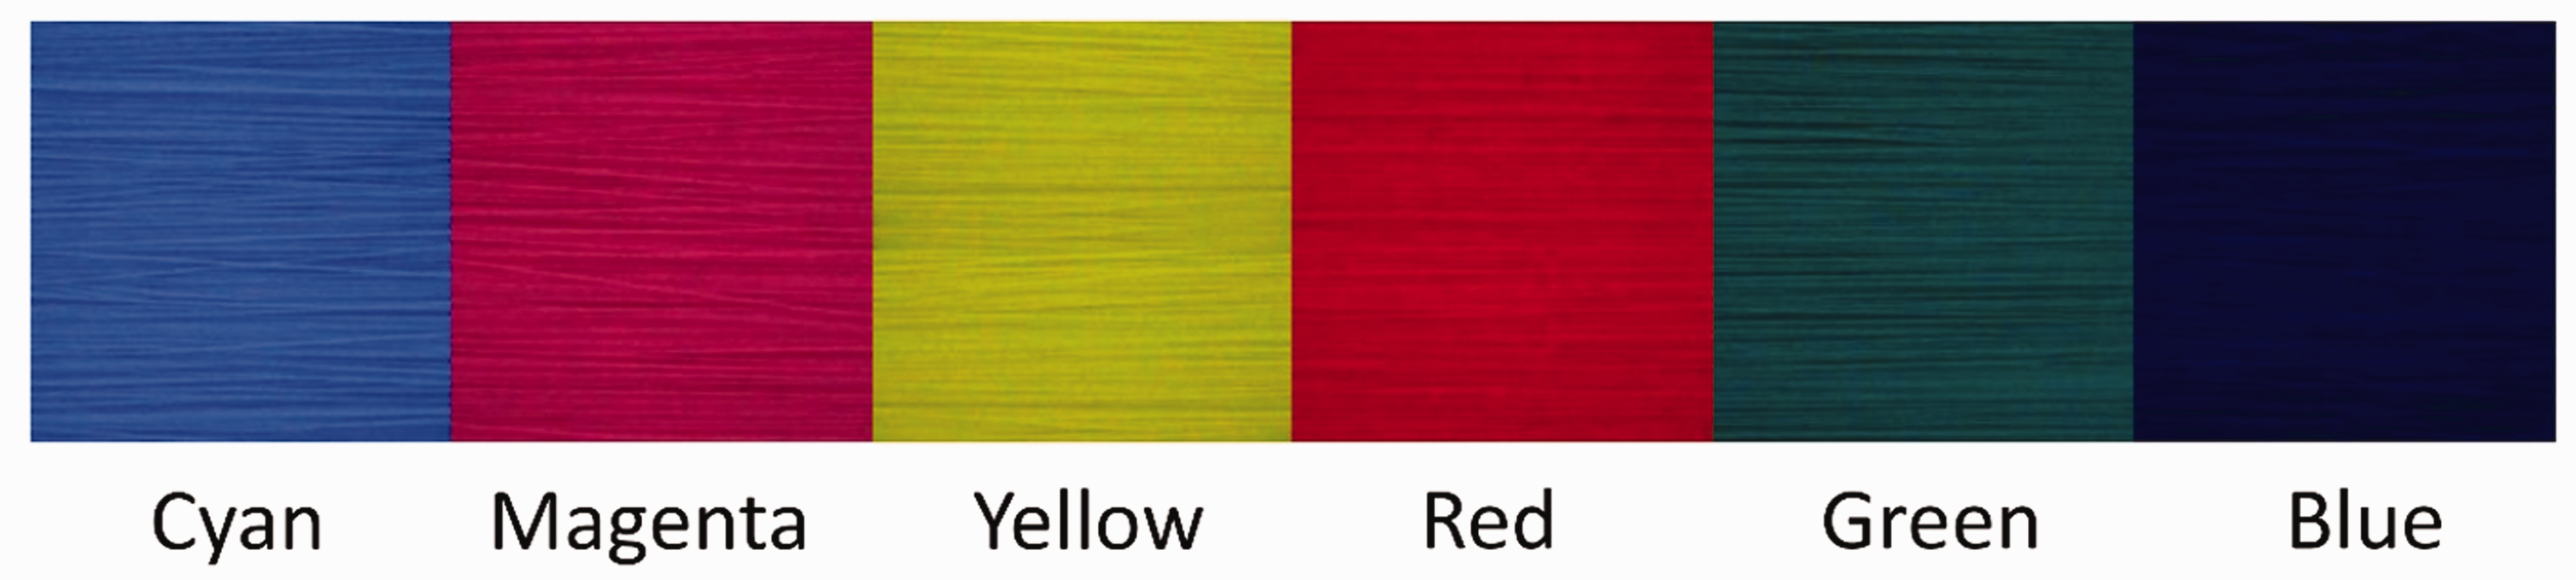
Yarn color selection. Images of [C], [M], [Y], [R], [G] and [B] yarns.
The six color yarns and 225 weave color samples are measured by a spectrophotometer (X-Rite Ci7500, UK) with Colour iControl software (X-Rite PANTONE®, UK). The color coordinates of the samples were computed using the CIE standard observer (10°) under a D65 light source. The measurement conditions applied to the yarn and weave color samples are diffuse/8° geometry and a 25 mm measurement spot. To measure the yarn colors, each color yarn was wound onto a yarn card with the highest possible uniformity manually.23,24 To measure the weave color samples, fabrics were folded twice to provide four-layered opaque samples. To reduce measurement variability that may result from fabric constructions and directionality of yarns, samples were repositioned and rotated to measure different areas of the fabrics. Each specimen was tested three times to determine the results.
Weave design and yarn color combinations
The compound weaves were designed based on sateen weave structures. The weft over warp interlacement point shows the color of the design and the Arahne Jacquard CAD system was used for creating digital weaving cards for the experiments. Fifteen color combinations are made with six yarn colors (i.e., [C] + [M], [C] + [Y], [M] + [Y], [C] + [R], [B] + [Y], [R] + [Y], [R] + [G], [R] + [B], [G] + [B], [C] + [G], [B] + [C], [R] + [M], [M] + [G], [B] + [M] and [G] + [Y]); the combination details are shown in Figure 3.
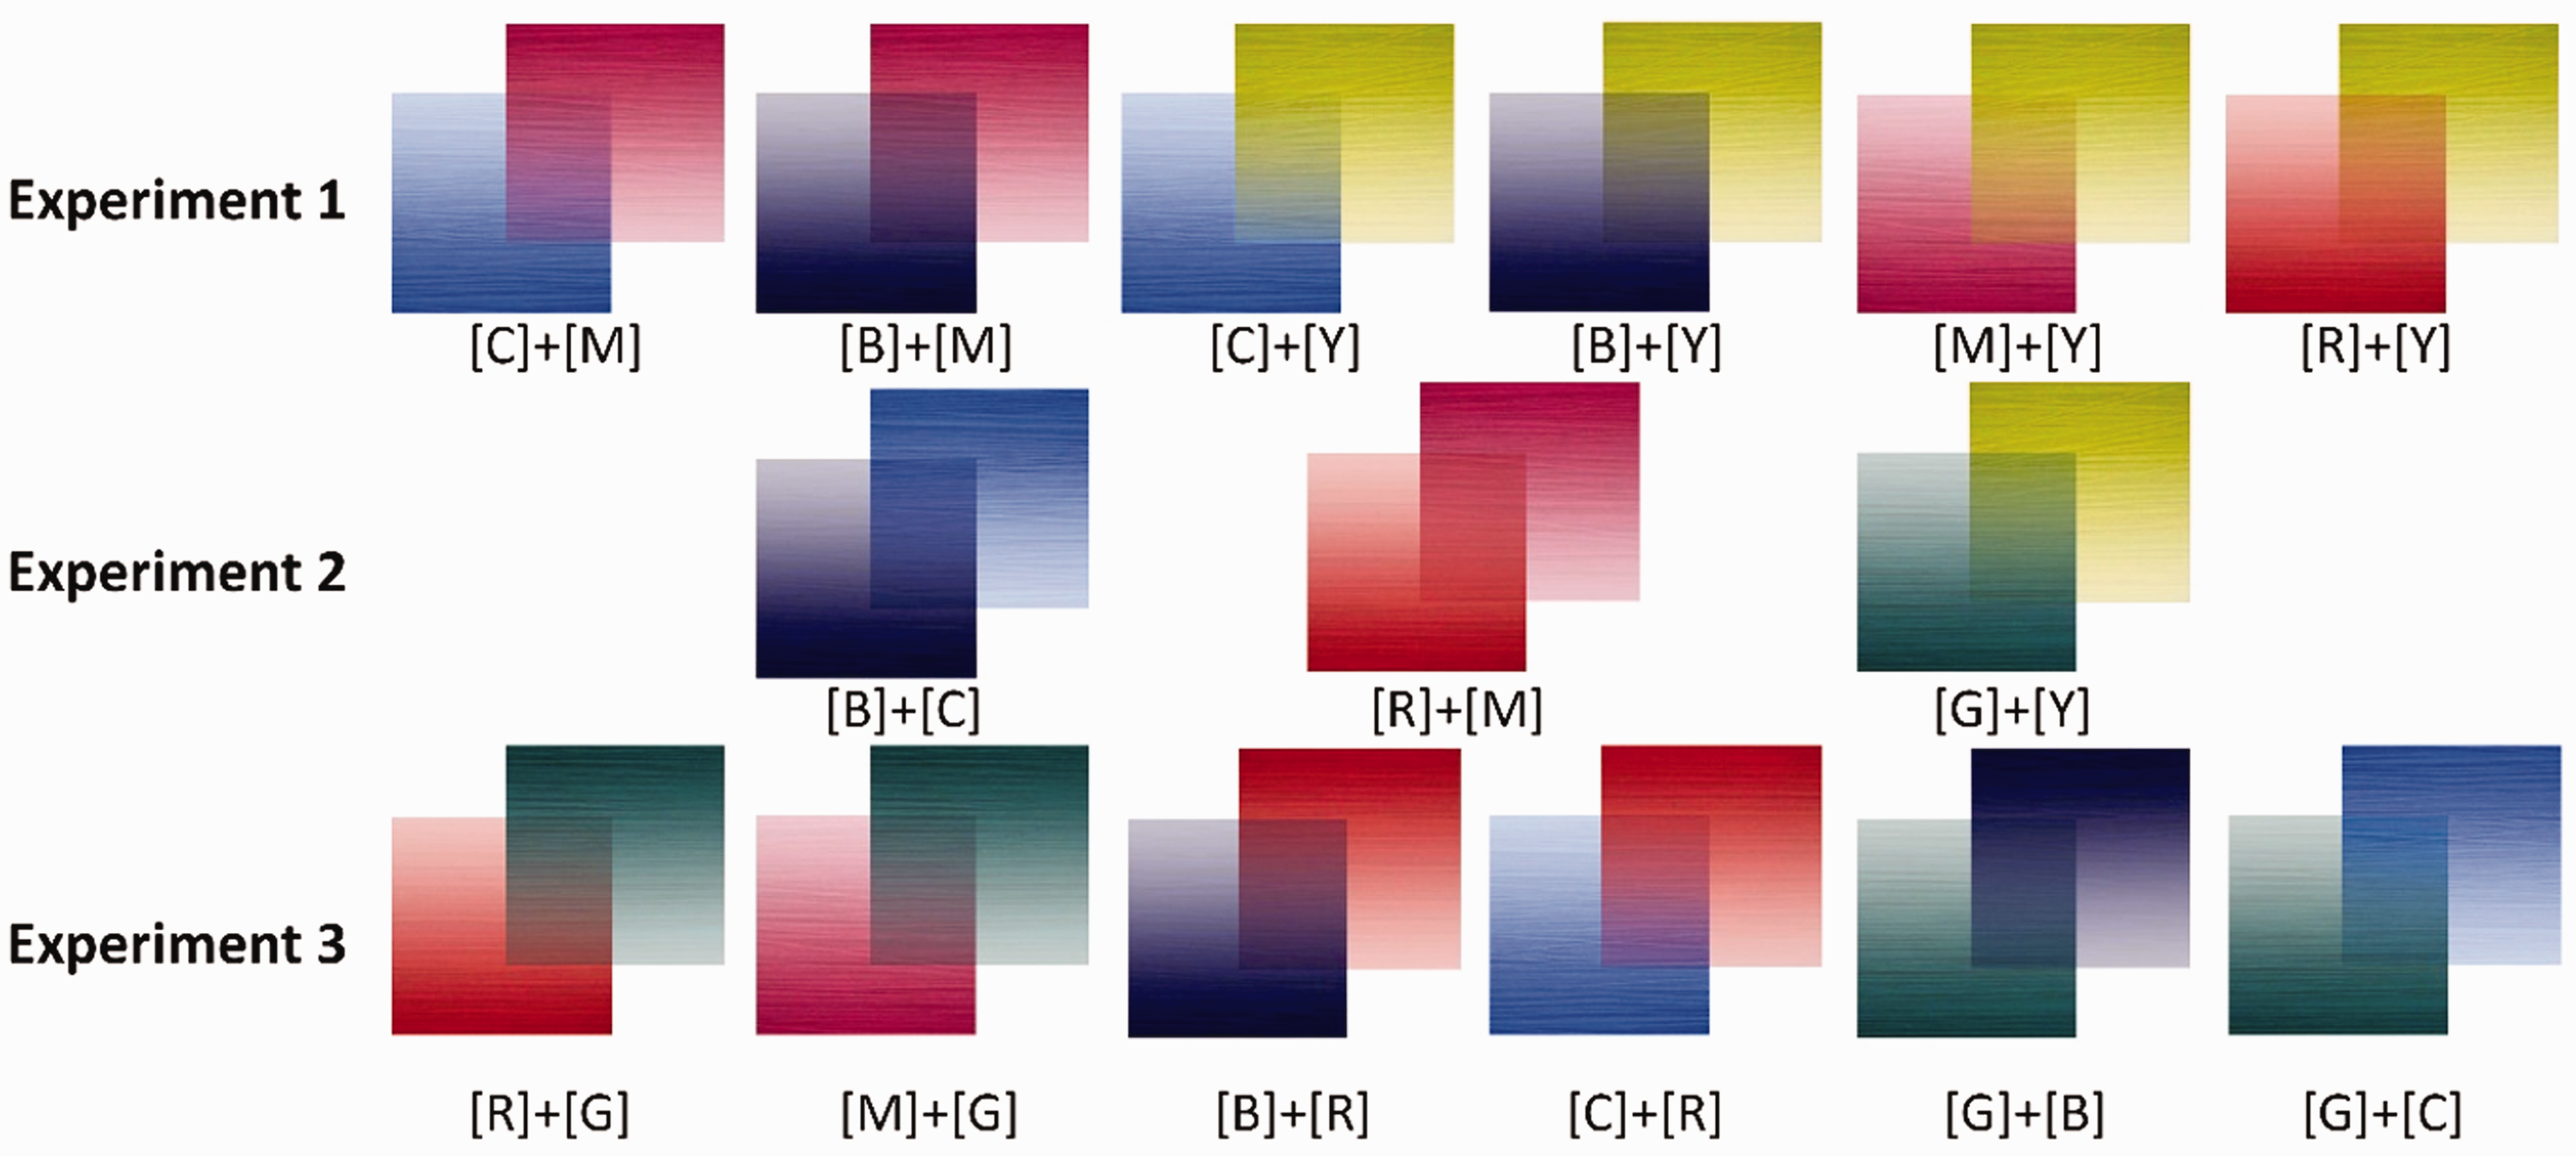
Yarn color combinations in the experimental design.
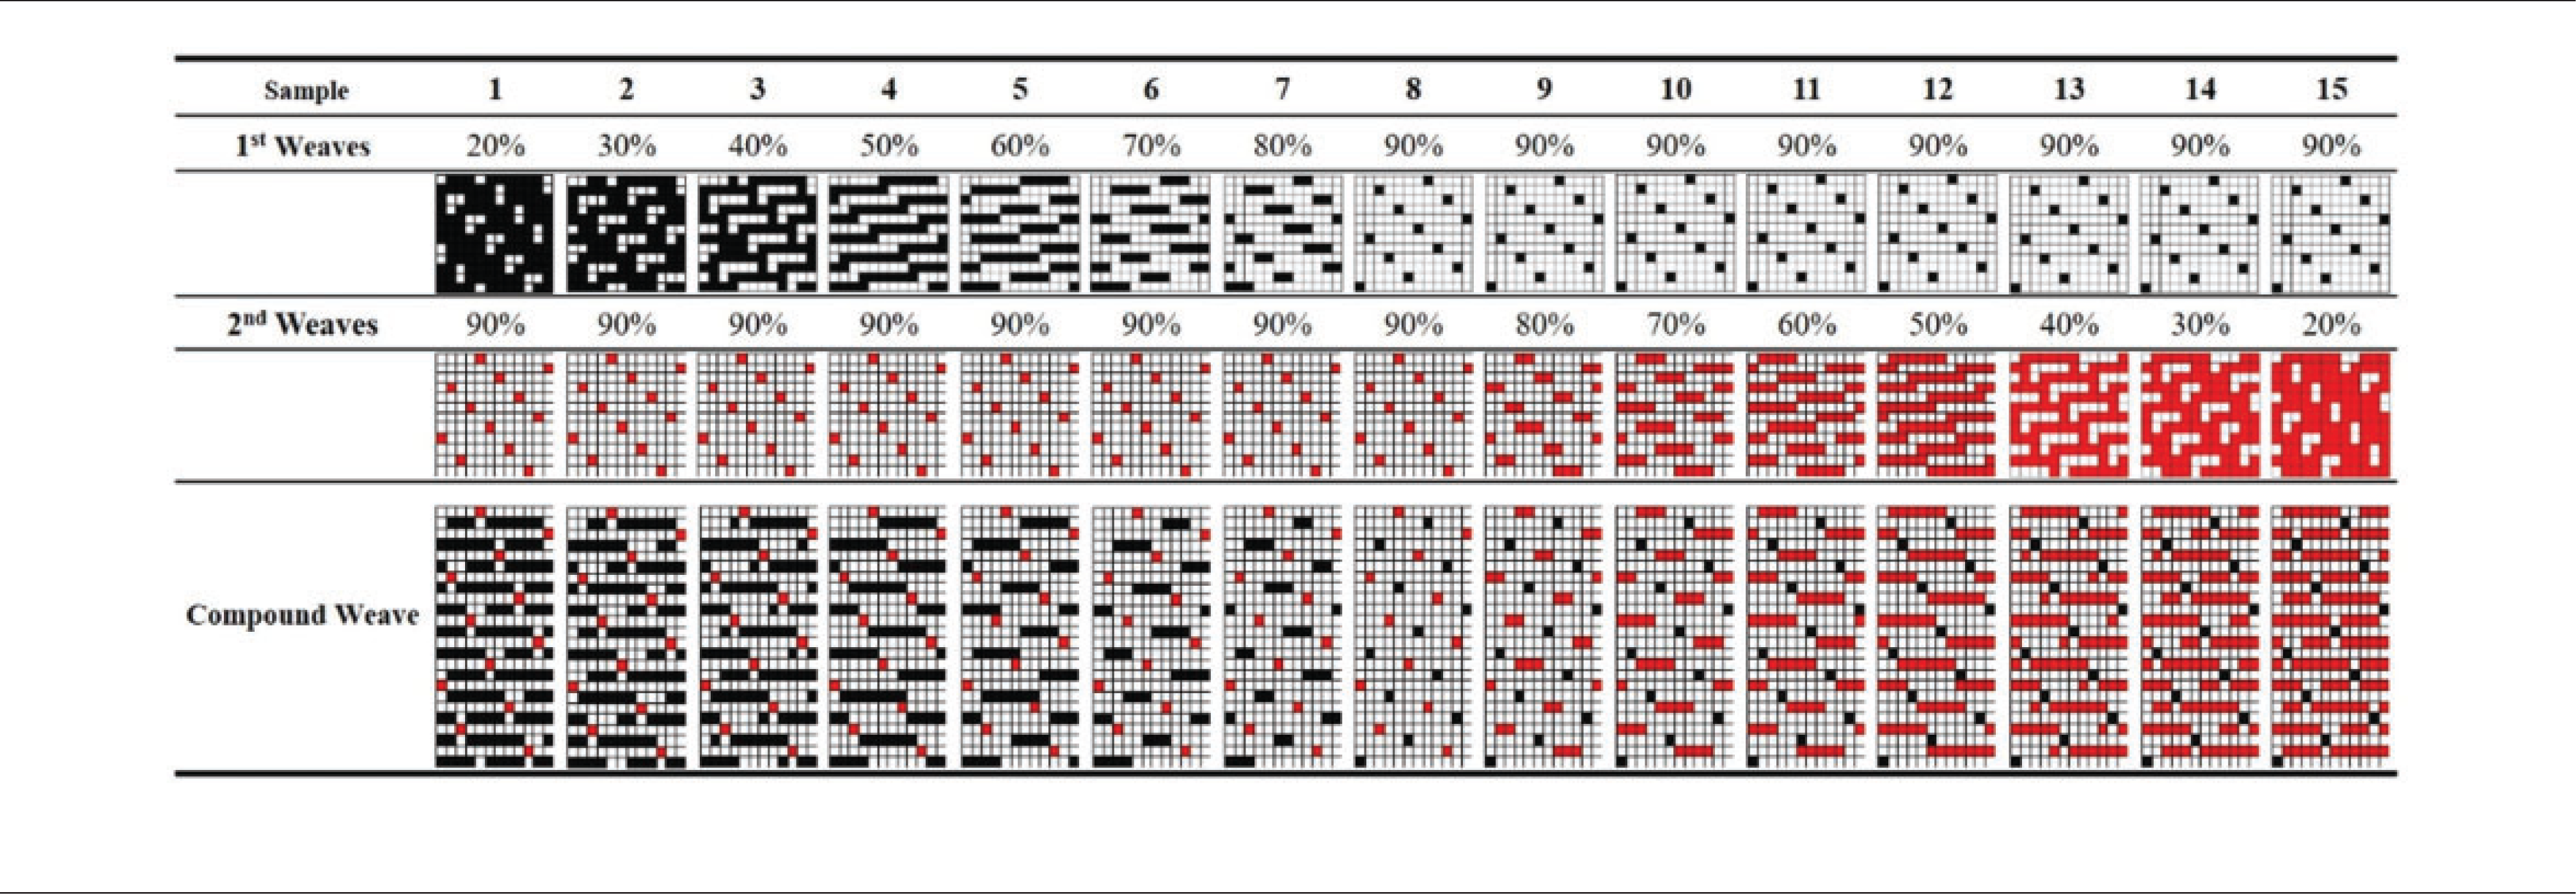
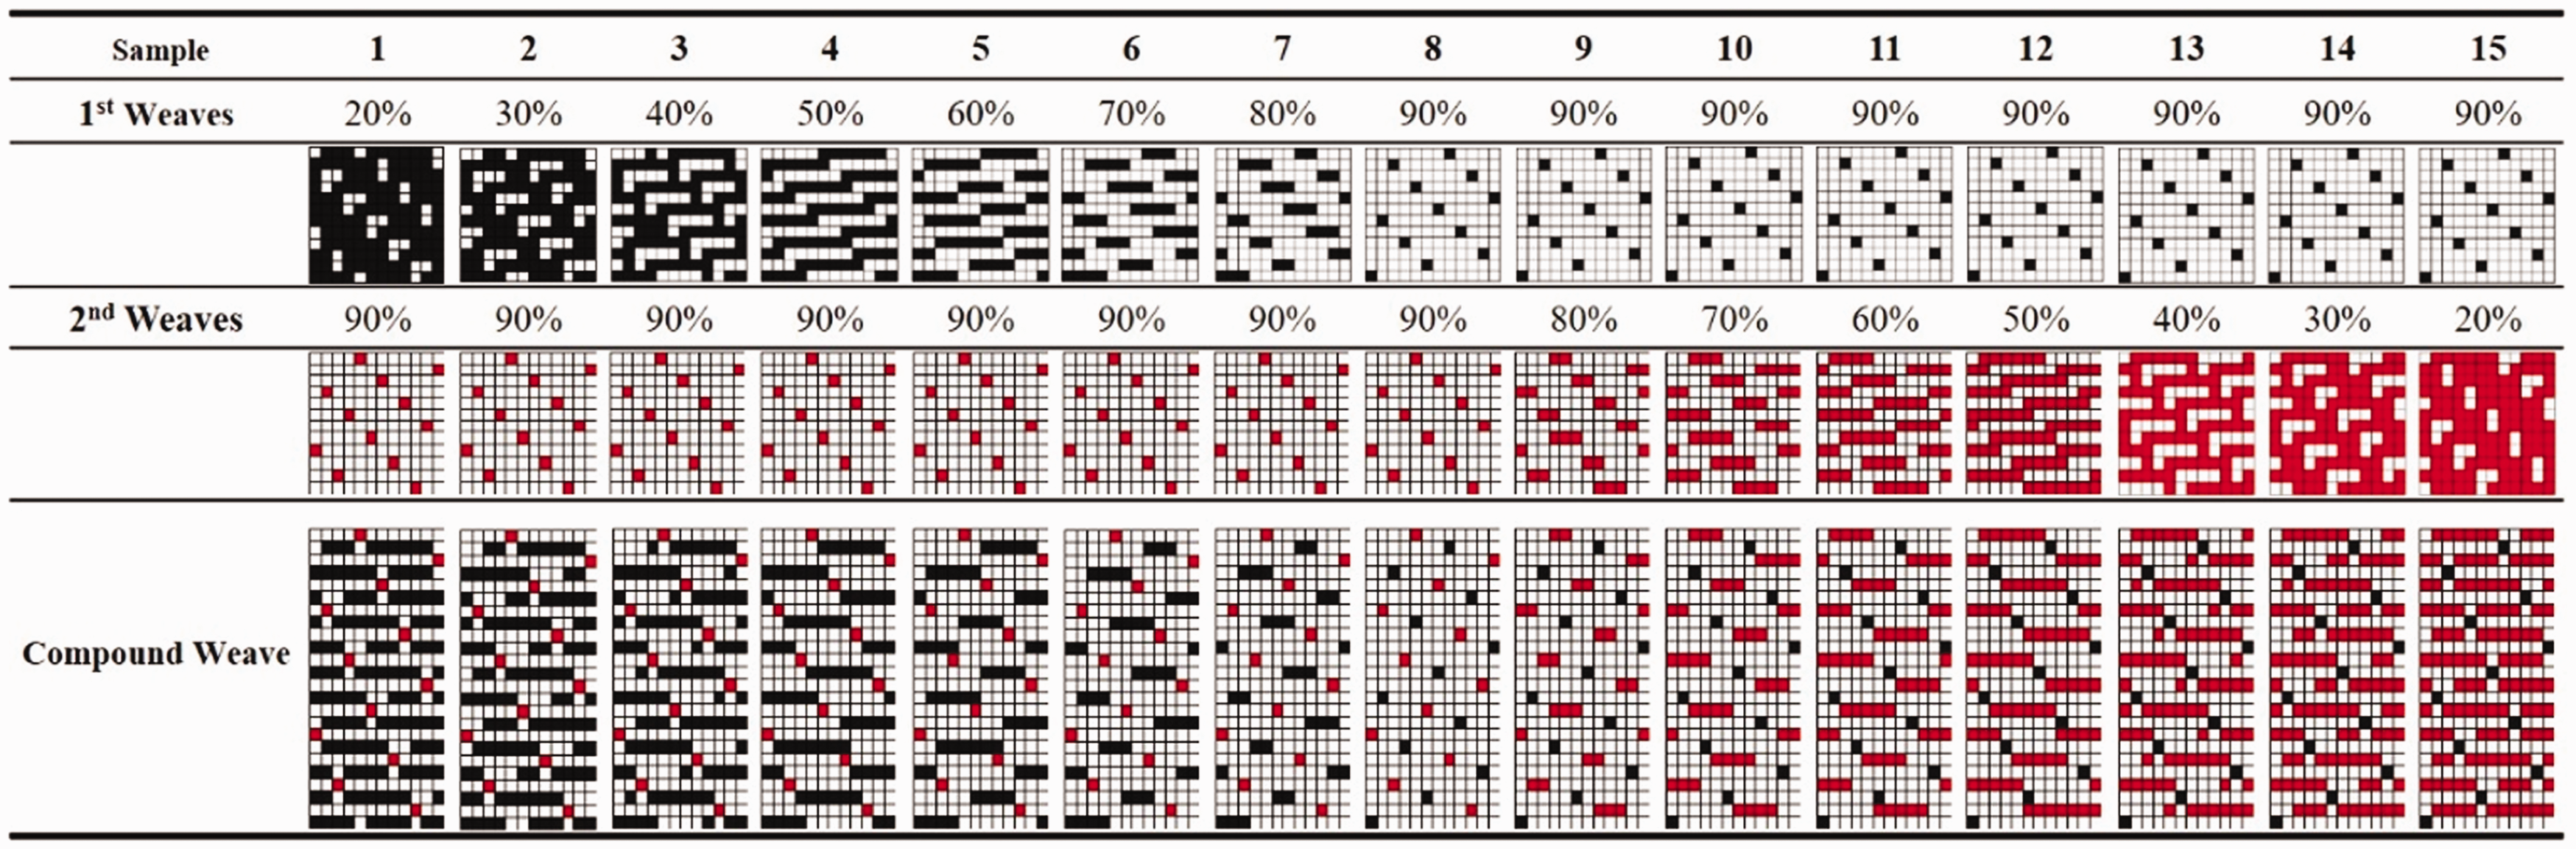
The compound weaves were designed based on two sets of satin weaves (Table 1). Two yarn colors are chosen for the two weave designs. The weave structure applied to the first weft yarn is named “first weaves” and for the second weft color yarn, it is described as “second weaves.” Table 1 shows the percentage of the weft over warp interlacement points. For samples 1–8, all the second weaves have 90% weft over warp points, while the first weaves of the weft over warp interlacements are progressively increased from 20% to 90%. In contrast, from samples 9–15, the first weaves are fixed to 90%, while the weft over warp points for the second weaves are gradually decreased from 80% to 20%.
Experimental design and weave structures
The weaving experiment is introduced in three groups. Figure 3 shows the details of the weaving experiments to examine the weave color results. Firstly, the pair combinations of [C], [M] and [Y] yarns (i.e., [C] + [M] = [B], [C] + [Y] = [G] and [M] + [Y] = [R]) are compared with the weave color samples produced with [B], [R] and [Y] yarns (i.e., [B] + [M], [B] + [Y] and [R] + [Y]). [B] and [R] colors are the secondary colors of the CMYK system, but there are similarities between [C]/[B] and [M]/[R]. Therefore, [C] and [M] are replaced by [B] and [R] respectively for the secondary color production and the differences made in the two sets of weave colors are compared. Secondly, the two colors that have a high similarity are interwoven together to examine alternations made in hue and chroma (i.e., [B] + [C], [R] + [M] and [G] + [Y]). Thirdly, the pair combinations of [R], [G] and [B] samples (i.e., [R] + [G], [R] + [B] and [B] + [G]) are produced and compared with the three groups that are replaced by the similar colors from the CMYK system (i.e., [M] + [G], [R] + [C] and [C] + [G]).
Results and discussion
Color spectra of yarns
The six yarn colors are measured and the CIELAB results are shown in Figure 4. Figure 4 shows that the a* and b* values of the [M] and [R] yarns are close. The lightness values of the [M] and [R] yarns are 46.62 and 42.89, respectively. The [M] yarn is slightly brighter than the [R] yarn. The position of the [C] yarn is in between the [G] and [B] yarn, and the lightness value of the [G], [C] and [B] yarns are 57.69, 63.47 and 29.36, respectively. The [G] and [B] yarns are both darker than the [C] yarn. There is no color close to the [Y] yarn, and it has the highest lightness value (84.54). The [R], [G] and [B] yarns are darker than the [C], [M] and [Y] yarns. The spectrophotometer results show that the a* and b* values of the [C] yarn are in between the values of the [G] and [B] yarns, while the a* and b* values of the [R] yarns are close to the values of the [M] yarn.
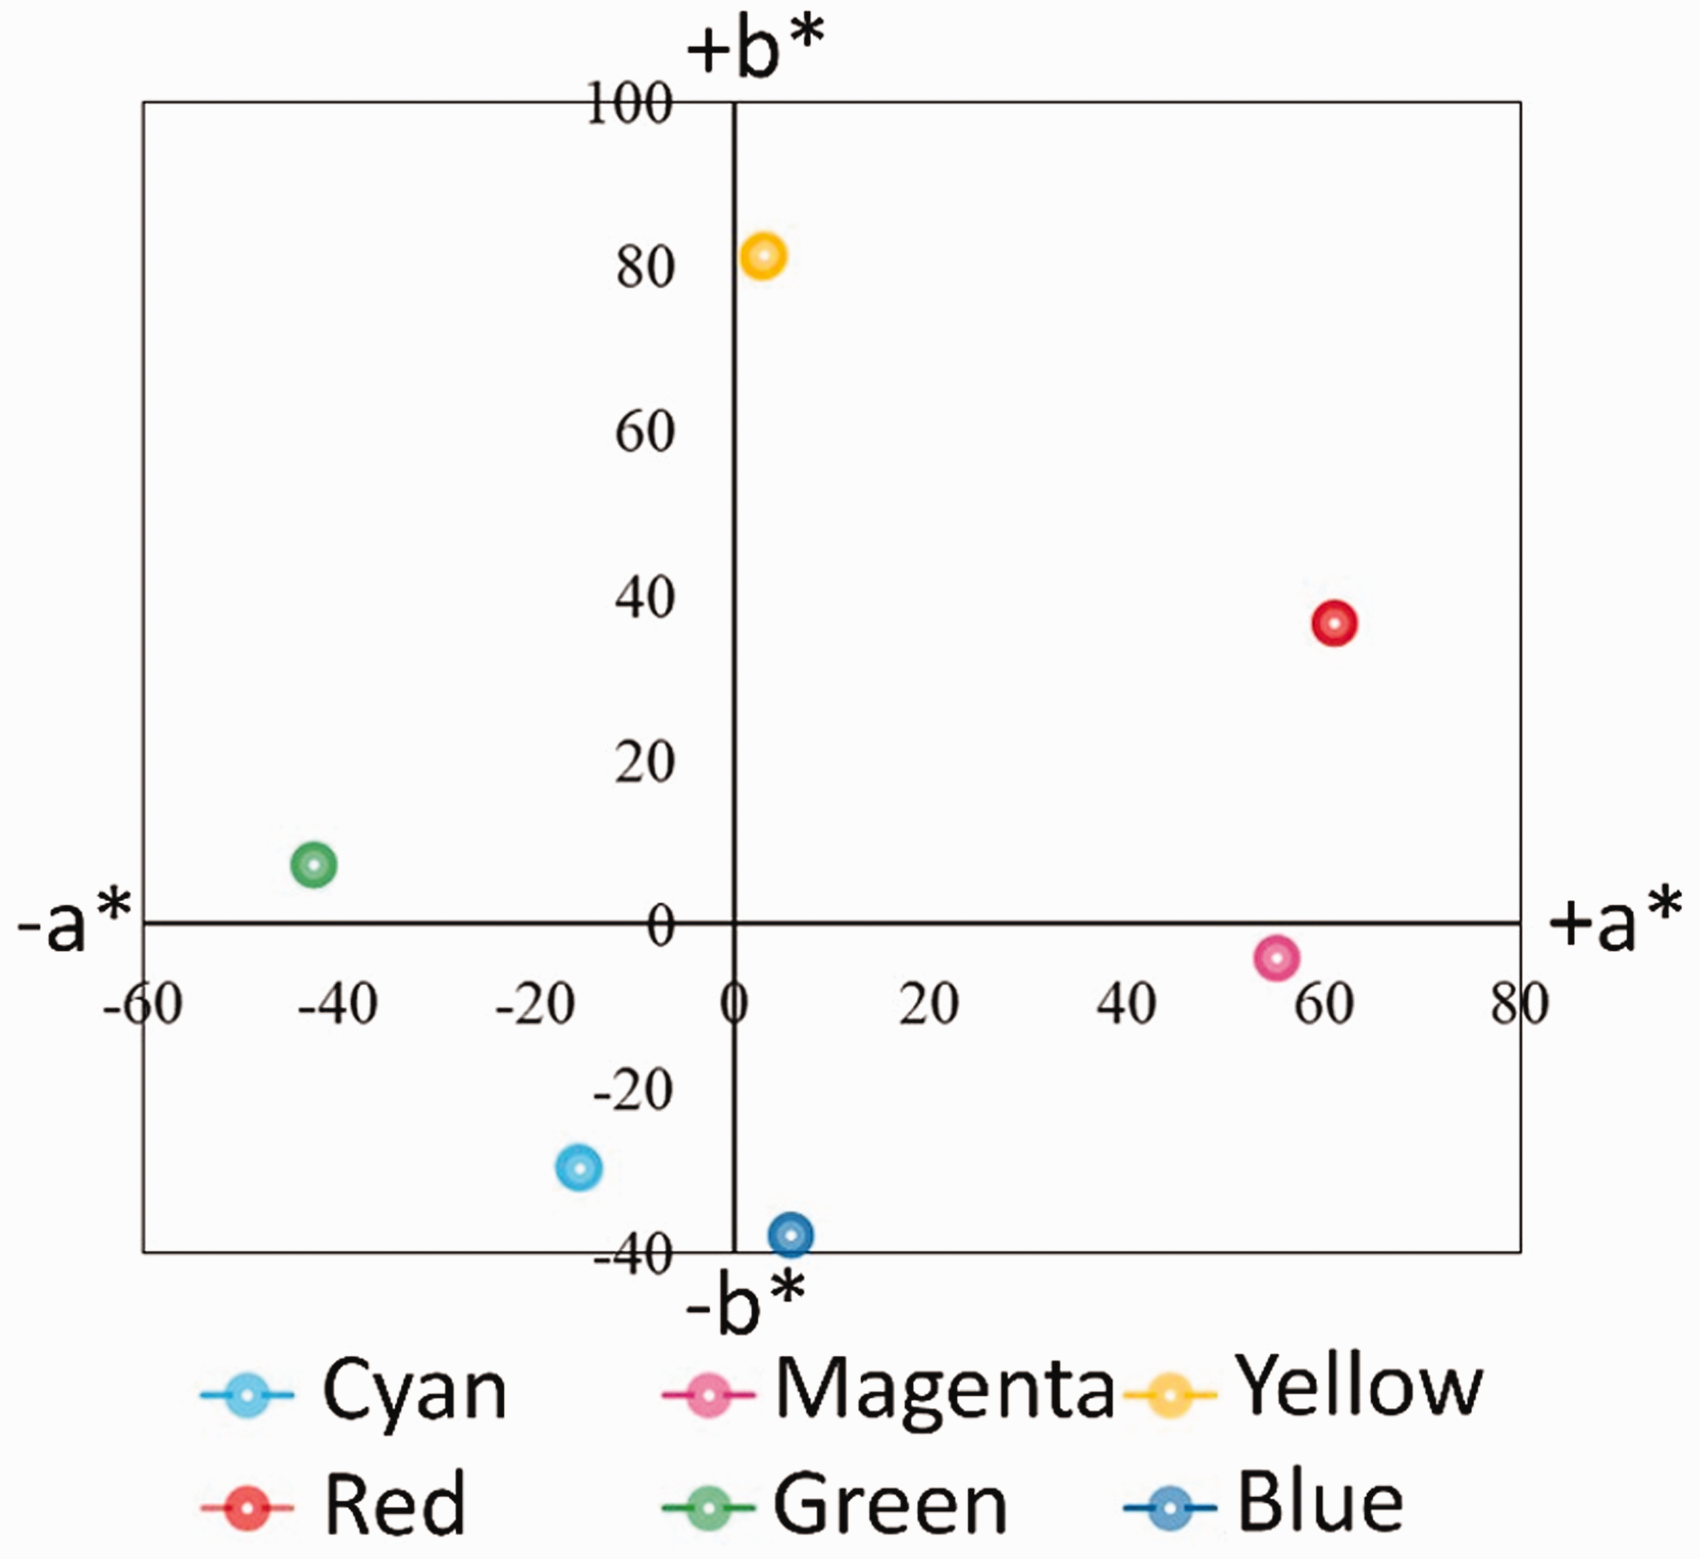
Spectrophotometer results of the six yarns.
Secondary weave color production using different primary colors
In this study, two sets of primary colors (CMY and BRY) are used for secondary weave color production. In the CMYK color system, a pair of [C], [M] and [Y] is juxtaposed to produce secondary colors (i.e., [C] + [M] = [B], [C] + [Y] = [G] and [M] + [Y] = [R]). However, as the [B] yarn is closed to the [C] yarn and the [R] yarn is similar to the [M] yarn, new pair combinations are proposed (i.e., [B] + [M], [B] + [Y] and [R] + [Y]) to inspect the difference made in the secondary color production. The pair combination of [C], [M] and [Y] is firstly produced and then [C] and [M] are replaced by [B] and [R], respectively. The experimental results are shown in Figure 5 to compare the two sets of weave color production.
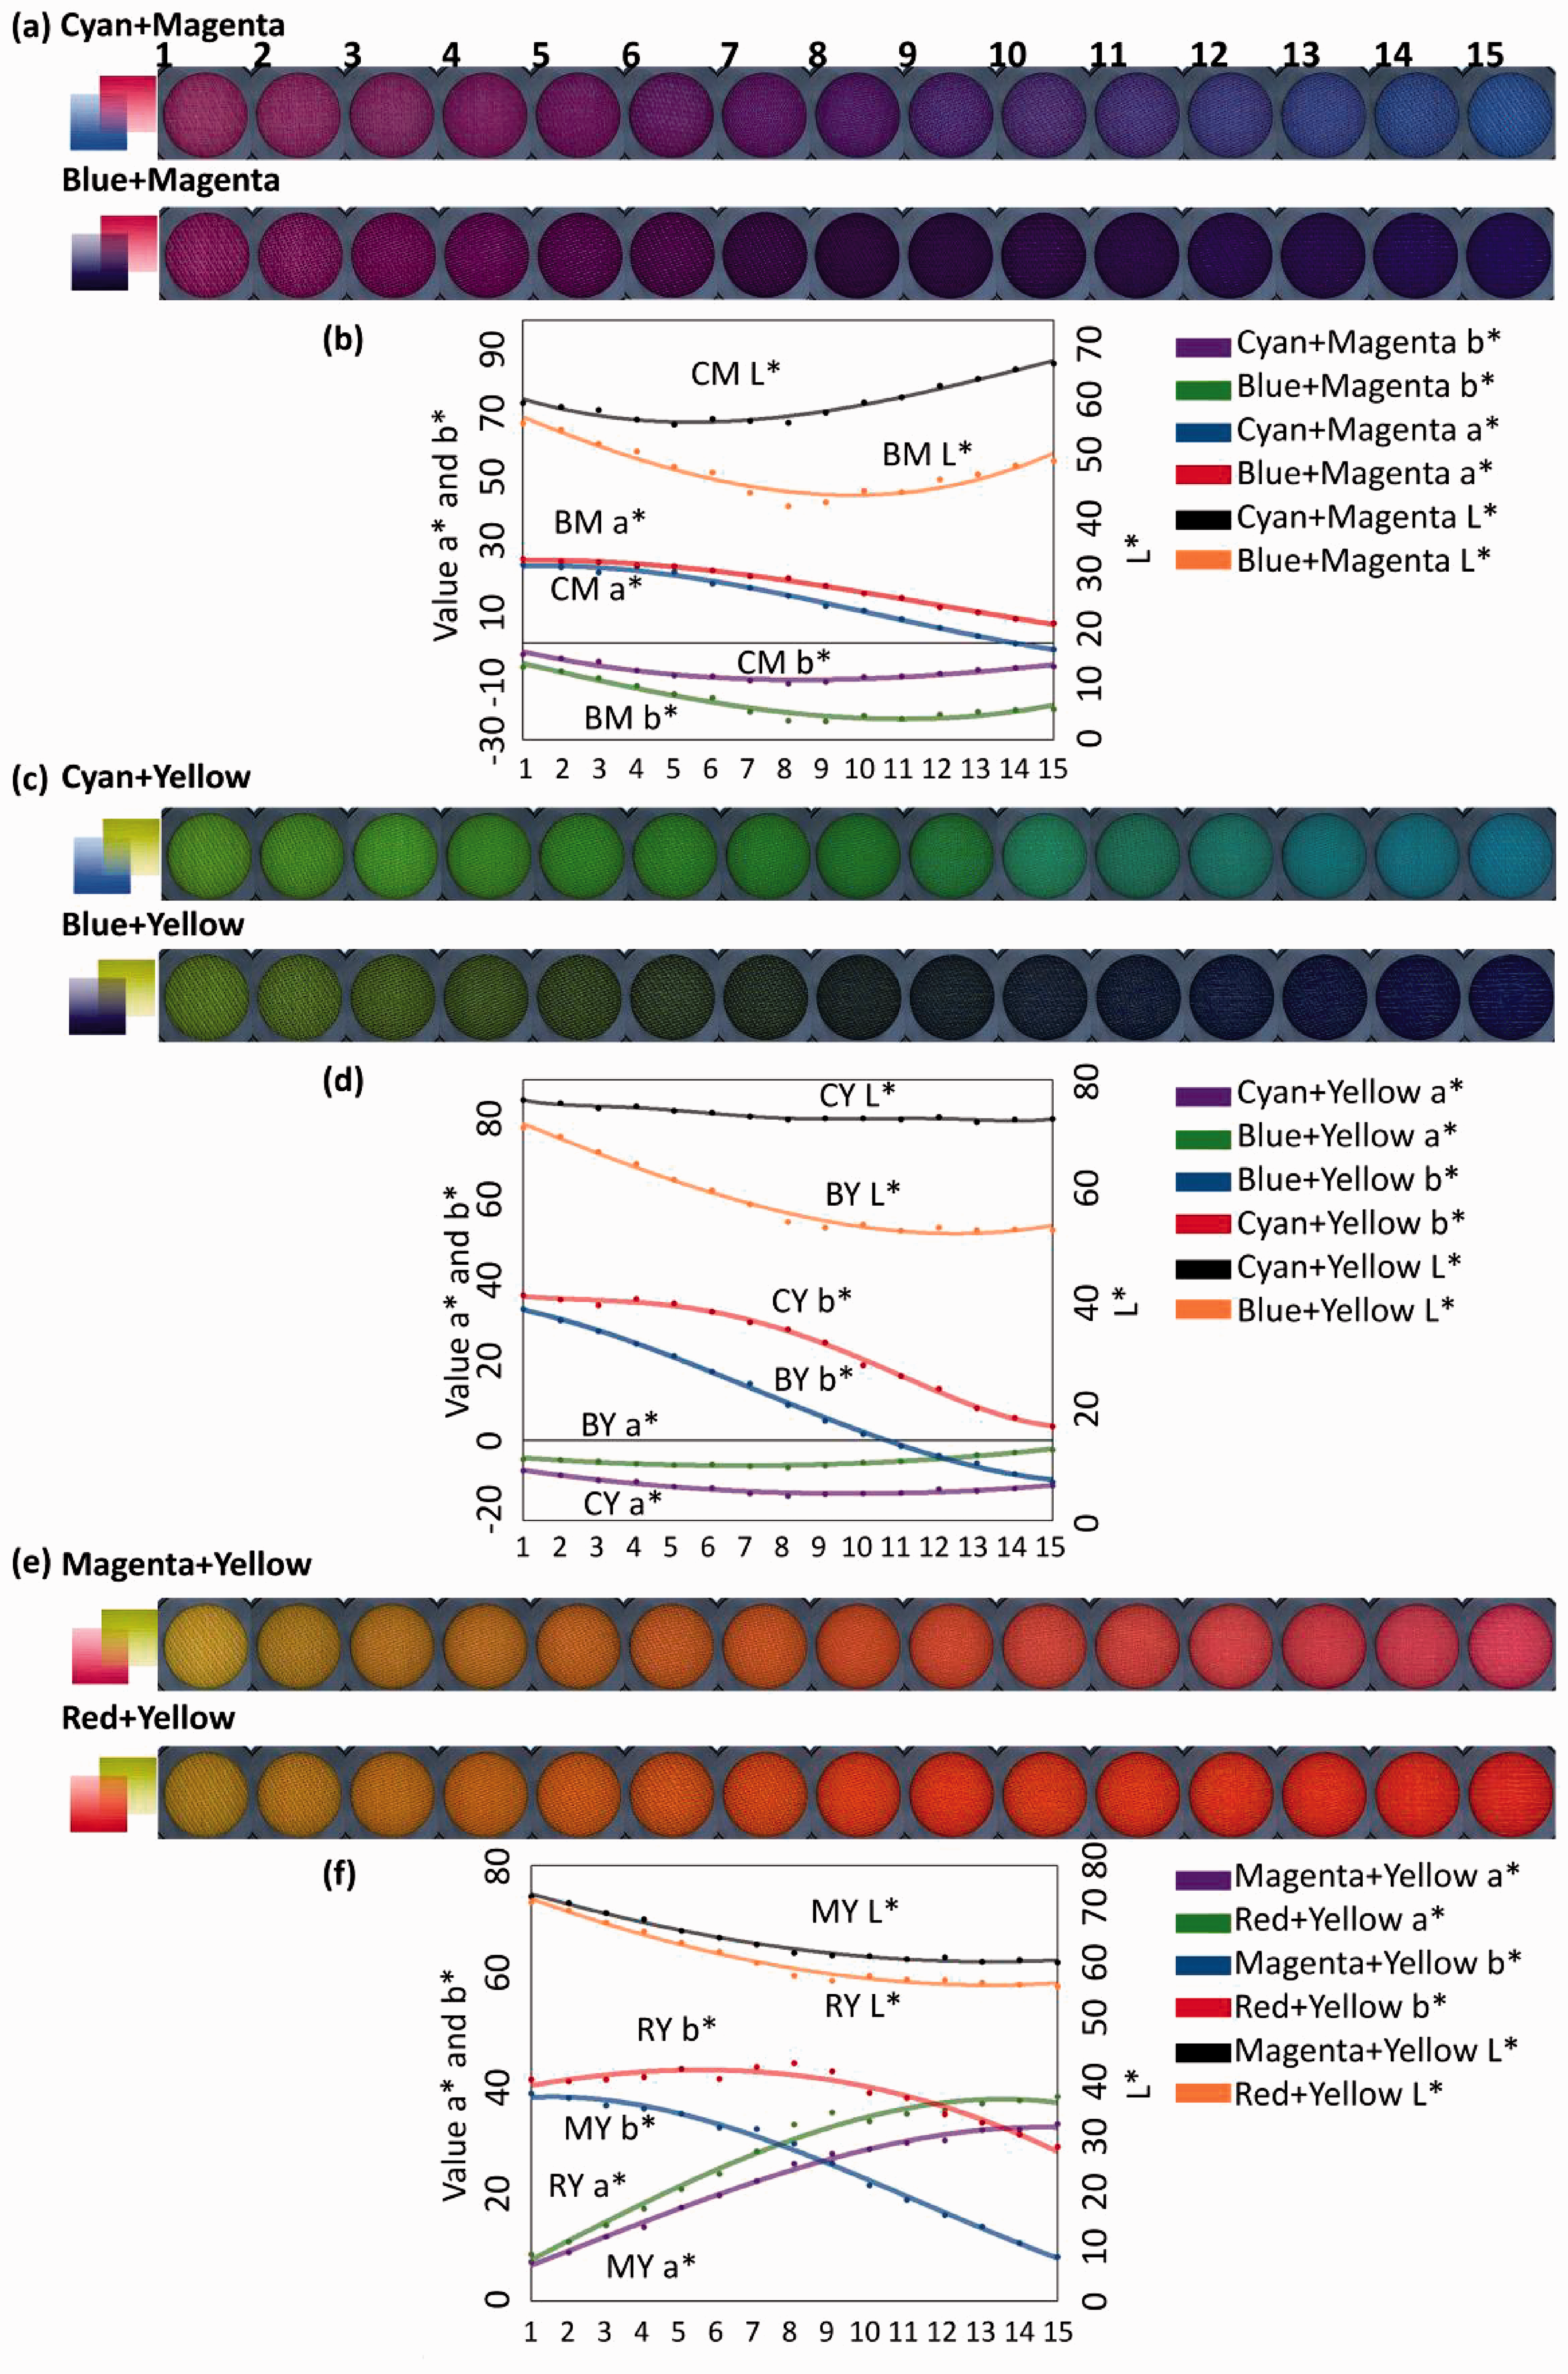
Secondary color production comparison: (a) fabric images of [C] + [M] versus [B] + [M]; (b) lightness, a* and b* values of [C] + [M] versus [B] + [M] samples; (c) fabric images of [C] + [Y] versus [B] + [Y]; (d) lightness, a* and b* values of [C] + [Y] versus [B] + [Y] samples; (e) fabric images of [M] + [Y] versus [R] + [Y]; (f) lightness, a* and b* values of [M] + [Y] versus [R] + [Y] samples.
Figure 5(a) shows images of the [C] + [M] and [B] + [M] weave colors. All images were taken from the real fabric specimens under the same condition. The numbers marked on the [C] + [M] specimens represent the number of weave structures applied to the fabrics, as shown in Table 1. The rest of the specimens were organized in the same order.
Figure 5(a) shows that the colors of the [C] + [M] weave samples are gradually changed from magenta to cyan, while the [B] + [M] weave samples are shown to have color alternation from magenta to blue. The CIELAB values of the fabrics are shown in Figure 5(b). For both [C] + [M] and [B] + [M] samples, the a* values are gradually decreased, which indicates the redness being reduced with the higher percentage of the [C] and [B] yarns shown on the face of fabrics. The b* values of both the [C] + [M] and [B] + [M] samples are negative. The b* values of the [C] + [M] samples are constant when compared to the [B] + [M] samples. The b* values of the [B] + [M] samples are all lower than the b* value of the [C] + [M] samples, which indicates that the [B] + [M] samples showed more blueness than the [C] + [M] samples. For both [C] + [M] and [B] + [M], sample 8 has the lowest b* value. As the two weft colors ([C]/[M] and [B]/[M]) are exhibited for the most part (90%) on the face of the fabric, they showed the bluest sensation. All lightness values of the [C] + [M] samples are higher than the values of the [B] + [M] samples, indicating that replacing [C] with [B] decreases the lightness of the fabric.
The [B] + [Y] samples are compared with the [C] + [Y] samples, and the results are shown in Figure 5(c). The colors of the [C] + [Y] samples 1–15 are gradually changed from greenish-yellow to green, while the colors of the [B] + [Y] samples are altered from greenish-yellow to blue. The CIELAB results are shown in Figure 5(d). The lightness values of the [C] + [Y] samples are higher than those of the [B] + [Y] samples, which indicate that the [C] + [Y] samples are lighter compared to the [B] + [Y] samples. The a* values of both [C] + [Y] and [B] + [Y] samples remained constant and all a* values are negative, which indicates the green tone in the fabric colors. The b* values of both [C] + [Y] and [B] + [Y] samples are decreased. The [C] + [Y] samples have positive b* values, which are correlated with the yellow sensation resulting from the [Y] yarn involvement. However, the [B] + [Y] sample 11 shows that the b* value is further decreased to a negative value, which means the fabric mainly shows the blue color. By replacing [C] with [B], a higher vividness of blue was apparent in the weave colors.
The prototypes of the [M] + [Y] and [R] + [Y] weave color samples are shown in Figure 5(e). The weave colors of the [M] + [Y] samples gradually changed from yellow to magenta, while the [R] + [Y] samples showed color alternation from a yellow to a red tone. As shown in Figure 5 (f), all a* values of the [R] + [Y] samples are higher than those of the [M] + [Y] samples, which proves that the [R] yarn brought a higher vividness of red. All the b* values are positive, which indicates the yellow component in the weave colors. The lightness of the [R] + [Y] samples is lower than that of the [M] + [Y] samples, representing that the [R] + [Y] samples are slightly darker than the [M] + [Y] samples.
Similar primary color yarn juxtaposition
The two colors that have a high similarity are juxtaposed to examine alternations made in the hue, chroma and lightness. Based on the yarn color measurements (Figure 4), three groups are made between the two sets of primaries (i.e., [B] + [C], [R] + [M] and [G] + [Y]). In each pair combination, 15 weave color samples are produced.
Figure 6(a) shows the weave color samples produced by mixing the [B] and [C] yarns. The number of samples aligns with the weave structures applied to the fabrics (Table 1). The spectral reflectance curves of the [B] + [C] samples are shown in Figure 6(a′). The peak of sample 1 is at 470 nm, and it shifts to 460 nm from sample 2 to sample 4, and samples 5–15 have the highest peaks at 450 nm. All reflectance peaks are in the blue color zone. Figure 6(a″) shows that the lightness decreased following the specimen numbers. The chroma of the weave samples is shown in Table 2. The chroma values of the weave color samples are compared between samples that have the same number of weft over warp interlacements, for example, sample 7 (80% [B] + 90% [C]) and sample 9 (90% [B] + 80% [C]). The chroma values of the [B] + [C] samples are higher with a higher percentage of [B] component shown on the surface, representing more colorfulness being brought into the weave color samples. The a* values of the [B] + [C] fabrics are all negative and they increased as the sample numbers grew. The b* values are also all negative, which correlates with the blue sensation. The b* values are decreased from sample 1 to sample 9 and remained constant from sample 10 to sample 15. The a* and b* values indicate that the [B] yarn has a major effect on the weave color.
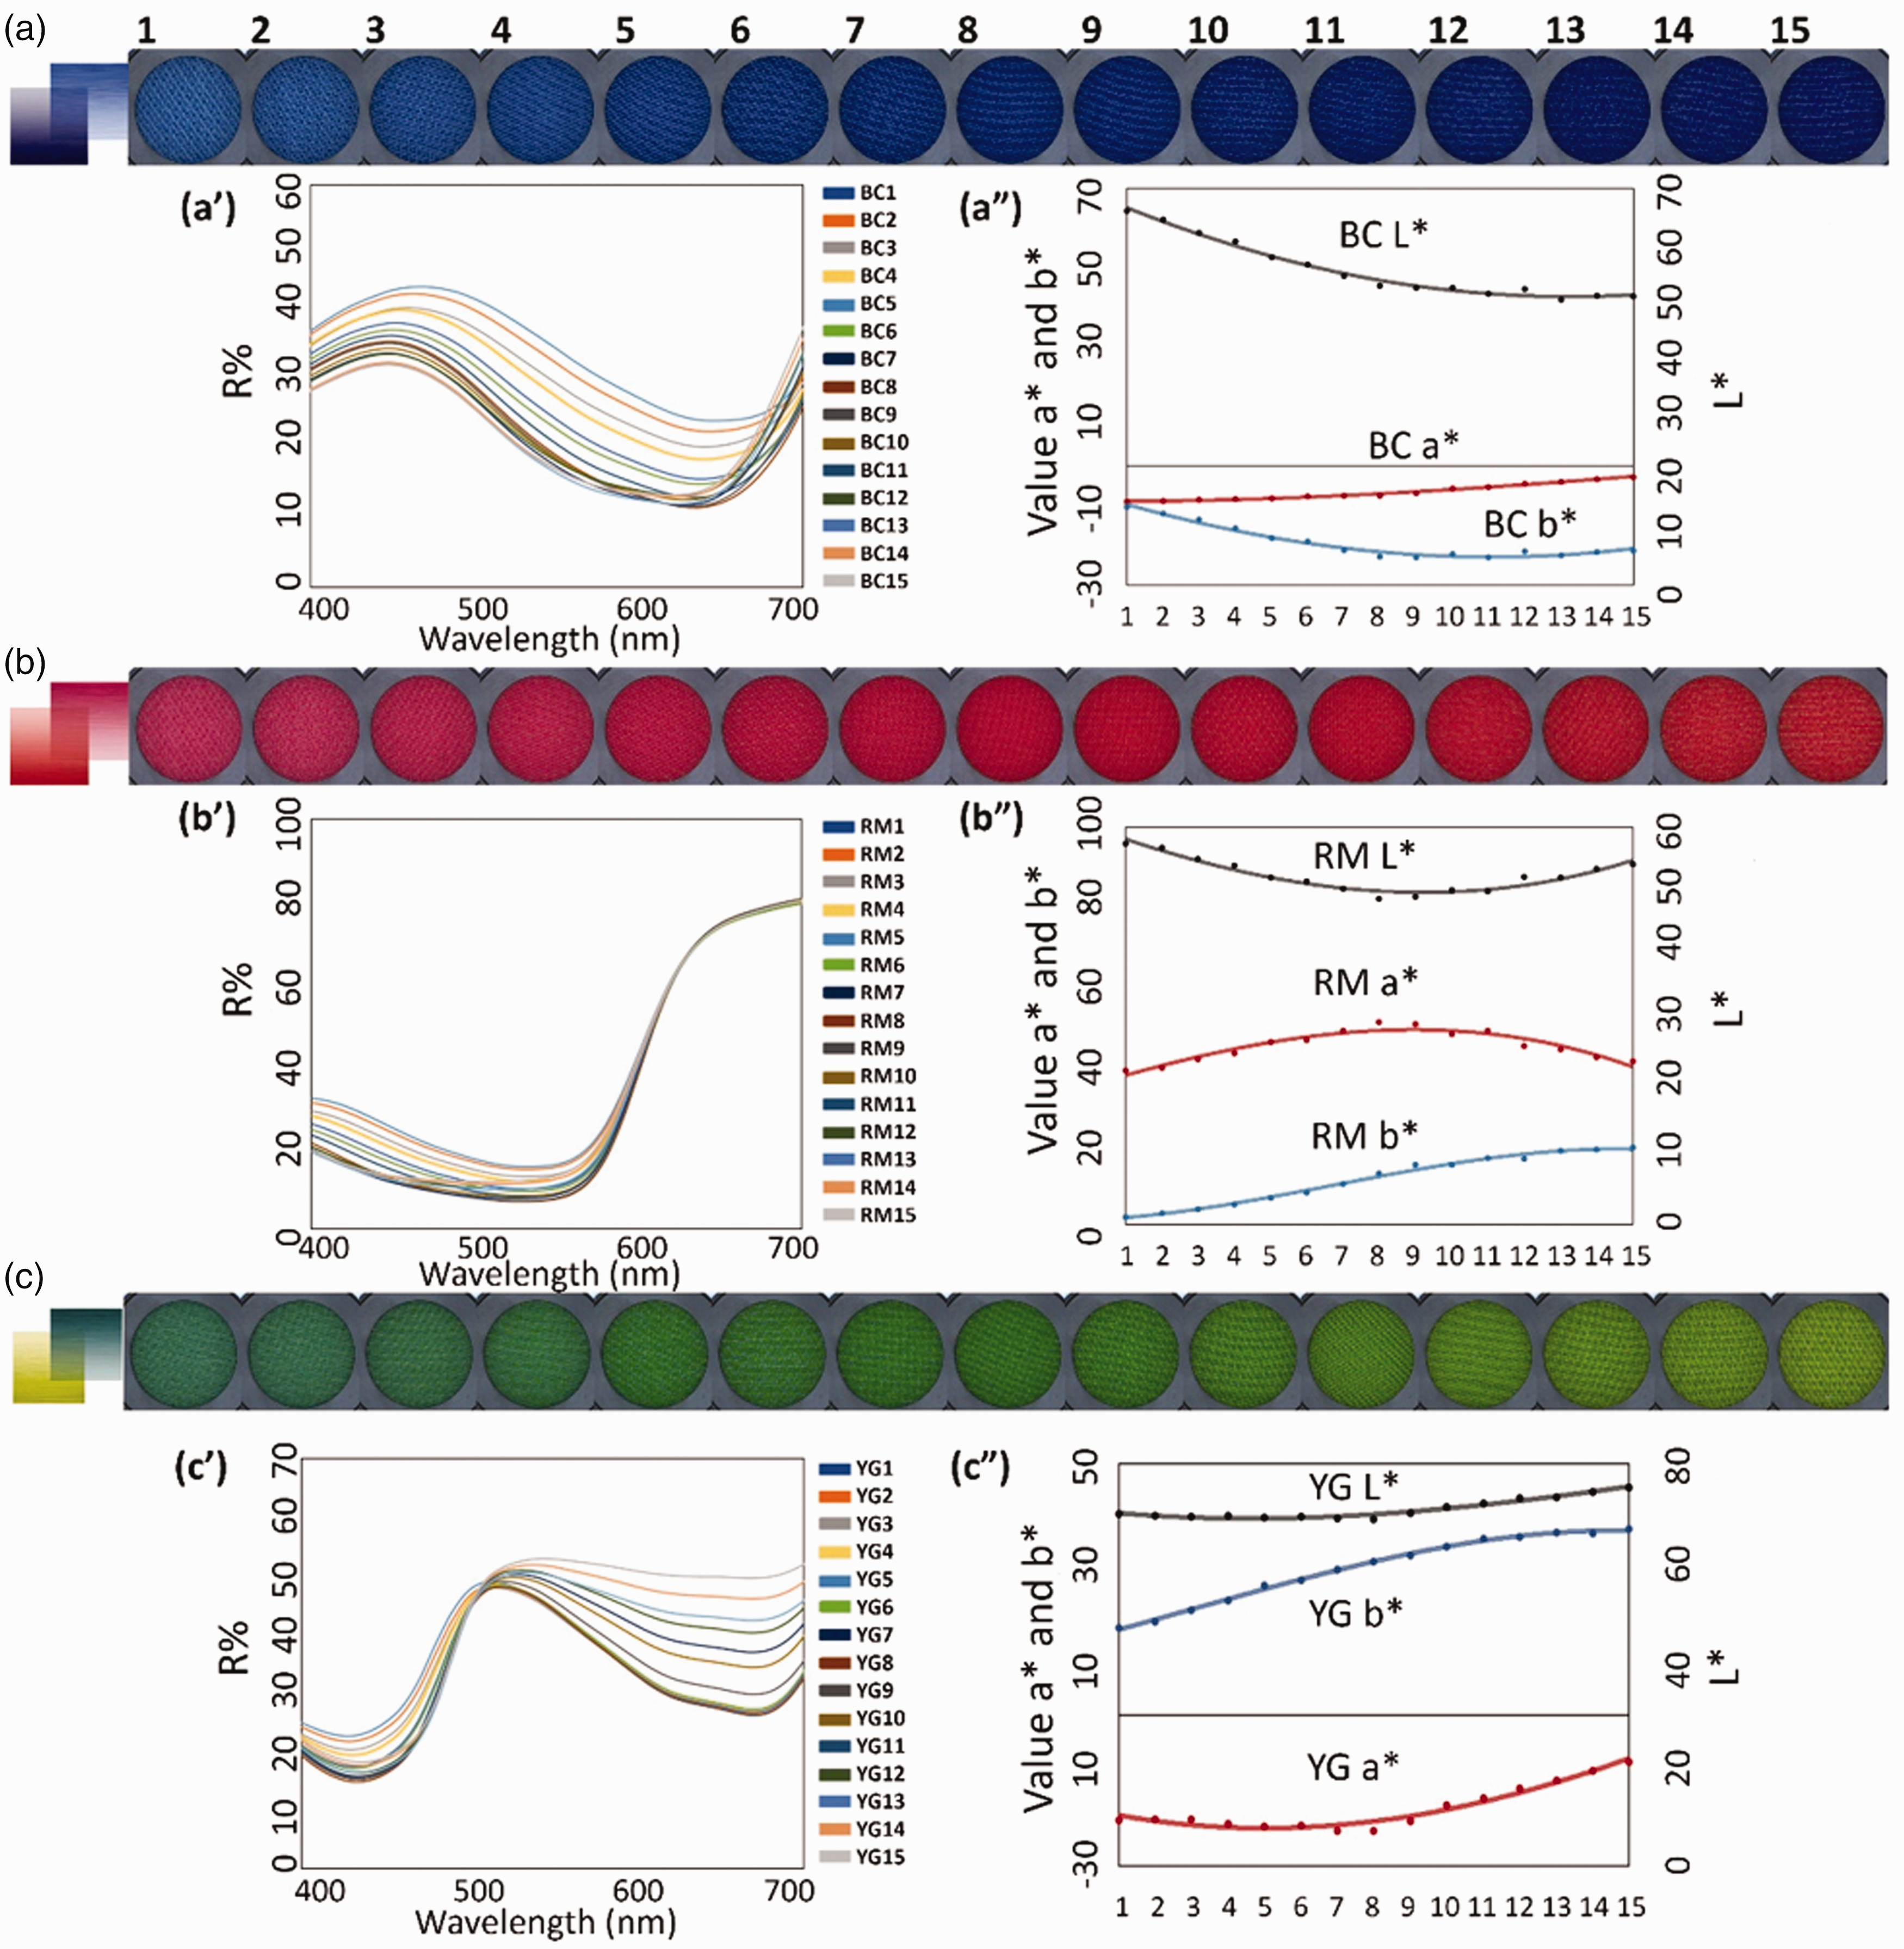
Weave color enhancement by juxtaposing two colors with high similarity: (a) photos of [B] + [C] fabrics; (a′) spectral reflectance curves of [B] + [C] samples; (a″) CIELAB values of [B] + [C] samples; (b) [R] + [M] fabrics; (b′) spectral reflectance curves of [R] + [M] specimens; (b″) CIELAB values of [R] + [M] fabric samples; (c) [Y] + [G] fabrics; (c′) spectral reflectance curves of [Y] + [G] samples; (c″) CIELAB values of [Y] + [G] samples.
The chroma of the color enhancement samples
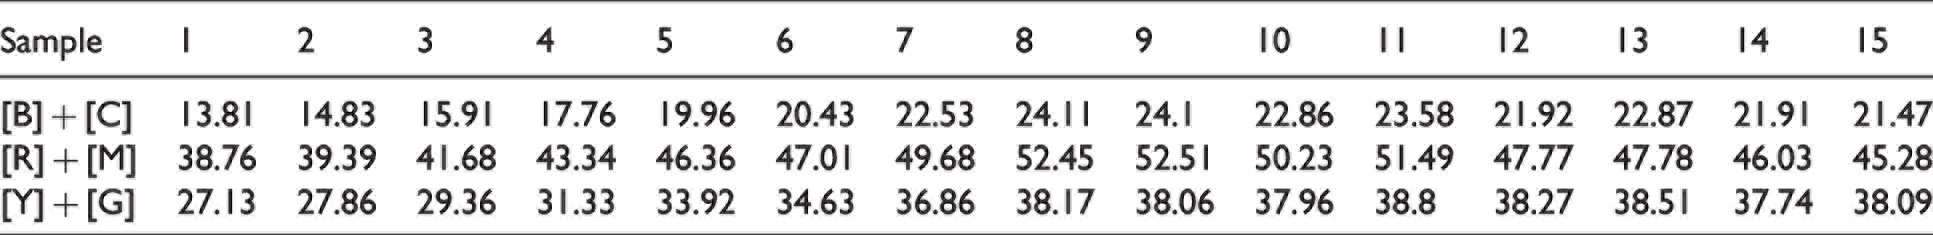
Figure 6(b) shows the weave color samples produced by juxtaposing the [R] and [M] yarns. There is a broad peak from 640 to 700 nm for all [R] + [M] samples (Figure 6(b′)), which represents the red color. There is one high reflectance peak in the spectrum that indicates that the fabric samples have high chroma. 18 The chroma of the [R] + [M] samples is the highest compared to the [B] + [C] and [Y] + [G] samples (Table 2). The CIELAB values are shown in Figure 6(b″); the lightness values of all samples are around 55. The a* and b* values of the [R] + [M] samples are all positive. Sample 8 has the highest a* value, as the red and magenta yarns show most of their colors on the fabric surface. Although the a* and b* values of the [R] + [M] samples are relatively constant, the samples produced with higher [R] content showed higher chroma values, which represents the more vivid red color produced by using [R] yarns for weave color production.
Figure 6(c) shows the prototype of the [Y] + [G] weave samples that display different shades of green colors. The spectral reflectance curves of the [Y] + [G] samples are shown in Figure 6(c′). The peaks of the [Y] + [G] samples are shifted from 510 to 540 nm, which are all in the green color zone. All a* values of the [Y] + [G] samples are negative, which correlates with the green sensation. The b* values are all positive, indicating the yellowness component in the weave sample colors. The chroma values of the [Y] + [G] fabrics are shown in Table 2. The chroma values of samples 1–7 are increased, while the values of samples 8–15 are stable. As a result, when the same amount of the [Y] yarn is exhibited on the surface, the chroma of the fabrics is not affected by reducing the green yarns. The lightness values of the [Y] + [G] fabrics are constant from sample 1 to sample 15, and the values are the highest among the three sets of weave color samples ([B] + [C], [R] + [M], [Y] + [G]). As human eyes are more sensitive to yellow colors, the hue of the [Y] yarn stands out as the lightest. 25
Investigation of the [R], [G], [B], [C] and [M] yarn color mixing effects
The [R], [G] and [B] yarns were paired and produced three groups of weave color samples (i.e., [R] + [G], [R] + [B] and [B] + [G]). These weave color samples were compared with another three groups of samples that were produced by replacing the [R], [G] and [B] yarn colors with similar colors from the CMYK color system (i.e., [M] + [G], [R] + [C] and [C] + [G]). Images of the weave colors samples and their spectral reflectance curves are shown in Figure 7. The measured lightness and calculated hue and chroma values are shown in Table 3.
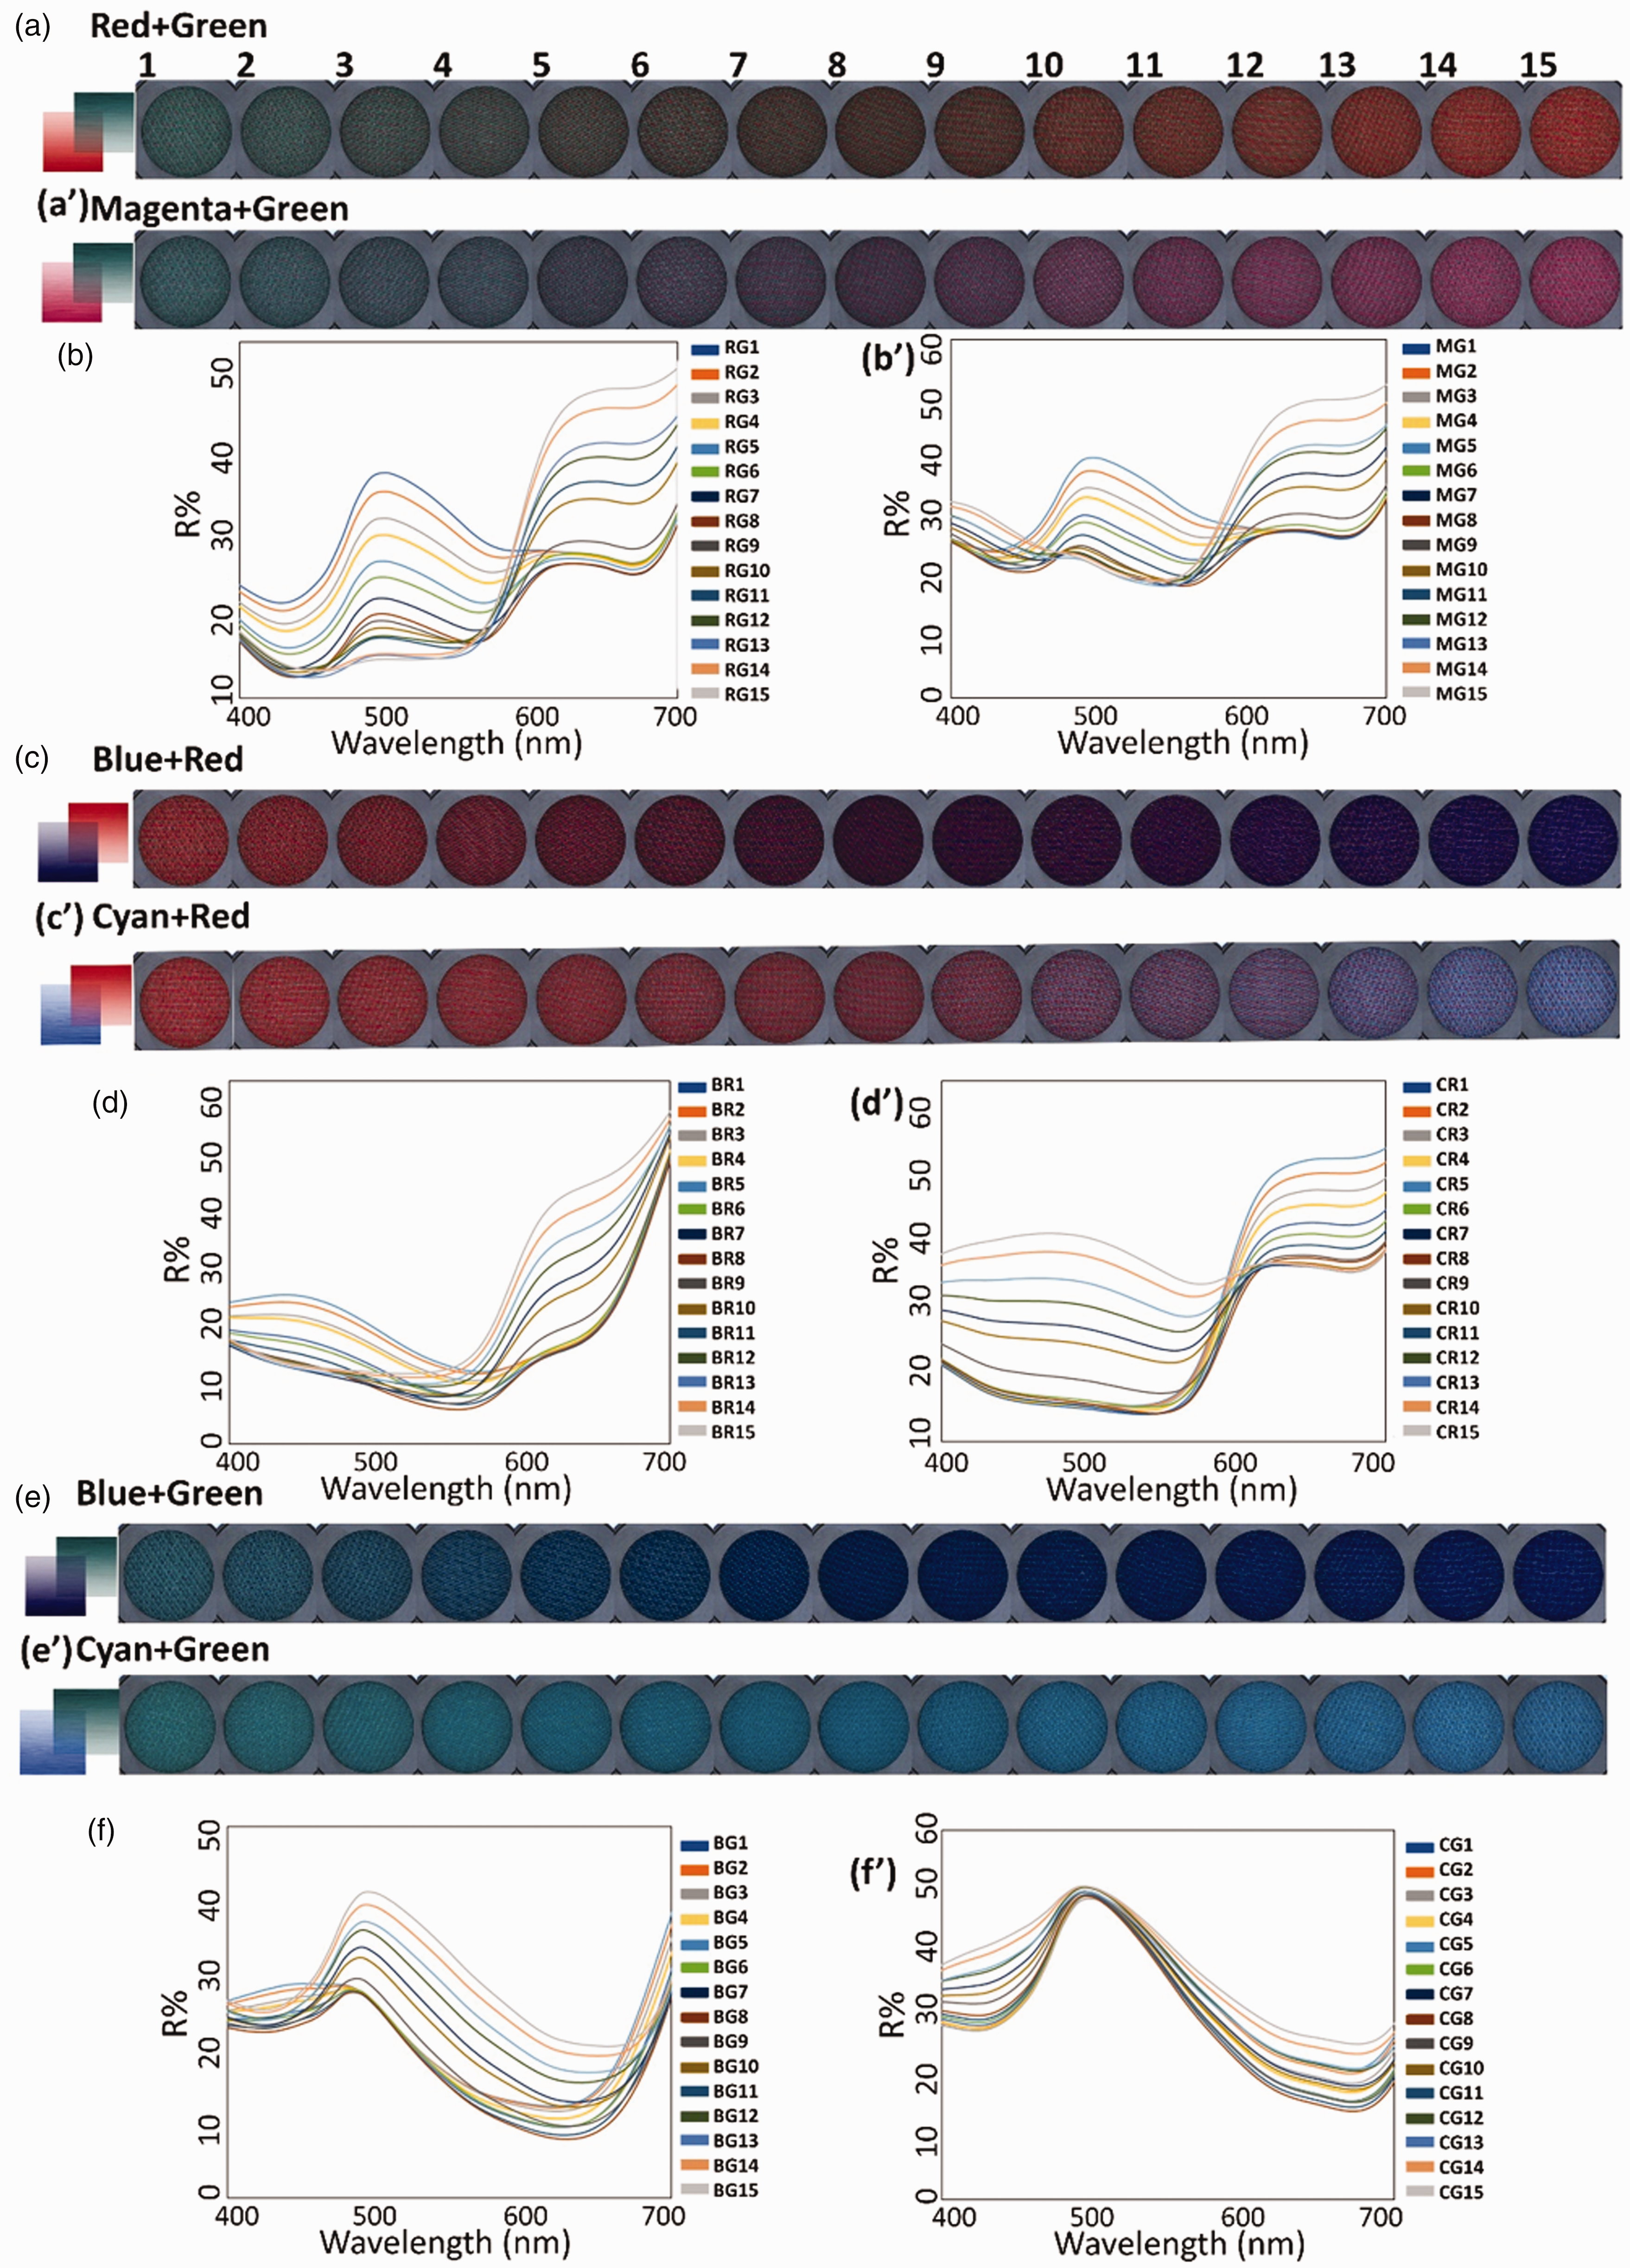
Color effect investigation. Images of prototype weave color samples of (a) [R] + [G], (a’) [M] + [G] and spectral reflectance curves of (b) [R] + [G], (b′) [M] + [G]; images of (c) [B] + [R], (c′) [C] + [R] and spectral reflectance curves of (d) [B] + [R], (d′) [C] + [R]; images of prototype weave color samples of (e) [B] + [G], (e′) [C] + [G] and spectral reflectance curves of (f) [B] + [G], (f′) [C] + [G].
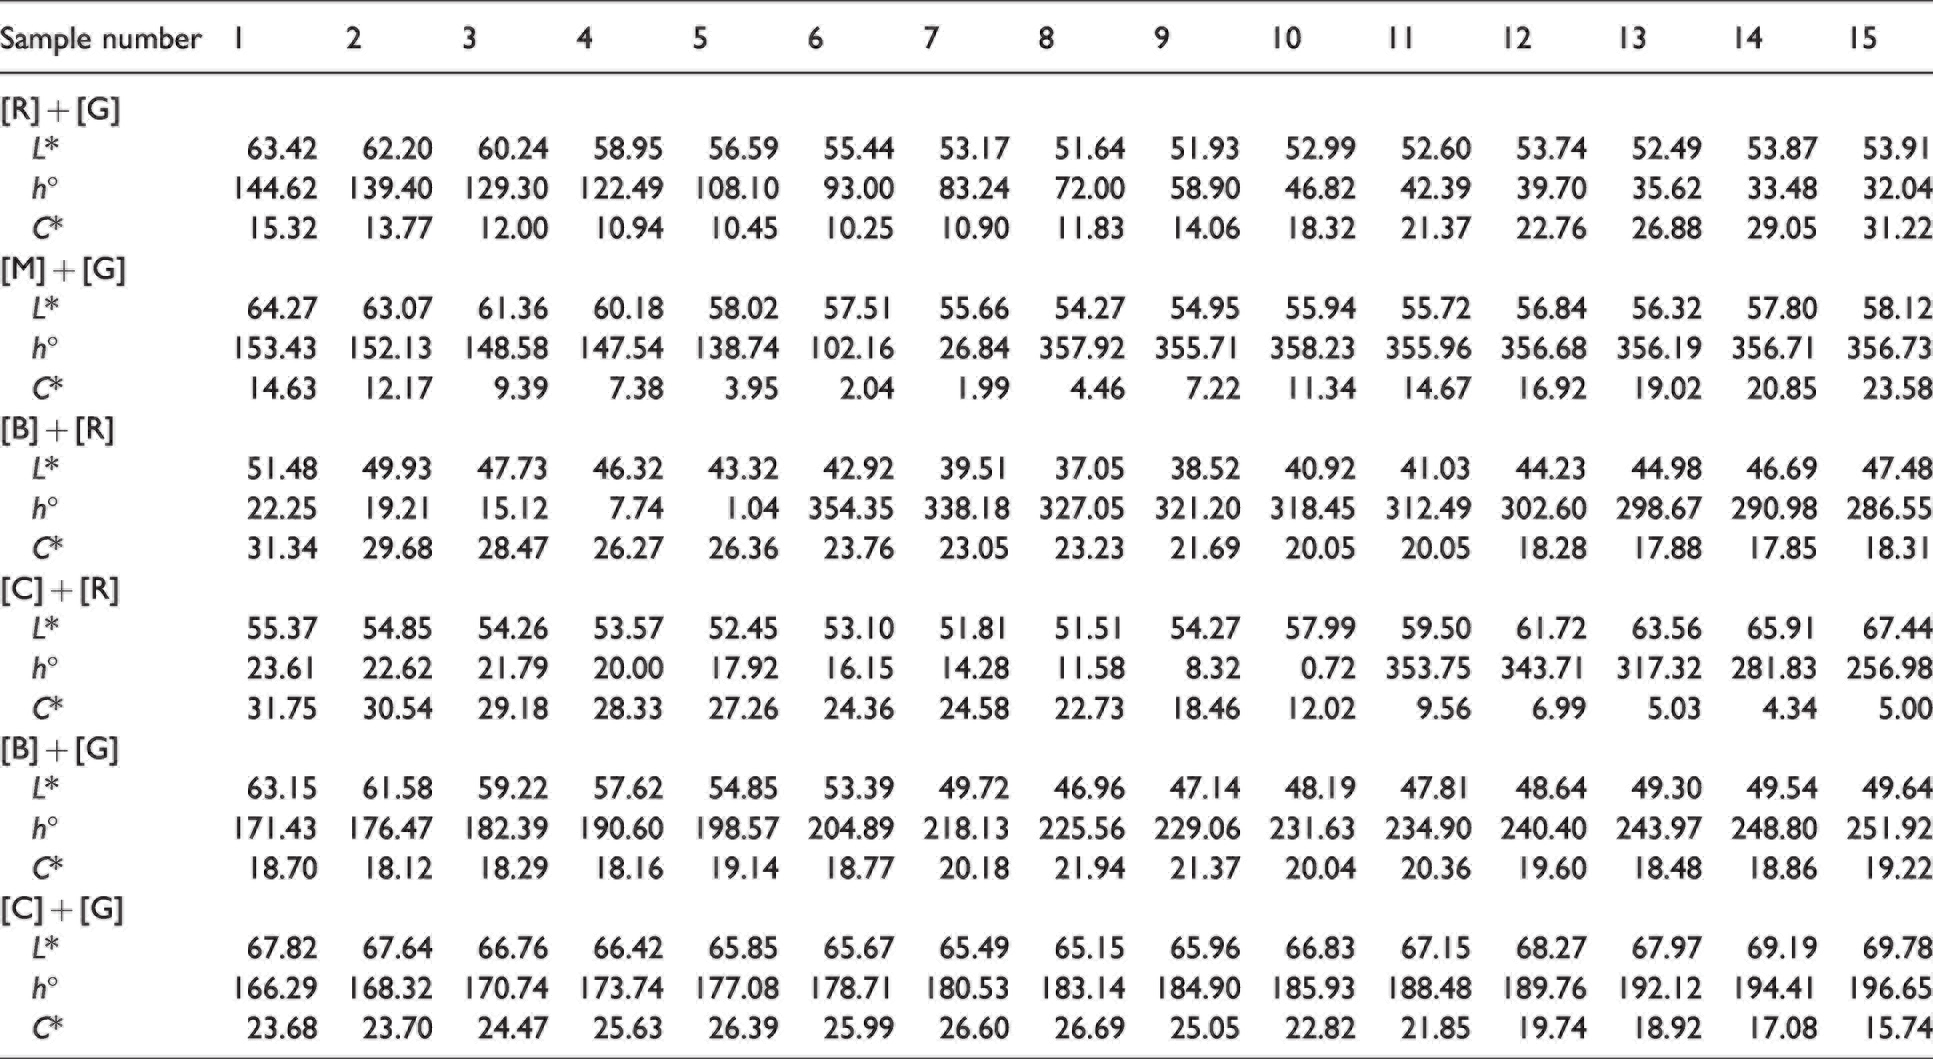
The lightness, hue angle and chroma of [R] + [G], [M] + [G], [B] + [R], [C] + [R], [B] + [G] and [C] + [G] samples
The weave color samples of the [R] + [G] and [M] + [G] samples are shown in Figures 7(a) and (a′), respectively. The colors of the first fabric samples are similar to a green color and then gradually change to red tones as the various percentage of [R] and [M] yarns are shown more on the surface. The reflectance spectral curves of the [R] + [G] samples had two main peaks, as shown in Figure 7(b). The first peak is at 500 nm (green), and the second peak is a broad peak ranging from 630 to 650 nm (red). Samples 1–3 mainly showed a 500 nm peak, but samples 4–7 showed two peaks that have similar intensity. Also, samples 8–12 had two peaks, but the peaks at the red range have a higher intensity. Samples 13–15 mainly showed the 630–650 nm peak. The reflectance spectral curves of the [M] + [G] samples are shown in Figure 7(b′). The first peak is at 480–490 nm (blue), and the second is a broad peak ranging from 620 to 650 nm (red). Samples 1– 3 mainly show the first peak, but samples 4–13 showed both two peaks. Samples 14 and 15 mainly showed the peak that represents a red color.
Red and green are complementary colors, as shown in Table 3. When juxtaposing [R] and [G] yarns, the hue angle is dramatically changed from 144.6° to 32.0°. In contrast, the hue angle of the [M] + [G] samples 1–6 is gradually changed from 153.4° to 102.2°, while those for samples 8–15 are all around 356°. The chroma values of samples 8–15 are increased from 4.5 to 23.6. As a result, as the percentage of the [G] yarn gradually reduced, it changed the chroma, but the hue angle was not significantly affected.
Images of the [B] + [R] and [C] + [R] weave color fabrics are shown in Figures 7(c) and (c′), respectively. The spectral reflectance curves of the [B] + [R] samples 1–8 mainly show the broadband from 620 to 700 nm, representing the red color. Samples 9–15 had a peak around 450 nm (blue), and the reflectance intensity also reached a peak at 700 nm, which results from the amount of red yarn colors shown on the surface. Images of the cyan and red yarn color combination are shown in Figure 7(c′), and the wavelength versus reflectance curves of the [C] + [R] samples are shown in Figure 7(d′). The colors of the [C] + [R] samples 1–9 mainly showed red tones with a broad peak ranging from 620 to 680 nm, while the peak gradually shifted to 480 nm for samples 9–15, which represents the blue color shown on the fabrics. Comparing the [B] + [R] and the [C] + [R] samples, the two sets of weave color samples started from similar hue angles of 22.3° and 23.6°, respectively. However, the woven fabric colors are gradually changed as the various percentages of [C] and [B] yarns are shown on the surface. Samples 6–10 show a similar number of [B], [C] and [R] yarns on the surface, and those samples clearly show the color difference between the two sets. The hue angles of the [B] + [R] samples 6–10 are changed from 354.4° to 318.5°, while the hue angles of the [C] + [R] samples are changed from 16.2° to 0.7°. The lightness value of the [C] + [R] samples is higher than that of the [B] + [R] samples.
The [B] + [G] and [C] + [G] weave color samples are shown in Figures 7(e) and (e′), whilst the spectral reflectance curves of the weave samples are shown in Figures 7(f) and (f′). The peak of the [B] + [G] sample 1 is at 500 nm, which indicates green. Samples 2–8 have peaks at 490 nm, which is at the boundary between green and blue, while samples 9–15 show the peak at 480 nm, representing the blue color zone. The hue angles of the [B] + [G] weave color samples range from 171.4° to 251.9°. In contrast, the reflectance spectral curves of the [C] + [G] samples 1–13 mainly show peaks at 500 nm, which are in the green color zone. The peaks of samples 14 and 15 are shifted to 490 nm, which is at the boundary between green and blue colors (Figure 7(f′)). Comparing the [B] + [G] and [C] + [G] weave colors that show 80–90% of either the [B] or [C] yarns on the surface (i.e., samples 6–10), the lightness and chroma values of the [C] + [G] samples are all higher than those of the [B] + [G] samples.
CIELAB gamut expansion by adding RGB yarns
The a*b* values of the [C], [M] and [Y] yarn combinations are shown in Figure 8(a). The a*b* values of the [B] + [M], [B] + [Y] and [R] + [Y] samples are presented in Figure 8(b1), which covered similar hue angles to the [C] + [M], [C] + [Y] and [M] + [Y] samples. Compared to the [C] + [M] and [M] + [Y] samples, the a*b* values of the [B] + [M] and [R] + [Y] samples fell further away from the center, indicating a higher chroma value. It suggests that the fabrics showed more colorfulness with relatively high saturation and brightness for the given degree of illumination. 26 The [B] + [Y] samples showed lower chroma compared to the [C] + [Y] samples. The a* and b* values of the [B] + [C], [R] + [M] and [G] + [Y] samples also fell outside the data of the [C] + [Y], [C] + [M] and [M] + [Y] samples (Figure 8(b2)), which shows the higher chroma was created by juxtaposing the similar colors of the primary colors. As shown in Figure 8(b3), the a* and b* values of the [R] + [G], [M] + [G] and [R] + [C] samples are inside of the [C] + [Y], [C] + [M] and [M] + [Y] samples, which indicates the chroma is lower than any [C], [M] and [Y] yarn combinations. The [R] + [B], [R] + [C] and [G] + [B] samples showed higher chroma than the [C], [M] and [Y] yarn color combinations. In conclusion, as shown in Figure 8(c), when mixing a pair of two primary color sets, all hue angles are possibly covered by using [C], [M] and [Y] yarns and the range of chroma of the weave color samples is expanded by adding [R], [G] and [B] yarns.
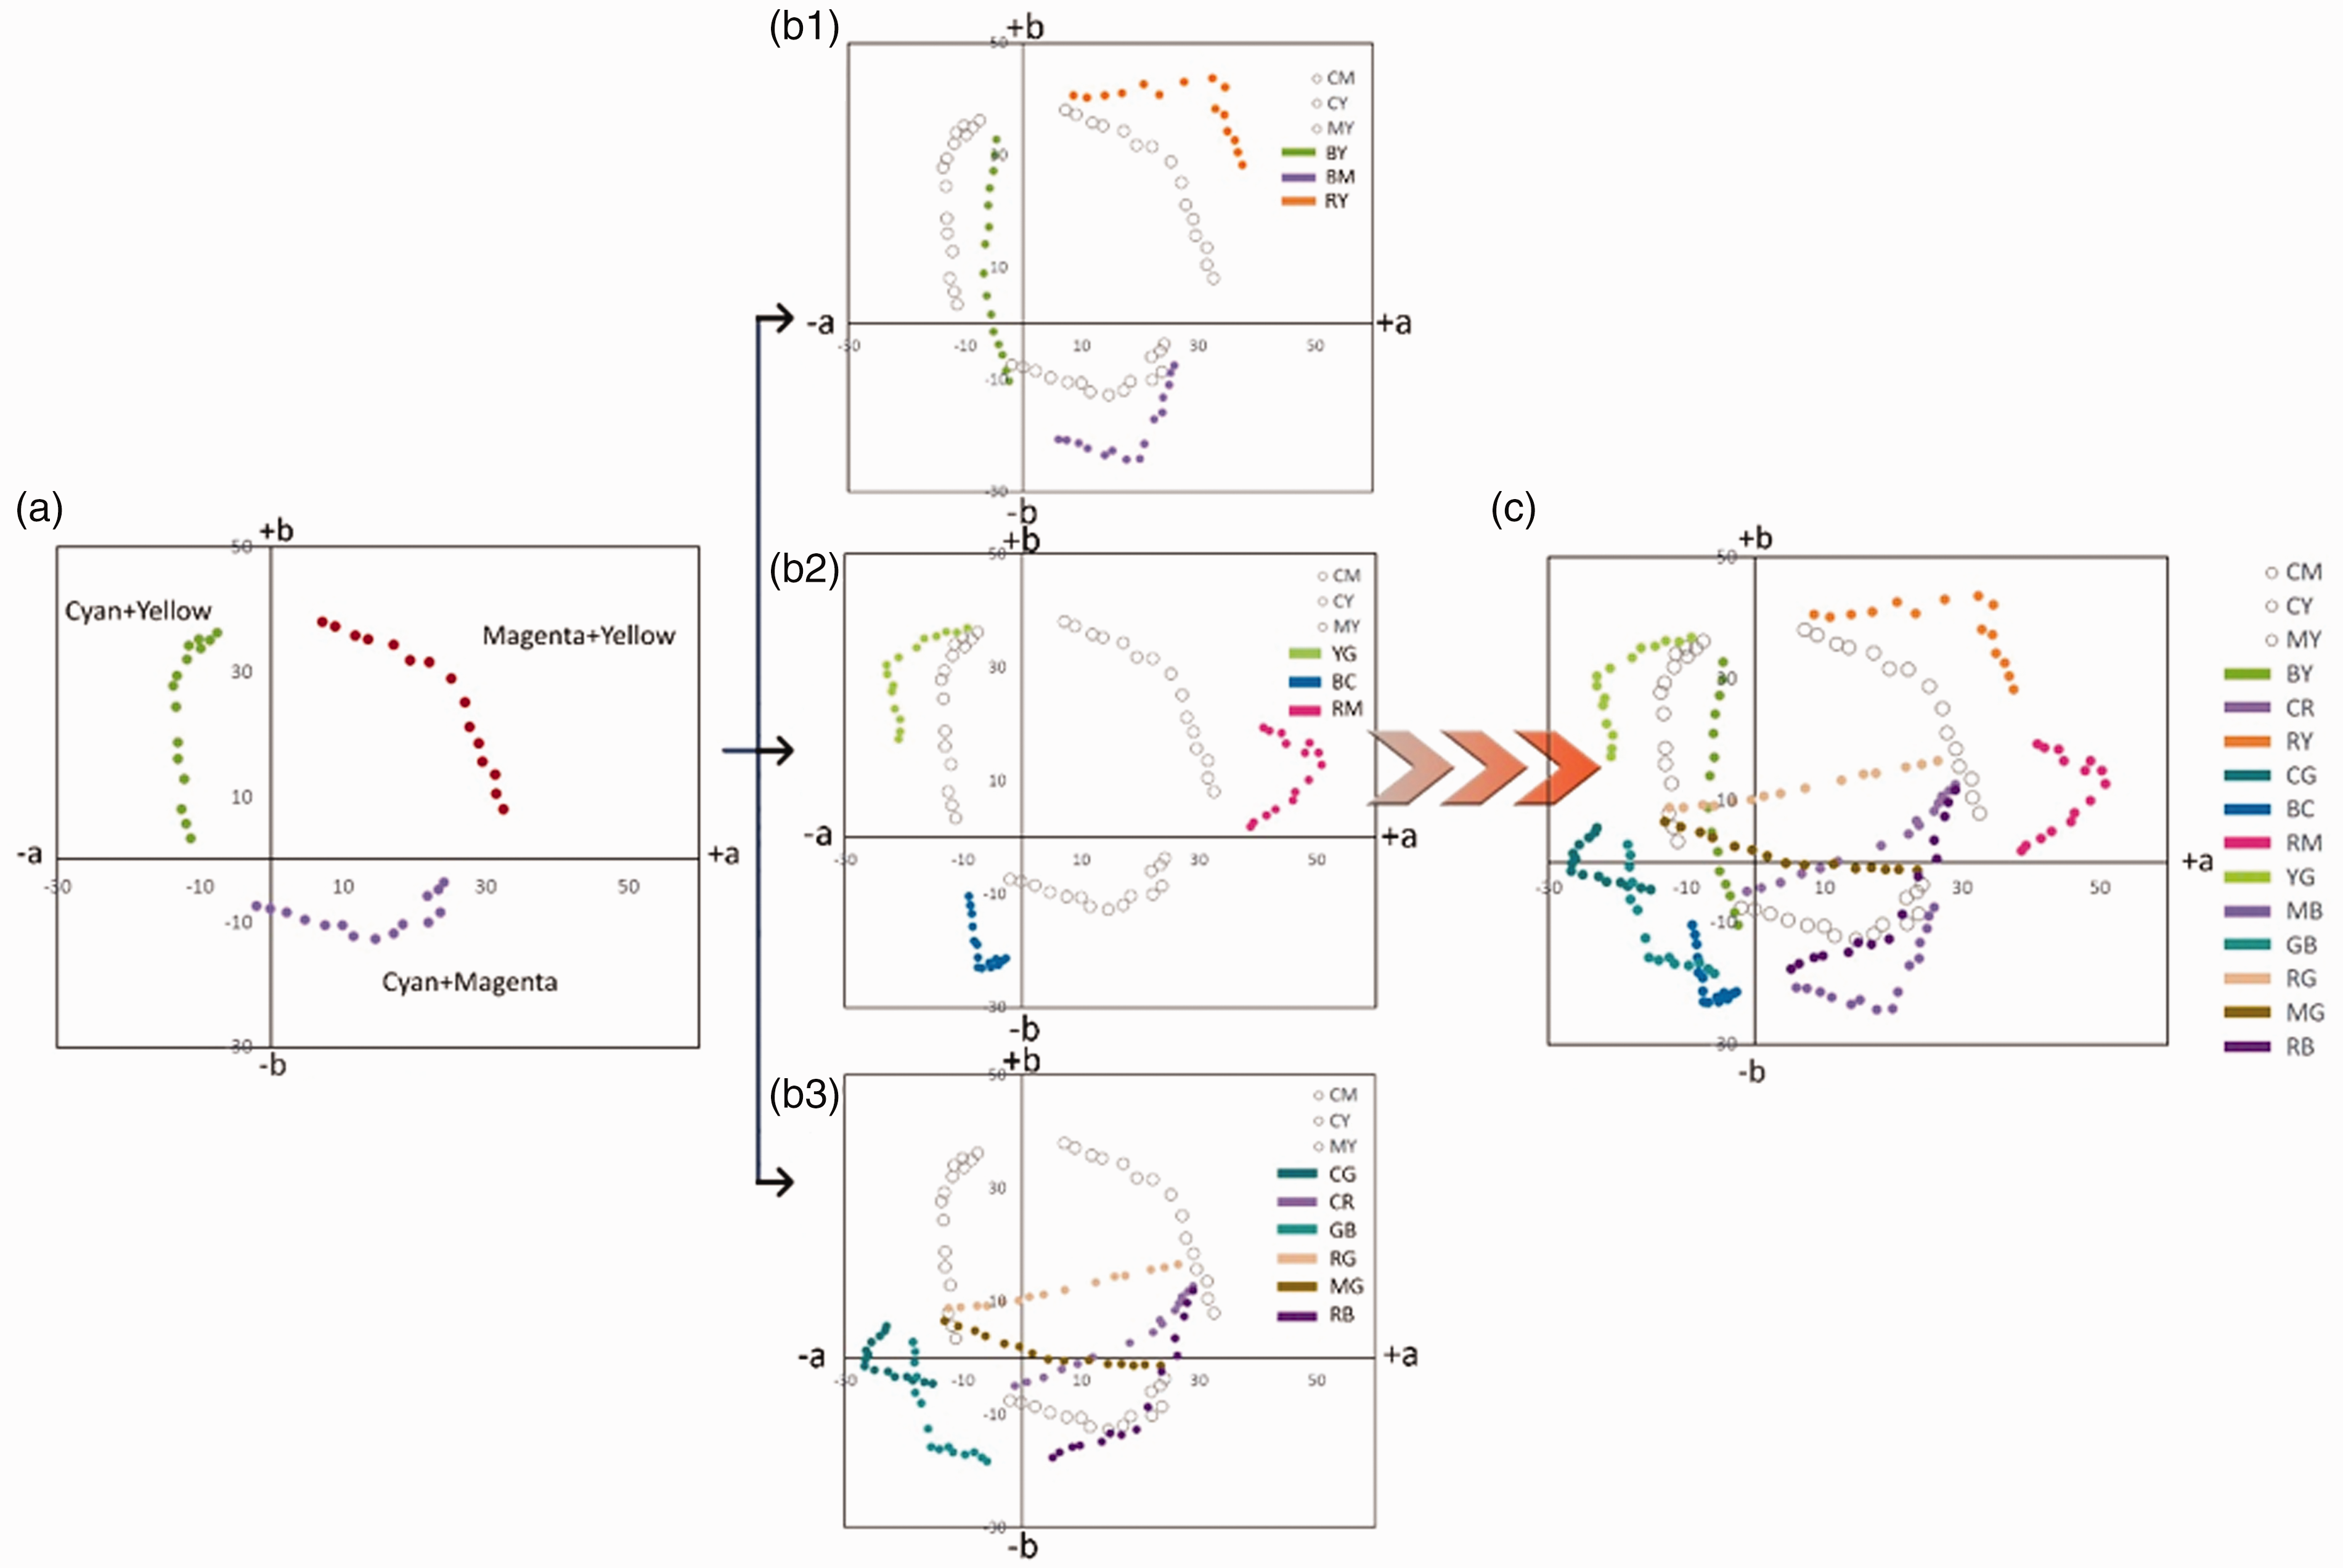
CIELAB gamut expansion by adding [R], [G] and [B] yarns. Measured a*b* values of (a) [C], [M] and [Y] yarn mixing, (b1) color control samples with [R], [G] and [B] yarns, (b2) color enhancement samples and (b3) pigment mixing effect samples. (c) The expanded gamut with [C], [M], [Y], [R], [G] and [B] yarns.
Conclusion
This research examined a feasible weave scope by combining two sets of primary colors (CMY and RGB). Three groups of weaving experiments were designed, and 225 prototypes of weave color samples were produced to examine the weave color results. In terms of the secondary color range reproduction, this study suggests that using [B] and [R] yarns produce weave colors in high vividness compared with using [C] and [M] yarns. In addition, the examination of juxtaposing two similar primary colors has shown that the chroma values of the [B] + [C] and [R] + [M] weave colors are higher when the two yarn colors are exhibited with a higher percentage of [B] and [R] components, representing more colorfulness shown in weave color samples. The results also indicated that the [Y] yarn increases the lightness of the fabric samples. One of the more significant findings of this study is that the range of hue and chroma of the weave color samples is expanded by mixing a pair of two primary color sets. These findings contribute in several ways to our understanding of the possibilities in color reproduction and suggest great potential in producing a wide scope of weave colors by using primary colors.
Footnotes
Declaration of conflicting interests
The author(s) declared no potential conflicts of interest with respect to the research, authorship, and/or publication of this article.
Funding
The author(s) disclosed receipt of the following financial support for the research, authorship and/or publication of this article: This work was supported by the Arts and Humanities Research Council (project code AH/T006323/1), Loughborough University and the Hong Kong Polytechnic University.