
Abstract
Biomass fibers are being widely investigated for industrial applications as an alternative to synthetic fibers using a standard humidity condition. In this study, the mechanical properties of two waste biomass fibers – canola and cattail – have been investigated when subjected to different environmental conditions, fiber length, and type of estimators used during analysis. The effect of different environmental conditions and structural variations were investigated by measuring the tensile properties after exposing them to eight different relative humidity conditions using a fixed fiber length of 25 mm. Further investigation was conducted using fiber lengths of 25, 35 and 45 mm using the most conservative relative humidity condition. The data were analyzed by a Weibull distribution model using four different estimators. The results revealed that Weibull strength (σavg) and modulus (Eavg) closely followed experimental values for cattail and canola fibers. The different relative humidity conditions and fiber lengths resulted in different Weibull parameters with 11% relative humidity and the mean rank estimator predicted the most conservative tensile strength for both waste biomass fibers. The experimental and characteristic Weibull strength decreased when fiber gauge length increased from 25 to 45 mm. The tensile strength and modulus of both waste biomass fibers at 50% reliability lie within the range of average experimental values. However, these values are reduced to 155 MPa (strength) and 20 GPa (modulus) for cattail fiber at 90% reliability. The survival probability of the tensile strength and modulus were found to be the highest at 75% and 100% relative humidity for cattail and canola fibers, respectively.
The concepts of green composite, biodegradability, and social influence have led the consumers towards eco-friendly products. Natural biomass fibers (BFs), such as those derived from flax, kenaf, jute, hemp, and sisal, are increasingly being investigated as environmentally friendly alternatives to glass fibers for engineering applications.1–5 However, a major problem with the use of BF is that growing these fiber crops requires a huge amount of water (2606 l/kg for jute and 3783 l/kg for hemp and flax).6,7 This water requirement causes a negative impact on the ecosystem, particularly nonpoint source pollution (fertilizers, herbicides) that are applied to grow the crop which affects nearby freshwater.
Waste biomass fibers (WBFs) are extracted from the waste stream after harvesting the main crop. For example, Brassica napus (canola) plants are left in the field after harvesting the canola seeds. A second example is the Typha latifolia (cattail) plant that grows in natural wetland areas that are unavailable to farmers for crop production and do not require irrigation.1,8,9 The extraction and fiber properties of WBFs from these two plants have been reported.1,8–11 The availability of WBFs has solved the supply constraint that is the main contributing factor for the limited use of traditional BFs. About 60 million tonnes of canola stubble were left in the field, 12 while the potential cattail growing land is 1.5 million km2 in Canada alone.13,14 The density of canola fiber varies between 1.3 and 1.4 g/cc, 8 which is lighter than both flax (1.54 g/cc) and hemp fiber (1.5 g/cc). The density of cattail fiber is even lower at 1.26 g/cc. 15 The strength and moisture regain of WBFs are similar to those of flax and hemp BFs.8,9,16 The major advantages and environmental benefits of waste biomass cattail and canola fibers are their abundance,12–14 lower density,1,8,15 higher fiber yield percentage,1,8,9 and lower greenhouse gas emissions 17 when compared with traditional BFs such as flax and hemp. Furthermore, the production of green composites from cattail 18 and canola 19 fibers have been reported.
The major problem with BFs such as flax and hemp is the variability in the structure that causes a large variation in mechanical properties, such as tensile strength and modulus. Similar variation is also observed for WBFs such as canola and cattail.8,11 For example, the tensile strength range is reported to be 88–1500 MPa and 310–900 MPa for flax and hemp, respectively, while the modulus is 27–80 GPa for flax and 17–80 GPa for hemp.20–22 This variation is attributed to both external and internal factors. The external factors are the cultivar type, 8 growth stages (beginning and end of flowering, seed maturity), 23 the growth condition (ground, weather), 24 retting process, 25 location within the plant’s stalk (top, middle best and bottom), 26 test parameters and test principles, 27 surface treatments, 28 age (fresh/old) of fibers 29 and conditioning of the atmosphere prior to testing.30,31 The internal factors are the diameter variation along the fiber lengths in a single fiber (Young’s modulus varies between 20 and 90 GPa for a diameter variation of 15–40 µm), 32 defect content, 33 thickness of the secondary cell in the primary wall, 3 thickness of the S2 (secondary) cell and its microfibril angle with the fiber axis (low angle is better for strength), 33 and cellulose content (%) (modulus increases linearly with cellulose content). 34
The moisture content at a given relative humidity (RH) can have a significant effect on the performance of the fibers, composites, and other potential end products manufactured from the fibers. Previous studies reported the modulus falls for flax fiber with increasing RH at a rate of 0.39 GPa/RH percentage. 35 A reduction in flexural strength and Young’s modulus of 18% and 25% for 100% RH rather than 0% RH conditioned flax fiber/UP resin composites was reported. 36 A reduction in flexural modulus and strength due to increased RH was also reported. 37 This variation in natural fiber tensile properties make it difficult to predict the reliability of these materials for composite application in load-bearing conditions.
Various prediction models are used to predict the response of fiber-reinforced polymer. Among these are: Weibull model for probability of failure, 38 Arrhenius model in chemical environment, 39 thermomechanical models for temperature-dependent mechanical properties,40,41 creep models such as Findley’s power law, Boltzmann–Volterra model, Schapery model and strain energy model. Among these, the Weibull model is one of the most suitable and reliable means of describing the failure probability distribution of fibers for composite applications using shorter (5–20 mm) physical dimensions.42,43 Weibull distribution has also been used to determine the effect of water 44 on the performance of BFs, and the effect of three different heat treatments on the fracture strength of materials was investigated. 45 Previously, Shuvo et al. (2021) 46 and Shuvo (2020) 19 applied a two-parameter Weibull model to predict the probabilistic composite failures manufactured from canola fibers against a wide range of compressive loads and bending deflection, respectively. However, these studies did not use a probabilistic Weibull model to address the challenges associated with large variation in mechanical properties of fibers and predict a reliable model for different RH conditions and different fiber lengths.
Unlike other BFs, no previous study has been condcted yet to determine the effect of RH conditions, structural parameters, and fiber length on the mechanical properties of cattail and canola fibers. Hence, the objective of this study was to understand the effect of environmental conditions, structural parameters, fiber length, and effect of different estimators on the mechanical properties of WBFs (canola and cattail) using a Weibull distribution model, and compare the experimental and predicted results with the published studies of other BFs. The Weibull analysis, using four different estimators, will be conducted to determine the influence of RH and gauge length on the mechanical properties of two WBFs.
Experimental details
Materials
Cattail plants were collected by hand from the roadside ditches along Provincial Highway 3 near Winnipeg, Manitoba, Canada in early October 2019. These cattail plants belong to random cultivars as they were not grown in a controlled environment. Canola plants (HYHEAR 3 cultivar) were collected from the University of Manitoba’s research farm in Carman, Manitoba, Canada. HYHEAR cultivar is chosen for its potential in composite applications due to its higher breaking strength. 47
Fiber extraction from canola plants
Canola fibers were retted in water for 48 h at 40°C and extracted manually. The extracted fibers were washed twice in hot and then cold water, dried at room temperature for 24 h and sealed in plastic bags for subsequent analysis. Details of the retting processes are given by Shuvo et al. (2020). 8 The canola stalks collected after harvesting and the fibers extracted from canola stalks are shown in Figure 1(a) and Figure 1(b), respectively.
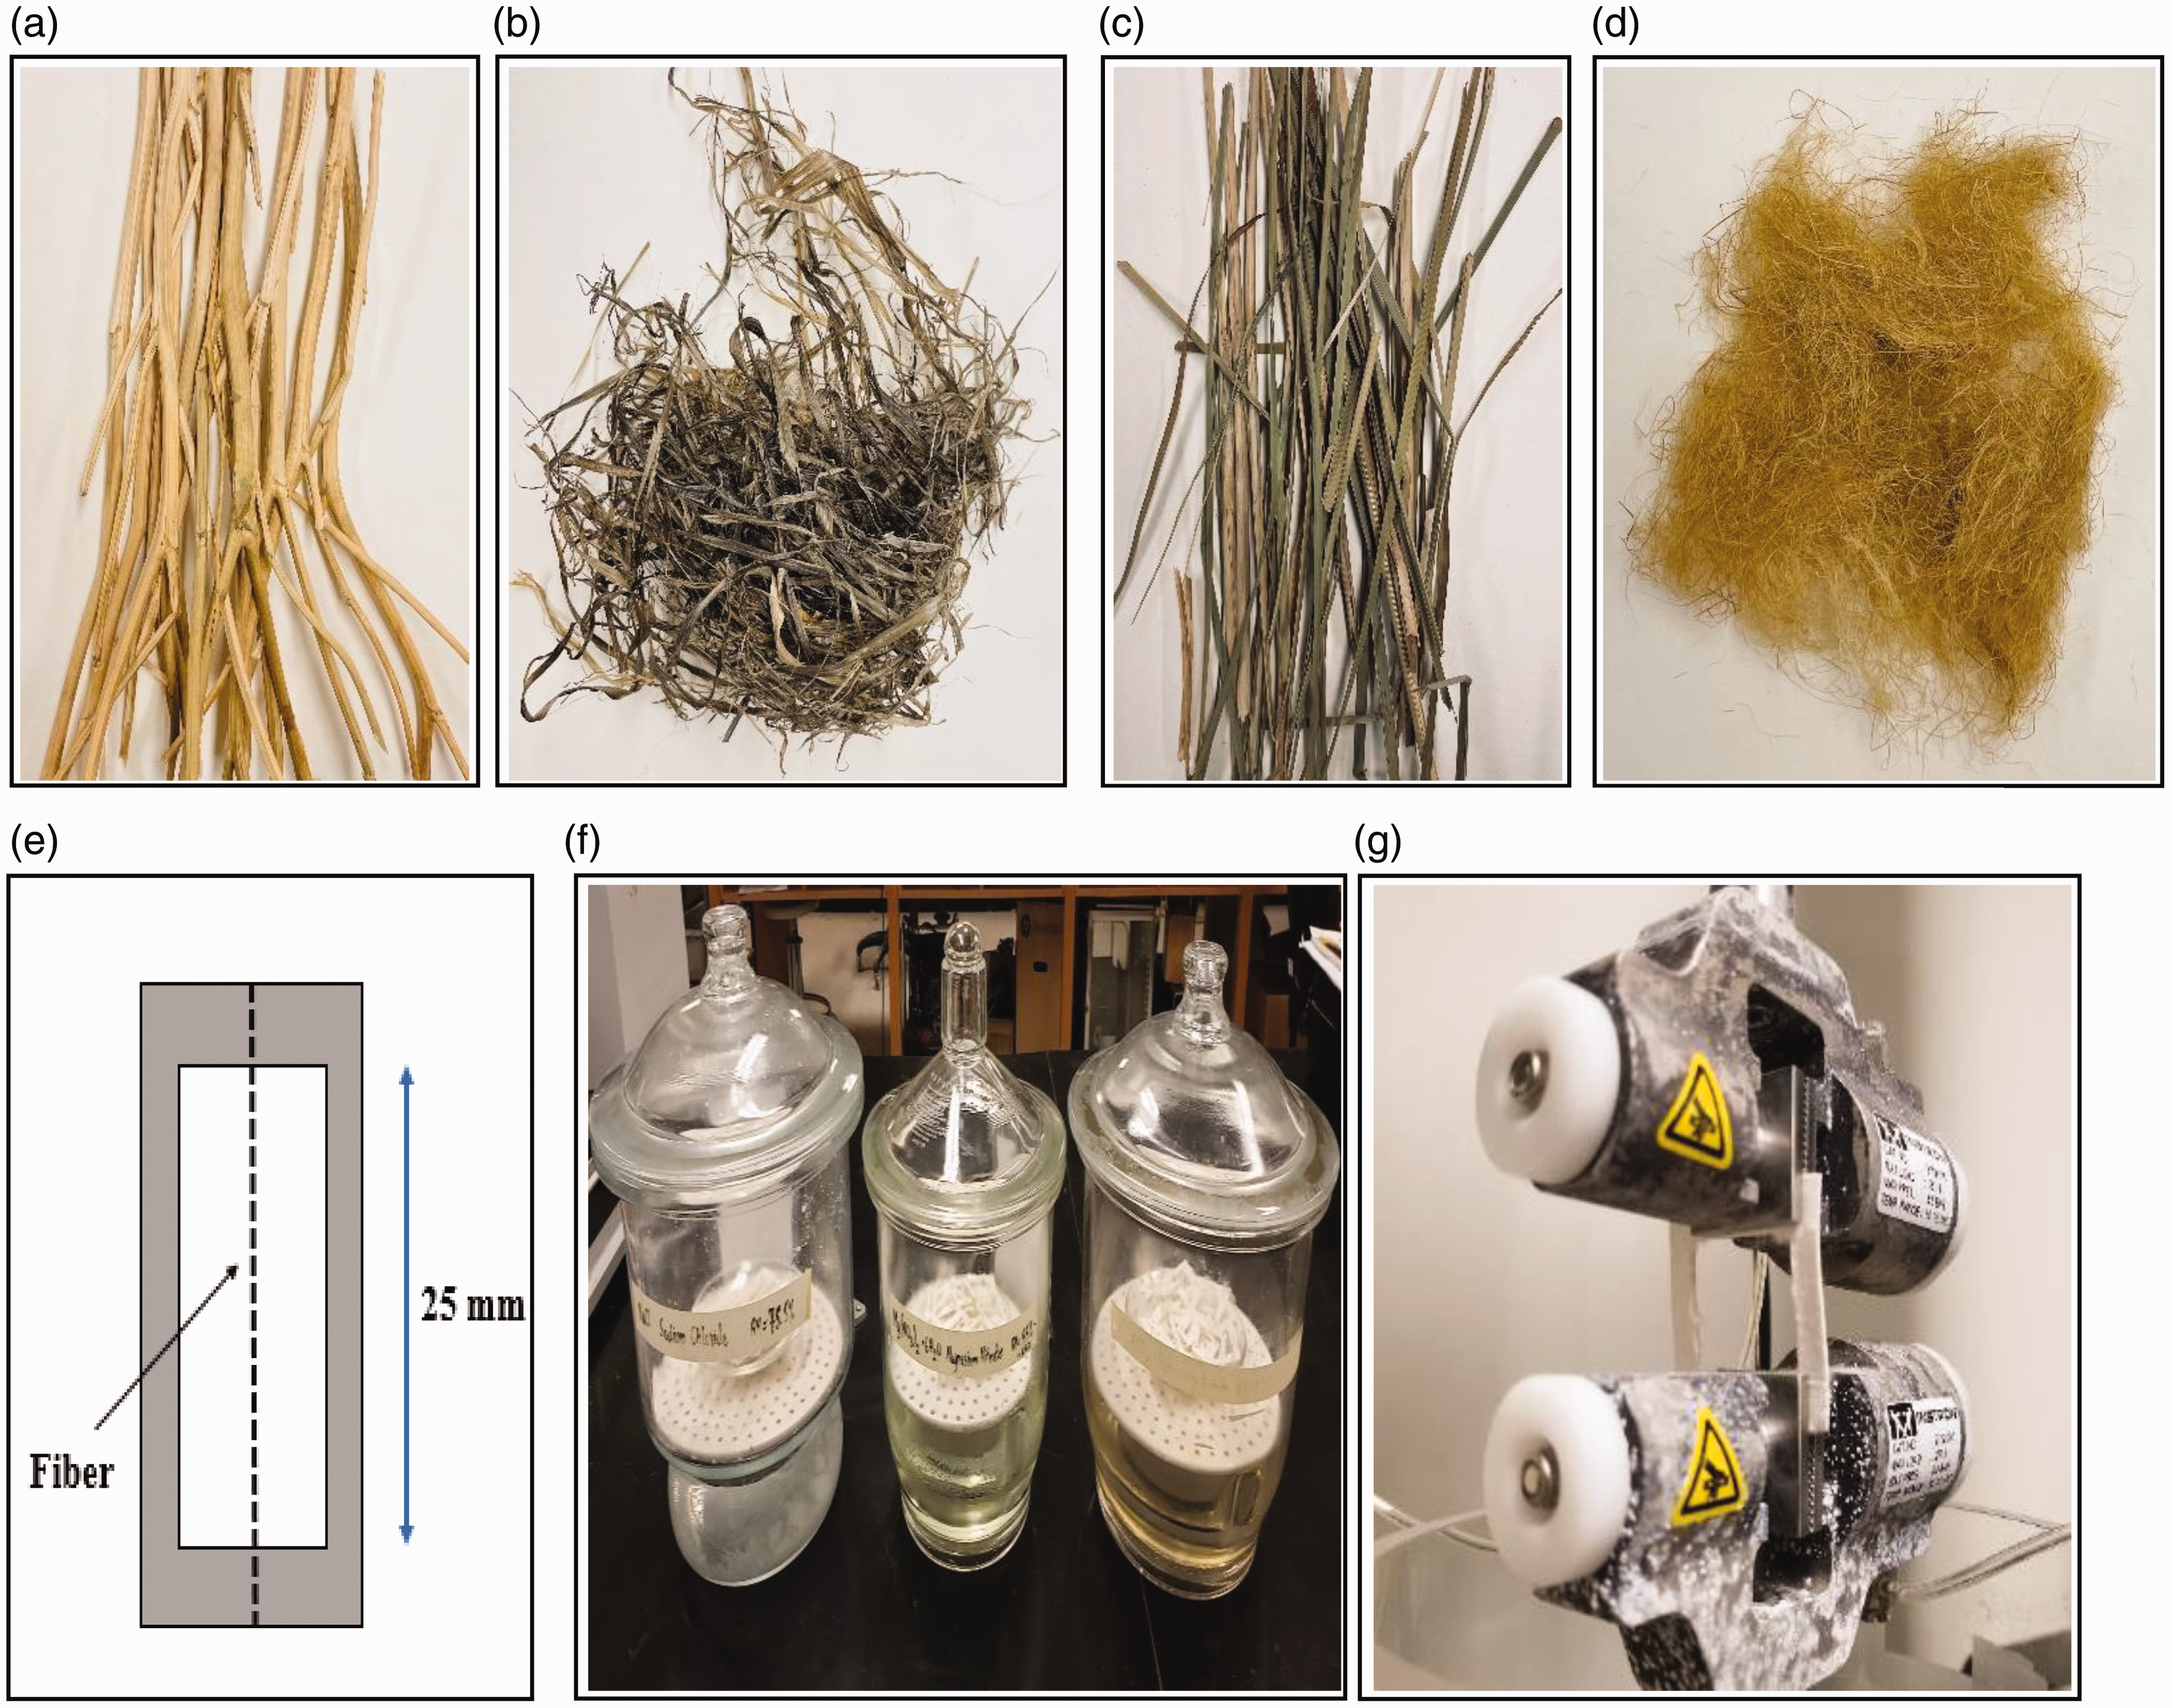
(a) Canola stalks collected after harvesting; (b) extracted canola fibers; (c) cattail leaves before retting; (d) extracted cattail fibers; (e) rectangular fiber attachment frame for tensile testing; (f) fibers kept in desiccators containing different relative humidity conditions; (g) fiber frame placed between the jaws of the Instron for tensile testing.
Fiber extraction from cattail plants
Cattail fibers were extracted by treating the precut leaves (6–8 cm) at 80°C for 4 h using 5% (w/v) aq. potassium hydroxide (KOH). The extracted cattail fibers were rinsed in cold distilled water and neutralized in 2% (v/v) acetic acid solution for 30 min followed by washing them three times in cold, hot, and cold distilled water. Details of the extraction methods are given by Rahman et al. (2021). 9 The fibers were dried for 24 h at room temperature and kept in sealed bags for subsequent analysis. The cattail leaves before retting and the dried cattail fibers obtained from the leaves are shown in Figure 1(c) and Figure 1(d), respectively.
Measurement of moisture content
The moisture content (MC%) of WBFs was measured by conditioning them in desiccators with RH of 11.3% (LiCl . H2O), 23.5% (CH3COOK), 33.0% (MgCl2 .6H2O), 55.0% [Mg(NO3)2 . 6H2O], 75.5% (NaCl), 84.3% (KCl), 93.6% (KNO3) and 100% (H2O) according to ASTM D 1776-4 (2008). Before conditioning, WBFs were dried in an oven at 100°C for 12 h. The MC(%) was calculated as a percentage of the ratio of the weight of water absorbed by the sample to the total weight of the sample as expressed in equation (1).
Measurement of mechanical properties
Fifty single WBFs were separated from extracted fibers and the diameter was measured in five different places across the length of the fiber using a Bioquant life science image analyzer (Bioquant Life Science, Motic, BA310l, 2010) and their average was calculated. Fifty single WBFs (for each RH condition) with known diameters and a length of 25 mm were glued in a rectangular frame as shown in Figure 1(e) and placed further in the desiccators for one week as shown in Figure 1(f).
Mechanical properties such as tensile strength, modulus of elasticity, and strain at break (%) of WBFs were evaluated using the Instron Tensile Tester (model no. 5965, Sl# VS02075661, manufactured by Instron, Norwood, USA) following the ASTM D3822 method and the procedure described in Shadhin and colleagues (2021).1,2 The capacity of the load cell used for this study was 1 kN. The tensile testing set-up with the fiber frames between the serrated grips in Instron is illustrated in Figure 1(g). All the desiccators containing the fiber-holding rectangular frames are shown in Figure 1(a) and 1(b). The elastic modulus of cattail and canola fibers are calculated from the initial linear portion of the curve. After the tensile tests, the two sections of the frame were collected and glued together for taking the microscopic image using a Bioquant Life Science image analyzer (BIA; Nashville, USA) to determine the breaking pattern.
Evaluation of structural parameters
Fractured canola fiber surfaces were analyzed after tensile testing using a Bioquant Life Science image analyzer (Bioquant Life Science, Motic, BA310l, 2010). The single cattail fiber structure was examined in a scanning electron microscope (FEI Quanta 650 FEG ESEM from Thermo Fisher Company, USA) at an accelerating voltage of 10.0 kV. The three-dimensional (3D) and two-dimensional (2D) X-ray images of the cattail fiber microstructures were evaluated in a Specimen Radiograph System (model MX-20, manufactured by Faxitron Biopics LLC, USA) using Bioptics Vision NDT software (version 2.4.1U, copyright: 2006-2016).
Analysis
Weibull distribution and calculating Weibull parameters
In this current study, two-parameter Weibull distribution has been used for determining the probabilistic strength and modulus of WBFs. The cumulative distribution function of the two-parameter Weibull distribution can be stated using equation (2):

Equation (3) can be further represented in the form of Y = mX + c; where, Y = ln [ln (1/(1–F(x))], X = ln (x), and c = – a ln (β).
To determine the probability of failure, the experimental values of tensile strength and tensile modulus for the Weibull distribution median rank estimator (estimator 1) are used as shown in equation (4) where N is the total number of test specimens and i is the ith datum:
48
To determine the shape parameter (or Weibull modulus) and scale parameter (or characteristics strength), ln [ln (1/(1–F(x))] is plotted as a function of ln (strength) or ln (modulus) of cattail fiber. Finally, a line is fitted through the plotted data points. Linear regression analysis is then used to determine the Weibull parameters.
In Weibull statistical modelling, the tensile strength value would be equal to the average Weibull tensile strength (σavg) when the probability of failure is 50%.
49
Using this condition, the average Weibull strength can be calculated from the Weibull distribution model. Therefore, x = σavg, when F(x) = 0.5. Putting these values in equation (3) would result in equation (5):
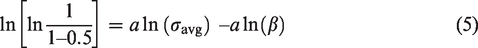
Now equation (5) can be simplified further, and for a given shape parameter (a) and scale parameter (β), the average Weibull tensile strength, σavg, can be determined using equation (6). Similarly, the average Weibull tensile modulus of cattail fiber, Eavg is determined:

Reliability analysis can also be completed using the Weibull statistical model. For a given shape parameter or Weibull modulus (a), and scale parameter (β), the probability of survival can be determined by Benard’s approximation using equation (7), where R(x) is the reliability or the probability of survival of the variable x:

Results and discussion
Relationship between RH and moisture content
The relationship between moisture content and RH for both WBFs is shown in Figure 2. The moisture content of WBFs increases as the RH increases, which is in agreement with the published data for flax in which the moisture content increased with increasing RH, reaching a maximum value at 95% RH. 50 However, the two WBFs behaved quite differently. For canola, the equilibrium moisture content increased approximately linearly with the RH until about 75% RH and then accelerated rapidly. This relationship can be explained using Peirce’s two phase model in which, in phase one, water molecules associated with the glucose unit in the cellulose chain [(C6H7O(OH)3] n and, in phase two, the water molecules fill the spaces available under attractive forces. 51 Furthermore, the relationship appears to follow the type II sorption isotherm similar to other cellulosic natural fibers (cotton, flax, hemp, jute, and sisal). 52
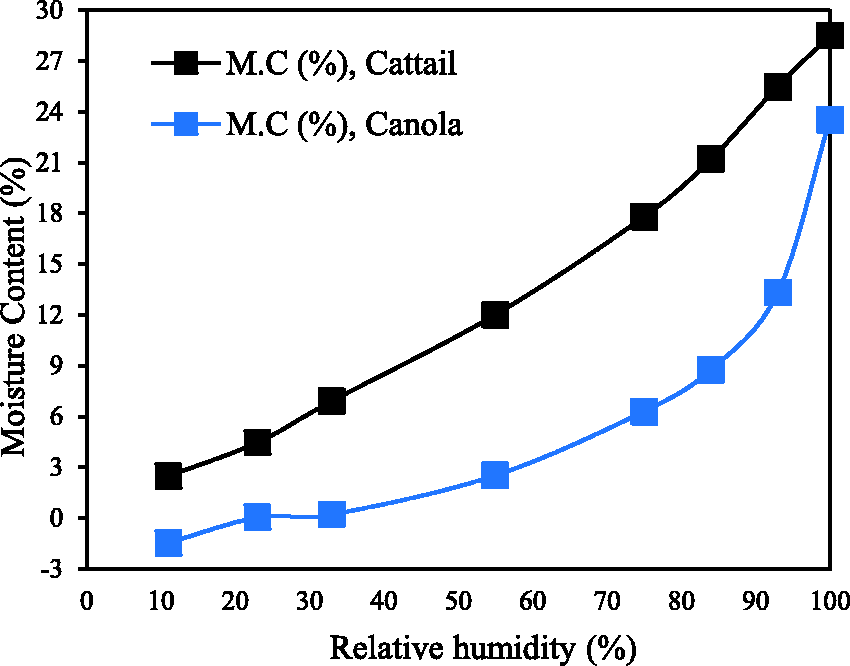
Relationship between relative humidity and moisture content for both canola and cattail fiber.
Mechanical properties of WBFs at different RH conditions
The mechanical properties of WBFs are shown in Table 1. For cattail fiber, both tensile stress and modulus increase up to the RH of 75%; above this RH both properties decrease. For canola fiber, tensile stress and modulus increase with the increase in RH of up to 100%; however, there is a drop in both properties at 75% RH. There is a slight trend of increasing strain (%) with the increase in RH for both WBFs. No relationship between RH and tensile stress values was found for WBFs. Generally, the value of tensile properties increases with increases in RH for bast and cotton fibers. For cotton, the ratio of tenacity value at 100% and 65% RH is 1.11, while for flax, the tensile strength is increased with the increase in RH up to 95%. 53 Further analysis of the data for other bast fibers revealed that for hemp, the highest modulus value was obtained at 80% RH, while the tensile stress was found to be at 50% RH. 30
Mechanical properties of WBFs at different relative humidity
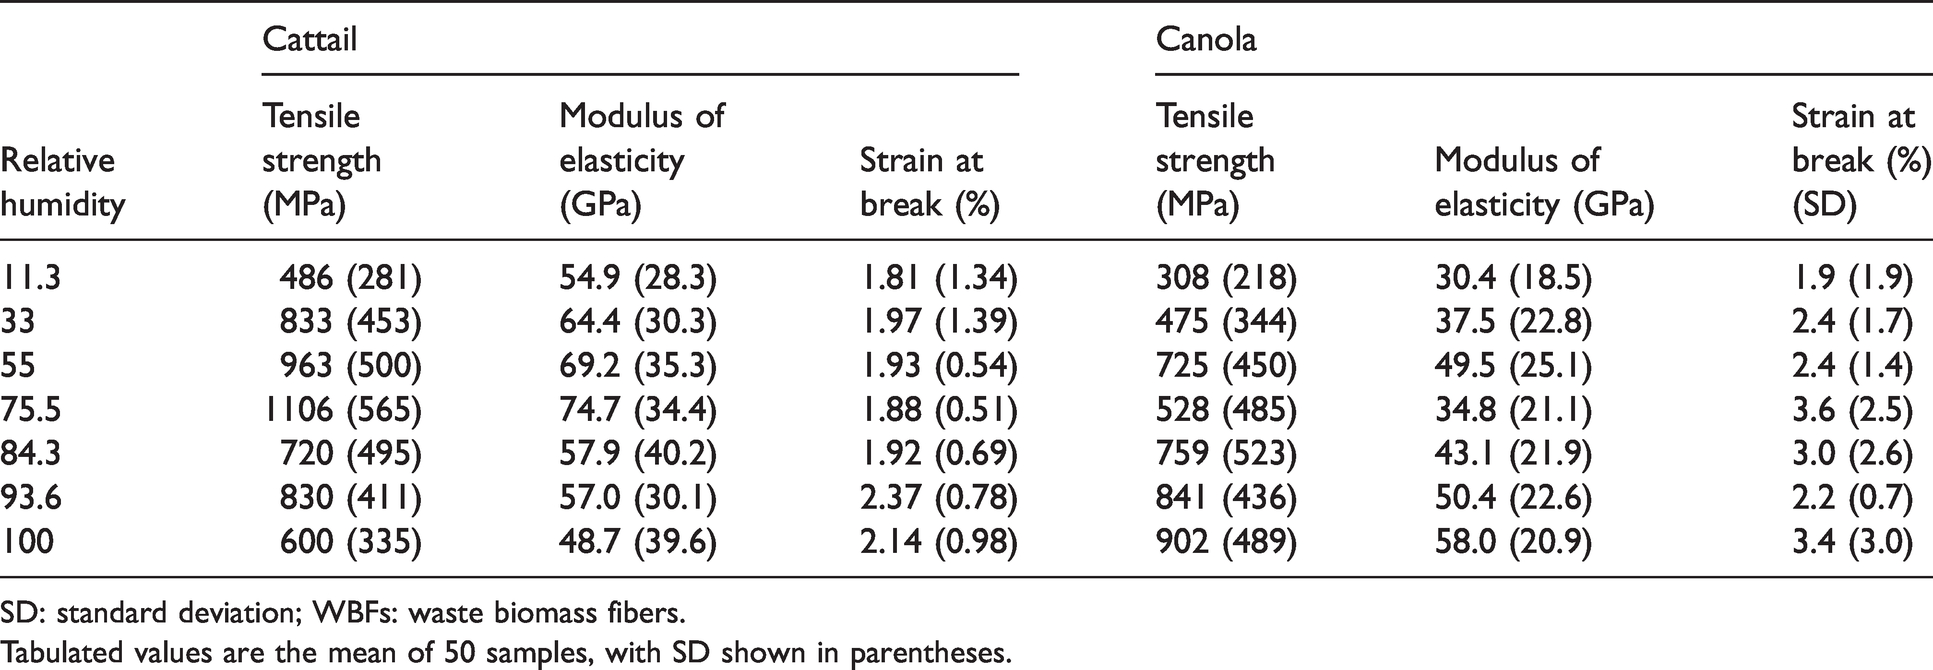
SD: standard deviation; WBFs: waste biomass fibers.
Tabulated values are the mean of 50 samples, with SD shown in parentheses.
The accuracy of the experimental strength of fiber also varies and depends on the time required to break the specimen while tensile testing.
54
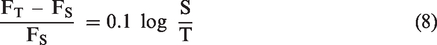
For testing the strength of natural BFs, we can go as low as 100 N as long as it is safe to operate the test considering the material strength. With the 100 N load cell, the time to break would be lower while tensile testing. The formula illustrated in equation (8)
54
is typically used to adjust the accuracy of strength measurement for different times required to break the specimen corresponding to different load cell capacity. However, the adjustment needed when dealing with a 100 N and 1 kN load cell, should not be more than 10%. But as can be seen, the adjusted values are covered within the standard deviations.
Effect of structural parameters on the mechanical properties of WBFs
The large standard deviation in the mechanical properties of the WBFs at different RHs points to a wide variation of strength and modulus from one fiber to another (Table 1). This is common for all bast fibers. For example, the Young’s modulus of flax, ramie, and hemp is reported to be between 27.6–80 GPa 55 and 25–160 Gpa, 42 44–128 Gpa, 56 and 20–70 Gpa, 56 respectively, as well as WBFs.8,9,11,57 The wide dispersion in the mechanical properties of WBFs and other natural fibers obtained from the same stem is the result of a number of factors that include fiber extraction and retting parameters, 58 differential cross-sections along the single fiber length, 59 fiber defects such as knots, thick and thin places, 60 and drying conditions prior to measurement of tensile properties. Most of the factors that affect the tensile properties can be controlled except fiber cross-section variation and defects. We have noticed that during the measurement of tensile properties the majority of the fibers did not break at the average inserted diameter. This point is discussed later in this section.
While the tensile stress data for WBFs fall within the range previously reported by our research group,8,16 the modulus values are much higher in this research than from previous studies. For this research, we oven dried the samples at 105°C for 24 h to measure the moisture content. It was noticed that the fiber samples became stiff when removed from the oven – this might be responsible for the higher modulus values. This is supported by the work of Hart and Summerscales, 61 who found that the modulus doubled for jute fiber from 650 MPa at room temperature to 1250 MPa at 180°C. Similarly, an increase in strength and modulus for thermally treated (140°C and 190°C) flax fiber was also found by Gourier et al. (2014). 62 A high modulus value for hemp (70 GPa) 63 and kenaf (175 GPa) 64 was also obtained for oven dried samples. It is possible that due to heating for such a long time some of the microfibrils (theoretical modulus for 100% microfibrils is 70 GPa) converted into crystallites (theoretical modulus for 100% crystallites is 250 GPa), which is approximately 3.5 times stiffer than the microfibrils. 34 This behavior can be further explained by the ‘stiffening effect’ by the fringed micelle theory in which, due to the heat, the ‘fringe’ in the amorphous regions is found to be increased. 65
One of the sources of variation in mechanical properties for WBFs is the diameter, as the methodology is being used to measure the tensile properties – that is, the single fiber method according to ASTM D3822. The methodology calculates the tensile properties based on the smallest fiber diameter – this is the point at which the fiber is theoretically predicted to break.32,33,43,66–68 In order to determine the exact location of the breaking point, the two broken parts of the fiber were joined together and the diameter of these broken ends was measured. Our results showed that 80% of fibers broke at a point that was different from the predicted point of breakage, as shown in Figure 4. Measuring the diameter of the breakage point was also a challenge due to the irregular breakage pattern. While most of the samples had tensile failures (fibrillary/granular/brittle nature – Figure 3(a)), a few samples broke with multiple splitting (Figure 3(b)), axial splitting (Figure 3(c)), or tensile breaks with single and multiple steps at the end (Figure 3(d) and (e)). It was not possible to calculate the cross-sectional area accurately, as WBFs are not exactly circular. The cross-section of the cattail fiber consists of numerous small elliptical (polygonal) cells, each about 4.5–6.0 µm, 9 while the cross-section of canola fibers displays a hollow structure lumen which is polygonal in shape with multiple dimensions. 8 However, when we checked the variation for the strain at the break (%) which is not dependent on the fiber cross-section, it was found that the standard deviations are also very large, as shown in Table 1.
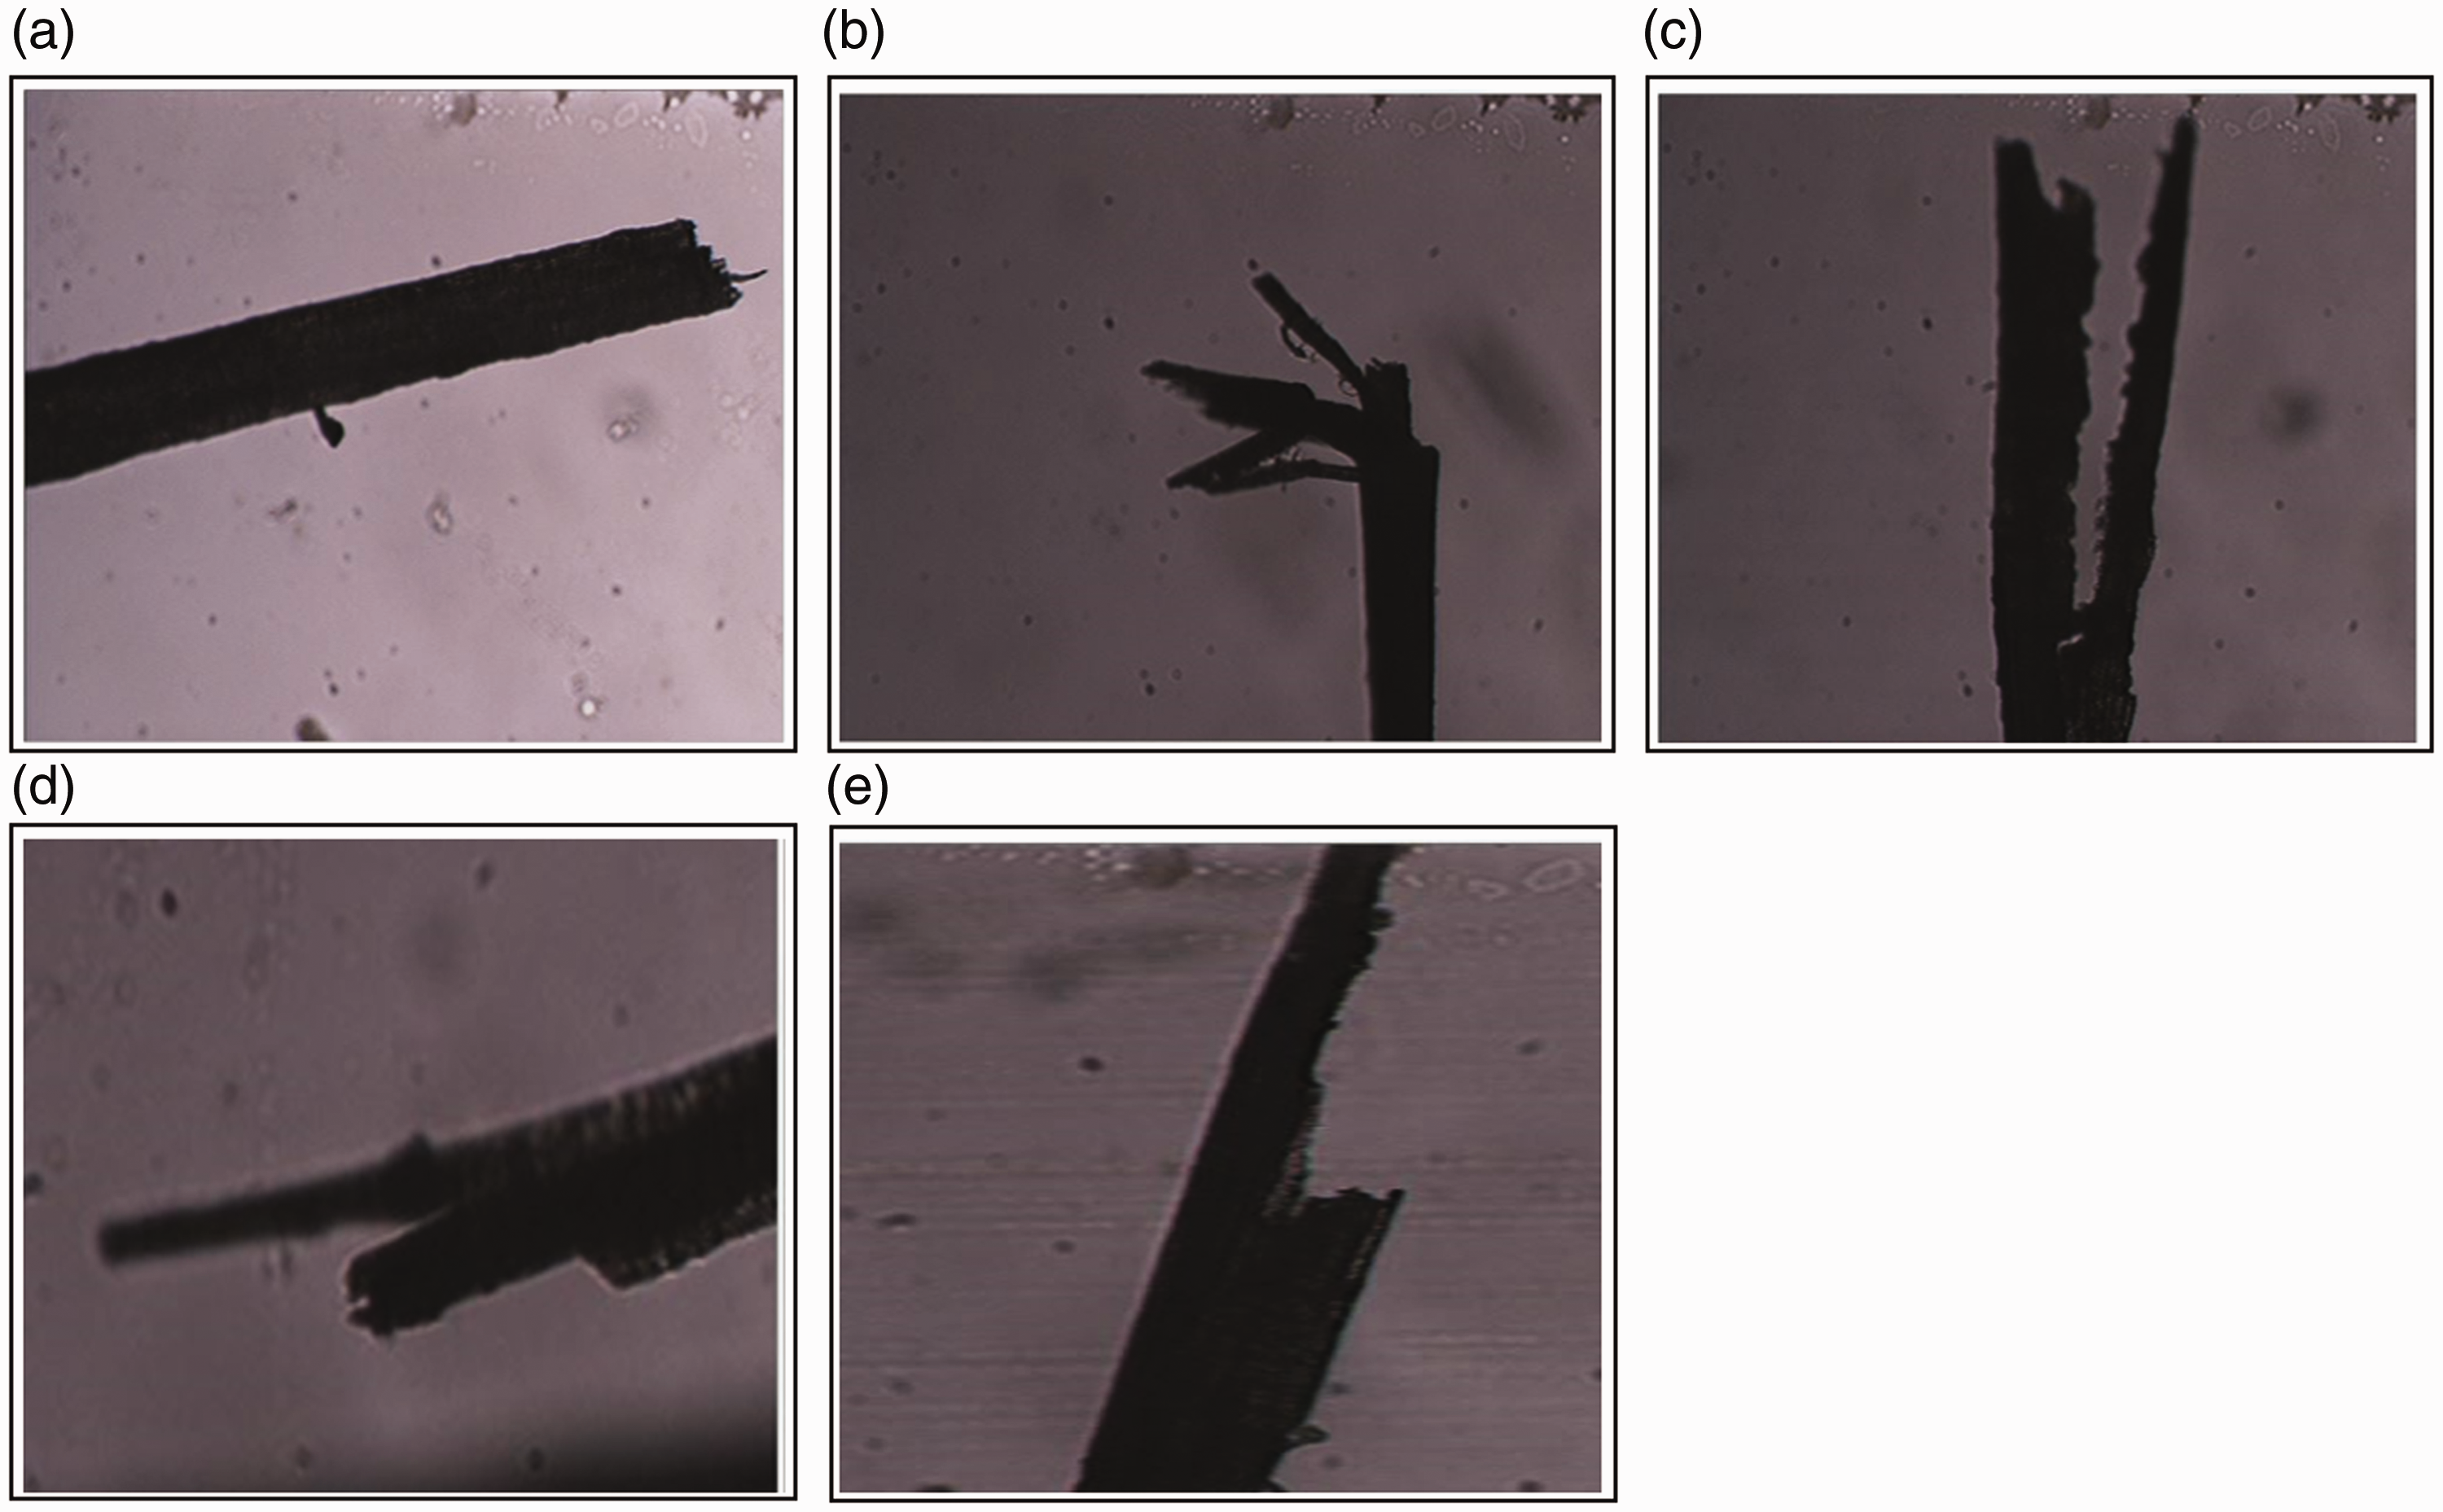
(a) Granular/fibrillar break (canola fiber 11% relative humidity (RH)); (b) canola fiber break with multiple splitting (11% RH); (c) axial spit (canola fiber, 75% RH); (d) tensile break – multiple ends (11% RH); (e) tensile break – single end (75% RH).
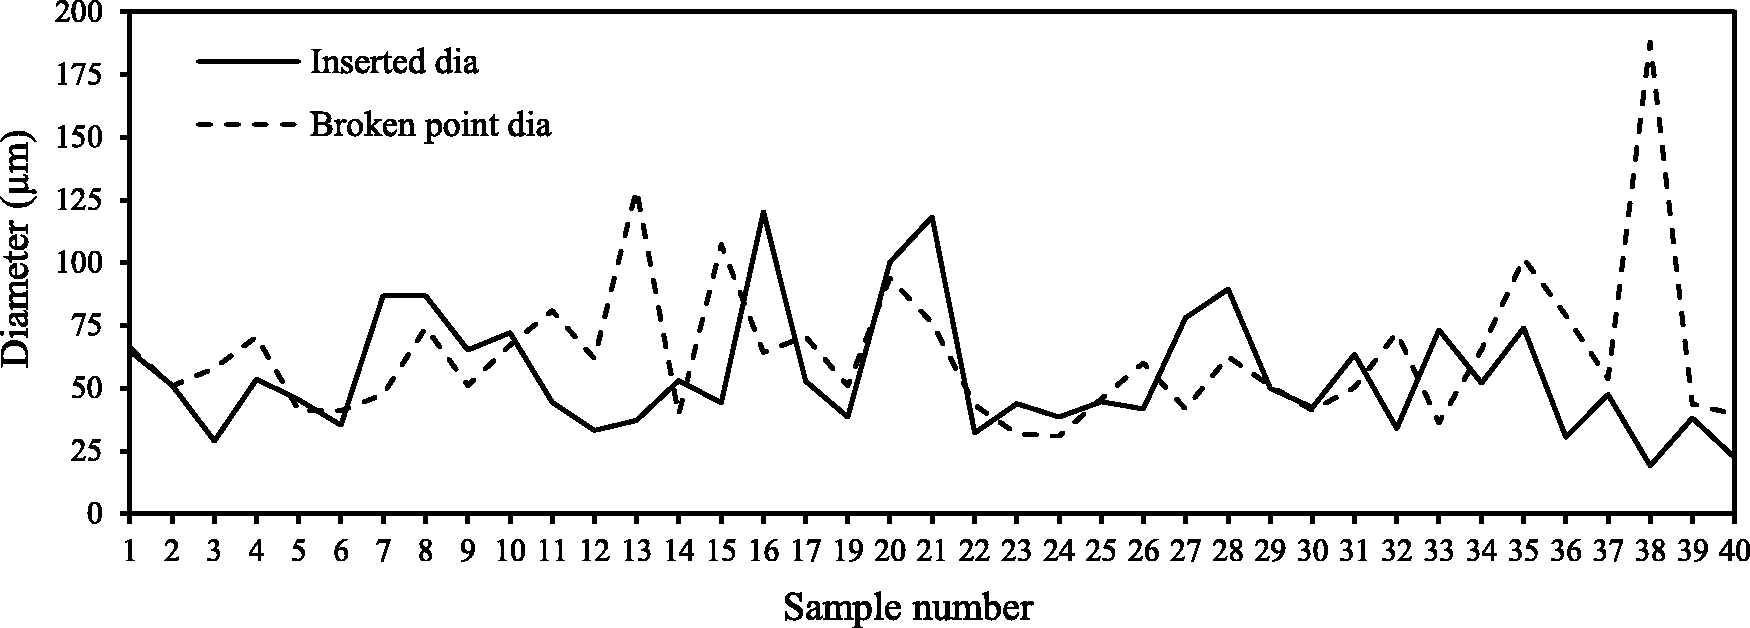
Inserted diameter and breakage point diameter (canola fiber).
Shadhin et al. (2021) 1 has demonstrated that the cattail fiber diameter determines their mechanical property (tensile modulus and tensile strength). Smaller fiber diameter results in higher modulus and strength. However, larger variation in the fiber diameter, even in the different places of a single fiber as discussed in the previous section, leads to a scatter in the mechanical properties results. This variation in fiber diameter can be explained by the scatter observed in the geometry of the cattail leaf’s structure before chemical extraction. Figure 5(a) shows the top view and Figure 5(b) shows the 3D X-ray image of a precut cattail leaf before retting. The magnified X-ray images (1000×) of the same unretted cattail leaf are illustrated in Figure 5(c) designating the cross-sectional view and Figure 5(d) designating the dorsal view. The heterogeneity in microstructures, indicated by the different distances between the cell walls and different cell wall thicknesses, are observed both in cross-sectional (Figure 5(c)) and dorsal view (Figure 5(d)) of cattail plant. These structural variations can not be controlled while extracting the fibers from the plant. The observed random microstructures of the cattail plant (Figure 5(c)) and Figure 5(d)) are expected to have a significant impact on the distribution of fiber diameter and mechanical properties.
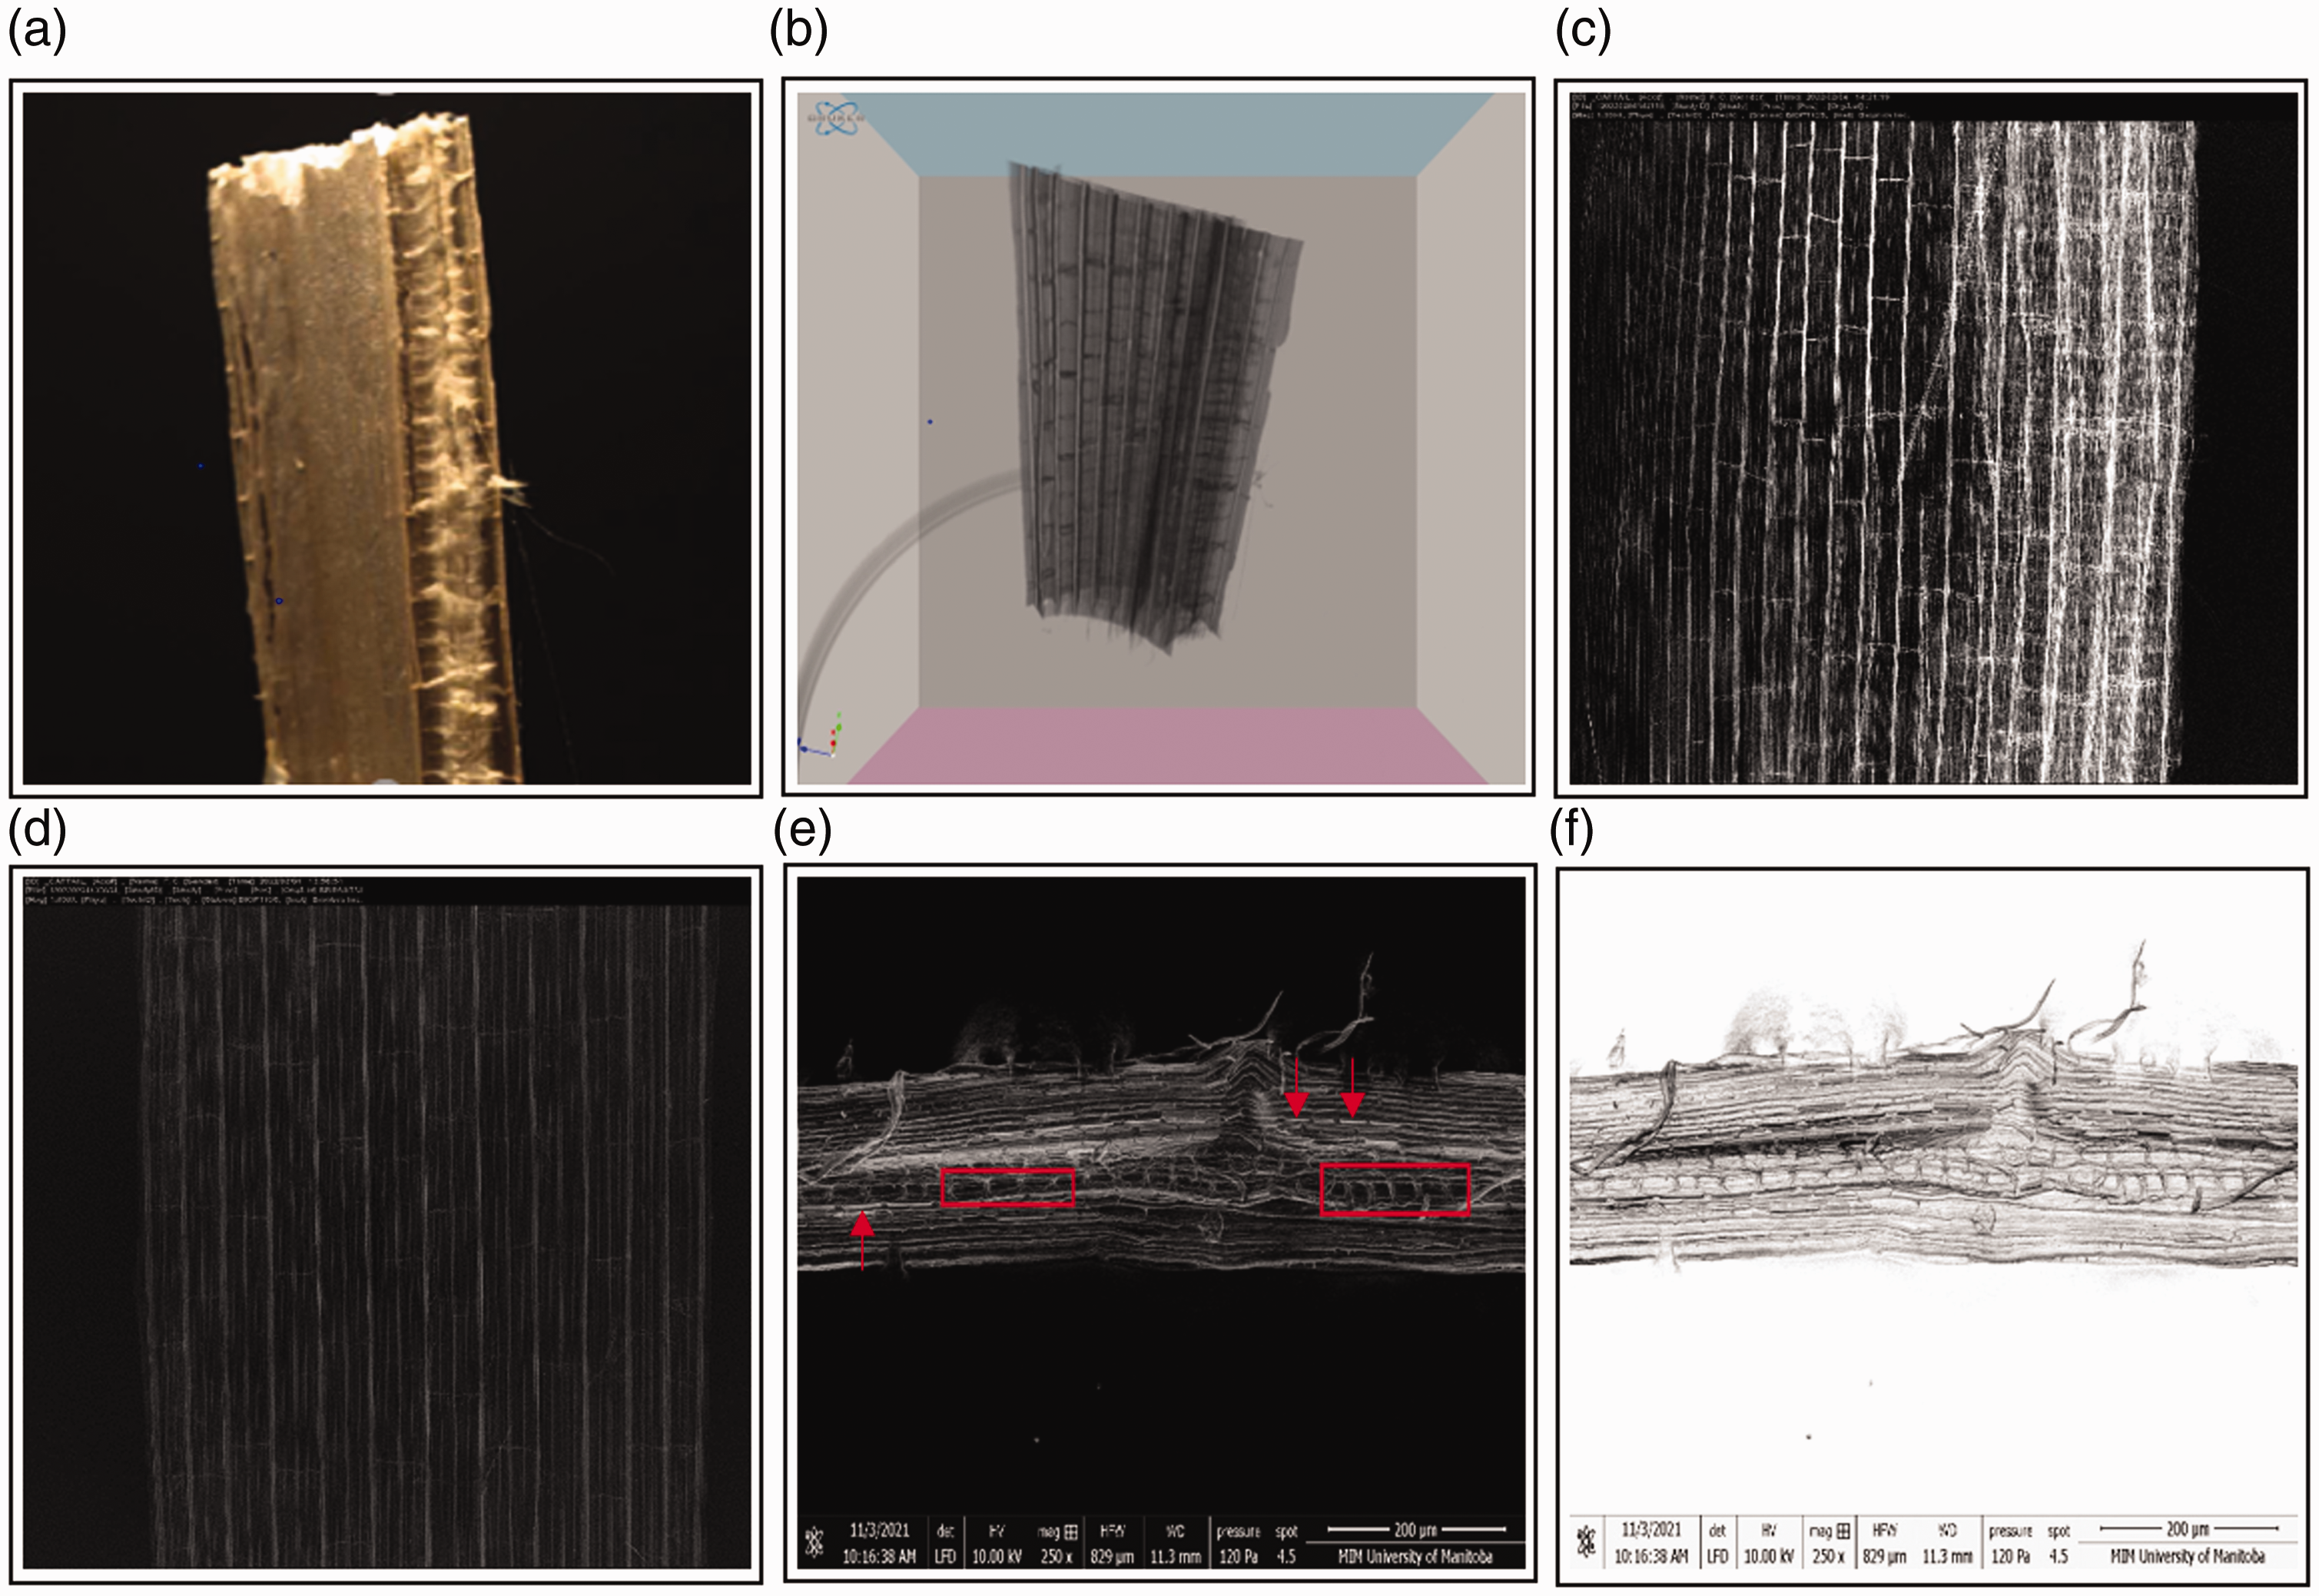
(a) Top view of a precut cattail leaf; (b) three-dimensional (3D) X-ray image of a precut cattail leaf; (c) X-ray image (1000× magnification) of the cross-sectional view of cattail leaf; (d) X-ray image (1000× magnification) of the dorsal view of cattail leaf – before retting (e); (f) SEM images (250× magnification) of single cattail fiber after retting and extraction.
Fiber retting and extraction conditions affect the structural parameters of the fiber bundles thus contributing to the variability in the mechanical properties. Figure 5(e) and Figure 5(f) shows the scanning electron microscopy (SEM) images (250× magnification) of the longitudinal view of a single cattail fiber obtained after chemical retting and extraction. The rectangular calcium oxalate plates, indicated by the red arrowheads in Figure 5(e), are observed in the microstructure of individual cattail fibers, which is in agreement with the studies conducted before. 1 However, some of the calcium oxalate plates are found to be removed creating several pit areas in the microstructure of cattail fiber, which is believed to be due to the exposure of the fibers to different chemicals during retting, neutralizing, and washing. The removed calcium oxalate plates or pit areas are indicated by the red boxes in Figure 5(e). The existence of the calcium oxalate plates and the pit areas can more clearly be understood in the SEM image given in Figure 5(f). Hence, these microstructural variations are also expected to contribute to the variability in the mechanical properties of waste biomass cattail fiber. According to Charlet et al. (2007), 69 the mechanical properties of flax fibers vary with the fiber location in the stems (top, middle, and bottom) and the corresponding fiber diameter at different zones of the stem which supports the above discussion stated for two WBFs.
With this large variation in tensile properties in the WBFs which could be due to the inherent structural variations, it is essential that probability analysis be carried out. The two-parameter Weibull distribution was conducted, which is reported to have good agreement with single fiber strength data for other natural cellulosic fibers. 42
Weibull analysis of tensile strength of WBFs at different RH conditions
The plot between ln [ln (1/(1 − F(x))] and ln (tensile strength) is presented in Figure 6 and Figure 8 for cattail and canola, respectively. The Weibull shape parameter (a), scale parameter (β), average Weibull tensile strength (σavg), and coefficient of determination of tensile strength (R2 σ ) of the Weibull distribution of WBFs at different RH conditions are given in Table 2.
Weibull parameters of tensile strengths for WBFs at different relative humidity based on Weibull distribution model
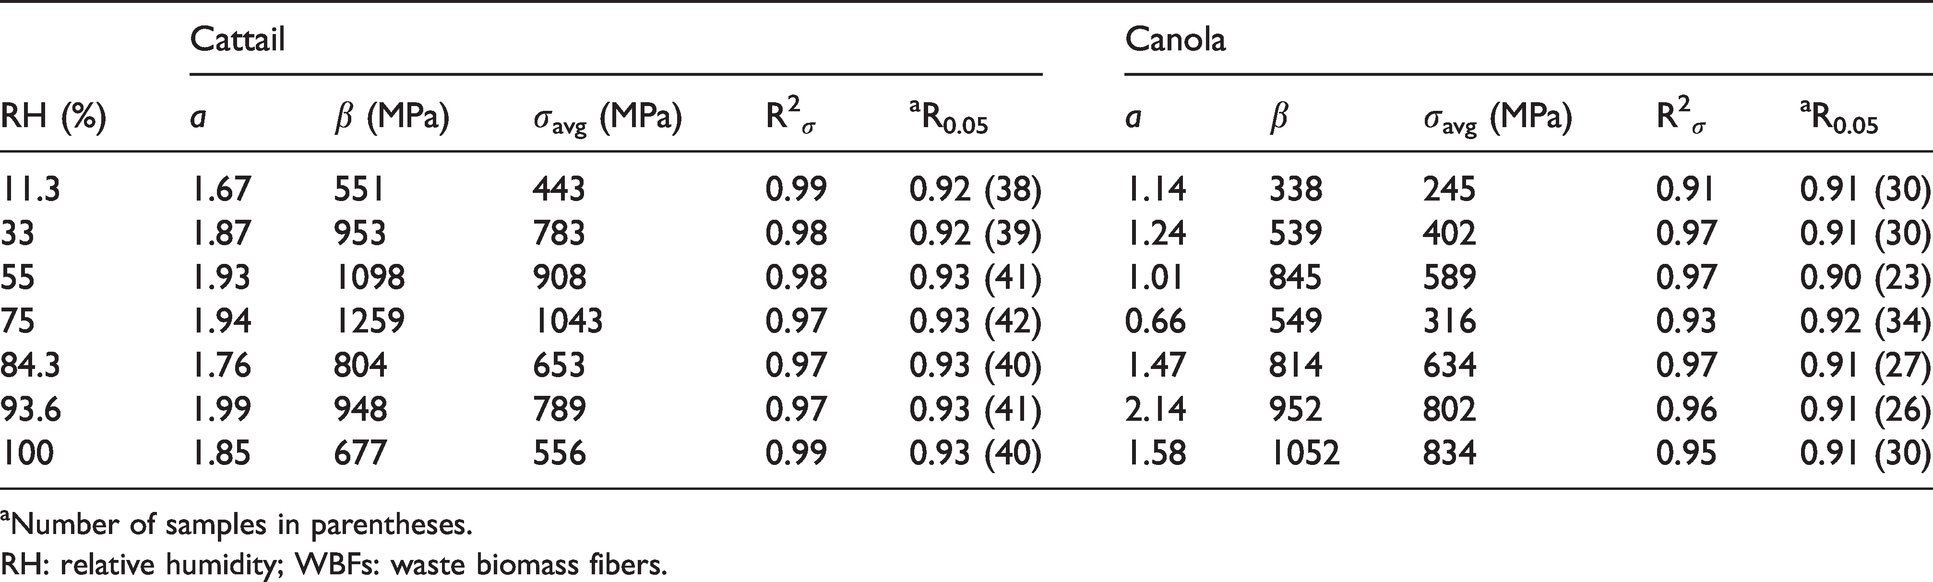
aNumber of samples in parentheses.
RH: relative humidity; WBFs: waste biomass fibers.
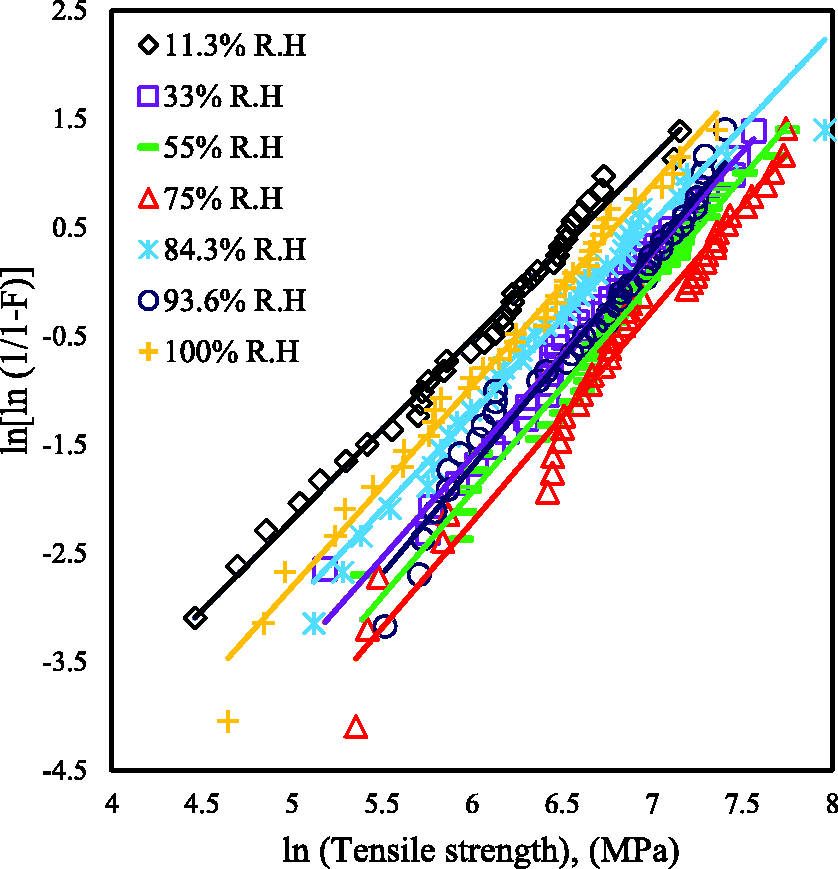
Weibull plots of the tensile strength of cattail fiber at different relative humidity.
The Weibull tensile strength (σavg) closely follows experimental tensile strength for both WBFs (Table 1) at different RHs. The correlation coefficient (R2
σ
) is greater than 0.90 in all conditions. However, the overall R
2
σ
is better for cattail fiber than canola. This R
2
σ
is used to determine whether the tensile properties data for WBFs follow Weibull distribution by calculating the critical value of R2 with a 95% significant level (R20.05) using equation (9):

The Weibull shape parameter (a) for cattail ranged from 1.67 to 1.99 while the (a) for canola fiber was 0.66 to 2.14. The shape parameter was the highest at 93.6% RH for both WBFs. Higher shape parameter values are preferable in the Weibull distribution model as a lower shape parameter value indicates higher scattering in tensile strength, whereas a higher value designates lower variability in the tensile strength.
Looking at the range in values of a and R2 σ , it can be stated that the strength data for cattail fiber is less scattered than for the canola fiber. The values of (a), when measuring tensile strength, are found to be 1.19 for jute (gauge length: 20 mm),43 3.7 for sisal (gauge length: 20 mm),71 and 2.6 for flax (gauge length: 10 mm, 140°C treated).62 One of the reasons for a slightly higher shape parameter for other bast fibers is that the authors used shorter gauge length (10 to 20 mm) than the current study (25 mm).
The probability of survival calculated using equation (7) was plotted as a function of experimental tensile strength values to understand the reliability of tested specimen as shown in Figure 7 and Figure 9 for cattail and canola fibers, respectively. The experimental tensile strength values of cattail fiber corresponding to 50% probability of survival ranges between 500 and 1000 MPa while for canola 50% survival values lie between 375 and 950 MPa (Table 2). These range values lie within the average tensile strength values at different RH (Table 1). The differences in tensile strength at different humidity conditions seem to be reduced to a great extent when the probability of survival increases. The survival probability in terms of tensile strength is the highest at 75% RH for cattail fiber and between 93% and 100% for canola fiber rather than under any other humidity conditions. However, for engineering applications, the higher strength values from these conditions should be counterintuitive.
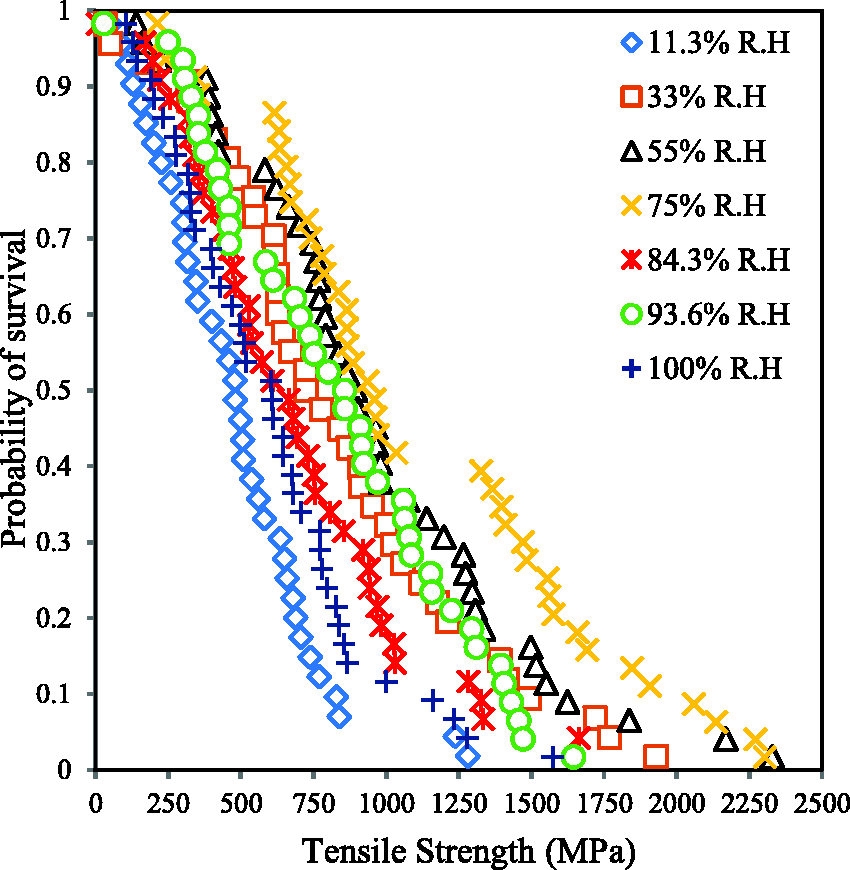
Reliability analysis of tensile strength of cattail fiber at different relative humidity using Weibull distribution.
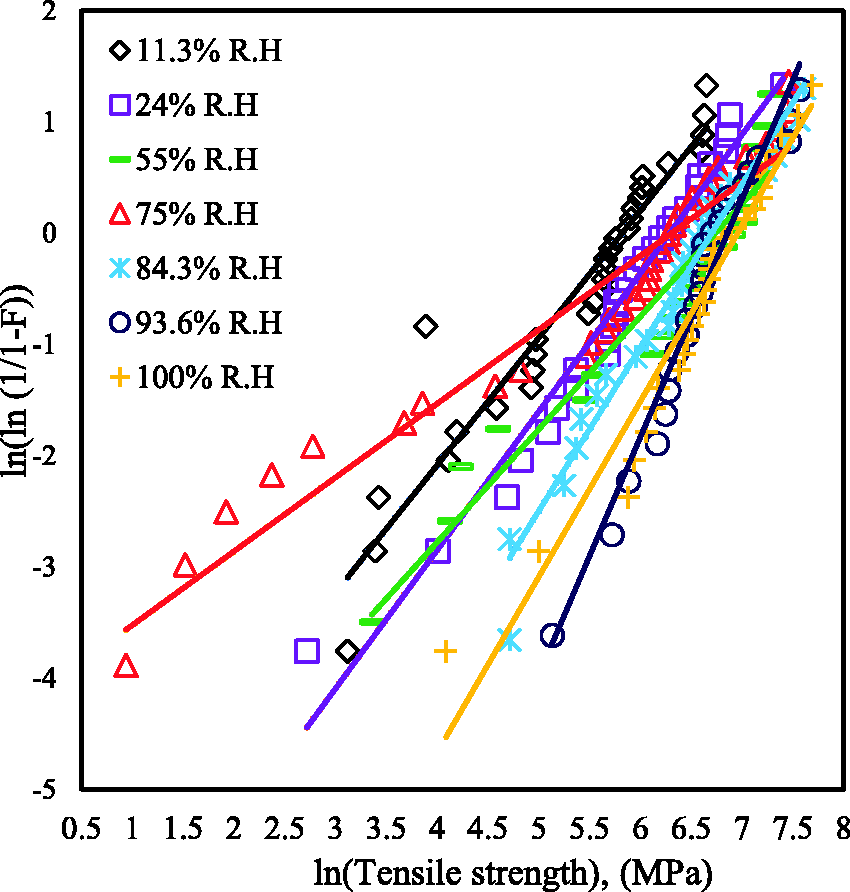
Weibull plots of the tensile strength of canola fiber at different relative humidity.
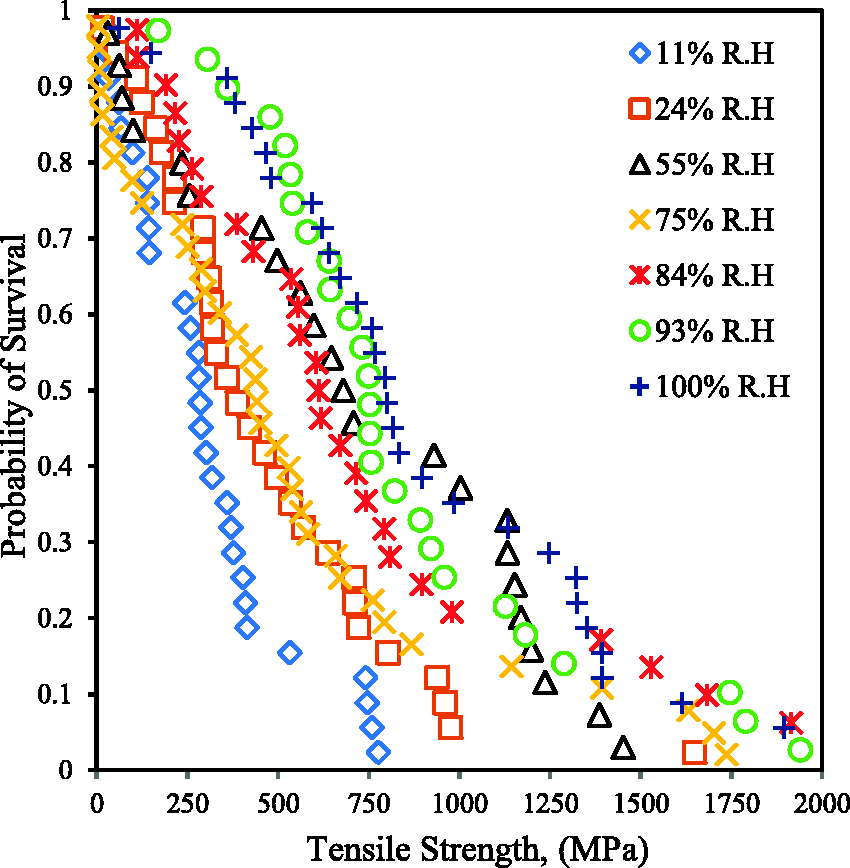
Reliability analysis of tensile strength of canola fiber at different relative humidity using Weibull distribution.
Weibull analysis of elastic modulus of WBFs at different RH conditions
The values of the Weibull parameters (a and β), and average Weibull elastic modulus (Eavg) obtained from ln[ln(1/1 – F)] versus ln (elastic modus) are shown in Figure 10 and Figure 12 for cattail and canola fibers, respectively. These parameters are listed in Table 3. The predicted average elastic modulus (Eavg) follows closely with the experimental modulus with the R2E being 0.95 or higher except 11% RH data for canola fiber.
Comparison of Weibull parameters and elastic modulus of cattail fiber at different relative humidity based on experimental data and Weibull distribution model
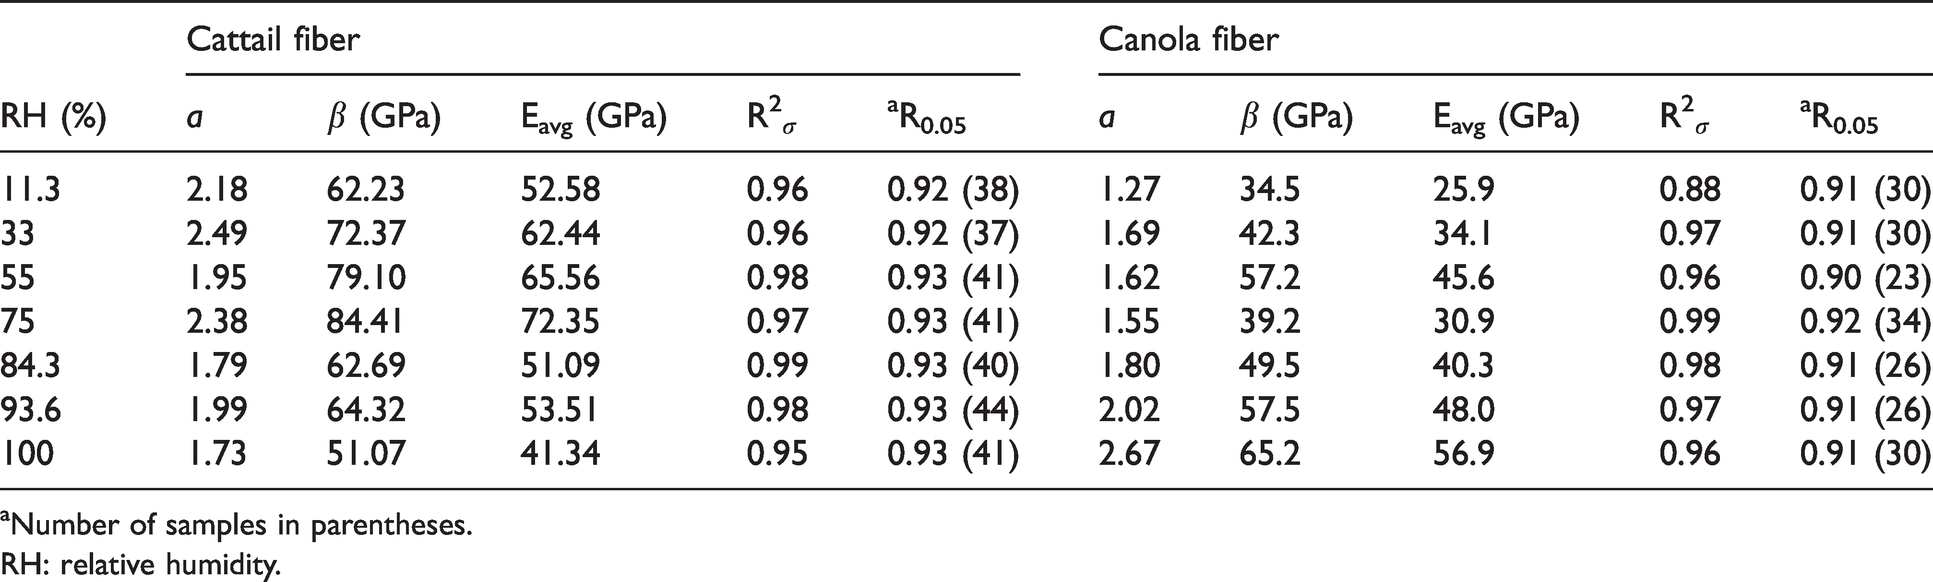
aNumber of samples in parentheses.
RH: relative humidity.
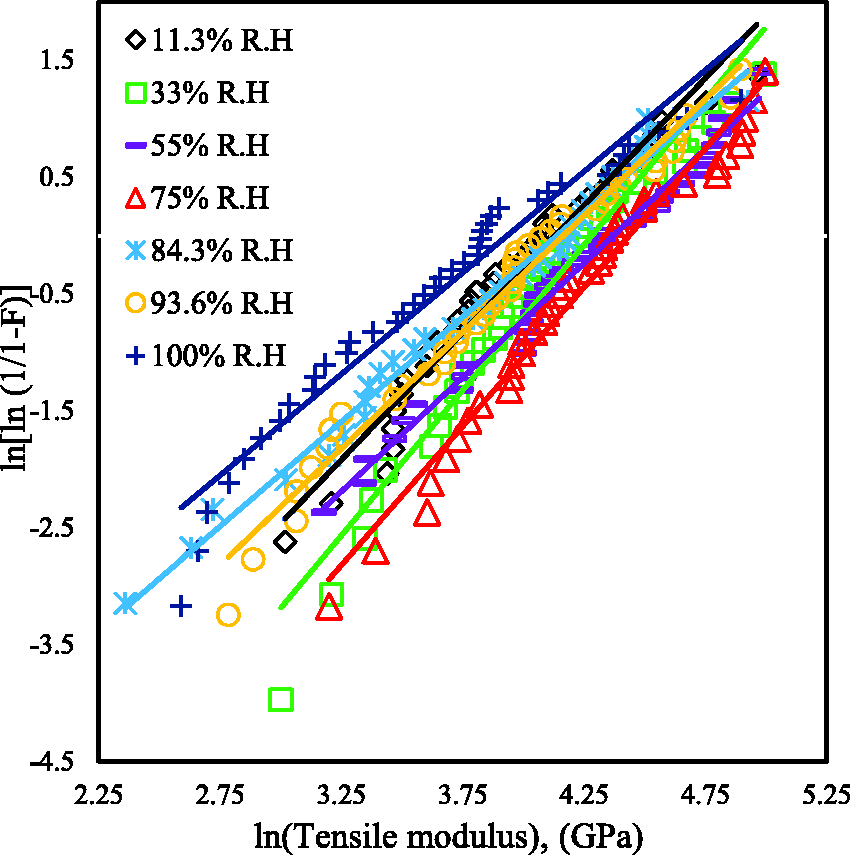
Weibull plots of the elastic modulus of cattail fiber at different relative humidity.
The shape parameter (a) for the elastic modulus of cattail fiber ranges between 1.73 and 2.49 with the top two values (2.49 and 2.38) belonging to 33.0 and 75% RH, respectively. For canola fibers, the value range for a is 1.27 (11% RH) to 2.67 (100% RH). The Weibull a parameter for WBFs falls within the values for flax (1.64–2.14)72 and curaua fiber (1.59–2.23).70 The lower Weibull shape parameters for WBFs and BFs indicate a larger variability in the modulus than the synthetic fibers as a much higher value was recorded for Nextel 312 (4.6) and Nextel 610 (10.5).73
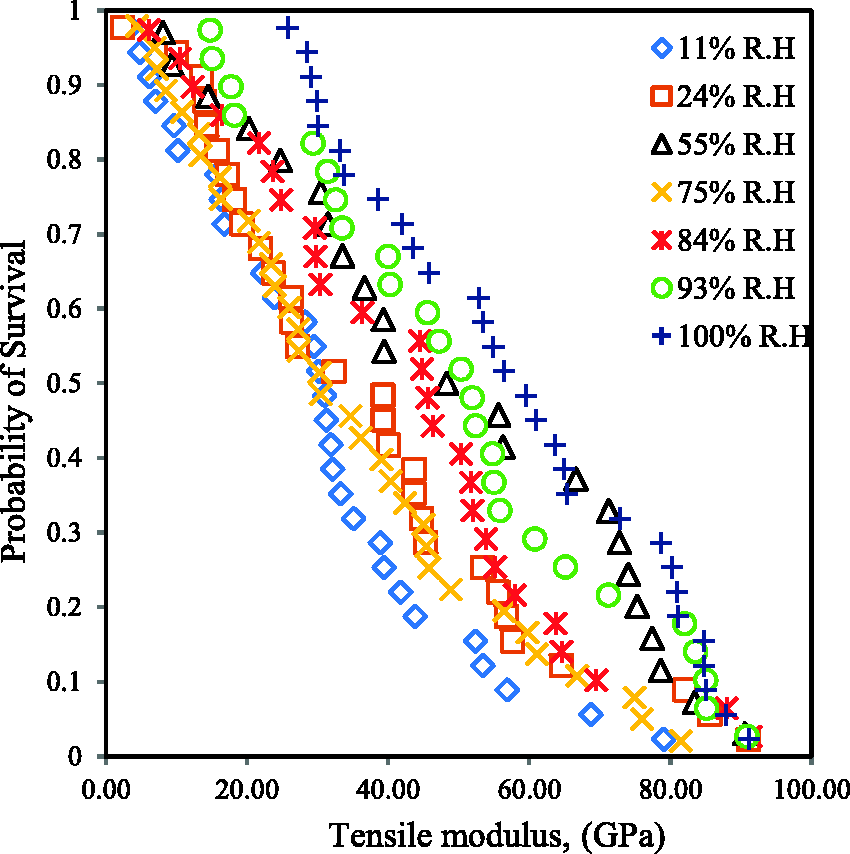
The reliability analysis for the elastic modulus of WBFs using Weibull distribution is presented in Figure 11 and Figure 13, and is determined by plotting the probability of survival and experimental elastic modulus. The elastic modulus corresponding to a 50% probability of survival lies within the mean values listed in Table 1. The survival probability in terms of the elastic modulus was found to be the highest at 75% and 100% RH for cattail and canola fibers, respectively.
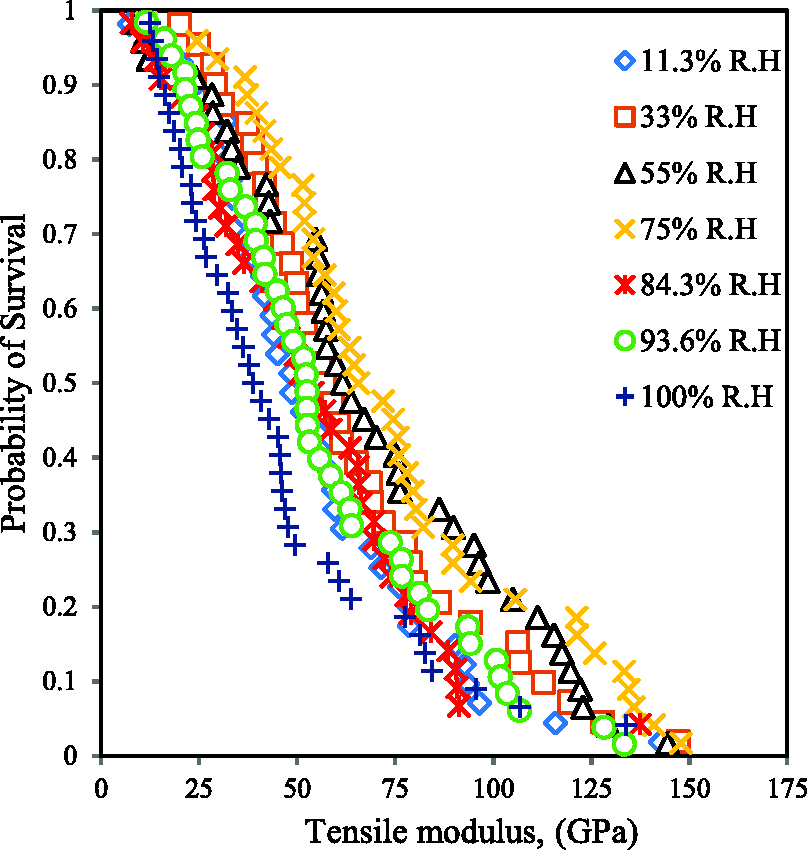
Reliability analysis of elastic modulus of cattail fiber at different relative humidity using Weibull distribution.
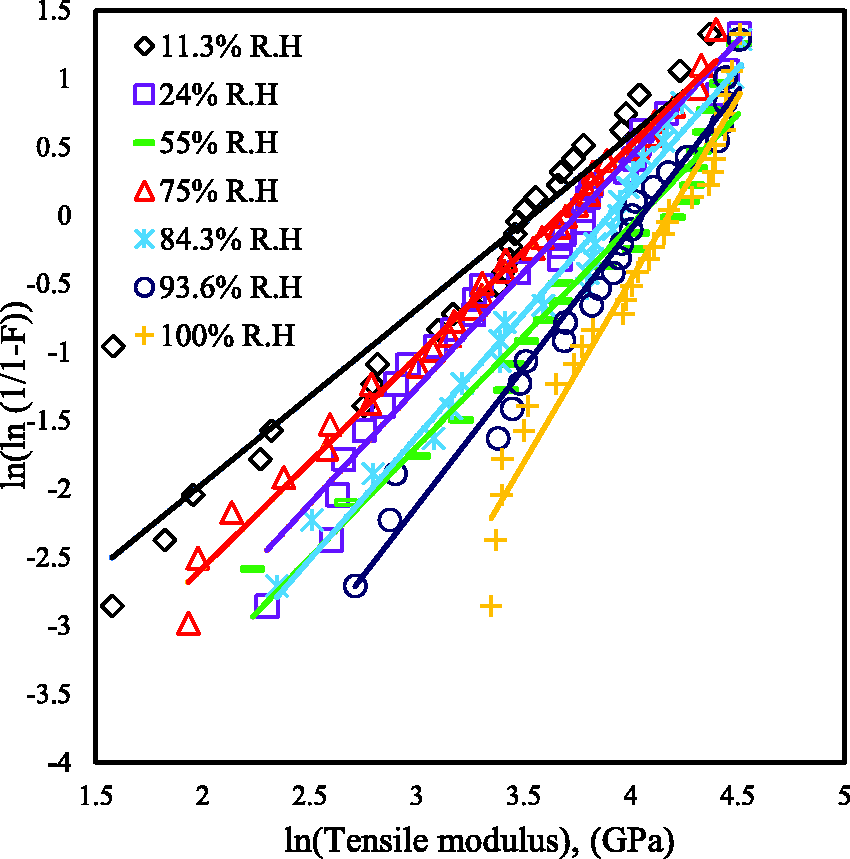
Weibull plots of the elastic modulus of canola fiber at different relative humidity.
Reliability analysis of elastic modulus of canola fiber at different relative humidity using Weibull distribution.
Effect of fiber length on Weibull distribution (cattail fiber)
Three different cattail fiber lengths (25 mm, 35 mm and 45 mm) were chosen to determine the length effect on the Weibull distribution. The mechanical properties and Weibull parameters calculated from the ln(ln(1/1 – F)) – ln (tensile strength) plot are shown in Table 4. The Weibull modulus is slightly better for 35 mm and 45 mm lengths compared to 25 mm; however, the R2 σ is better for 25 mm length data. The effect of the length result on the Weibull modulus in the current study is in agreement with other published results that used similar fiber lengths.74 This is because the effect of defect beyond a specific gauge length and larger strain rate (100 mm−1) does not follow the weakest link theory. However, others found an increase in the Weibull modulus and tensile strength with the increasing gauge length. For example, Xia et al. (2009)43 reported a Weibull modulus of 2.18 and 1.19 for 5 mm and 20 mm gauge length jute fiber.
Effect of fiber length on the Weibull parameters
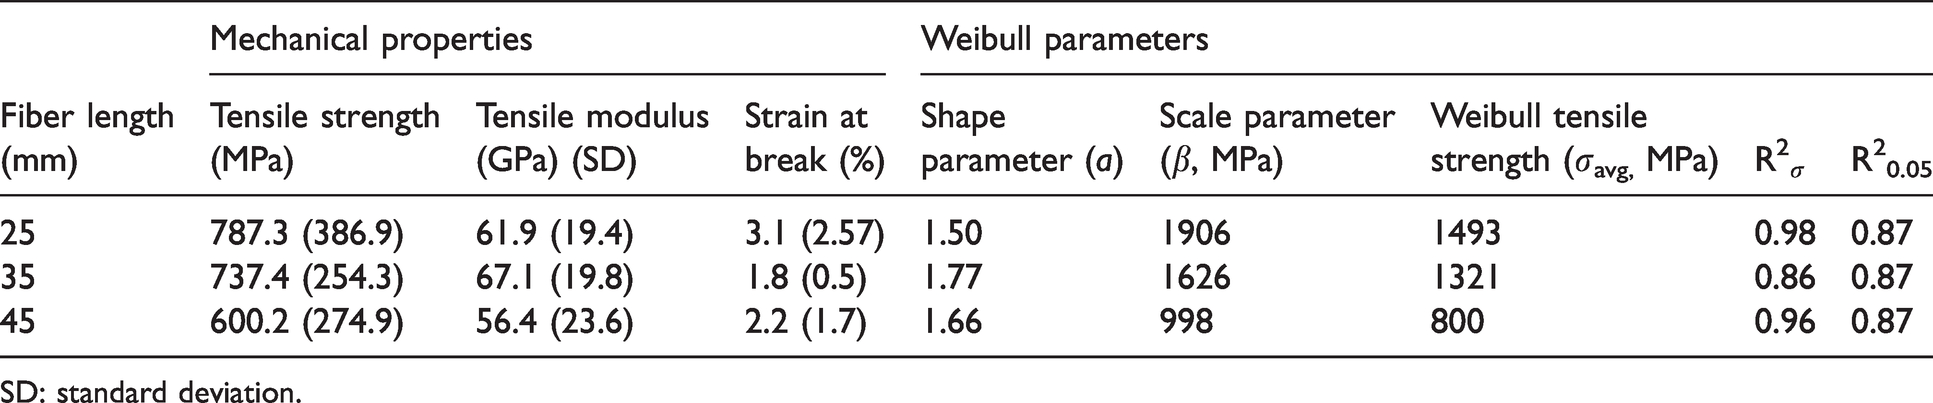
SD: standard deviation.
Using such a shorter fiber length to predict the performance of natural fiber composites, particularly those that are made from needle punched nonwoven fabric, would be inaccurate. During needle punched nonwoven fabrication, the fibers must reach the bottom of the fabric with the needle to make the pillar structure, which is formed when the needle is capable of bridging the fibers that make a stitch structure.75 These stitch structures are essential because they absorb the external force applied to the fabric. Usually, 40–80 mm long fibers are required to make needle punched nonwoven fabrics as the longer fibers increase the fabric grab strength76 and fiber to fiber cohesion and fiber interlock.77 Most importantly, it was found that about 33% of the fiber strength is utilized in a needle-bonded fabric.77
Although the Weibull modulus (shape of the slope) is the lowest for the shorter gauge length test, for all (Table 4), the characteristics strength (distribution location) is increased with the increasing fiber length (Figure 14(a)). Usually, a lower Weibull modulus demonstrates that the samples are more likely to break at lower stress; however, this is not the case as the experimental tensile strength and Weibull characteristics strength decreased with the increasing gauge length (Table 4). This indicates the flaws present in all three specimen sets; however, the types of flaws may be different as can be seen from their breakage pattern (Figure 3). These multiple flaws might contribute to the breakage as well as cause the wriggle effects in the survival graph (Figure 14(b)). Furthermore, the characteristics strength for the shorter length samples is high due to these specimens being highly stressed. While this behavior is more pronounced at the higher strength data points, at the lower strength data points and at 98% reliability the values are similar (≈155 MPa) (Figure 14(b)). This is due to the use of the LR method (LR (Linear regression) method predicts the value of a dependent variable (DV) based on the value of one or more independent variable(s)) that ‘chases’ the lower strength data points.49

(a) Weibull analysis of tensile strength of virgin cattail fiber using different fiber length; (b) reliability analysis of tensile strength of cattail for different fiber length using Weibull distribution.
Effect of estimator on the Weibull distribution (cattail fiber)
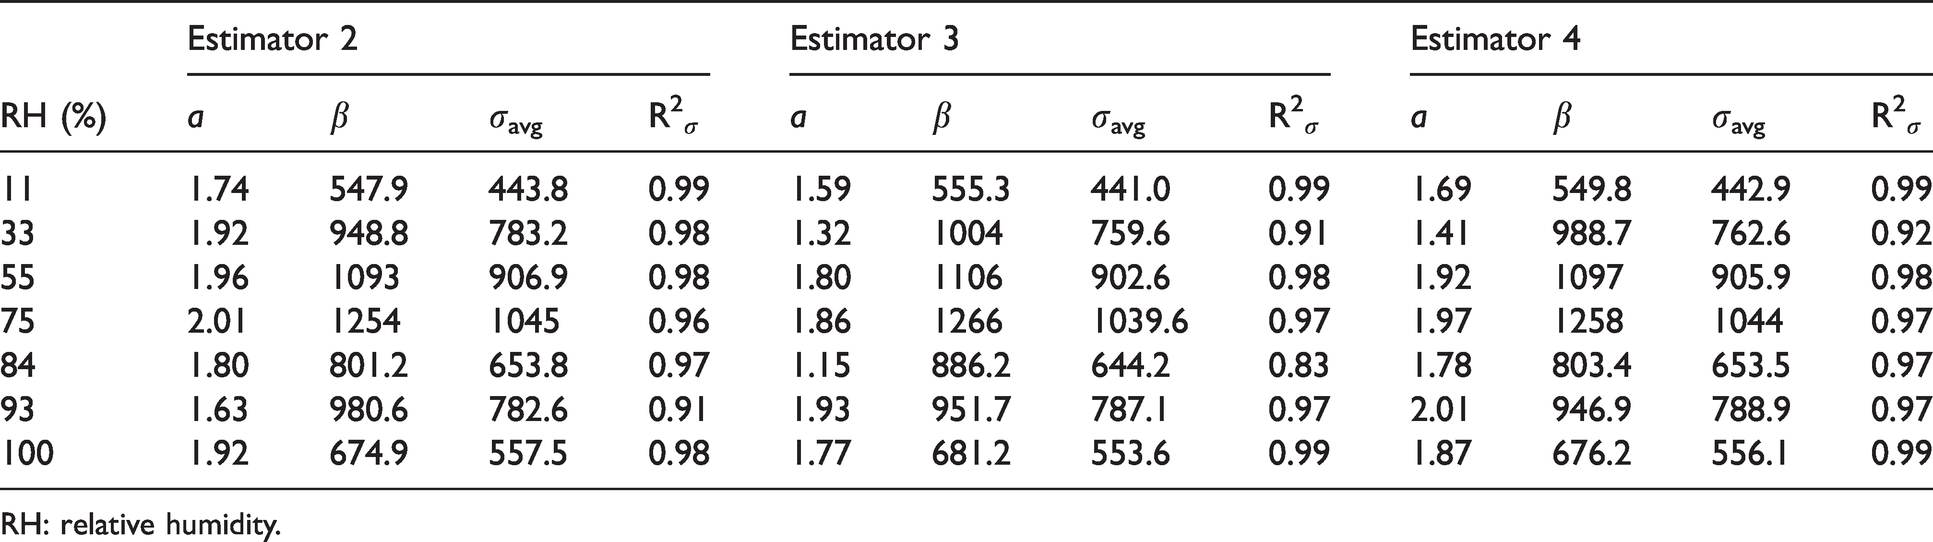
The probability index was also calculated by three other estimators given in equation (10) (Hazen’ – estimator 2), equation (11) (mean rank – estimator 2) and equation (12) (small sample – estimator 4) and the Weibull parameters calculated are given in Table 5. Probability estimators 1, 2 and 4 produced similar a as well as R2
σ
, while estimator 3 revealed larger variation (lower a) in the samples, particularly at 33% and 84% RH samples. Also, R2
σ
values for these two RH (percentage) samples are lower than for other RH samples. The predicted values for strength (σavg) are close to each other for all four estimators; however, the most conservative estimation (lowest) was obtained from the probability estimator 3 and the predicted strength value is the lowest at the 11% RH condition. While only estimator 1 is used for canola fiber, the 11% RH produced the lowest strength value. Conservative strength estimates are preferred for engineering applications. Also, the goodness of fit value for cattail fiber at 11% RH is the highest (0.99) of any other RH conditions for all four estimators that is obtained from LR analysis of ln [ln (1/(1 – F(x))] and ln (tensile strength).


Effect of different estimators on the Weibull parameters
RH: relative humidity.
Conclusions
This study examined the effects of pre-moistened WBFs on their breaking strength and elastic modulus. Both tensile strength and modulus data were successfully described with a two-parameter Weibull distribution for both cattail and canola fiber using the widely used Bernard’s median rank approximation estimator (estimator 1). The tensile stress data were further validated using three other estimators. The Weibull modulus of WBFs is similar to those of flax and hemp when compared with the similar test length. The predicted tensile strength (σavg) and modulus (Eavg) closely follow the experimental values for all RH conditions for both WBFs. However, the predicted values at 11% RH are the most conservative for both WBFs, the goodness of fit is the highest for cattail fiber for four estimators. At this RH, the value of strength at 50% reliability is 442 MPa and 245 MPa, respectively, for cattail and canola, while the value of the modulus is 52.9 GPa and 25.9 GPa for cattail and canola. At 90% reliability, the value for strength and modulus is reduced to 155 MPa and 20 GPa, respectively, for cattail fiber. The 90% reliability values for strength and modulus for cattail fiber are within the strength range of hemp when compared with the similar diameter fiber and measurement technique.78,79
The Weibull modulus was lower for shorter gauge length (25 mm), although the experimental strength, modulus and characteristics strength are higher as the gauge length increased. Taking the results of the gauge length, future research should be conducted by using the appropriate (40 to 80 mm) fiber length that is used to make needle punch nonwoven fabric for composite applications. Finally, the variation and survival probability of waste biomass cattail and canola fibers are comparable with the BFs. Future studies should include determining the fiber quality at different growth stages of the plant and the use of machine learning to predict the appropriate growth stage of the cattail and canola plant for a specific engineering application.
Footnotes
Acknowledgement
The authors would like to thank Dr. Catherine Rui Jin Findlay (Department of Biosystems Engineering, University of Manitoba) for taking the X-ray images of the cattail fiber, Dr. Abdul Khan and the Manitoba Institute for Materials (MIM) for helping in conducting the scanning electron microscopy experiments for cattail fiber, Farhatun Nabi (Department of Biosystems Engineering, University of Manitoba) for assessing the canola fiber breakage after tensile testing.
Declaration of conflicting interests
The author(s) declared no potential conflicts of interest with respect to the research, authorship, and/or publication of this article.
Funding
The author(s) disclosed receipt of the following financial support for the research, authorship, and/or publication of this article: This work received financial support from the University of Manitoba’s Research Grant Program (URGP) and the Natural Sciences and Engineering Research Council of Canada (NSERC) to conduct this research.