
Abstract
Thermal protective performance tests have been conducted and improved over the years to assess the safety provided by firefighters’ outer thermal garments. Existing evaluation criteria based on empirical relations require an iterative process to estimate skin burn injuries. In this work, the concept of critical time – maximum exposure time before physical failure, is proposed, and utilized to abate this iterative process. The critical time relation to the fabric performance is investigated at an incident heat flux of 41, 84 and 126 kW/m2. Furthermore, parametric studies are performed to characterize the fabric thermo-physical behavior and associated burn degree. The tested specimens consist of an outer shell, a moisture barrier and a thermal liner. The methodology of visual assessment as per ISO 6942 is implemented to approximate the critical time. The critical time relation to increasing incident heat flux displayed a nonlinear performance reduction in the garment. An increase in the second degree burn time was observed for a vertically oriented bench-scale test. The firefighter’s current outer garment failed at a high flux of 126 kW/m2. The concept of relating the critical time to cumulative incident flux will aid the education of firefighters on fluctuating fire environments. This research opens a new domain to analyse the protective garments utilising the critical time.
Keywords
A protective garment is worn for the safety of personnel involved in high-risk sectors such as firefighting/high-speed sports (thermal protective clothing), the oil and gas industry (chemical protective clothing) and the military (puncture and cut resistant protective clothing). 1 The occurrence of structural fire is approximately 39.27% (National Fire Protection Association (NFPA) statistics), making thermal protective clothing of great importance among other active fire safety techniques. 2 The fire environment in compartment settings or forest fire is variant from one incident to another. 2 Therefore, the outer protective suit for firefighters is designed to work under a certain range of heat flux representative of several fire propagation scenarios such as flashover, backdraft, fully developed or a forest fire. They are conventionally classified as routine, hazardous and emergency.3,4 Past research has focused on accessing the minimum protection level of firefighter outer garments.5 –9 However, its maximum performance relative to the fire severity and practical implications of the garment thermal degradation needs to be addressed.
Behnke (1984) quantified the fire severity in terms of incident heat flux by accessing damaged protective clothing acquired from different fire incidents. 10 The author’s observations showed that the heat flux in fire incidents range from 41 to 125 kW/m2. A value of 84 kW/m2 replicated the damaged clothing; hence, it was proposed to represent an industrial flash fire. He also introduced a horizontally configured bench-scale apparatus for combined convective and radiative exposure to simulate an industrial flash fire. 11 Subsequently, this apparatus became the industry standard to evaluate the protective performance based on a thermal protective performance (TPP) index. Additional test standards have been developed based on Behnke’s initial research, such as NFPA 1971, ISO 11999-3:2015 and ISO 6942:2002. 12 –14
It has been demonstrated that a firefighter can tolerate extreme conditions of 84 kW/m2 for a maximum of 2 seconds. 15 Therefore, for a manikin test standard, ISO 13506-1 recommends conducting the experiments for 3–12 seconds at 84 kW/m2. 16 A full-scale manikin test is expensive for repeatability and is challenging to carry out in a laboratory environment. As a result, researchers favor bench-scale tests. 2 The National Institute of Standards and Technology (NIST) has developed a vertically oriented bench-scale apparatus, limited to replicate fire loads up to 50 kW/m2. 17 The NIST argued that a vertical orientation depicts standing individuals, hence it is a better representation of an active firefighter. Therefore, in this work, a vertically oriented custom-built bench-scale apparatus developed by Korean Conformity Laboratories (KCL) is utilised to test firefighters’ garments at 126 kW/m2. 18
A protective garment subjected to a flashover environment for 10 seconds is adequate to protect against skin burn. 19 Past research has adopted this 10 and 15 seconds as a cut-off line to assess the safety levels.5 –9 This practice limits the assessment of the fabric materials. In addition, human skin is more susceptible to burn injuries due to the stored thermal energy. 20 This stored thermal energy has a direct dependency on the incident heat flux and exposure time. Limiting exposure time to the minimum required criteria for evaluation does not give a total account of thermal energy that a garment can sustain. As the energy in a system must be conserved, a multilayered assembly accumulates a significant portion of incident heat flux as compared to a single layer, later dissipated bi-directly, that is, towards the wearer’s body and to the environment. 2
Test standard ASTM F2703-08(2013) recommends a constant value of time (tmax), to estimate the time required to induce second-degree burns. 21 This notion is adapted in the current study to introduce a subjective term called ‘critical time (tct)’. It is defined as, ‘maximum exposure time at which a protective fabric assembly can retain its physical shape under a constant exposure to a certain level of incident heat flux’. Assessment at tct would improve the understanding of the fabric behavior at life-threatening conditions. This study establishes a technique to estimate maximum exposure time at varying incident flux, giving a notion of critical time tct.
In addition to the application of tct, its relation to fabric thermal degradation under variant fire loads is also investigated, which to the authors’ best knowledge has not been studied. A novel heat flux range is approximated to represent severe fire conditions. This range is estimated by accessing experimental findings on observed heat fluxes in modern compartment settings. Kransy et al. (1988) studied heat flux densities in several room fires from pre-flashover to flashover including severe post-flashover conditions and concluded that it can reach as high as 180 kW/m2. 19 National Research Council of Canada (NRC) experiments indicated that modern bed mattress assemblies contributed more to the heat flux density. They recorded a maximum temperature of 1071°C and a heat flux density of 221 kW/m2. 22 A similar result in heat flux intensity was noted, with a value of 170 kW/m2 for the heat flux on the floor level. 23 A report published on structural burn data of the St Lawrence burn project by the NRC was said to have radiant heat flux of 500 kW/m2 up to 40 feet away from the structure for a family house fully engulfed in flames.24 –26 Based on current test standards and heat flux intensities reported in the literature, three levels of heat flux densities are selected for this study as 41, 84 and 126 kW/m2. A value of 126 kW/m2 is an upper limit proposed by Behnke, 10 representative of the severe fire condition. Little to no knowledge exists about the thermo-physical behavior of firefighters’ outer protective garment at a 126 kW/m2 fire condition.
The work in this study addresses the afore-mentioned limitations, with a focus on the outer garment materials utilized for firefighters. The proposed concept of critical time is hypothesized to represent the upper safety limit, it will aid in the establishment of an escape time for firefighters before entering a site on inspection by the fire marshal. If the incident quickly shifts from ordinary to an extreme, time relations investigated under this study can be used to reassess escape time. The evaluation of garment degradation will aid to advance the research of auxiliary protective measures.
Test apparatus
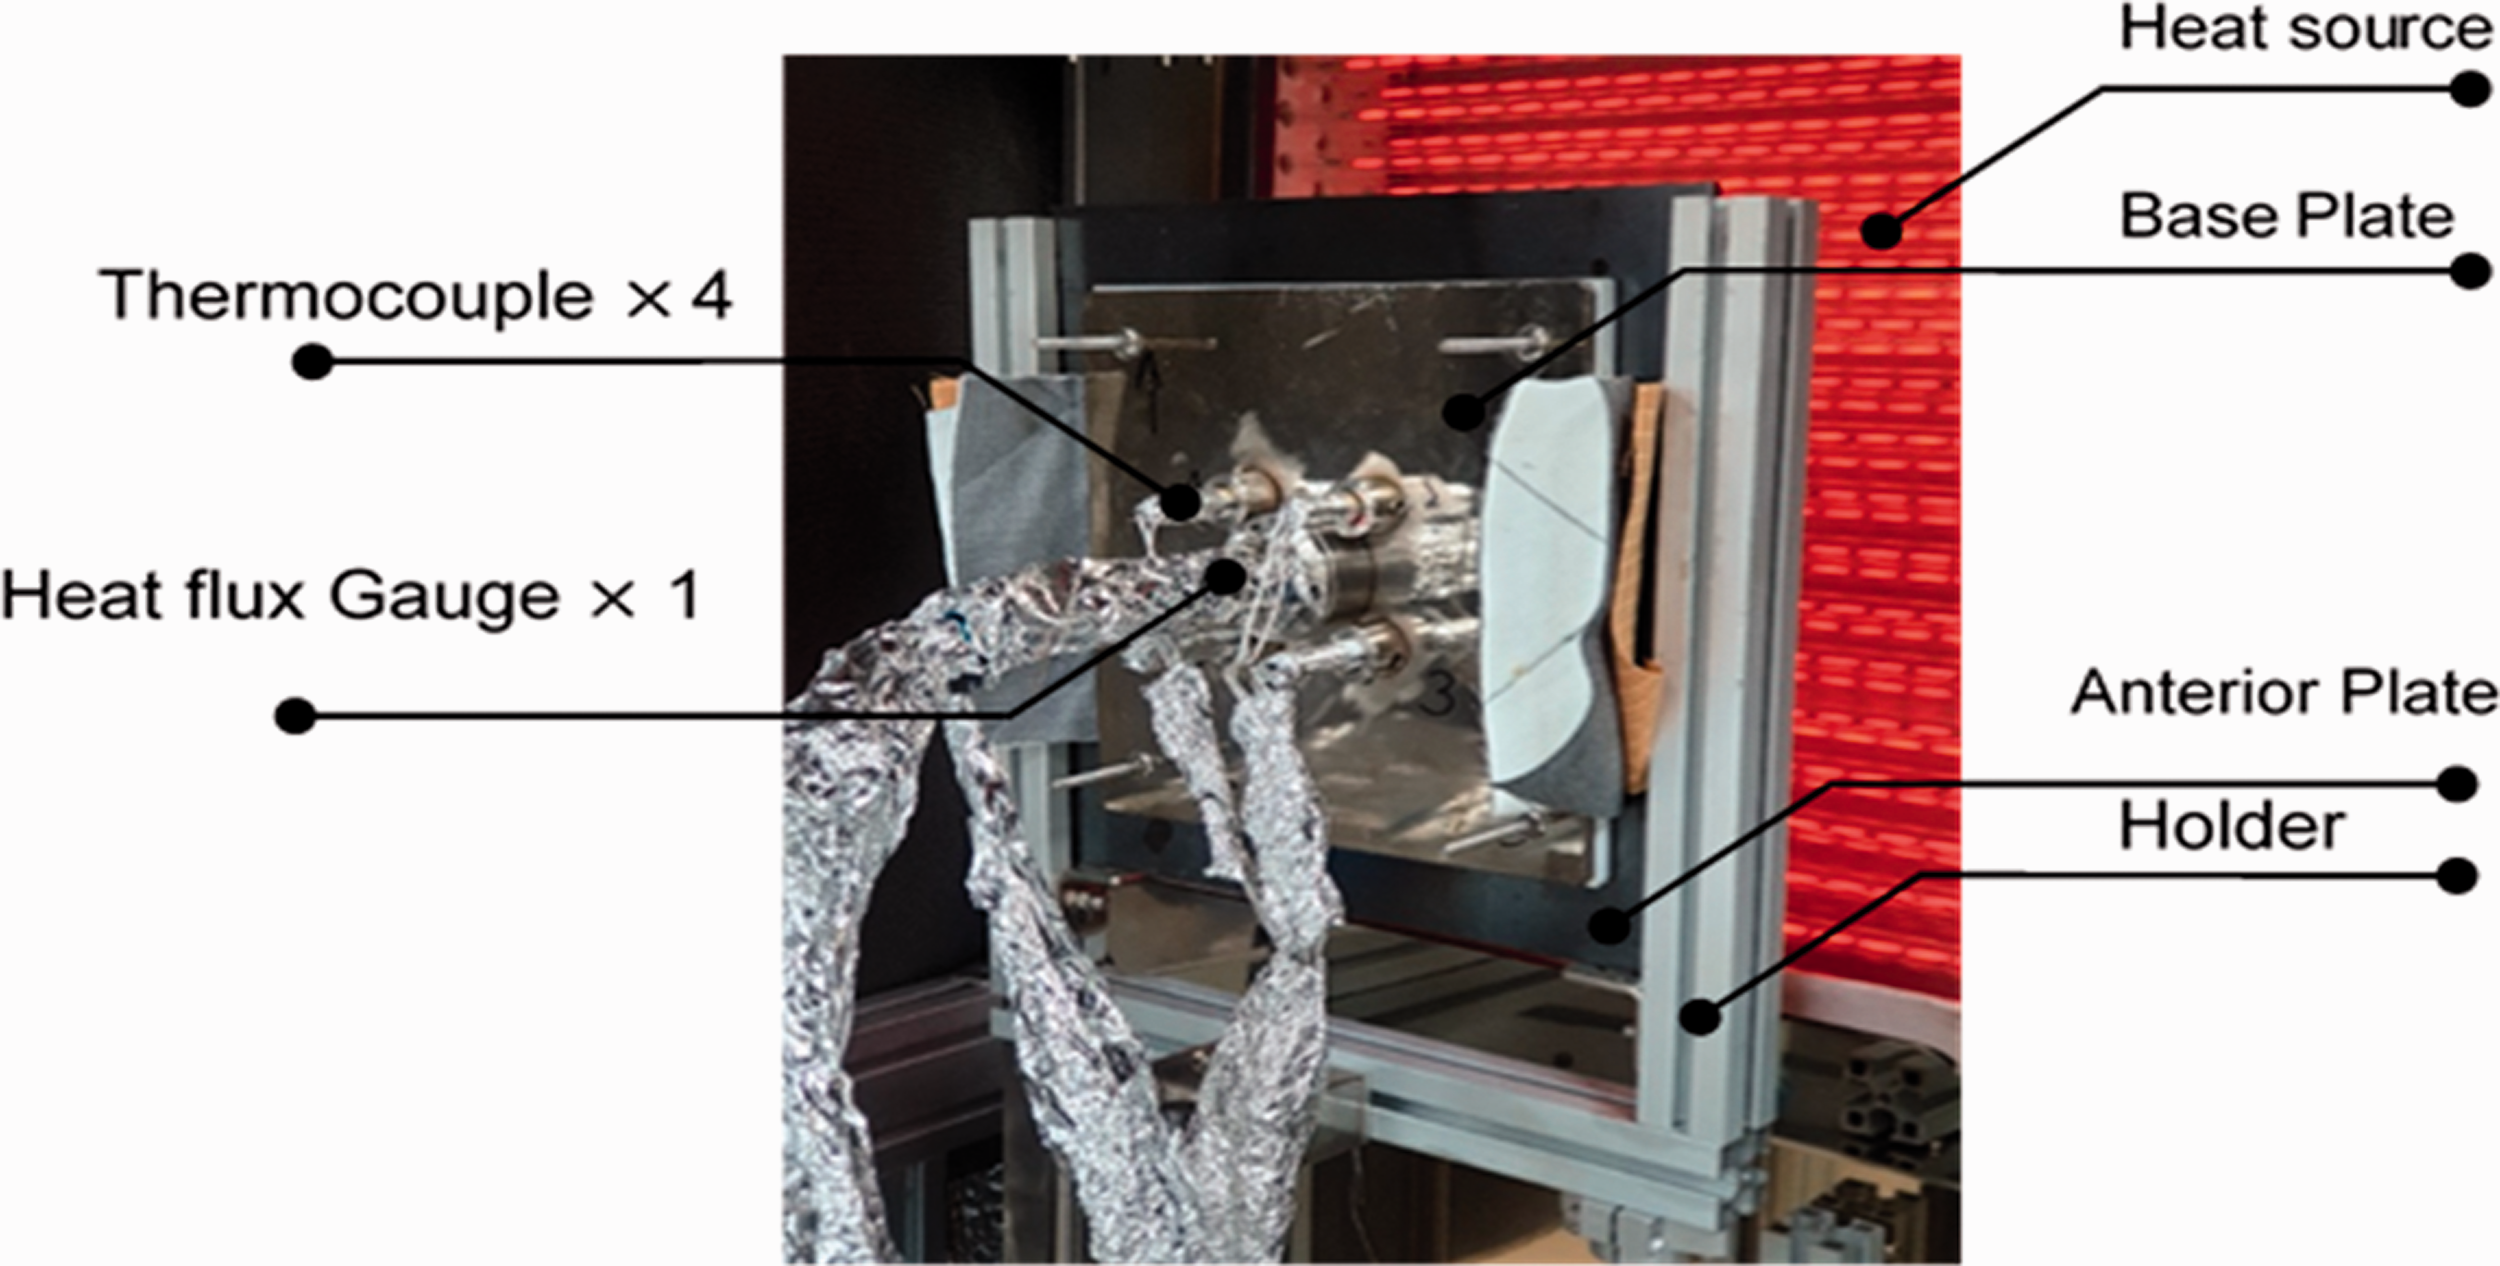
A customised vertical bench-scale apparatus was used as shown in Figure 1. It was developed in cooperation between KCL and Ulster University. The apparatus consistency and development procedure have been detailed and discussed in a KCL publication. 18 The test apparatus operates with two layers of halogen quartz tubes capable of generating radiative heat flux up to 126 kW/m2. A consistent level of irradiance at the exposed surface area of the specimen is attainable. The required irradiance was obtained either by adjusting the electric power or the distance between the heat source and the specimen. Specimen assembly is 200 mm × 200 mm with an exposed fabric area of 100 mm × 100 mm. The cooled water was circulated to keep the temperature of the heating source to the optimum making it possible to operate the apparatus for a prolonged duration of time at extreme heat flux levels. A heat flux gauge and four K-type thermocouple-welded copper disks were attached to the back of the specimen assembly by pressure contact as shown in Figure 2. Due to uneven temperature gradients along the fabric surface, four copper calorimeters were vital to obtain a single averaged temperature value representative of the whole fabric. This configuration of heat flux gauge and thermocouples at a variable distance is beneficial in recording fabric and skin thermal energy history concurrently.
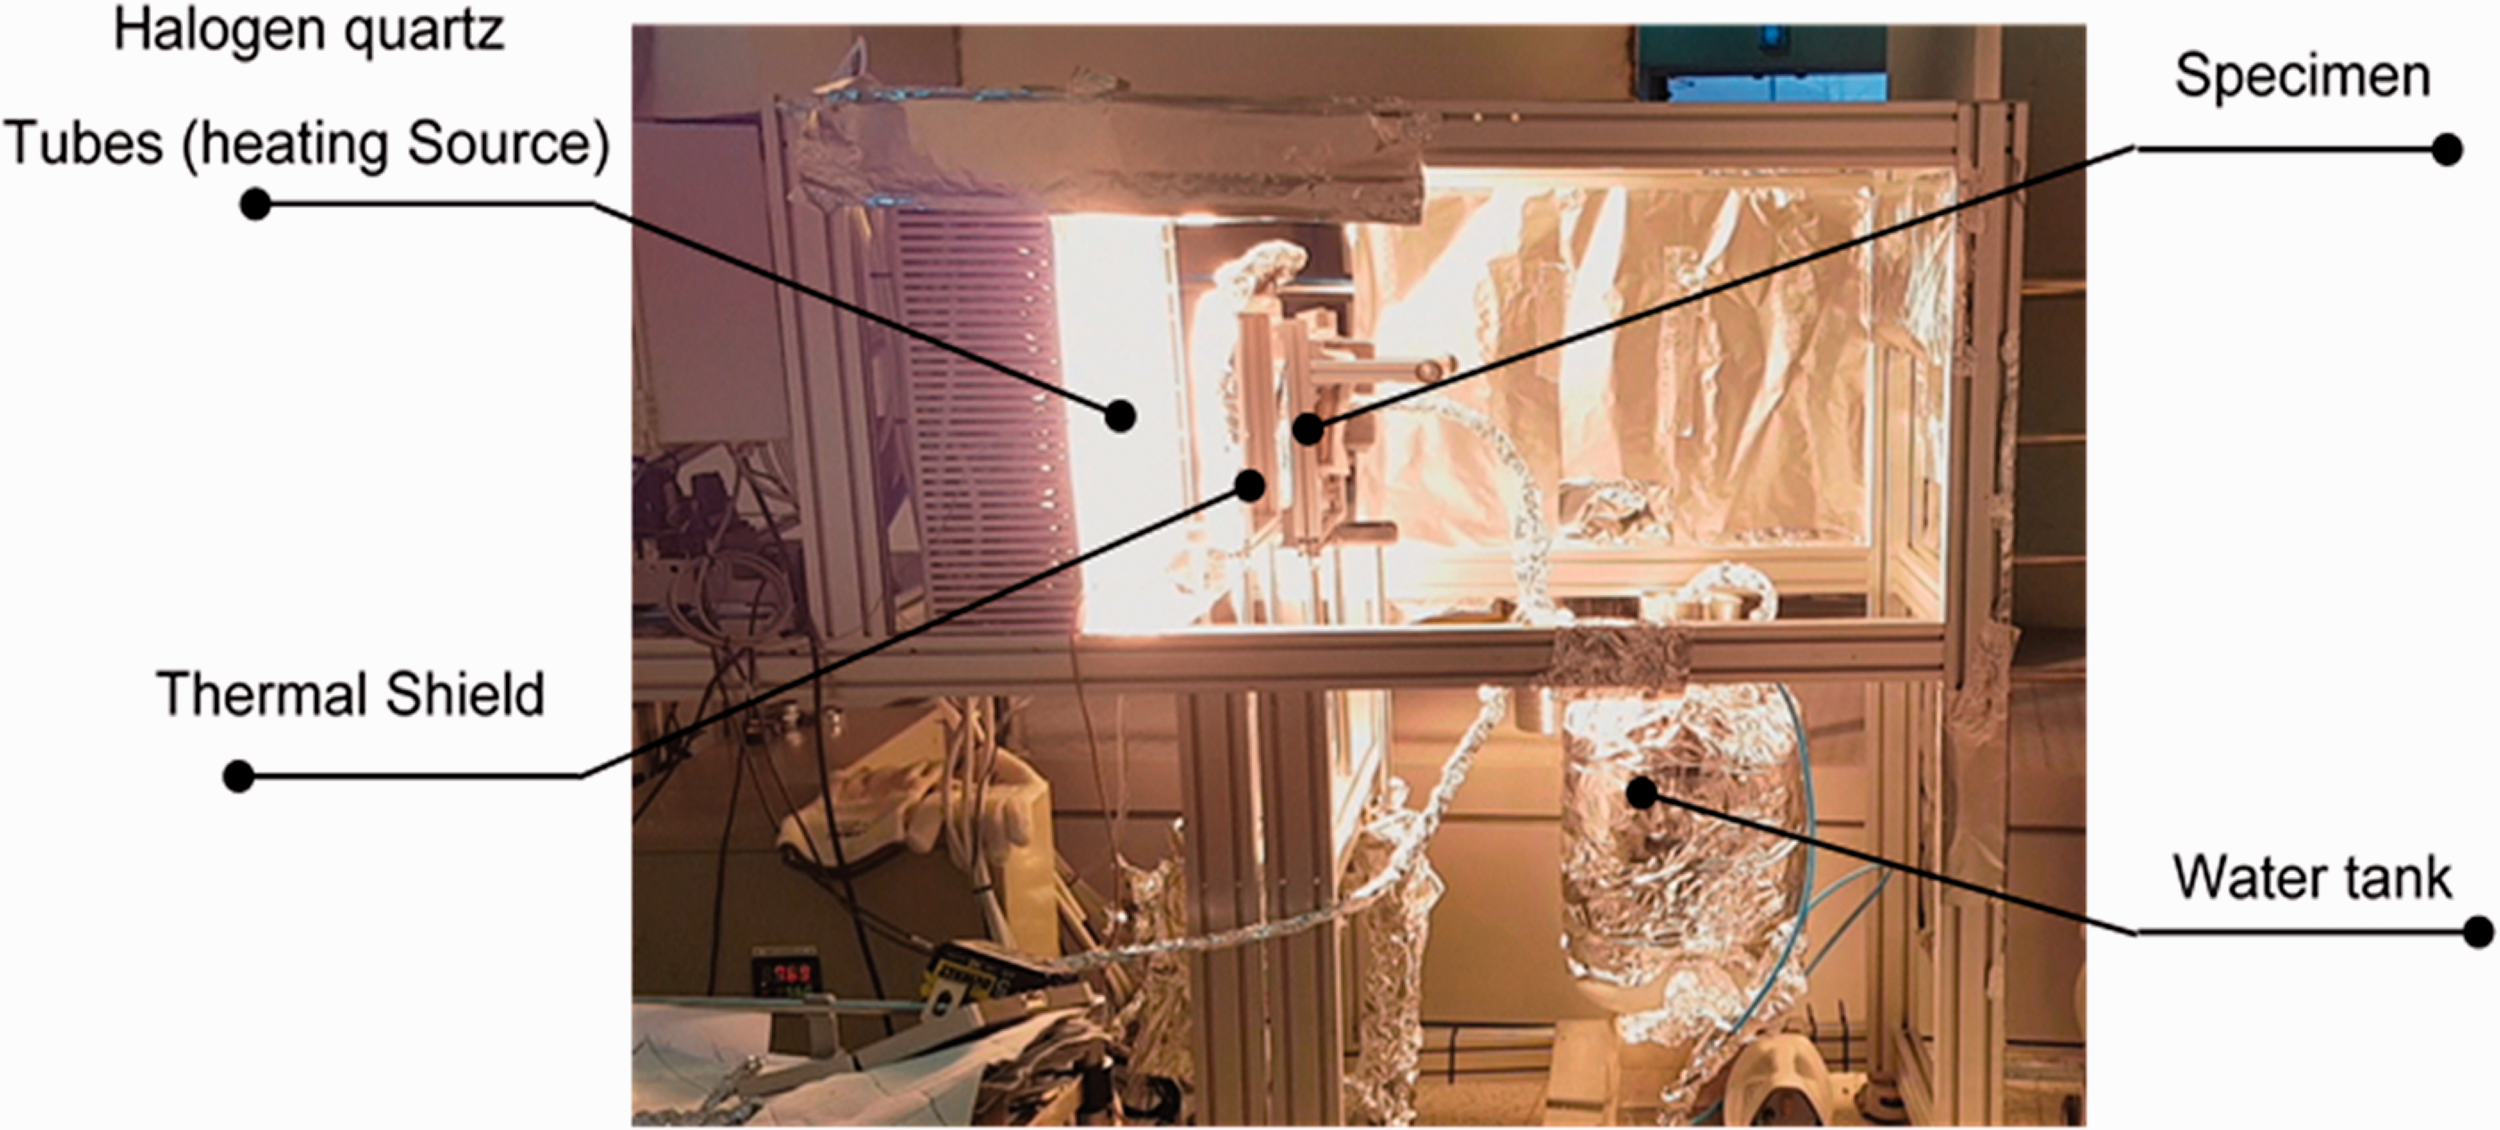
Developed test apparatus. 18
Experimental set-up.
Test material and configuration
A commercially available thermal protective suit for firefighters was purchased from the market. It is manufactured by Moda Unique Co. Ltd. and is approved by the Korea Fire Institute (KFI), which is the only certification authority for fire-related equipment in South Korea. The thermal protective suit consists of three fabric layers:
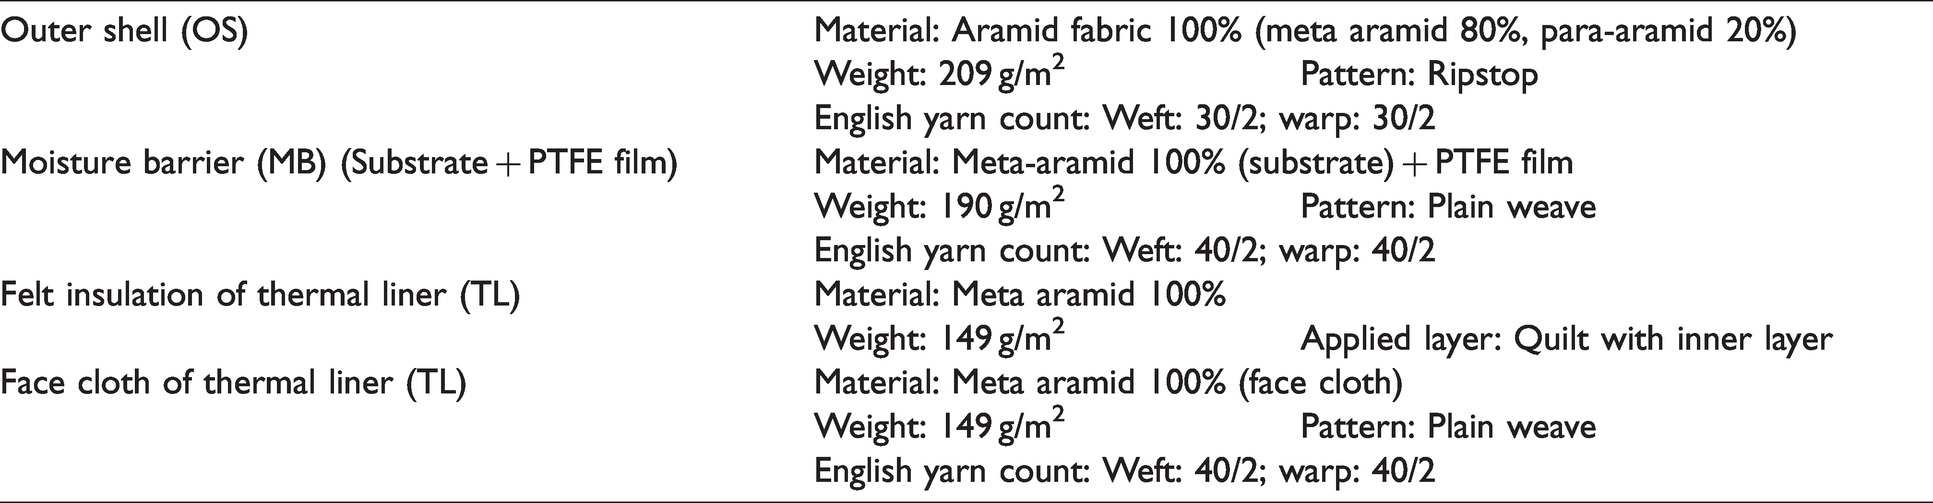
an outer shell (OS), facing the heat source; a moisture barrier (MB), middle layer; a thermal liner (TL), innermost layer.
The fabric specimens were arranged as shown in Figure 3. The air gap between fabric layers and TL skin cavity has been reported in the range of 2–24 mm for stationary standing individuals,27,28 in which a different range of 0–73 mm incorporating all postures was suggested by Li and colleagues. 29 Therefore, a 2 mm spacing was ensured between the fabric layers and a cavity of 6.5 mm between TL and the base plate. These air gaps are an average representation of their respective domain. The material characteristics of selected fabrics are listed in Table 1.
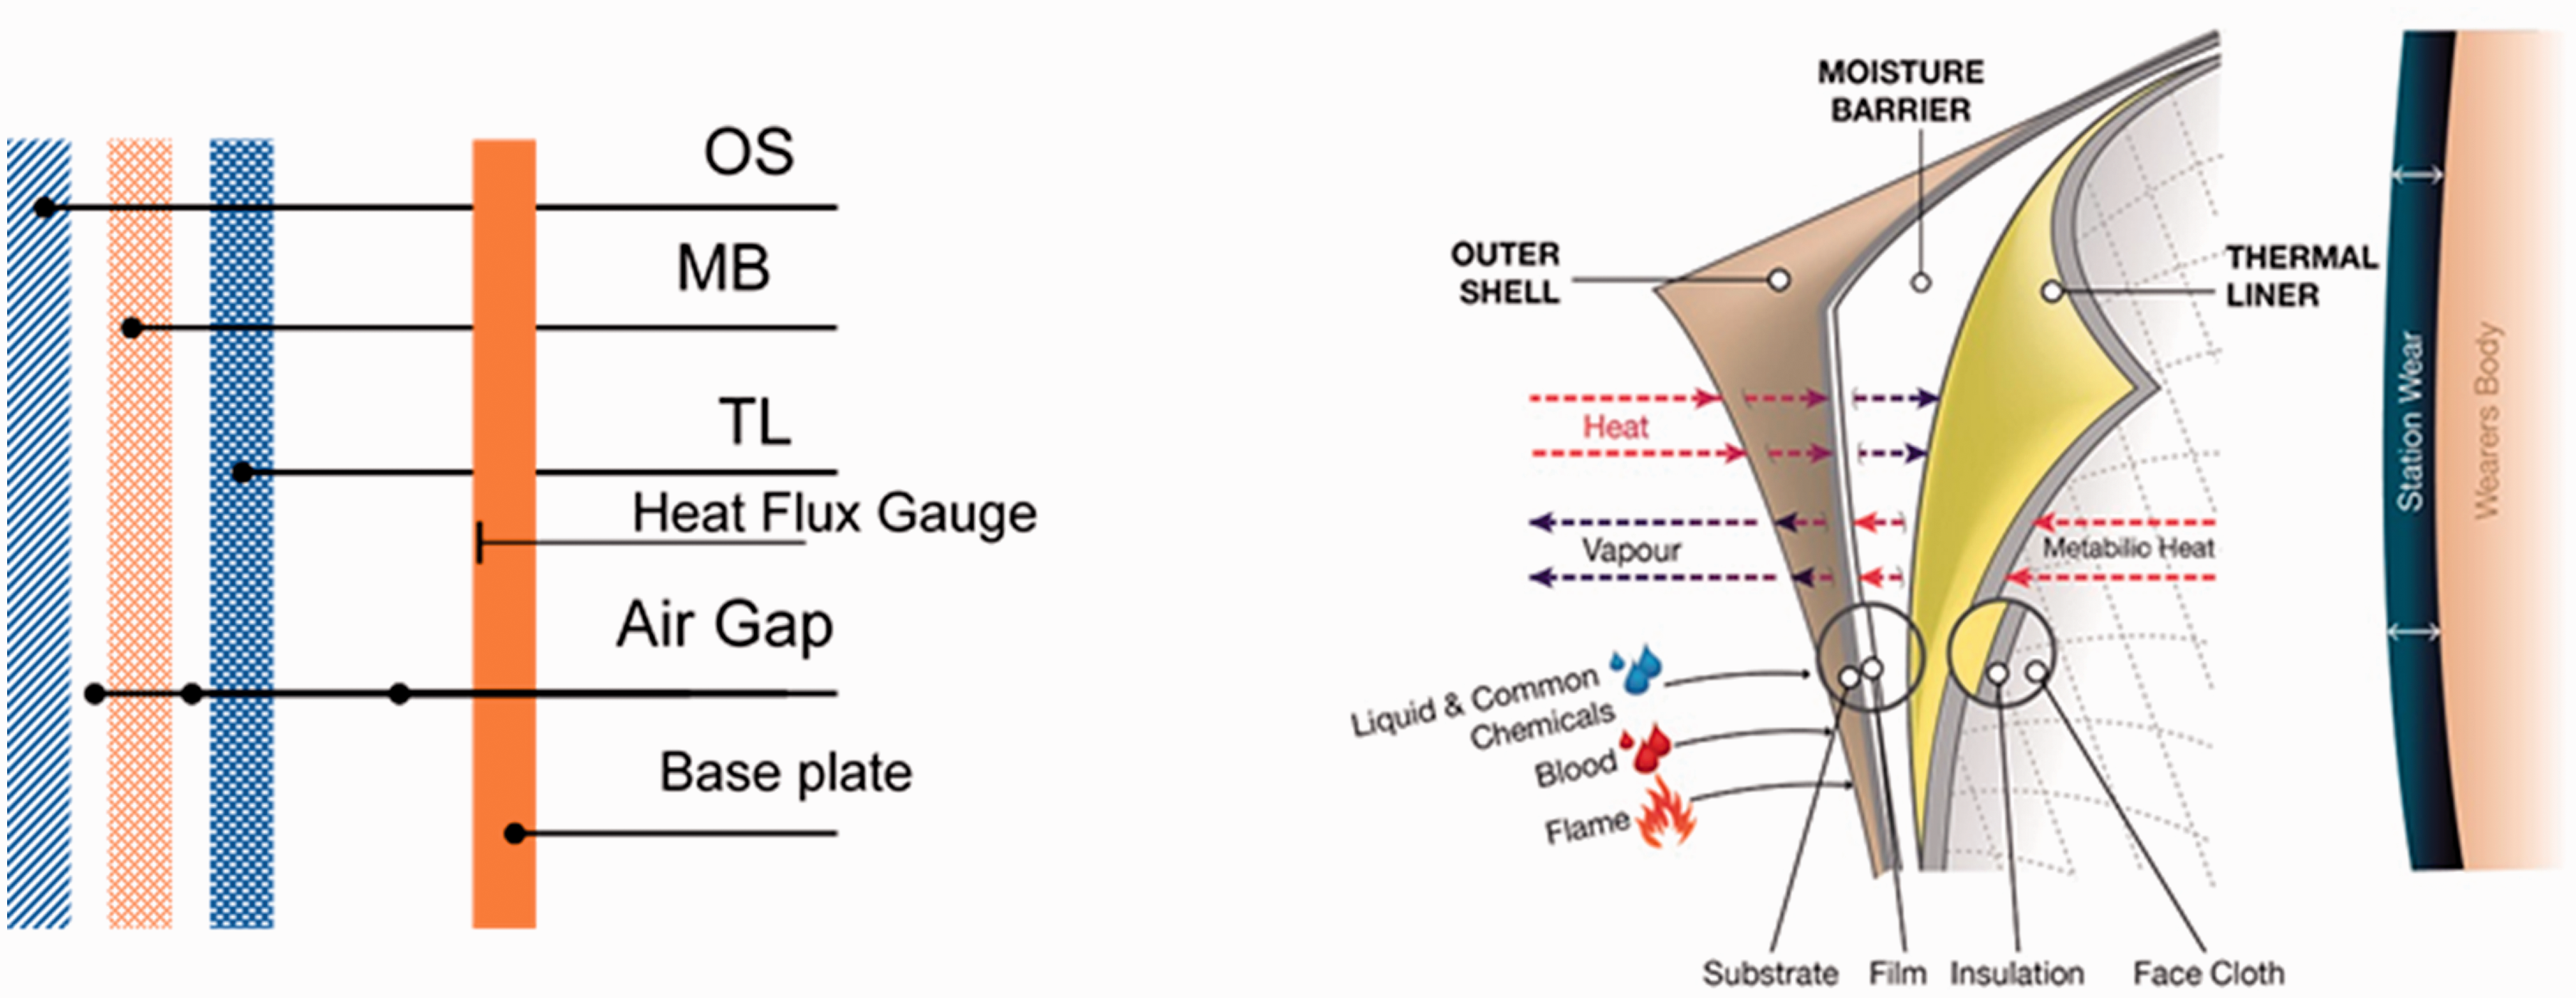
Test assembly (left) and fabric characteristic purpose (right).
Flame-retardant fabric characteristics
Apparatus verification
The apparatus was developed out of standards, in a vertical orientation, to depict the standing position of firefighters in action. Therefore, the experimental output of it is first verified with the experimental data published by the NIST.17,30,31 Two types of configurations were designed to verify the experimental output:
a 1 mm air gap between the fabric layers (Figure 4);
30
Thermal liner, back surface temperature at 2.5 kW/m2 heat flux for heating time of 300 seconds and 1 mm air gap between the fabric layers. no air gap between the fabric layers (Figure 5).17,31
Thermal liner, back surface temperature at 2.5 kW/m2 heat flux for heating time of 600 seconds and no air gap.
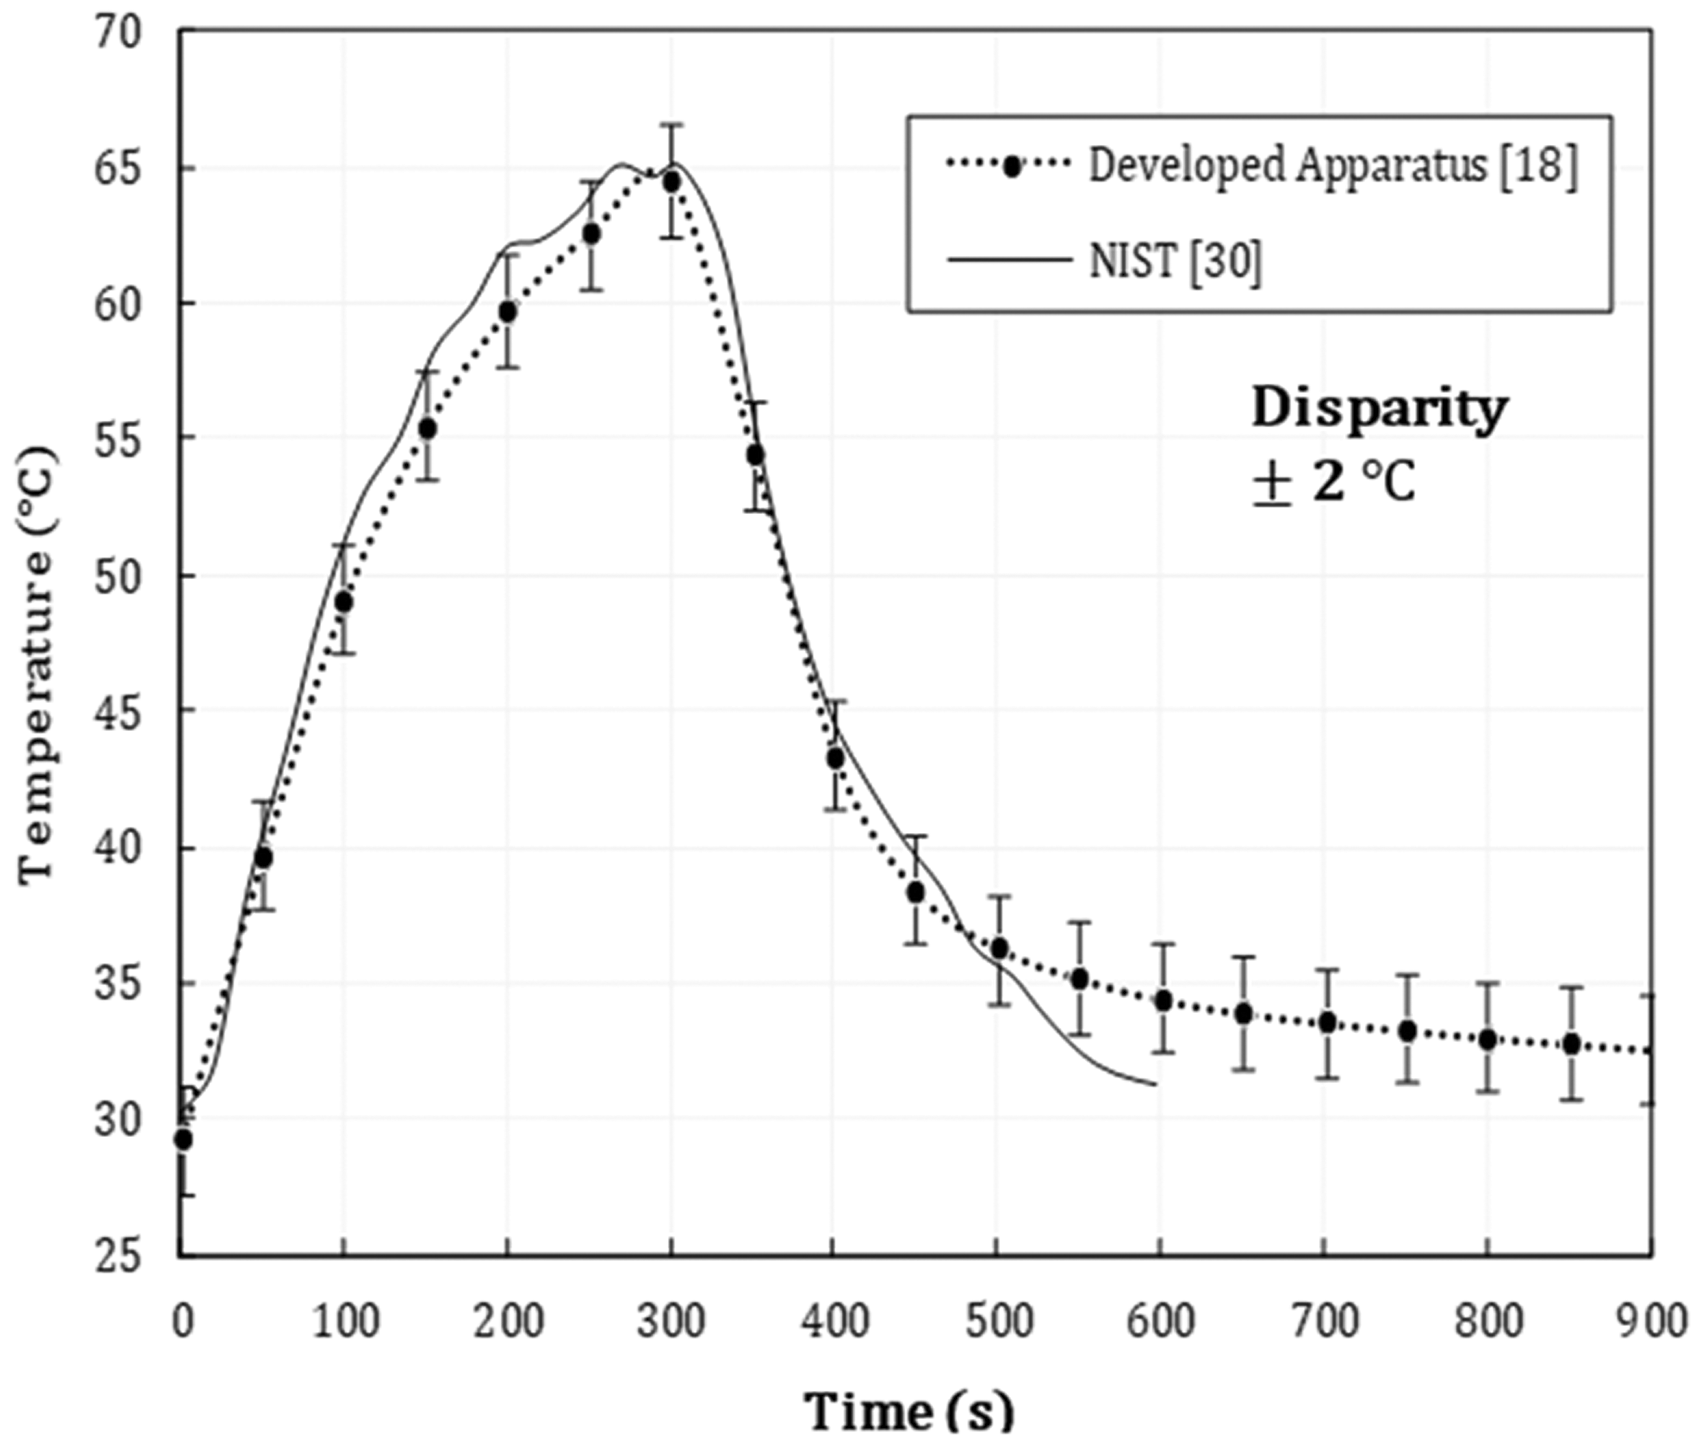
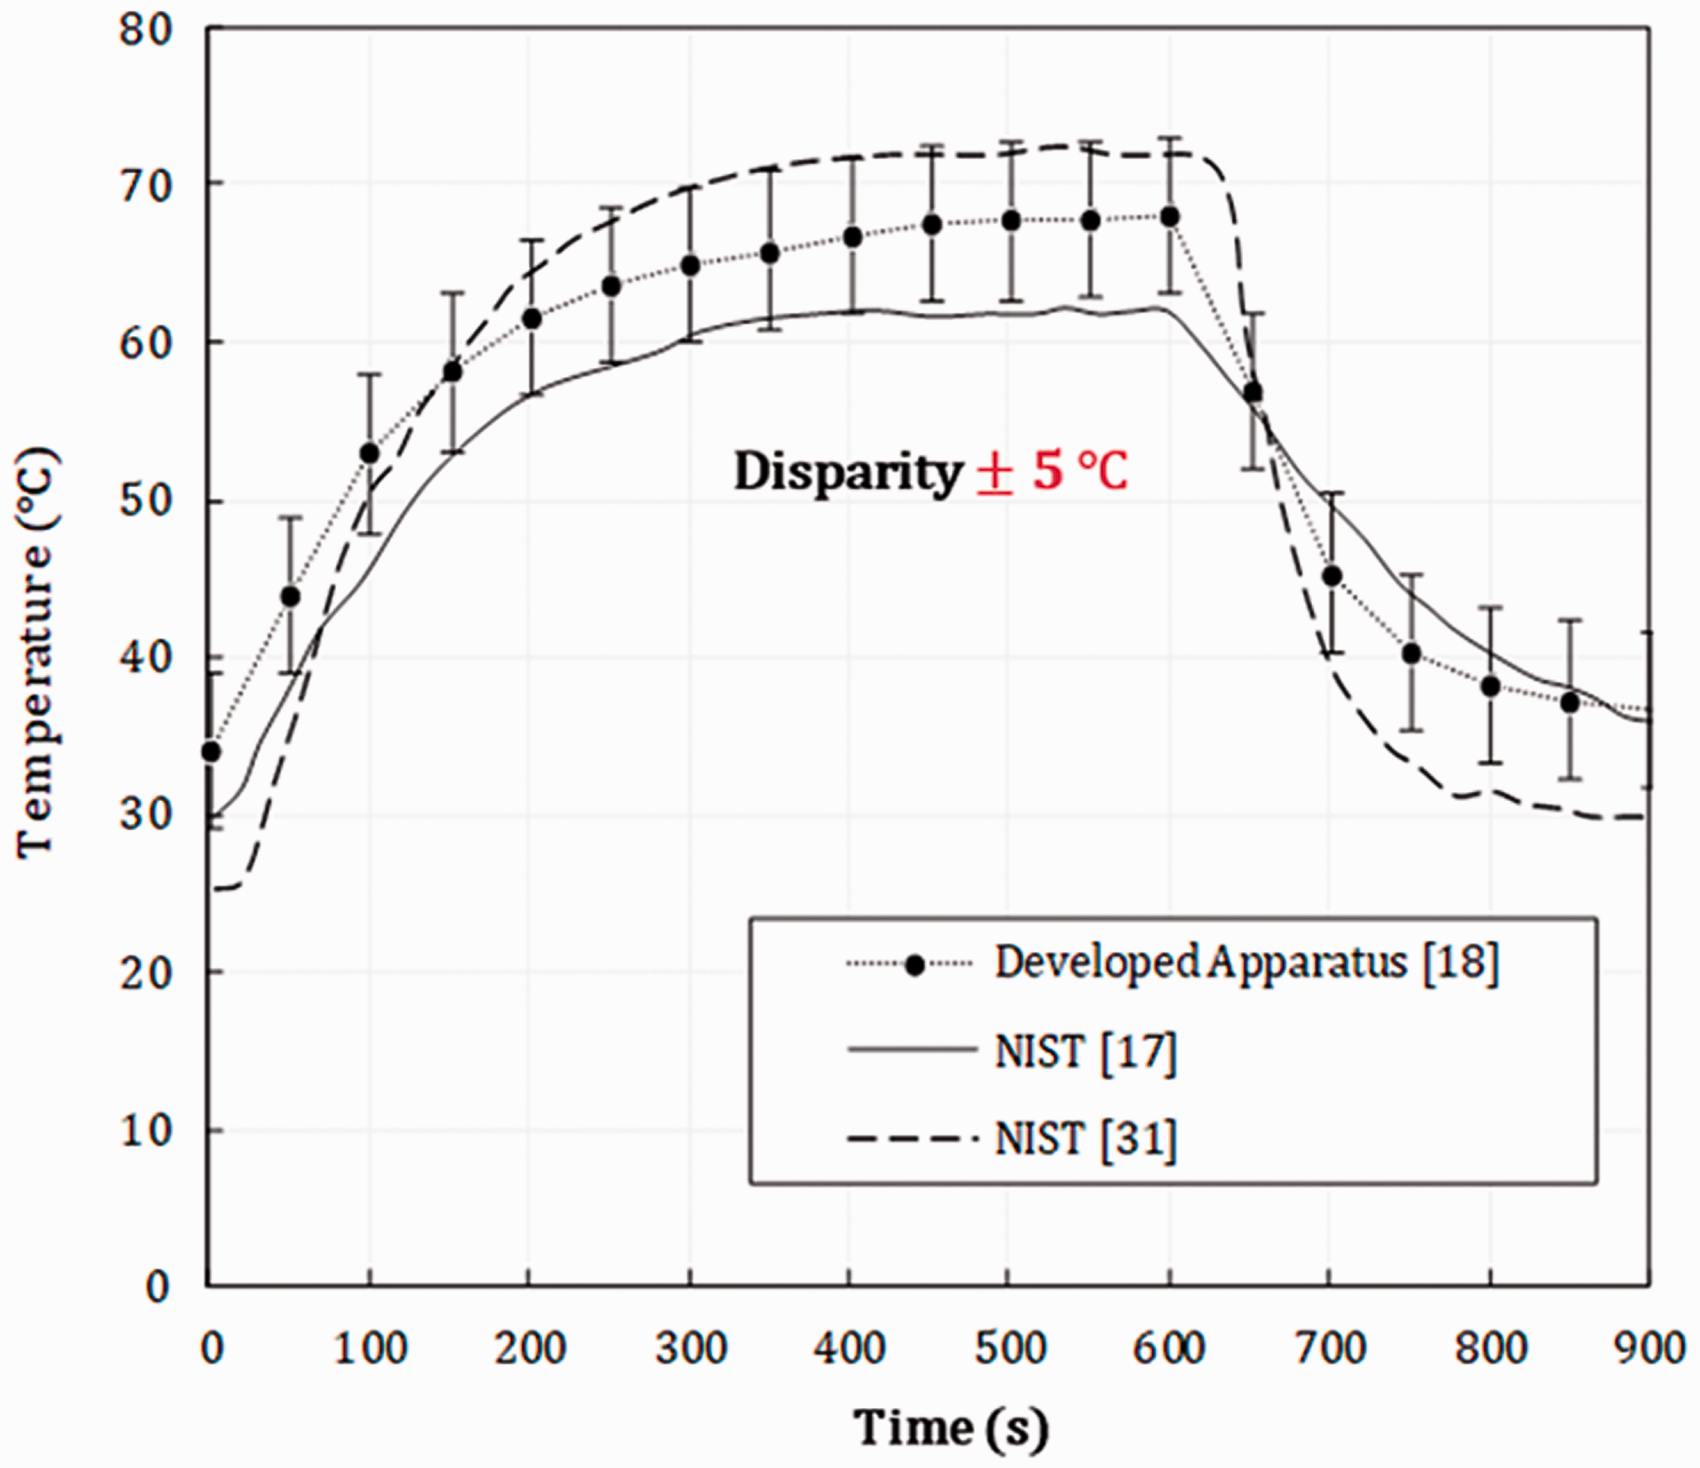
An air gap of 6.5 mm was maintained between the TL and the base plate for both configurations. Temperature data are compared against studies published for the constant incident heat flux of 2.5 kW/m2 for 300 seconds 30 and for 600 seconds.17,31 Low heat flux was selected for a verification study to minimize the influence of pyrolysis and char on the output values. The temporal values presented in Figures 4 and 5 are an average of 12 individual temperature readings taken by three repeated experiments for 300 and 600 seconds of exposure, respectively. This ensures the repeatability of the apparatus with complete certainty under prolonged exposure.
The time–temperature curve behavior is within an agreement of ±2°C for 300 seconds and ±5°C for 600 seconds exposure, evident from Figures 4 and 5. As per ISO 6942:2002, this spread can be linked to different materials used and their reaction to tests for current and comparison studies. 14 Hence, this verified the developed apparatus. In both cases, the time–temperature curve took longer to revert to the ambient temperature indicating energy storage. It is due to implemented closed-back configuration in the developed apparatus. This close-back configuration is analogous to the practical configuration present between the furthermost fabric layer and the skin. No heat can escape from the back, and all the energy would be bi-directional, that is, escaping to the environment from the outer shell and directed towards the skin simultaneously, even after the heat source is removed.
Experimental methodology
ISO 6942 describes two methods for the assessment of protective garments.
14
Method A is based on visual assessment under radiant heat, whereas method B evaluates the protective performance of the materials under test using the radiant heat transfer index (RHTI). In the establishment of critical time tct: (a) the protective performance of fabric can be ignored as material thermal degradation is needed in exposed conditions to obtain maximum exposure time; and (b) visual assessment is needed to observe any physical transformation. Based on these criteria, method A is selected. The critical time was established by video graphic evidence for visual assessment. The tested assembly is exposed to three levels of heat flux as:
medium: 41 ± 2 kW/m2; extreme: 84 ± 2 kW/m2; severe: 126 ± 2 kW/m2.
The copper disks were in contact with the thermal liner, and a heat flux gauge was attached at the centre of the base plate depicting the skin level. Spacers were placed between fabric layers to ensure a 2 mm and 6.5 mm air gap. The tension of 2N was applied to ensure a proper air gap. The apparatus was covered from the sides to reduce air currents, ensuring a suitable environment for natural convection. The test assembly was then placed on the holder as shown in Figure 2. An automatic data logger was used to control shutter openings and data recording. Specimens were prepared at an average room temperature of 30°C and at a relative humidity of 65% as per the NFPA 1971 recommendation. 12
To estimate the maximum exposure time, ASTM F2703-08(2013) recommends the application of Stoll’s curve. It dictates that first the specimen should be exposed to a trial exposure time. If the measured sensor response did not predict a second-degree burn, that is, the experimental curve did not intersect the Stoll’s curve, a new exposure time greater than the previous exposure time should be selected and repeat the experiment. If the second-degree burn curve moves past the Stoll’s curve, the exposure time is then halved from the previous attempt. Consequently, a successive halving should be employed until an exposure time is determined that can cause a second-degree burn. This iterative process is substituted by the application of failure time in conjunction with the visual assessment technique described by ISO 6942. Therefore, adapting critical time and failure time in existing test standards will aid in the assessment of the garment by giving a definitive exposure time.
Experimental results
The specimens exposed to 41, 84 and 126 kW/m2 were configured as outlined in the subsection ‘Test material and configuration’. The experiments were repeated three times under similar conditions. Irradiance at skin level was recorded using a heat flux gauge, located at the intersection of diagonals of the fabric specimens, and the average value of the three experiments is plotted against time in Figure 6. The vertical dashed-dotted lines are phases during the experiment. They mark the starting phase of exposure, failure time tf – at which thermal degradation is noticed, and exposure end time. As it is impossible to ascertain visually any physical change in MB and TL, the OS is treated as a benchmark for visual assessment. The air gap of 2 mm is symbolized with 2A + 2A. Each level of exposed heat flux follows the same trend.
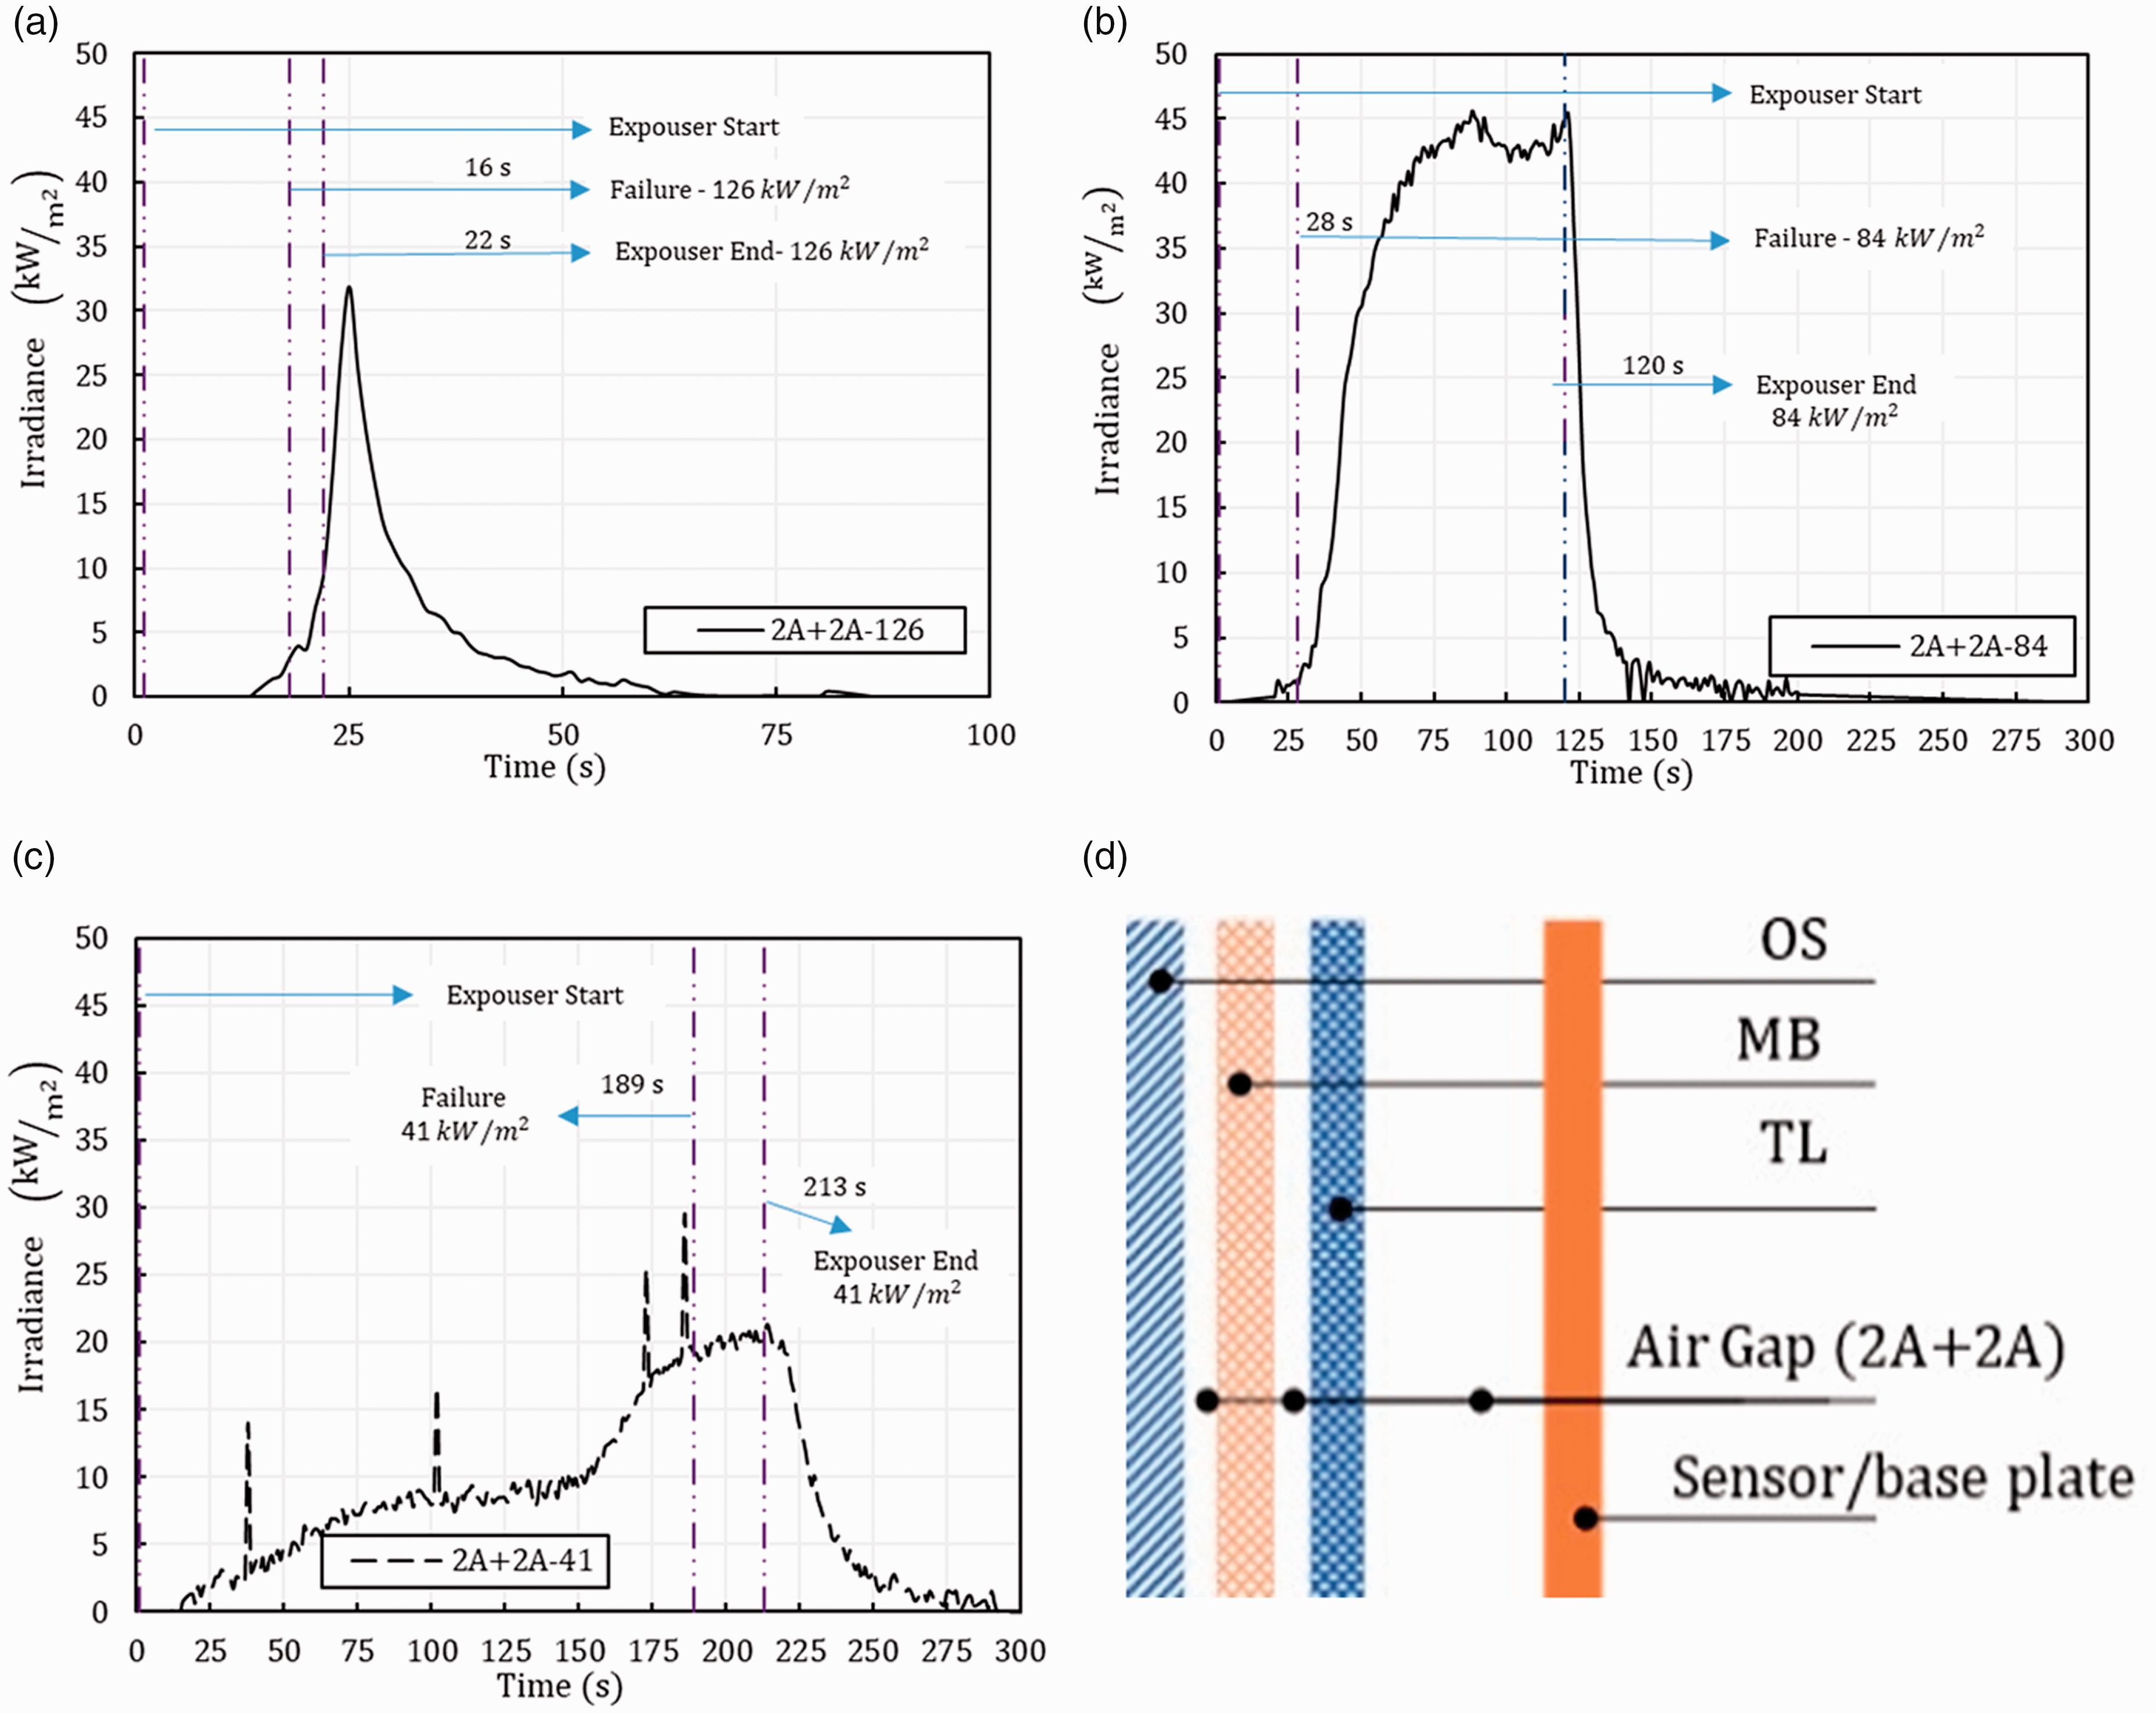
Irradiance observed at three exposure levels. (a) at an incident flux of 126 kW/m2, (b) at an Incident flux of 84 kW/m2,(c) at an incident flux of 41kW/m2 and (d) test configuration.
In Figure 6 the transmitted flux at skin level is plotted against time. An unexpected increase in transmitted flux can be observed after a tear in the OS originates due to thermal degradation, resulting in a peak heat flux of ≈30 kW/m2 at skin level. Under Stoll’s criteria, the second-degree burn would occur in 2 seconds at this intensity, which correlates with the tolerance time for extreme conditions. 15 From experimental data in Figure 6, at the exposure level of 84 kW/m2, after failure time tf it takes ≈58 seconds for heat flux at skin level to reach a plateau of 45 kW/m2 and at 126 kW/m2, ≈9 seconds to reach a peak value of 30 kW/m2. A rapid exchange of thermal energy to skin occurs after thermal degradation of the OS begins. For this reason for 126 kW/m2 the shutter was closed instantly after a tear was noticed in the OS but for 84 and 41 kW/m2 exposure continued until it reached a steady state.
The failure time tf, in Figure 6, signifies the failure of OS due to tear or rip. A critical time tct is derived from it. It is a time just before OS failure is witnessed, projected in Table 2. The visual difference in them is compared in Figure 7. The bright orange colour of smoke is due to radiative reflection, it is not fire. The estimated critical time for 41, 84 and 126 kW/m2 is 180, 25 and 15 seconds, respectively. It is important to point out that tct should not be confused with the TPP index or tmax from ASTM F2703, which represent the time to second-degree burn level only. 21 The difference between these two can be understood as minima and maxima. The TPP index or tmax in ASTM F2703 represent the minimum performance level of the protective garment in terms of skin burns. A tct is proposed to signify the maximum protection under low to extreme conditions in terms of the fabric degradation, under a continuous exposure before any physical change is visible. In practical terms, tct will aid in understanding:
Derived critical time tct, from failure time tf
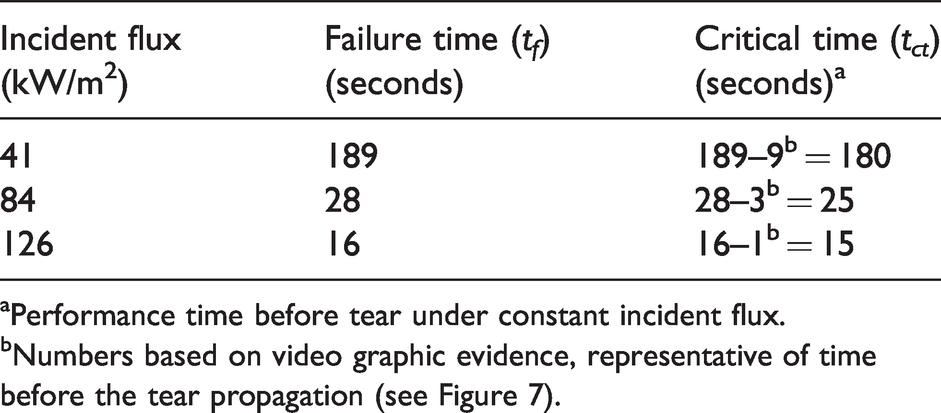
aPerformance time before tear under constant incident flux.
bNumbers based on video graphic evidence, representative of time before the tear propagation (see Figure 7).
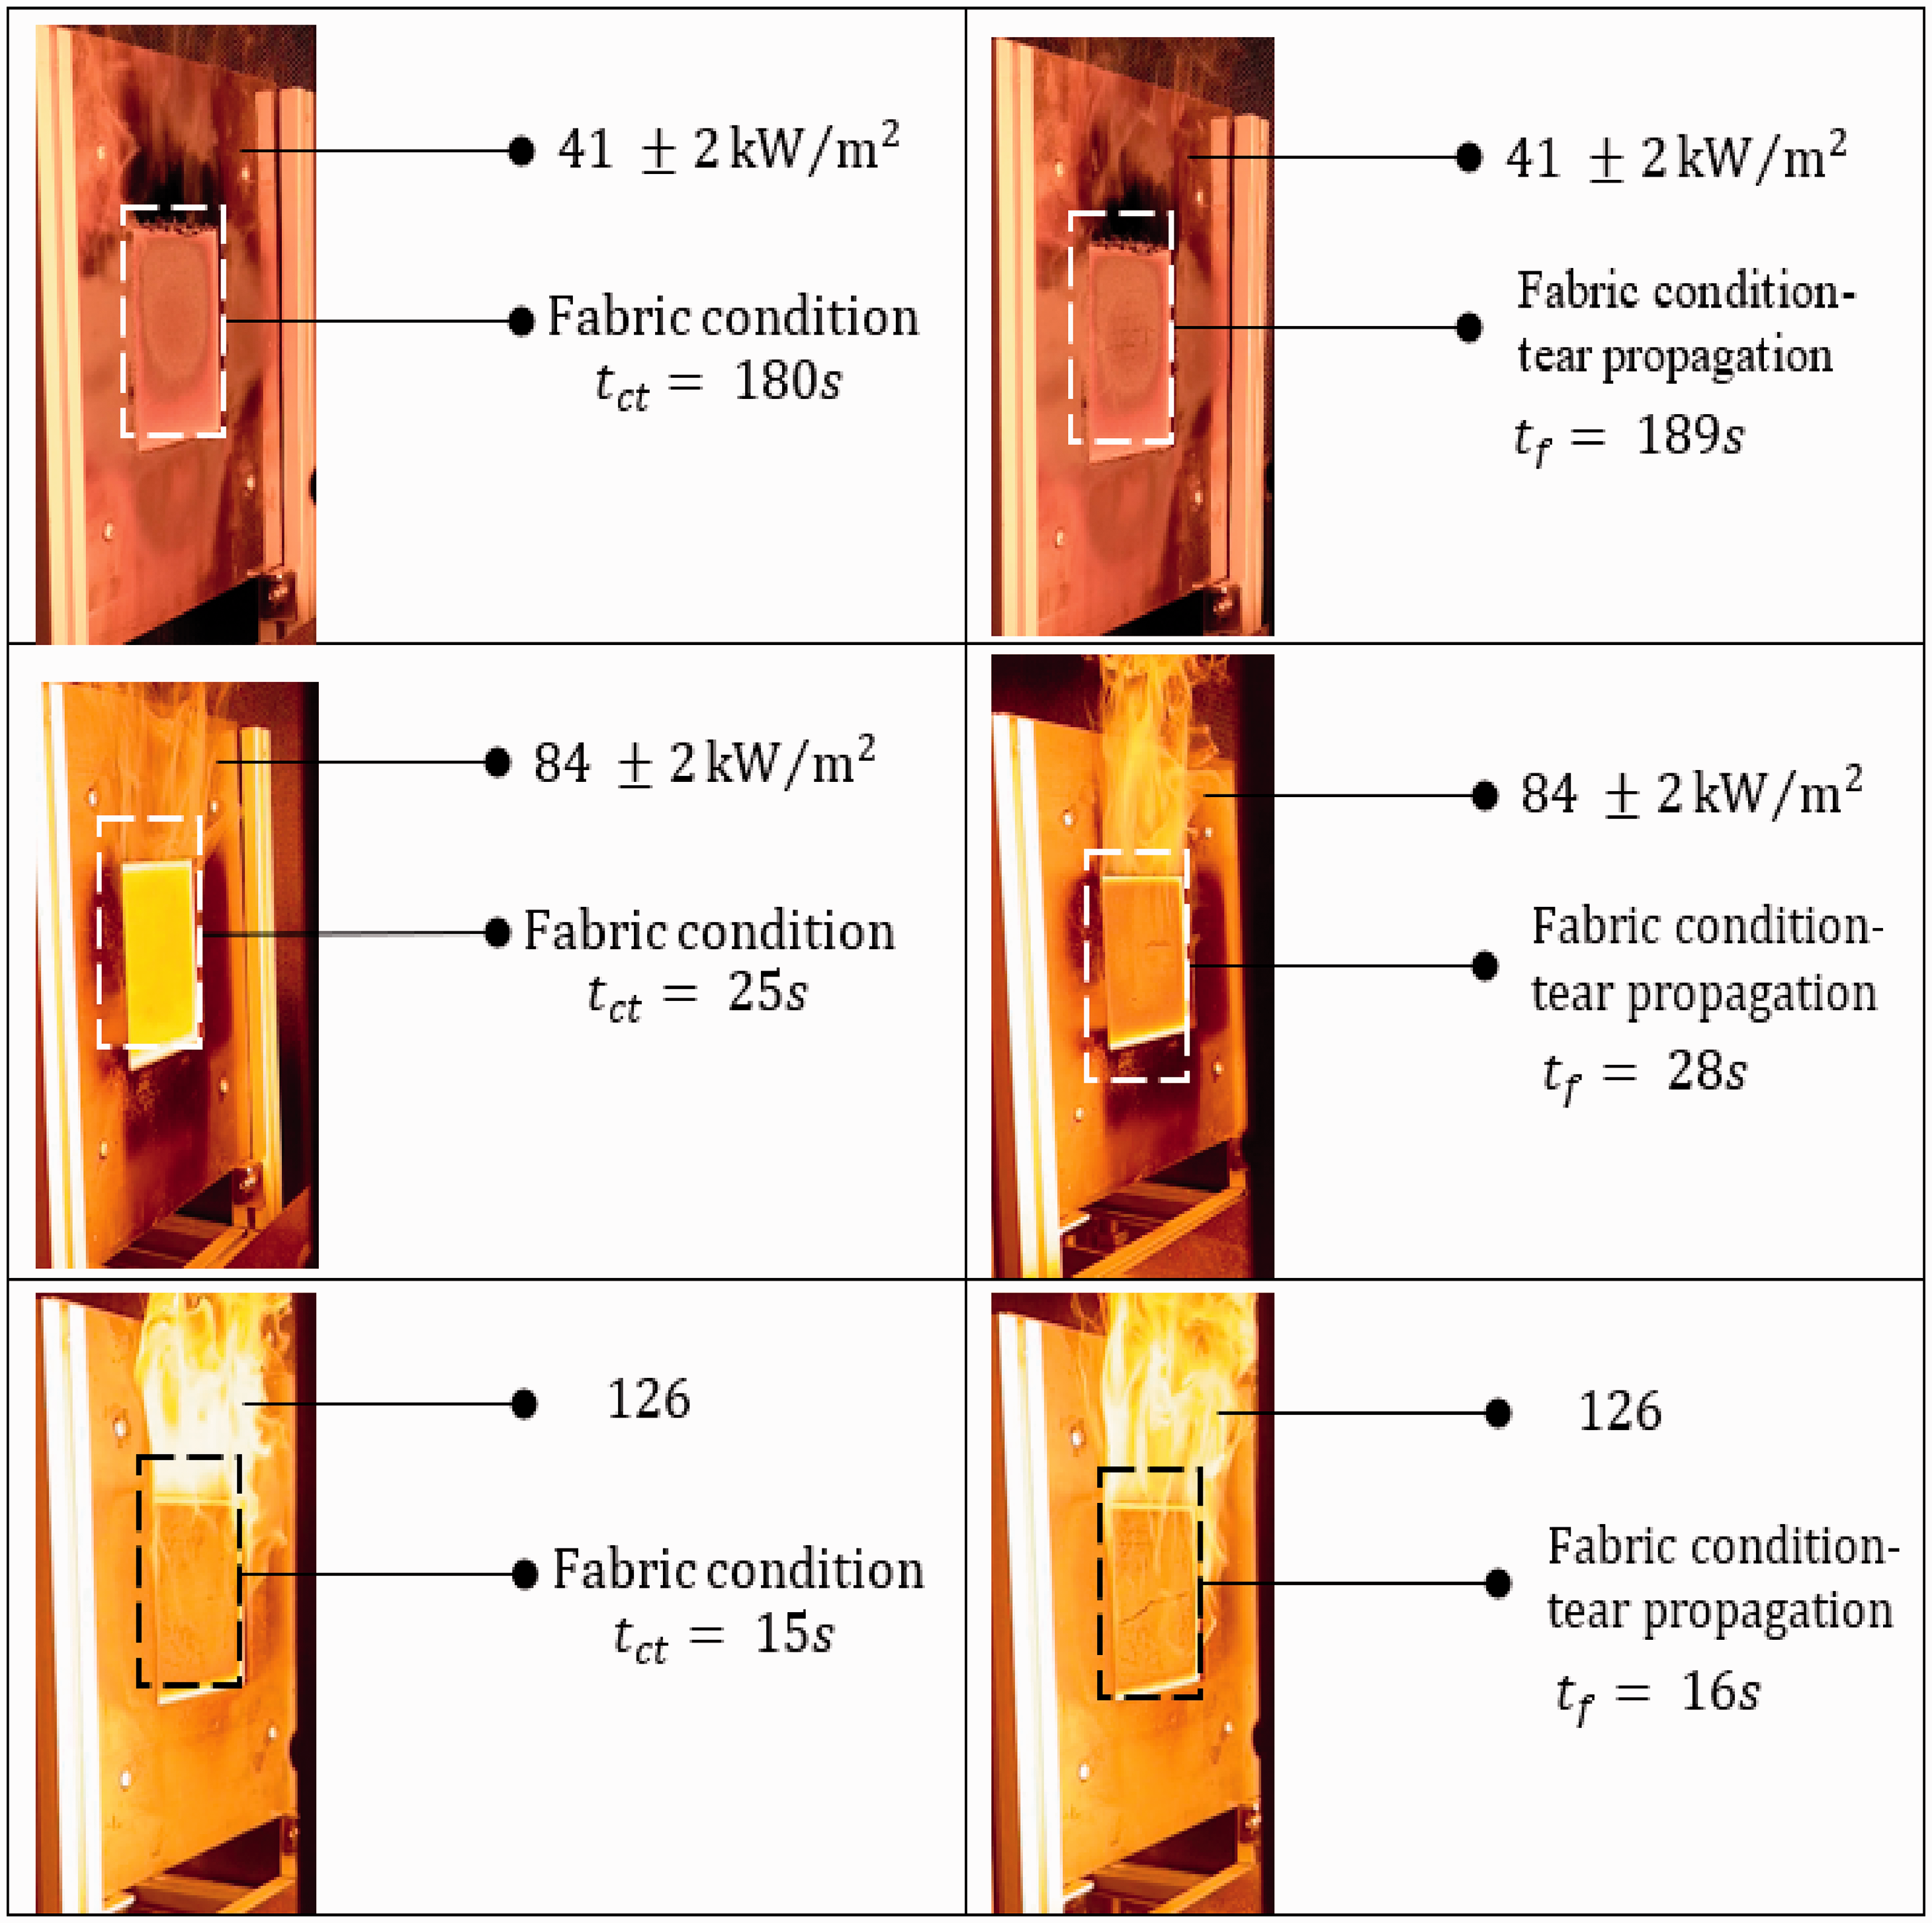
Fabric condition at a critical time tct (left side) and failure time tf (right side).
escape time a firefighter would have under altering fire conditions, that is, backdraft;
the maximum amount of thermal energy stored and its effect on heat dissipation;
assist in improving fabric performance in extreme conditions.
For a fabric assembly under consideration with an optimal air gap of 2 mm in between fabric layers and 6.5 mm spacing between the innermost layer and skin, it is shown that for an increase in heat flux from 41 to 84 kW/m2, the fabric physical integrity is decreased by approximately four times. In an increase from 84 to 126 kW/m2, the integrity reduces by almost a quarter. A tct dependence on incident heat flux is found to be nonlinear for a range of 41 to 126 kW/m2, as shown in Figure 8. Caution should be exercised when extrapolating results from this, as experiments were conducted at three levels of heat flux at 41, 84 and 126 kW/m2. However, exact behavior is uncertain for materials and heat flux densities out of the scope of this research.
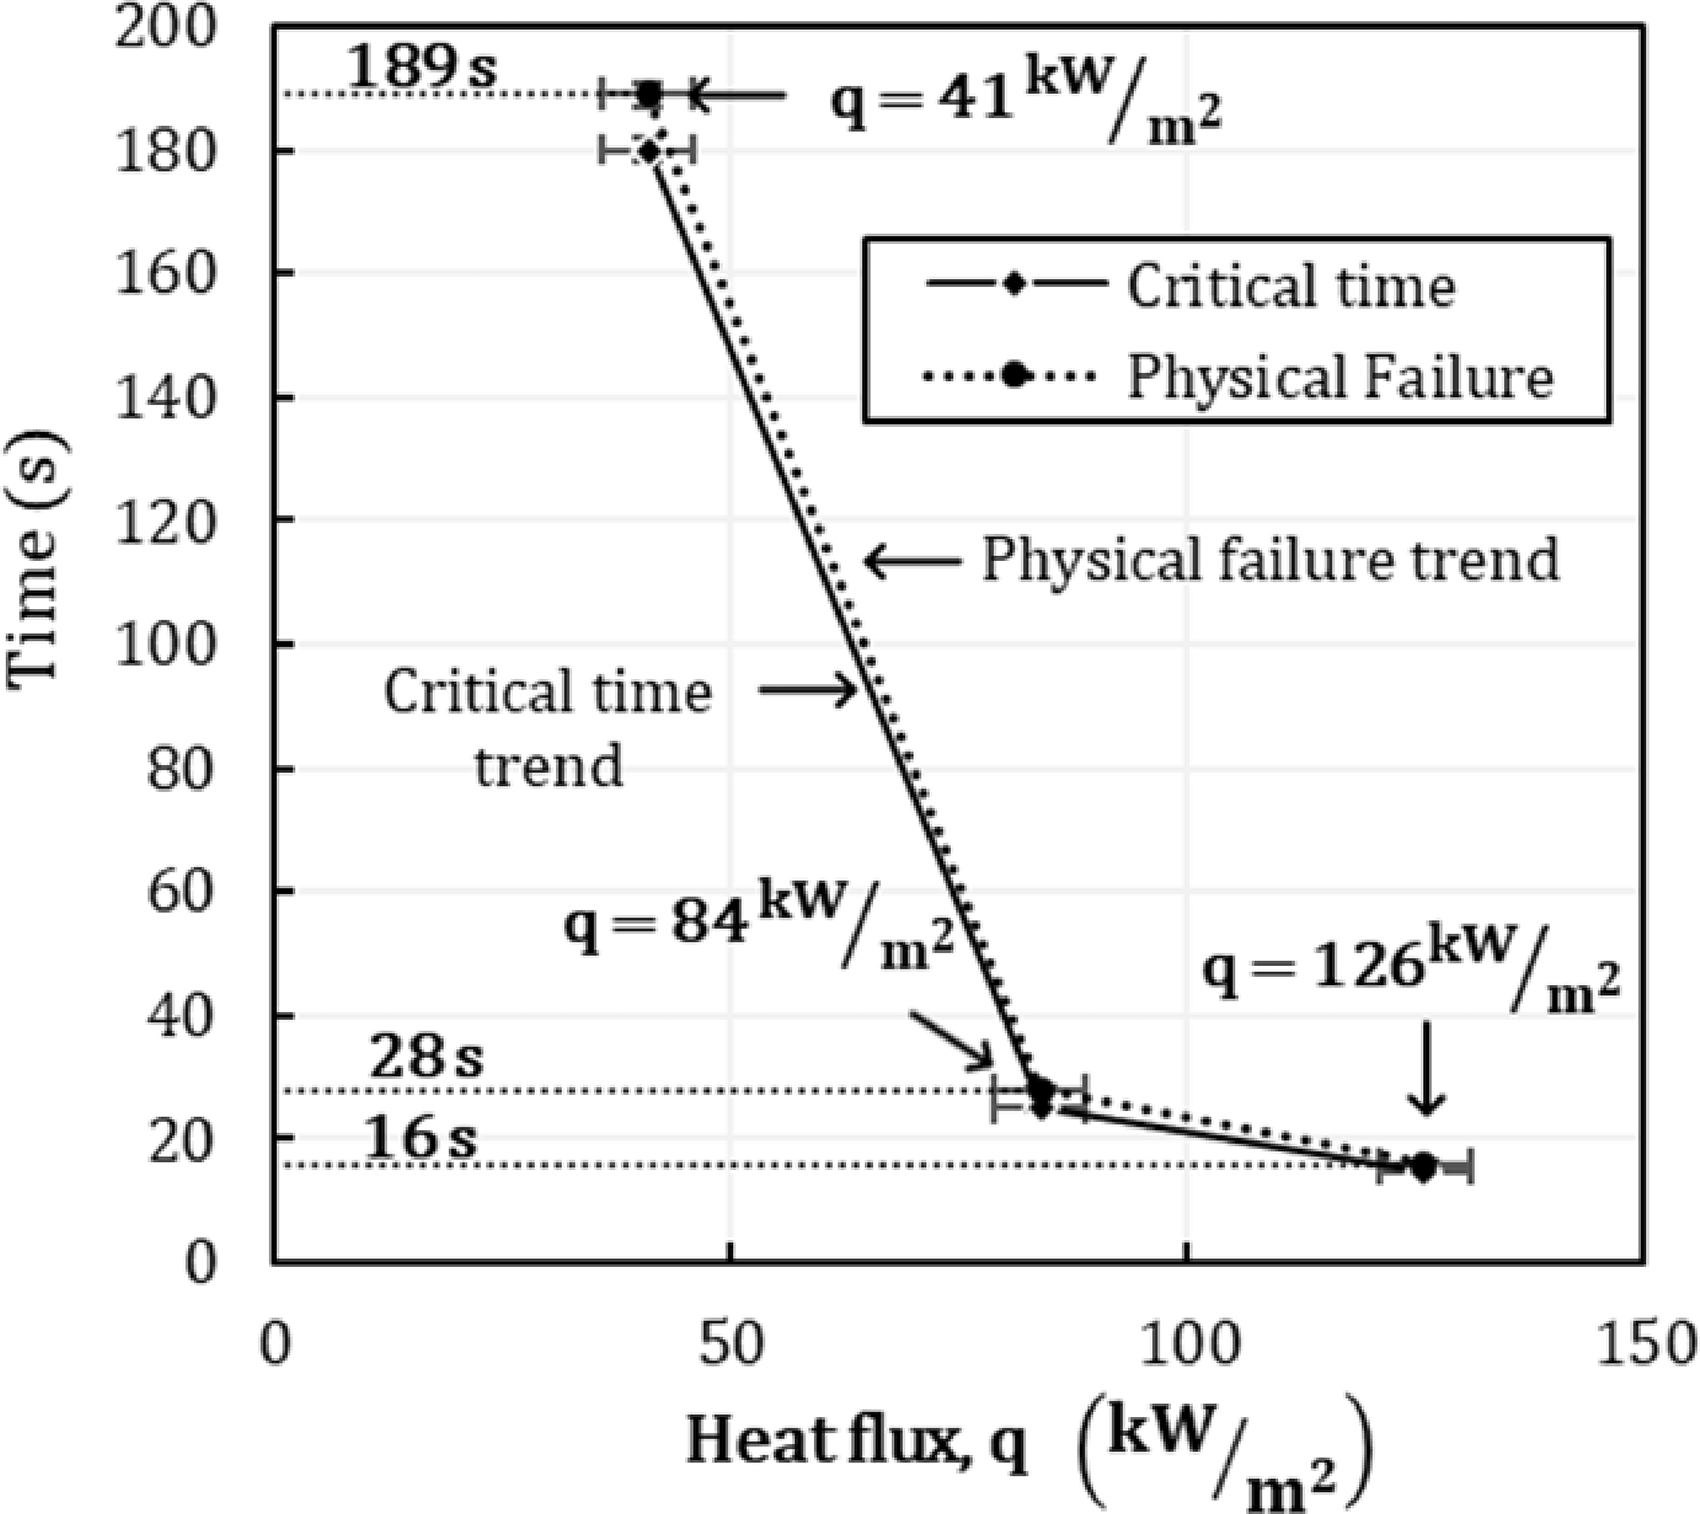
Critical time tct and failure time tf in relation to the cumulative incident flux.
The critical time in the current study is established as a limiting parameter, at which under radiant flux the fabric retains its shape, a visual aid for firefighters. Adapted from the concept of ASTM F2703, in which Stoll’s curve was proposed as a limiting parameter. It is seen from the studies that the time gap between failure time and critical is dependent on incident flux; the higher the incident flux the less the difference. As evident from Figure 8, tct and tf exhibit an identical trend in close approximation. Furthermore, the failure time is highly dependent on tear propagation, as such it is the basis of visual assessment. The figures presented in this study are of fabric assembly under a 2N tension. It is a recommended tension by the ISO 6942 method A, for bench-scale experiments. The exact behavior is uncertain for materials under different tensions such as in thermal manikin tests.
These results imply that the failure of a new/used protective garment during duty under changing environments would result in a second-degree burn instantly at a high thermal flux of 84 and 126 kW/m2. Knowledge of tct, tf and its relation to fire severity established under this study can help in the mitigation of burn injuries due to unforeseen circumstances. Furthermore, skin burn injuries are evaluated by utilizing critical time, demonstrating the significance of this methodology on reducing iterative experimental practice.
Discussion
Existing experiments and numerical studies have relied on a horizontally configured test apparatus.32 –34 Udayraj and Wang (2018) have shown that for a single layer fabric transmitted flux on the skin is dependent on garment orientation. 35 This theory is expanded for the multilayered assembly. A specimen heated from below in a horizontal configuration would transmit more thermal energy due to rising convection currents of smoke, partially penetrating the outermost fabric layer. Thus additional heat enters the system. In contrast, natural convection currents would skim from the outermost layer in a vertical orientation as shown in Figure 7, resulting in heat loss to the environment. The latter is the practical depiction of thermal interaction of a firefighter. Hence, a supplementary analysis is conducted to study the effect of vertical orientation tests on skin burn injuries with the application of critical time.
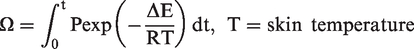
The skin burn injuries are quantified by empirical relations developed by Henrique and colleagues36,37 or by utilizing a simple approach based on skin temporal experimental data established by Stoll and colleagues38,39 These relations have been refined in a laboratory set-up, although in real-life situations they may not always be valid.40,41 The reason being, thermal characteristics of human skin vary widely from individual to individual based on age, body size and skin condition, resulting in a conflicting time to burn injuries. However, favorable results have been documented towards the application of Henrique’s integral, in terms of more accurate burn predictions for the incident heat flux range not experimentally documented by Stoll and colleagues.
42
Therefore, Henrique’s relation as per equation (1) is applied for skin burn classification. The values of physical constants (ΔE/R, P) are taken from Weaver and Stoll.2,43


A commercially available finite element software ABAQUS®Standard is used to predict skin temperature. A skin thermal model developed and simplified by Torvi based on Penne’s bioheat equation, as per equation (2), is adopted to predict skin temperature histories.44,45 Torvi rigorously tested this model and found that profusion term,
The adopted bioheat equation is:

An initial exposure time of 10 seconds is selected based on the recommended exposure time for manikin tests, between 3 and 12 seconds. 16 The fabric assembly is first exposed to an incident flux of 84 kW/m2 for 10, 20 and 25 seconds. Skin temperature and heat flux histories for 84 kW/m2 are presented in Figure 9 and associated thermally degraded fabrics are shown in Figure 11. The arrows in Figure 9 represent the curve association with the vertical axis. Heat flux at 10 seconds of exposure reaches a peak value of ≅1 kW/m2. At 20 seconds it is 3 kW/m2 and at critical time tct (25 seconds) it is 6.8 kW/m2. This critical time was estimated previously and is summarised in Table 2. Here it is applied to eliminate the extensive iterative process, consequently making it easier to approximate exposure time in successive experiments. As a result an upper and lower bond is established clearly compared to current practices of exposure time estimation. 21 Using equation (1), a second-degree burn is predicted after 36 seconds for an exposure time of 25 seconds, when Ω≅1. Sumit and colleagues have characterized the fabric performance for multilayer garments in a horizontal orientation and predicted a second-degree burn time of 20.6 seconds for a flame exposure of 84 kW/m2 and 28.7 seconds for a radiant exposure of 50 kW/m2 using the same burn criteria. 46 They used a variable exposure time until the second-degree burn was observed.
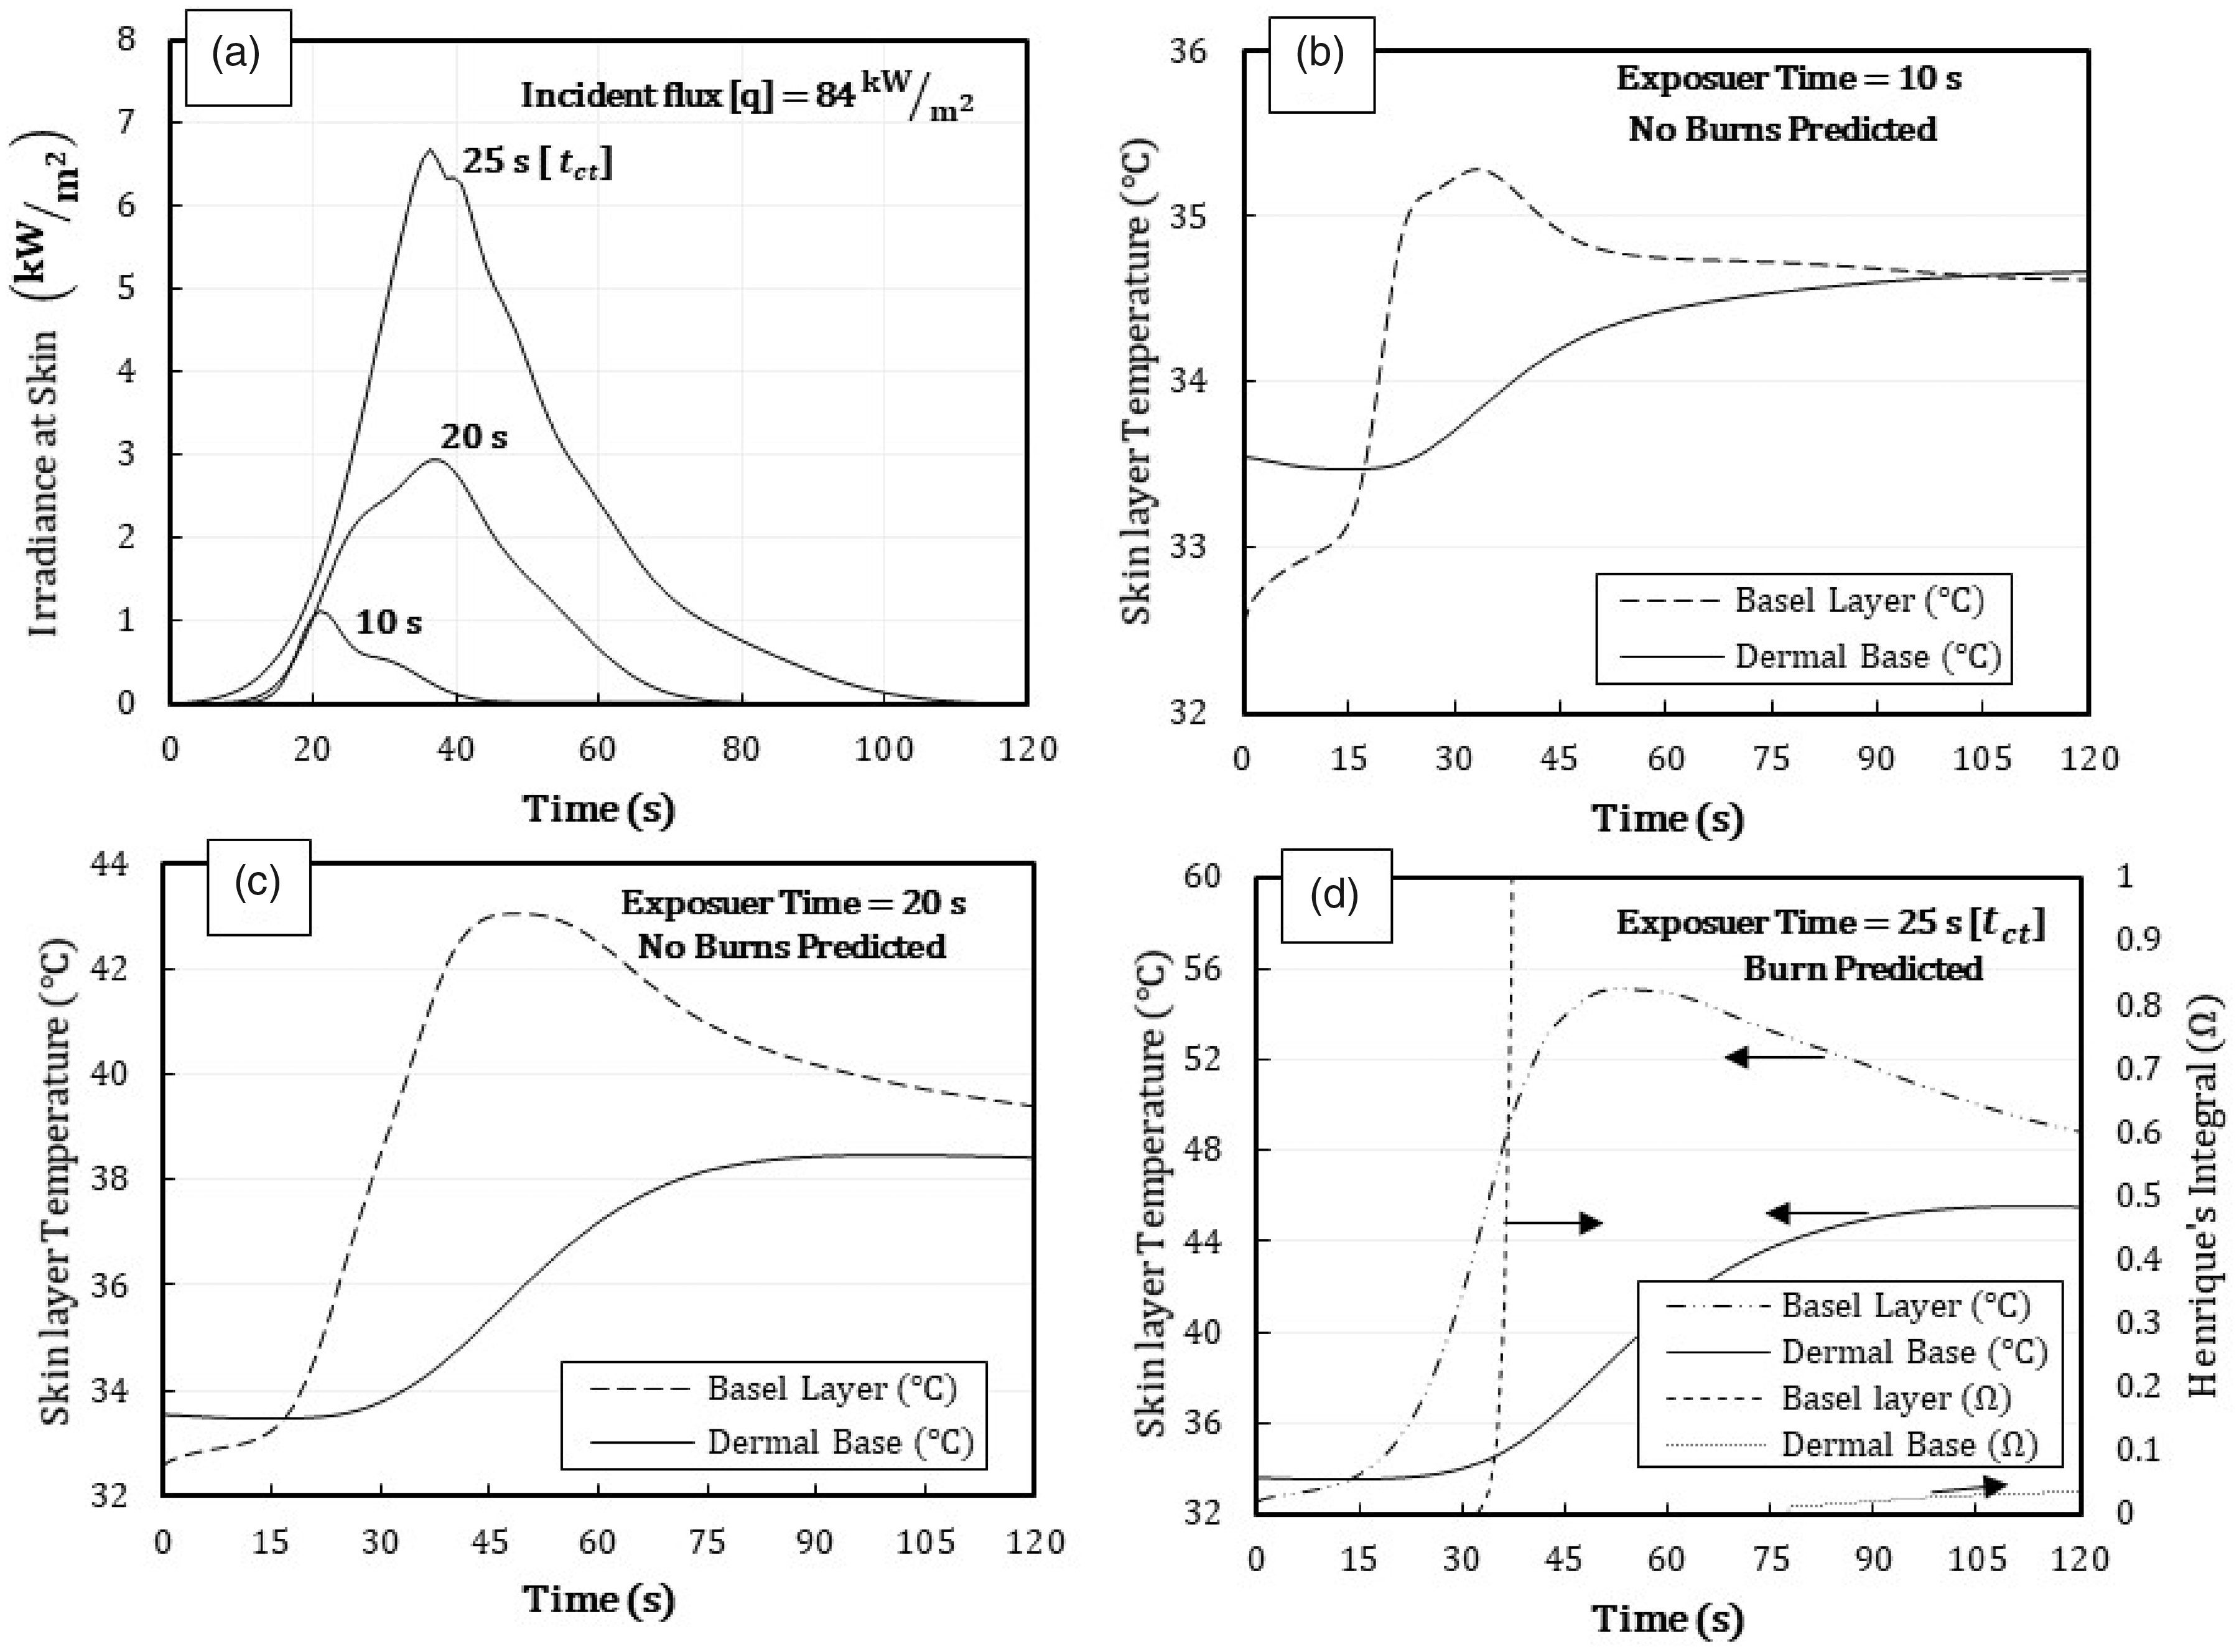
Skin condition before and on critical time at an incident heat flux of 84 kW/m2. (a) Irradiance observed at an exposure time of 10s, 20s and 25s, (b) predicted skin temperature for 10s of exposure, (c) predicted skin temperature for 20s of exposure and (d) Predicted skin temperature and burn injuries for 25s of exposure.
At an incident flux of 126 kW/m2, thermal energy propagation is different from that at 84 kW/m2. From Figure 10(a), the irradiance at a critical time tct is 15 seconds, and is inadequate to cause a second-degree burn, evident from Figure 10(c). At an exposure time of 15 seconds, the temperature at skin level is lower than the pain threshold. With an increase in exposure time from 15 to 20 seconds, a third-degree burn occurs. A peak in irradiance at skin level at an exposure time of 20 seconds indicates garment physical failure, that is, a tear. Garment performance at 126 kW/m2 in a vertical orientation is found to be sensitive. From Figure 10, it is estimated that in a vertical orientation, the protective garment will fail under 17 seconds. However, the garment performed better in a vertically configured test apparatus, compared to a horizontally configured apparatus.32 –34 An increase in second-degree burn time in vertical orientation agrees with the existing study 35 and verifies the initial hypothesis that:
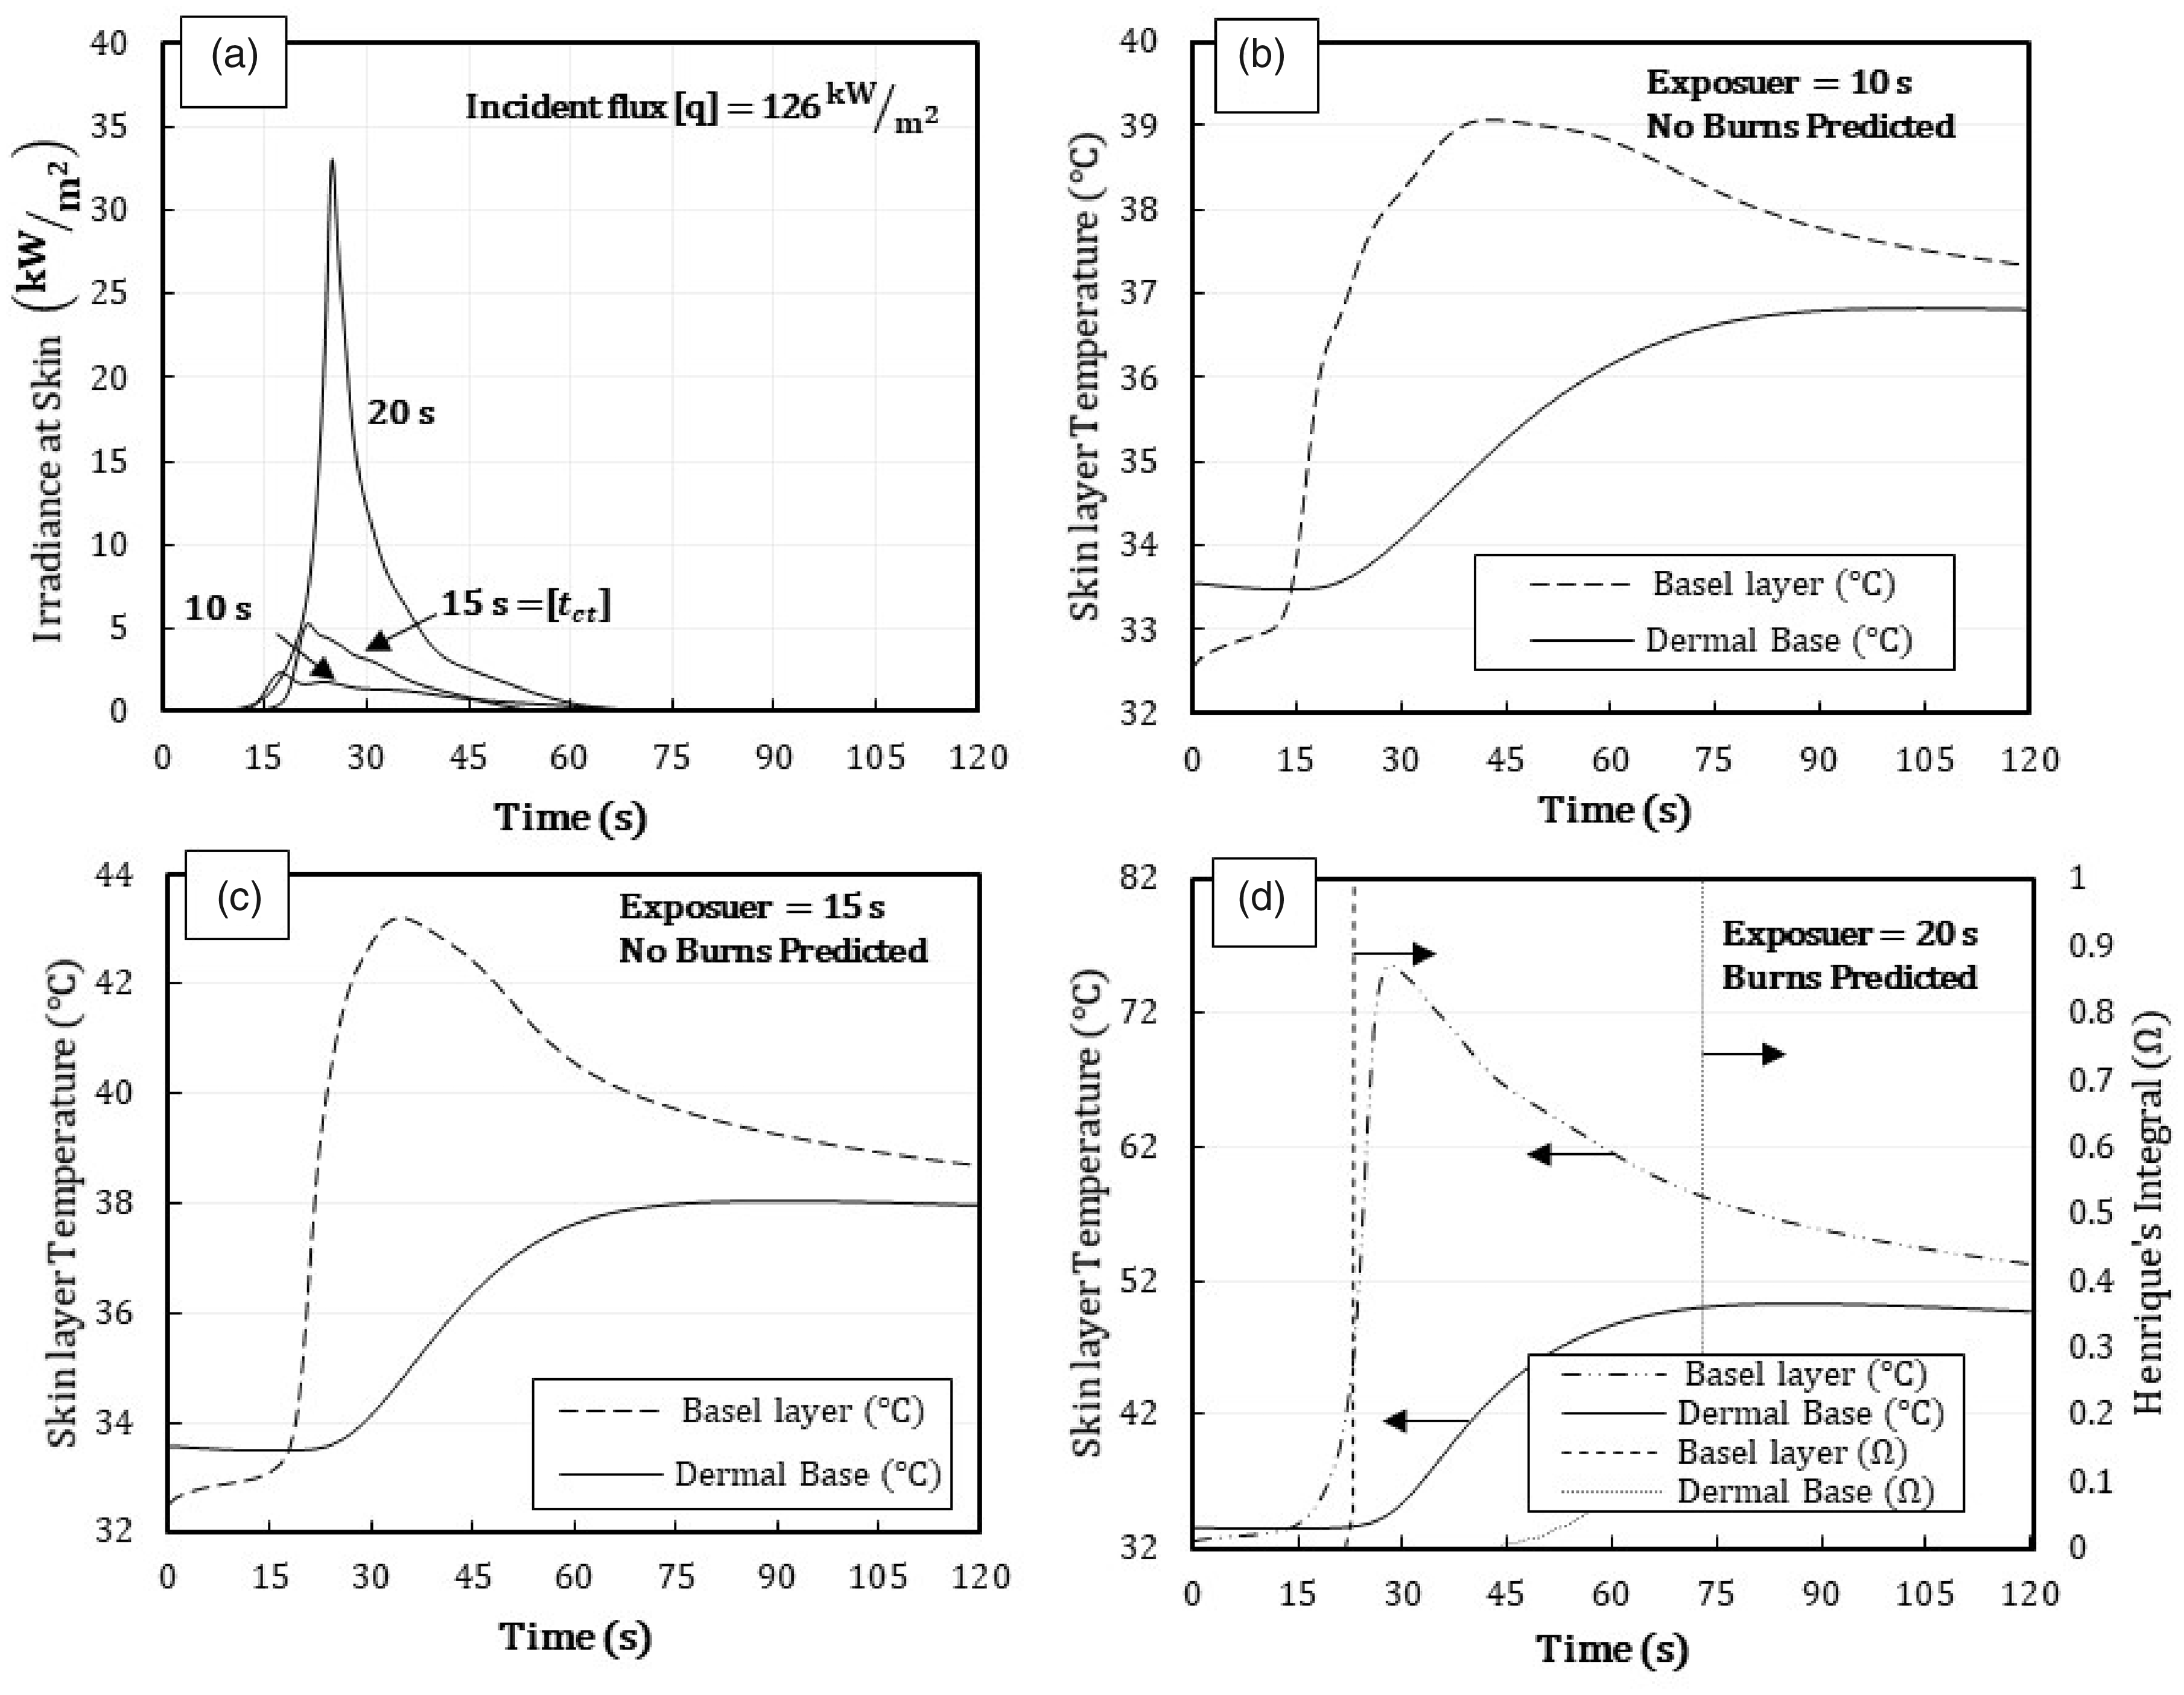
Skin condition before, on and after critical time at an incident heat flux of 126 kW/m2. (a) Irradiance observed at an exposure time of 10s, 15s and 20s, (b) predicted skin temperature for 10s of exposure, (c) predicted skin temperature for 15s of exposure and (d) Predicted skin temperature and burn injuries for 20s of exposure.
less smoke penetration results in convection loss to the environment;
heat dissipation at the skin level in a vertical orientation is different from the horizontal orientation;
a narrow time gap exists between no burn to second-degree burn (5 seconds).
A complementary evaluation is also performed at a medium heat flux of 41 kW/m2, presented in Figure 11 and the associated fabric experimental condition in Figure 14. The initial exposure time of 25 seconds is selected on the basis that no burns were predicted at an exposure time of 20 seconds at 84 kW/m2. For 41 kW/m2, no injuries are predicted at 25 seconds and skin thermal conditions remained under the threshold limit of 44°C, as seen in Figure 11(a). At 50 seconds of exposure time, a second-degree burn is predicted after 48 seconds and the dermal base temperature remained stable, hence, no third-degree burns are observed as seen in Figure 11(b). At 180 seconds of exposure time a second-degree burn is predicted after 49 seconds, and a third-degree burn after 93 seconds as seen in Figure 11(c).
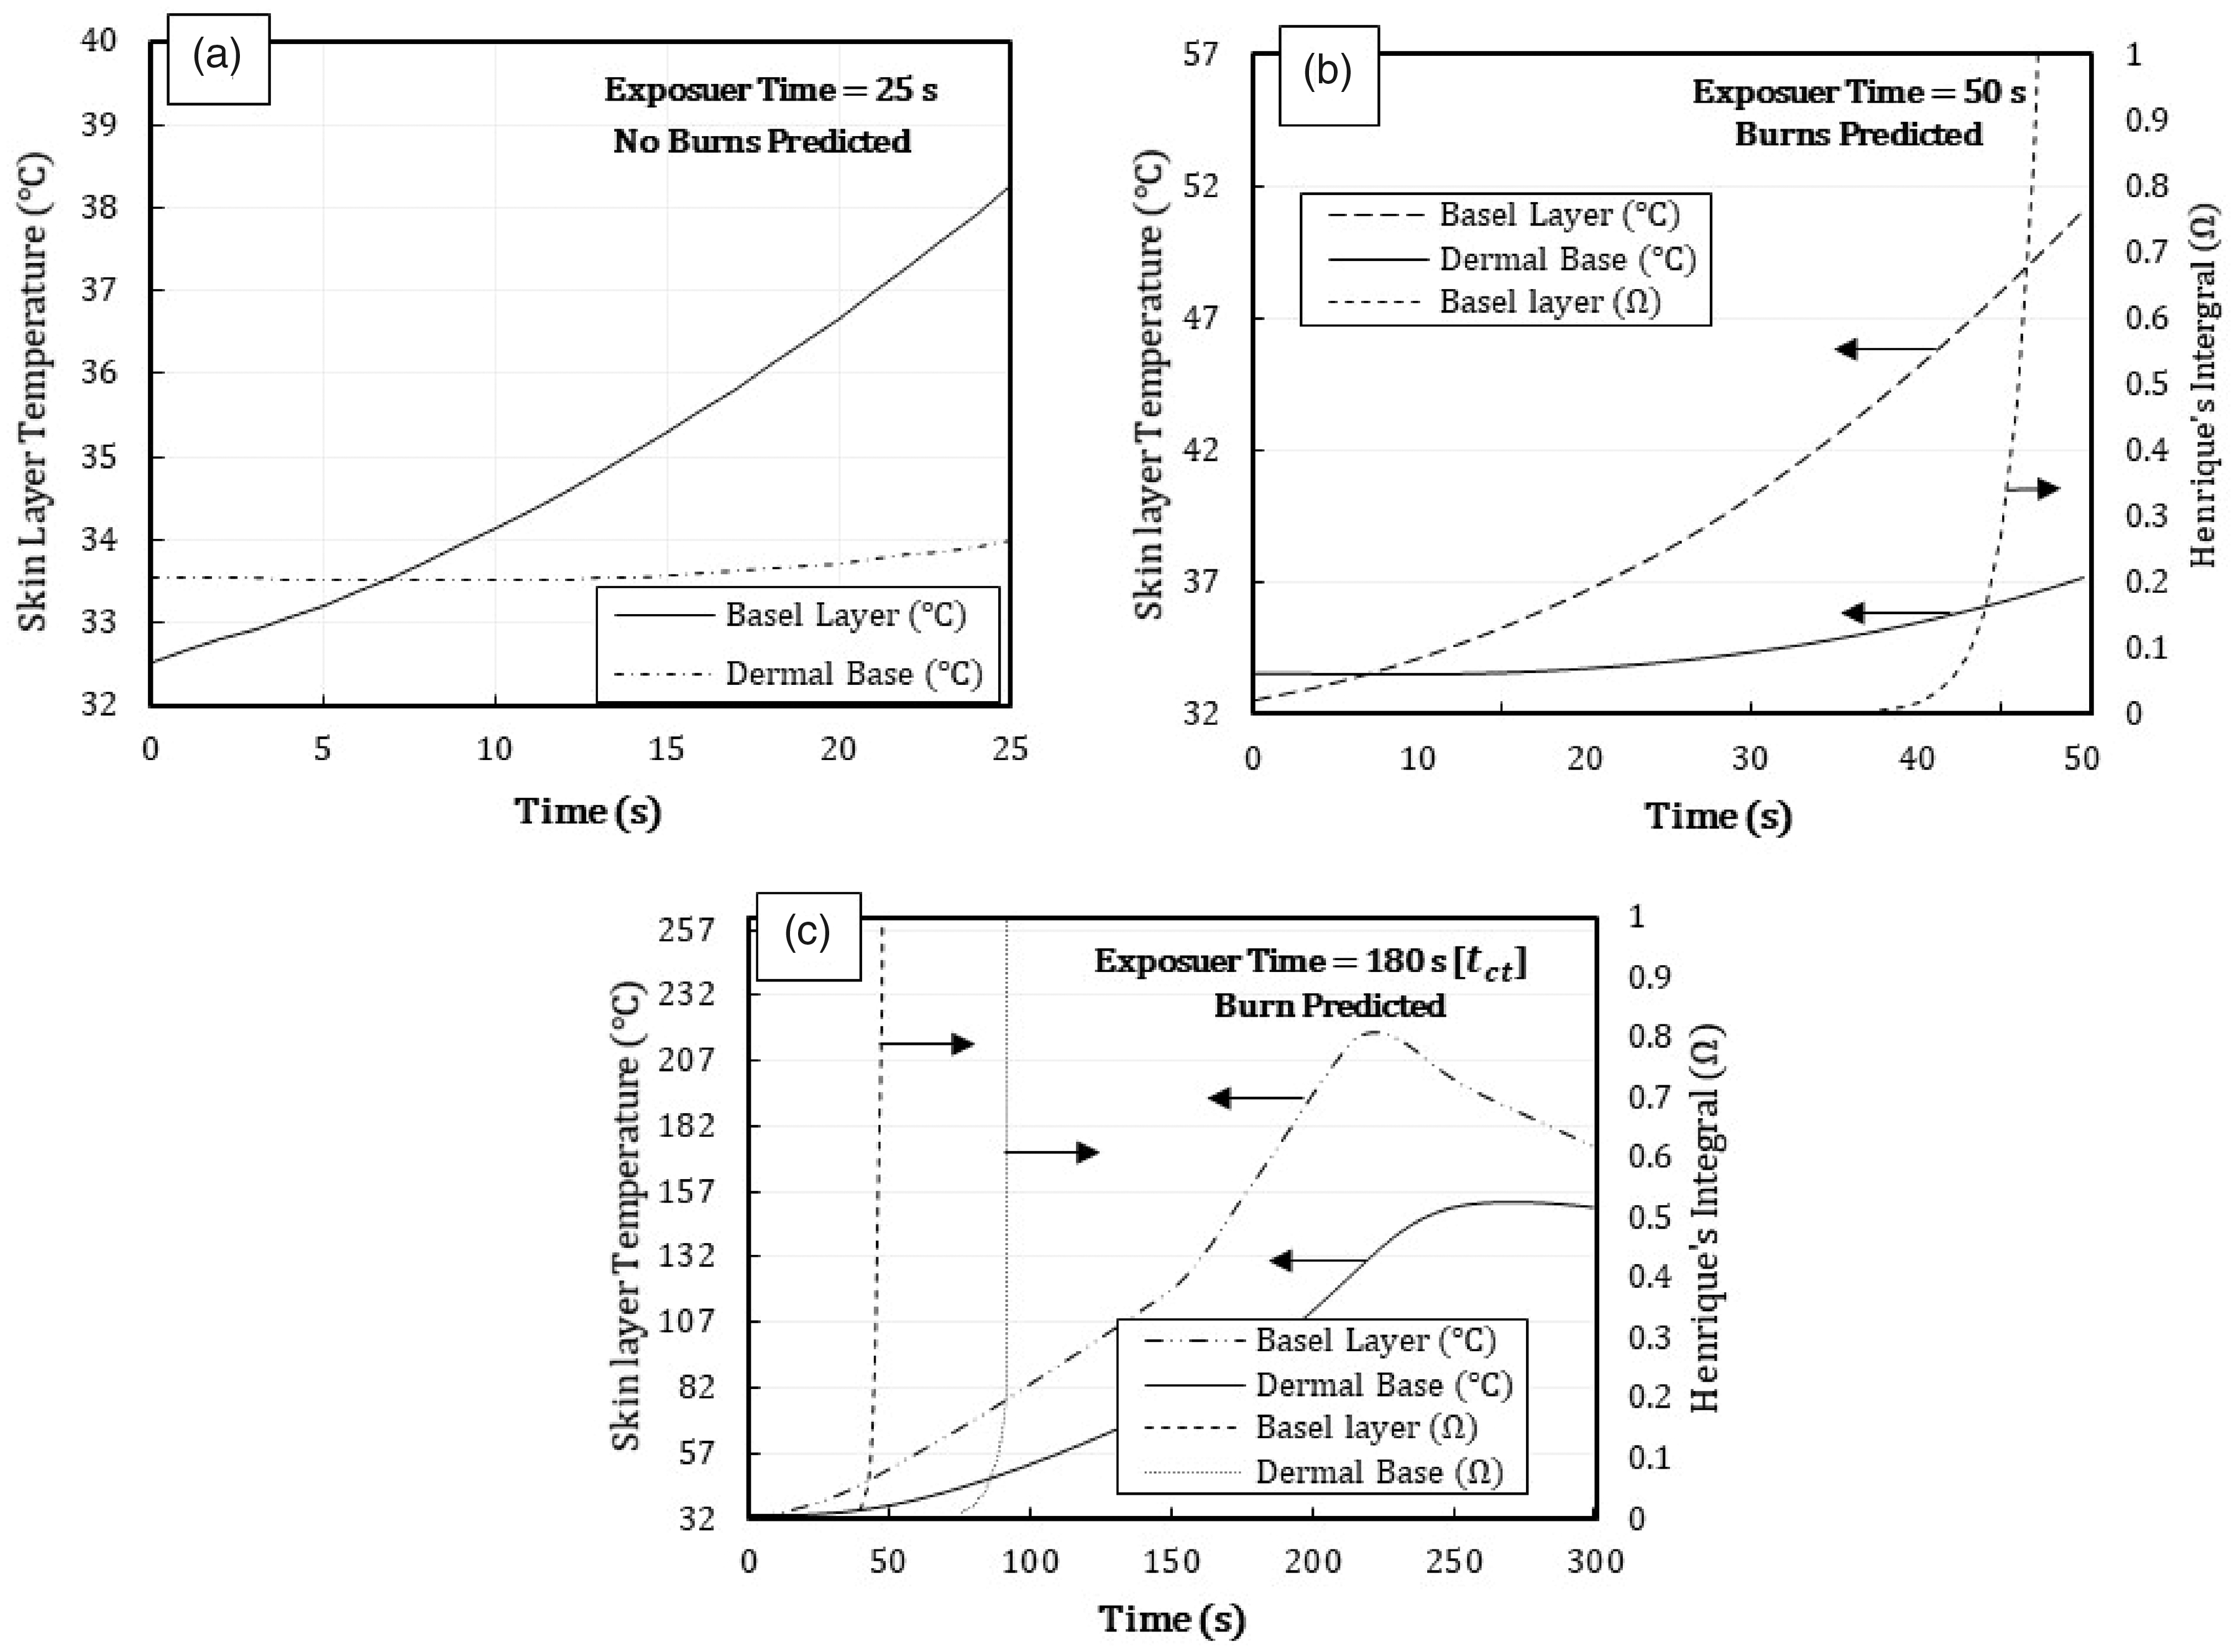
Skin condition before and at a critical time at an incident heat flux of 41 kW/m2. (a) predicted skin temperature for 25s of exposure, (b) predicted skin temperature and burn injuries for 50s of exposure and (c) Predicted skin temperature and burn injuries for 180s of exposure.
The evaluation of a protective garment at the critical time tct is also beneficial to access stored thermal energy and its effect in thermally degrading the protective layers. In Figures 12 –14 the fabric assembly physical condition is shown for three different exposure durations at 84 and 126 kW/m2 representing high flux environments and at 41 kW/m2 representing medium flux conditions. Under 84 kW/m2, fabric assemblies irradiated for 10 seconds, the physical structure remained undamaged for all three layers. Exposed for 20 seconds, char deposits were on all layers and face cloth of the moisture barrier is compromised, evident from the presence of a tear. However, the polytetrafluoroethylene (PTEF) layer did not break open. Exposed for tct (25 seconds), there are significant char deposits on all layers and the moisture barrier is damaged completely, resulting in superficial and partial thickness burns. Under 126 kW/m2, irradiated for 10 seconds, assembly response is like 84 kW/m2 of the same exposure. However, exposed for 15 seconds, the outer shell and moisture barrier are completely damaged. At 20 seconds, the whole assembly splits open, resulting in superficial and partial thickness burns. This implies that a convectional firefighter suit is adequate for protection against proposed severe thermal environments for an exposure duration of 15 seconds. Beyond that, auxiliary measures are recommended.
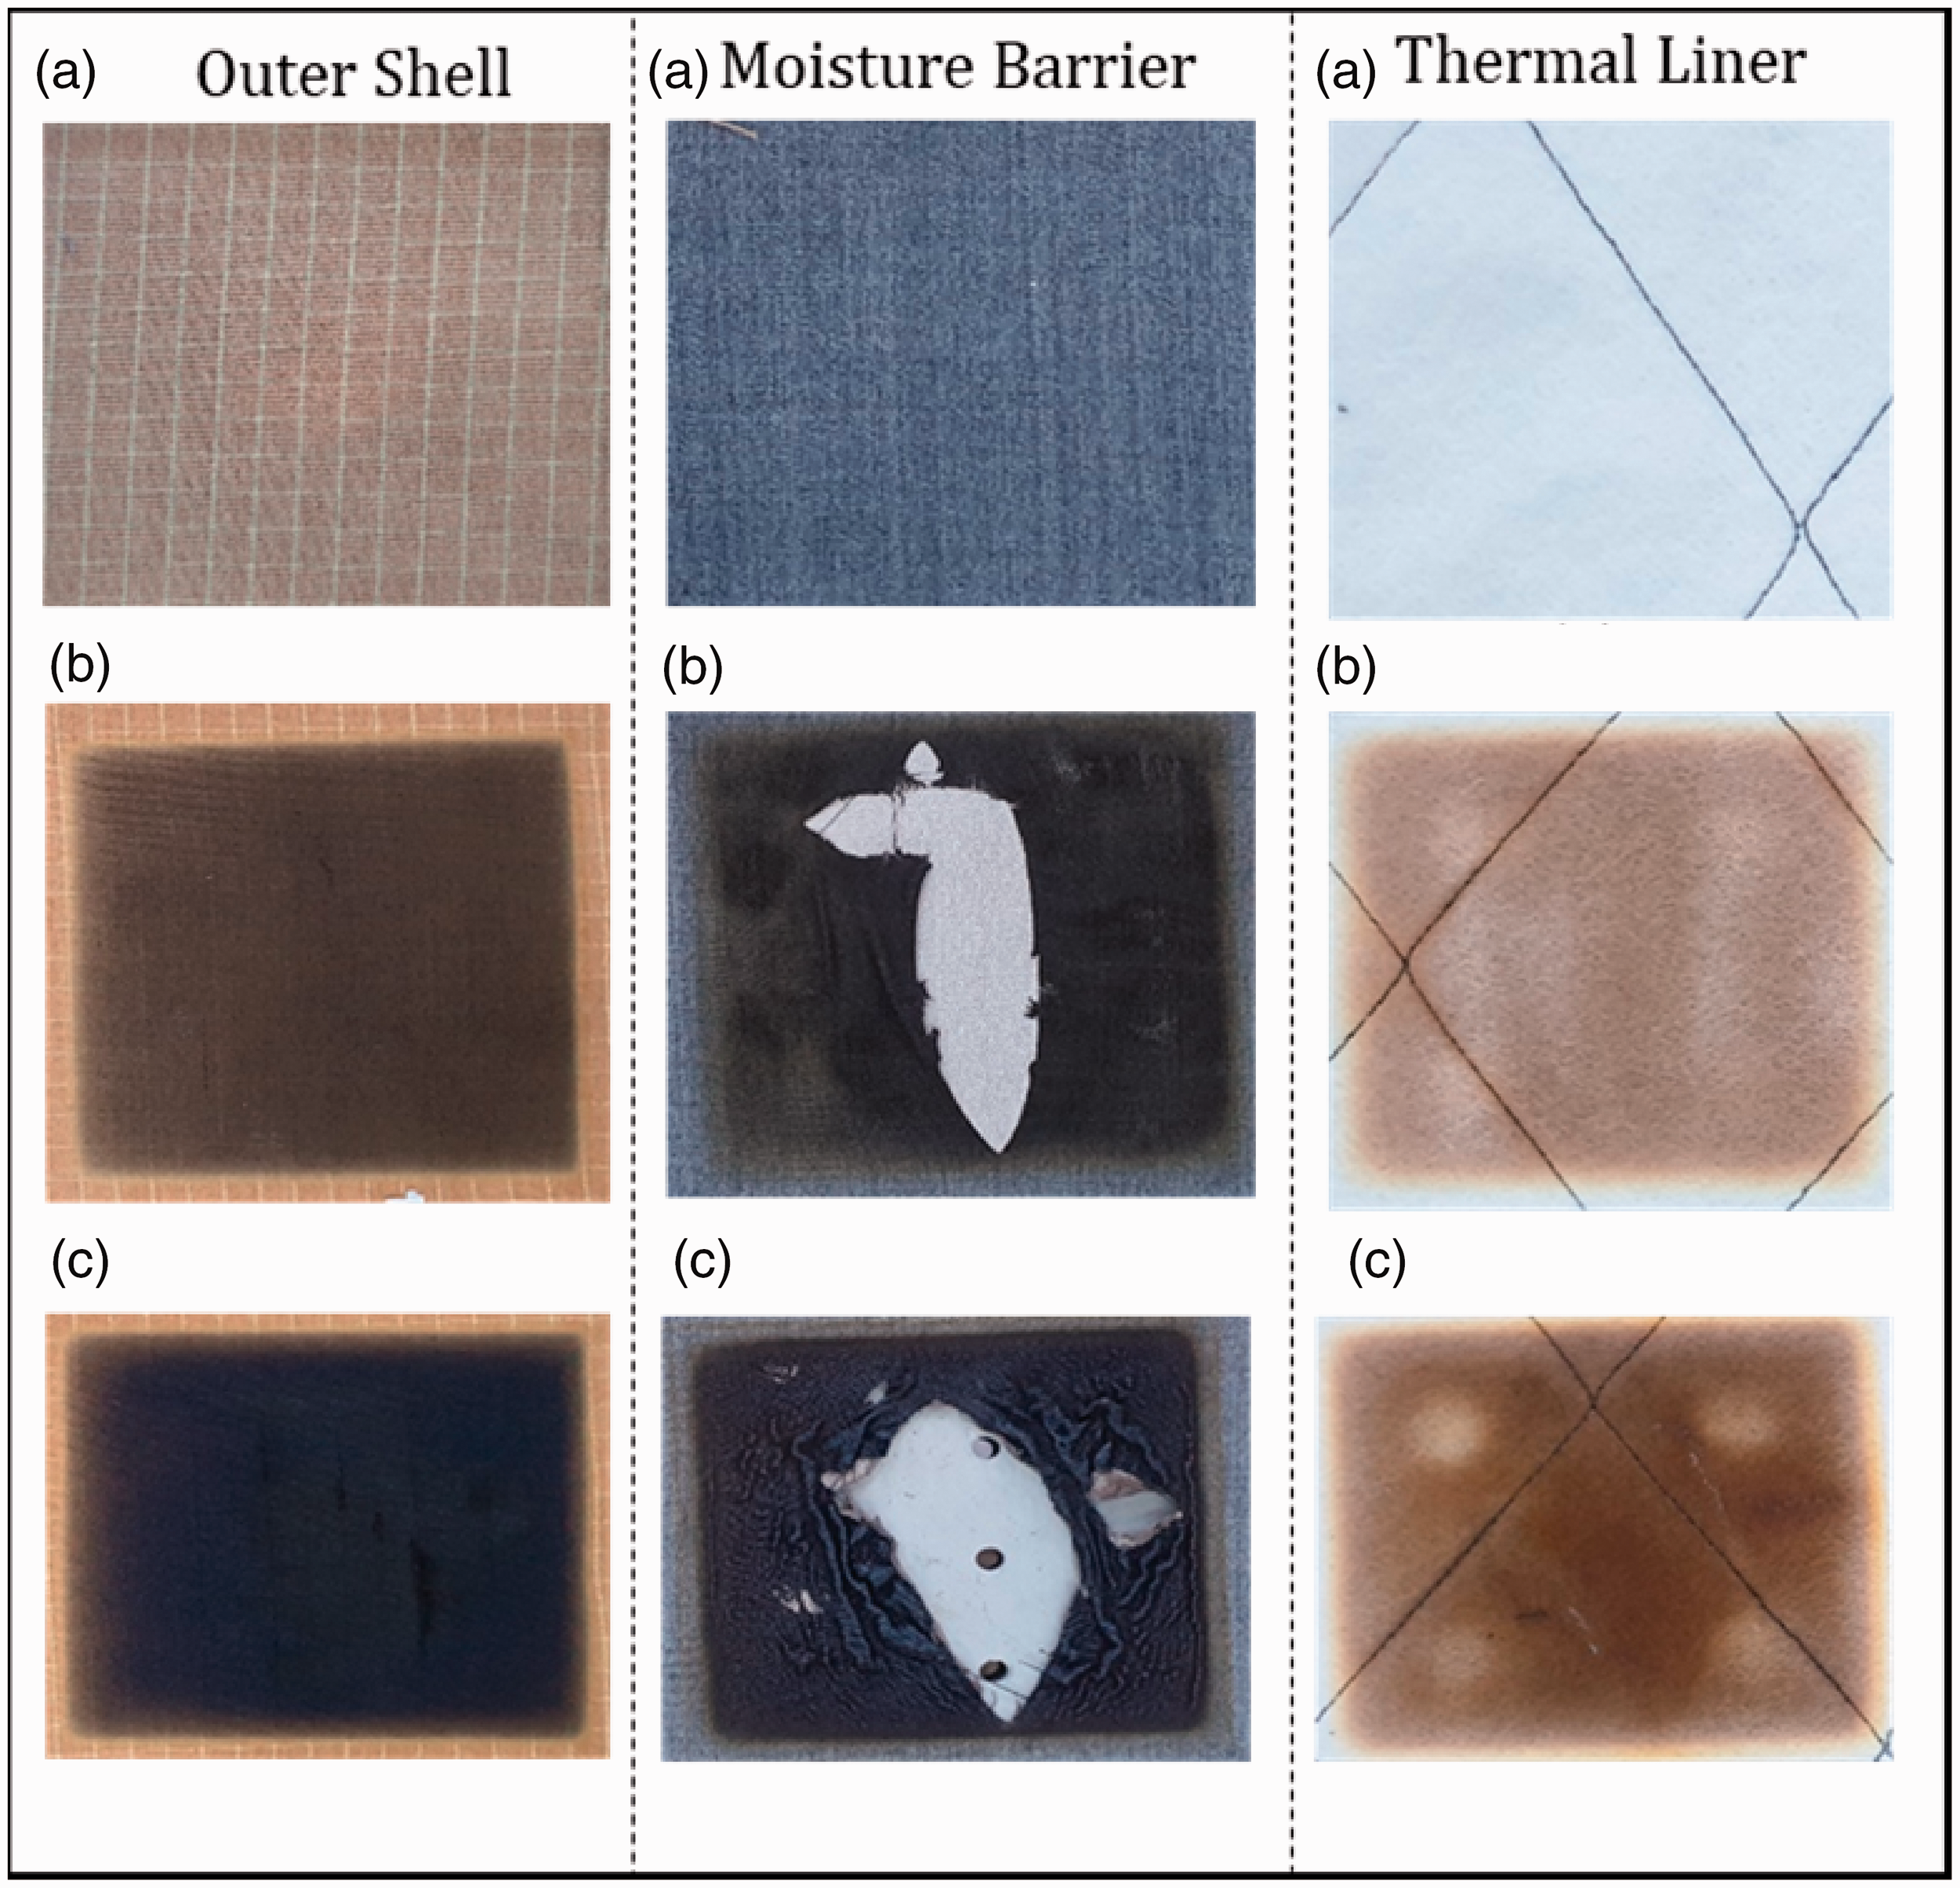
Fabric thermo-physical behavior under increased exposure time at a constant incident flux of 84 kW/m2: (a) 10 seconds; (b) 20 seconds; (c) 25 seconds.
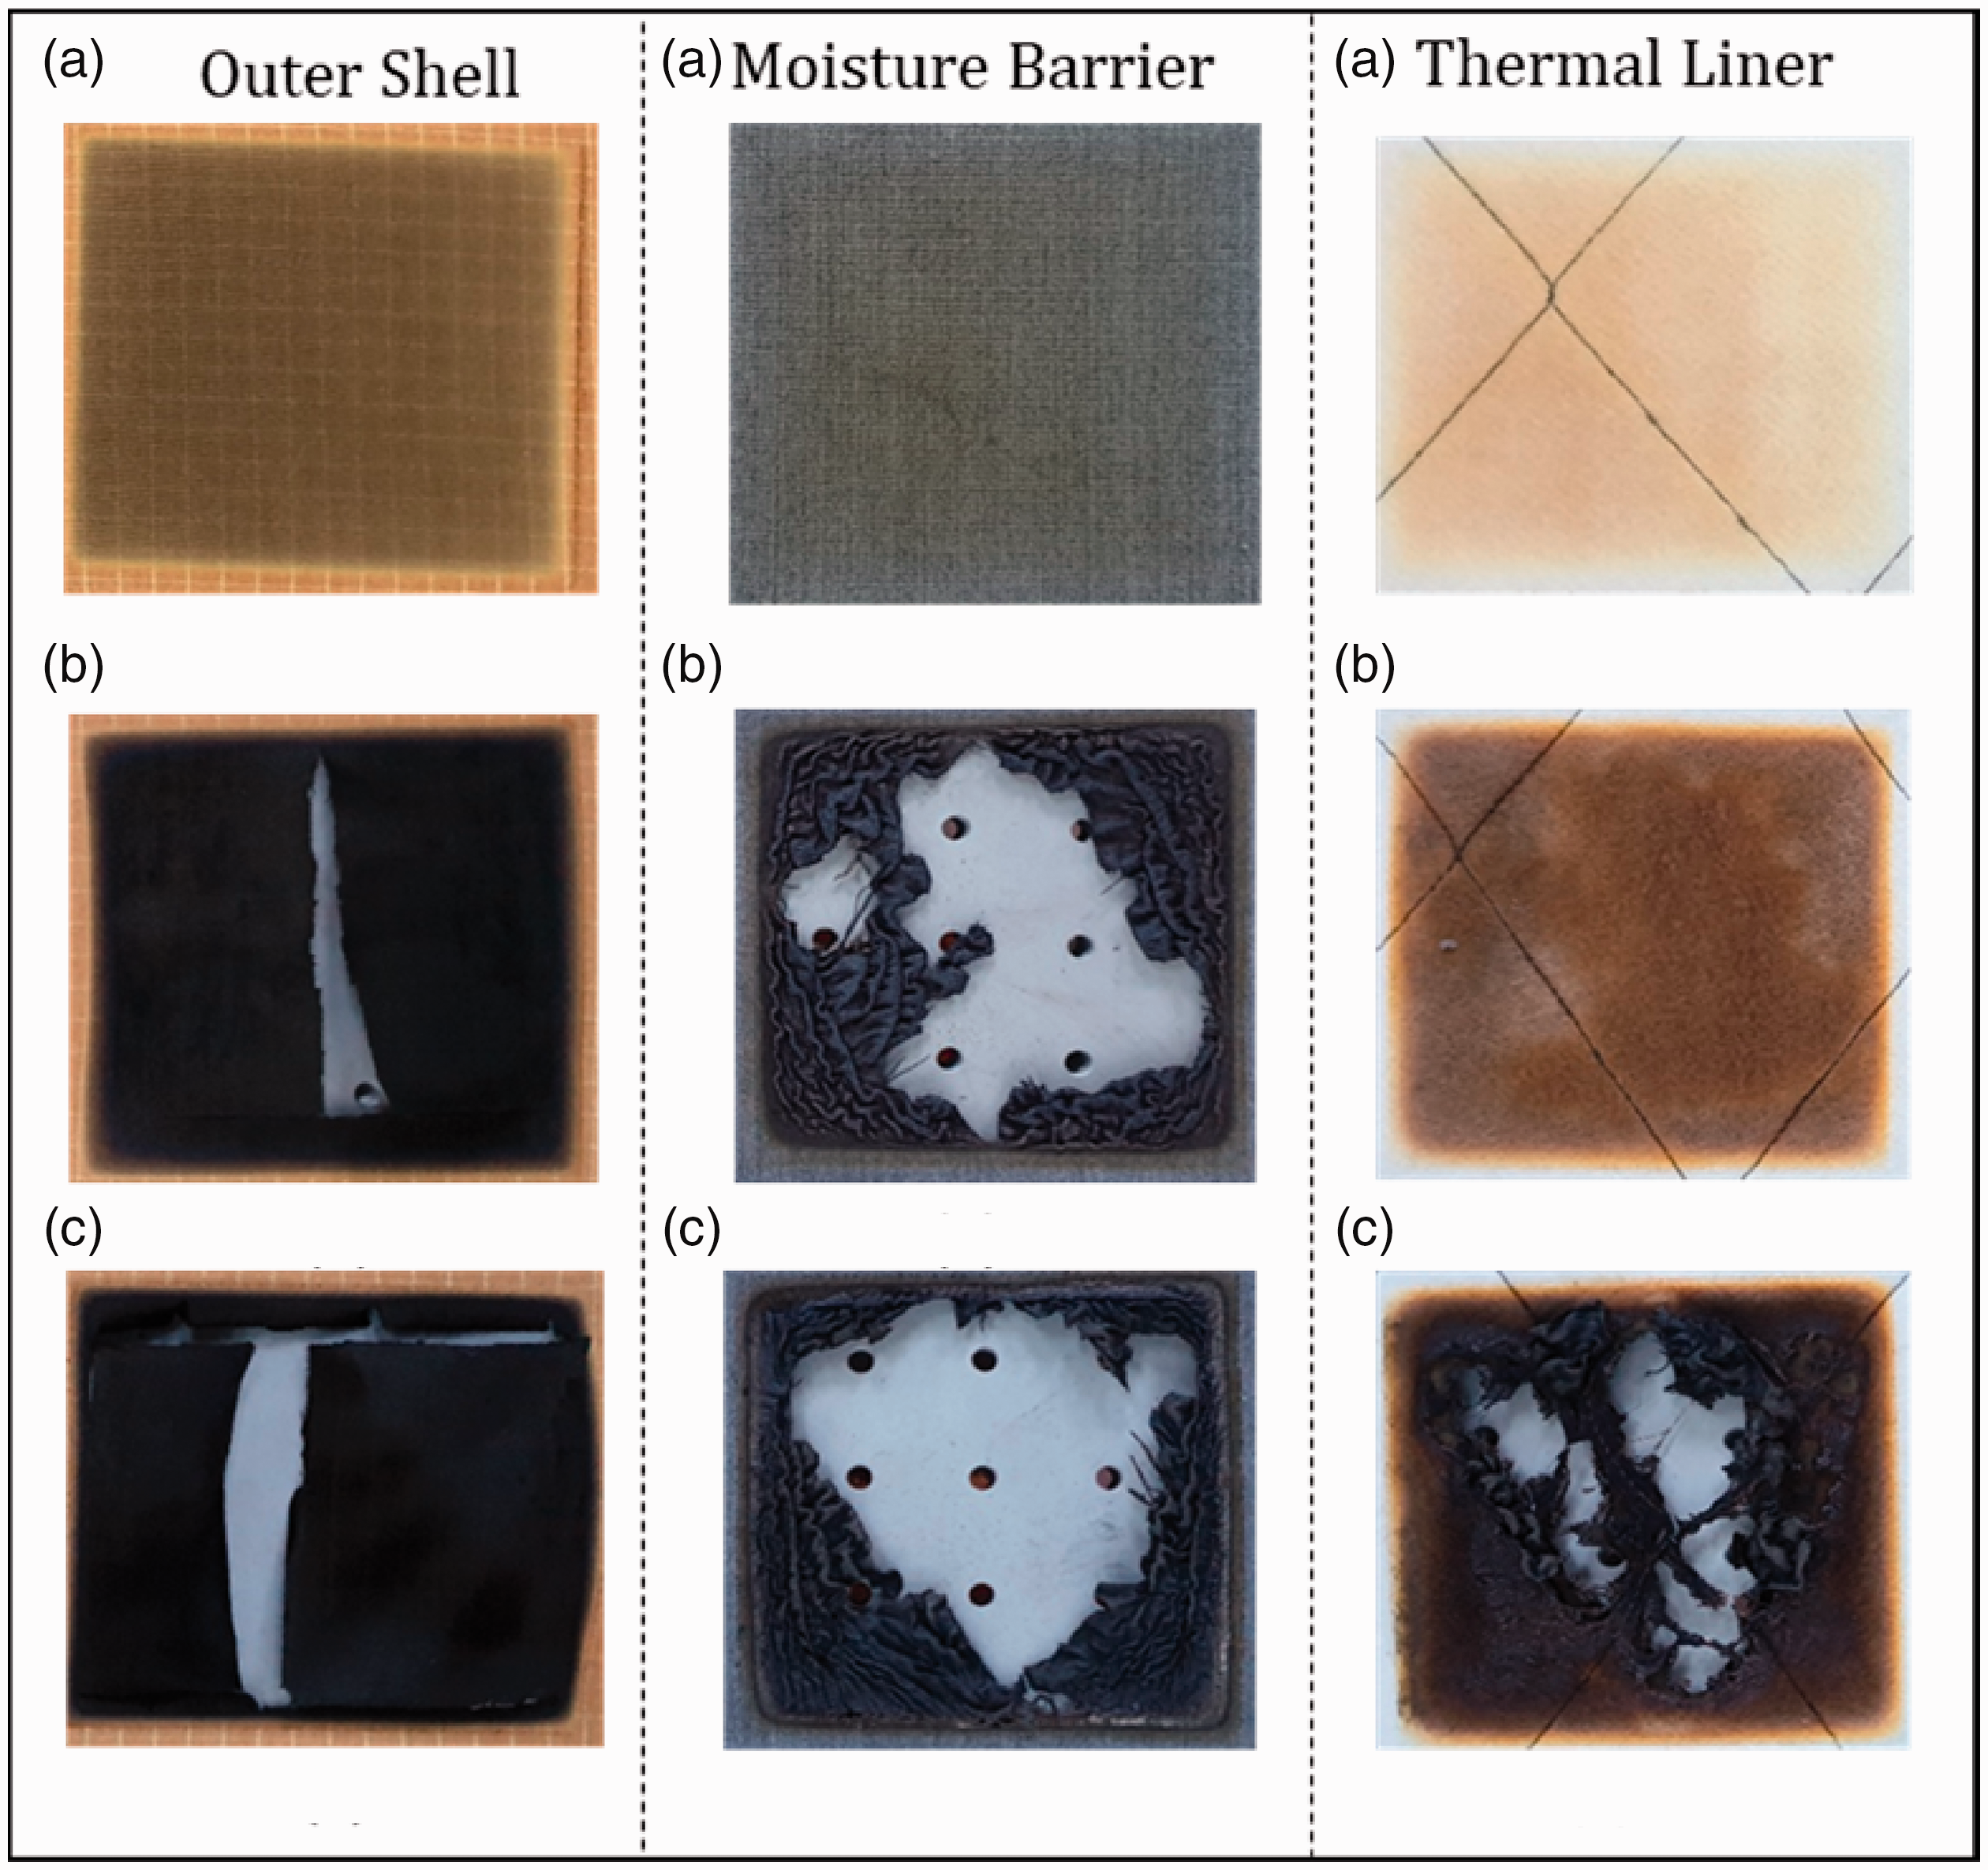
Fabric thermo-physical behavior under increased exposure time at a constant incident flux of 126 kW/m2: (a) 10 seconds; (b) 15 seconds; (c) 20 seconds.
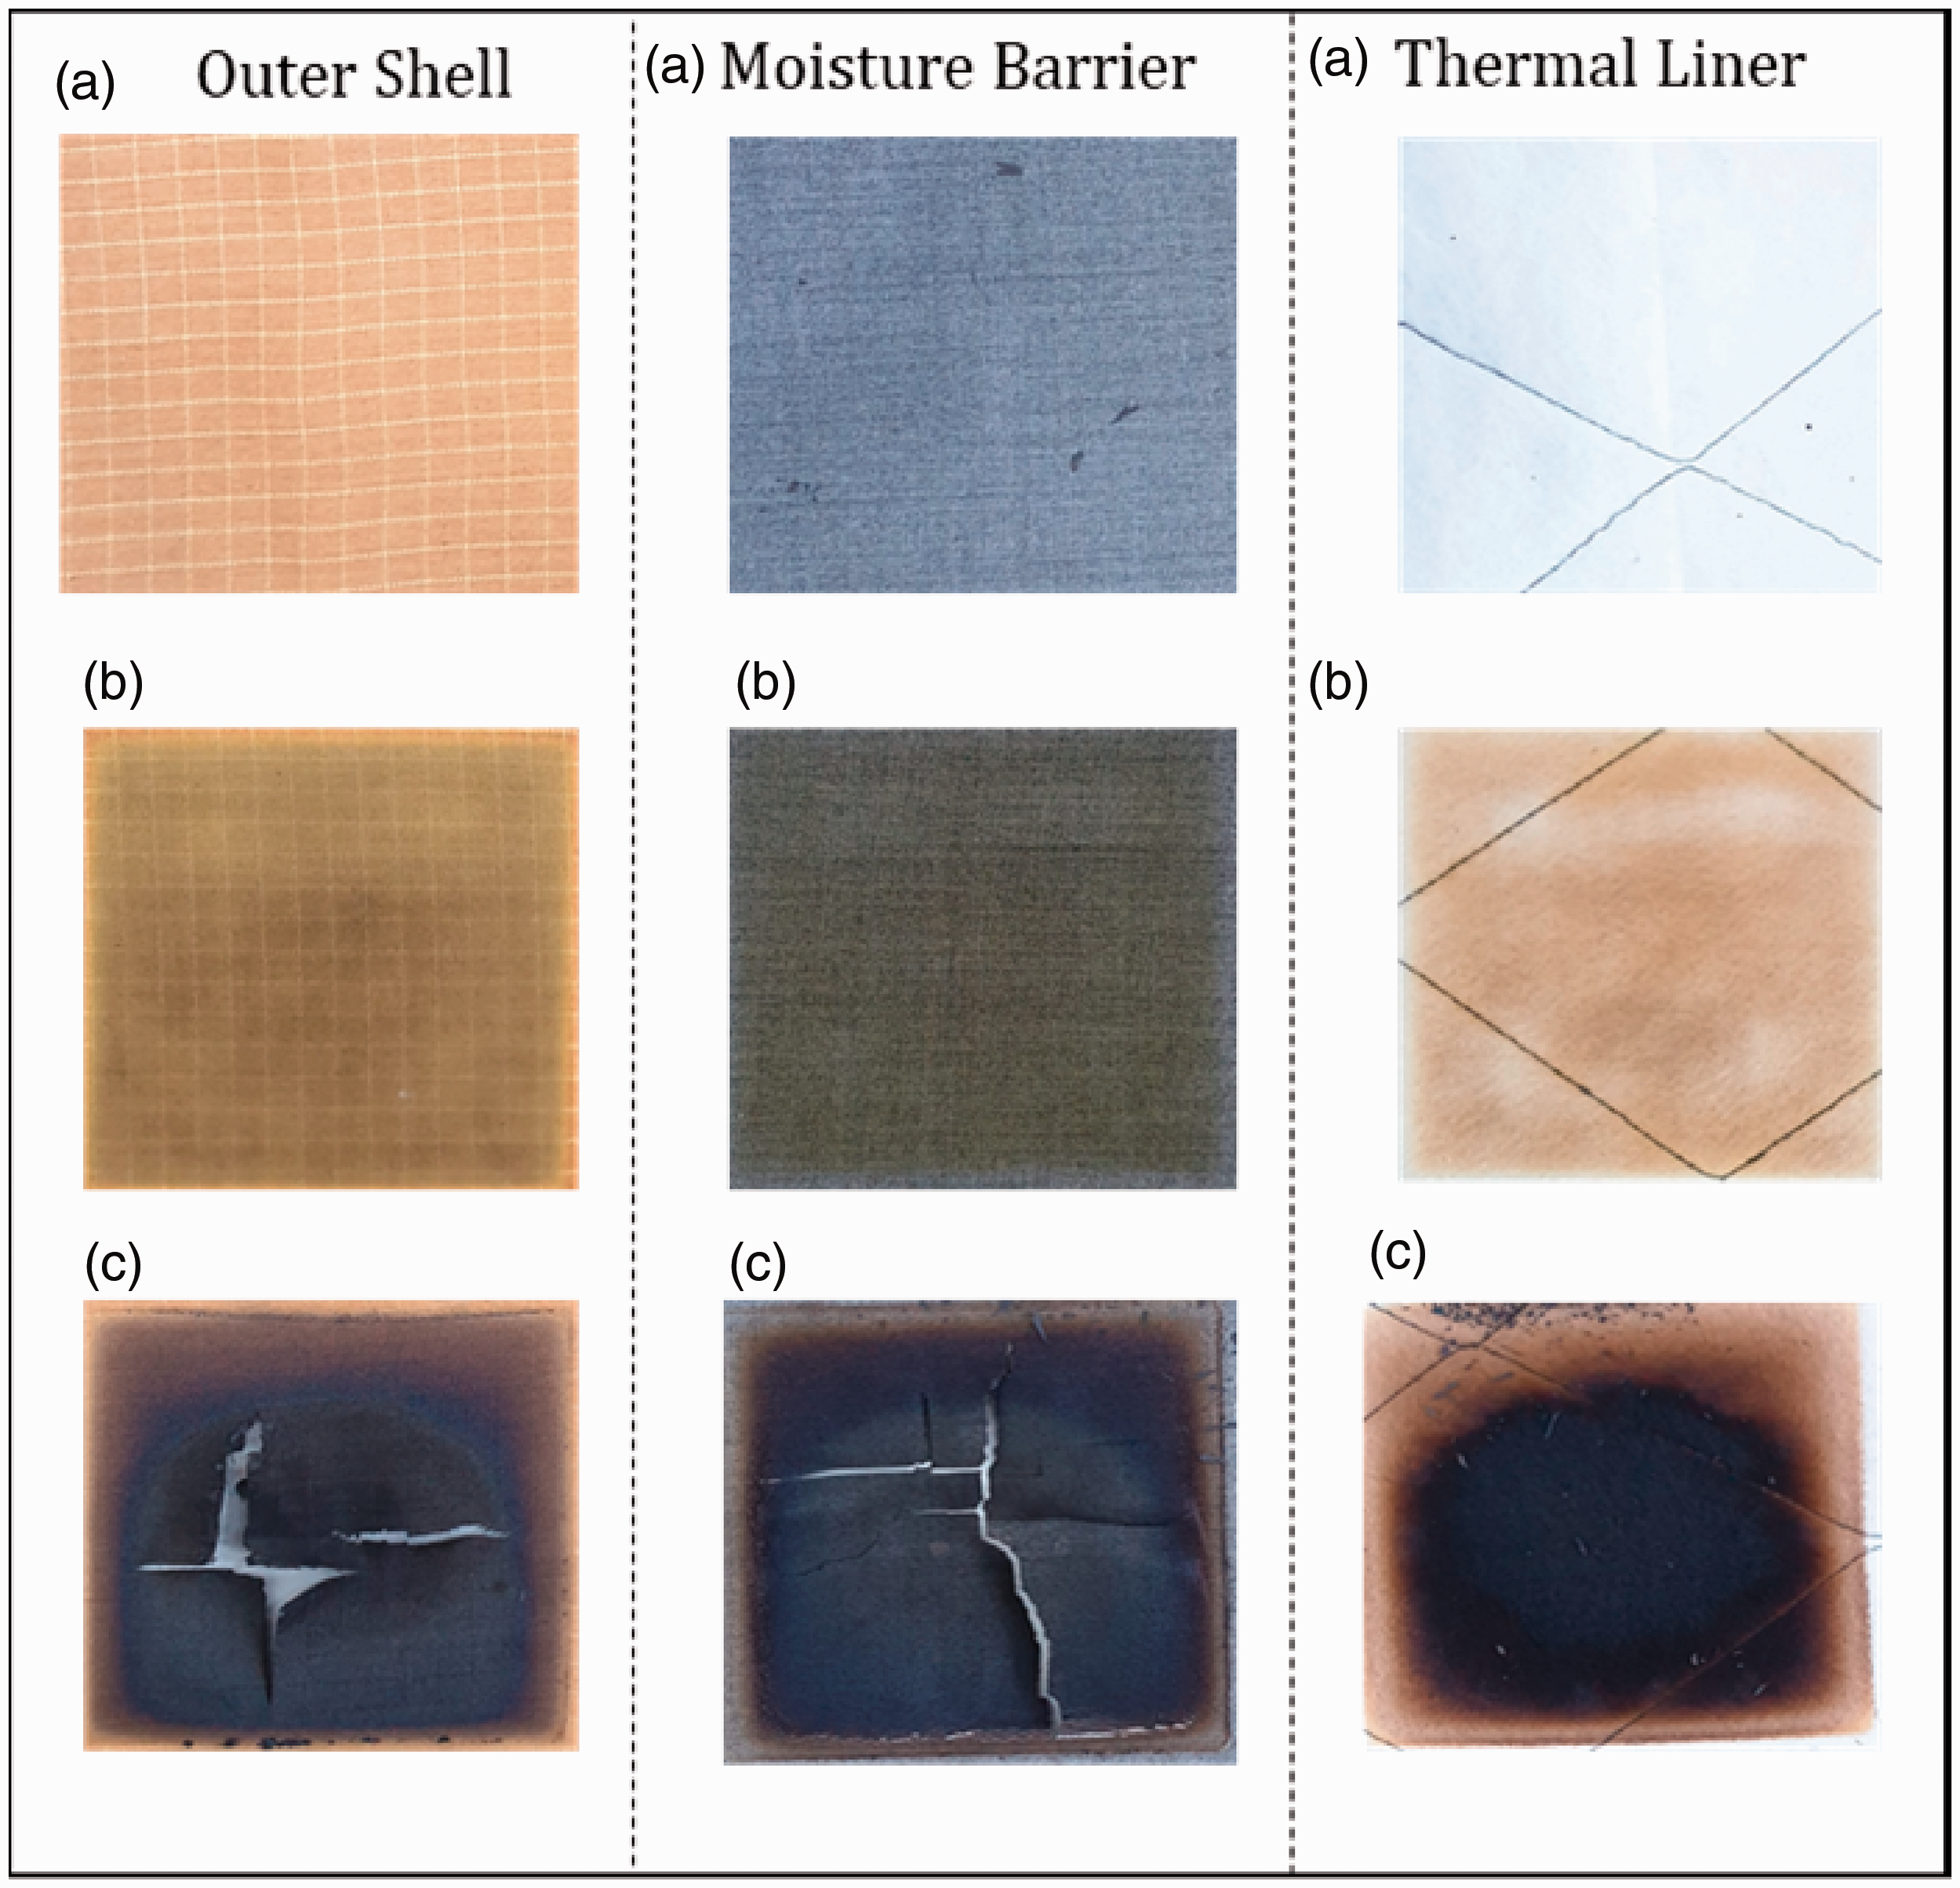
Fabric thermo-physical behavior under increased exposure time at a constant incident flux of 41 kW/m2: (a) 25 seconds; (b) 50 seconds; (c) 180 seconds.
Comparing medium flux conditions of 41 kW/m2 from Figure 14 to that of a high flux of 84 and 126 kW/m2 from Figures 12 and 13, it is seen that the exposure duration is significant in the prediction of burn injuries. Fabric assembly exposed to 41 kW/m2 for 50 seconds retained its physical appearance and no significant char was deposited; however, a second-degree burn was predicted at this condition, evident from Figure 11(b). It signifies that under prolonged exposures at medium flux, more thermal energy is dissipated to the skin and visual indicators of fabric conditions should not be exercised for practical evaluations. Nevertheless, for high flux conditions, these visual indicators are beneficial as the exposure duration is small and the flux density is high.
More work needs to be done in the development of heat resistant fabric for better performance under fire load arising due to modern furnishings. Until such development is attained it is recommended to include failure time and critical time evaluation in addition to the TPP test that will give an upper limit value to fabric performance, thus making firefighters properly aware of the limitations of their protective garments.
Conclusions
This work aims to add knowledge on the maximum performance of protective garments worn by firefighters. The concept of critical time is introduced to abate iterative experimentation practice. It is investigated further to establish its relation at increasing heat flux, to mitigate fatalities due to unforeseen fluctuating circumstances in active duty. Three heat flux density levels were selected as 41, 84 and 126 kW/m2. Analysis of protective garments utilizing critical time identified that a tear in the outer shell triggers an abrupt influx of thermal energy towards the wearer’s body. Thermal degradation of fabric layers occurs with melting of all layers at thermal environments above 84 kW/m2. The examination of critical time in relation to incident flux indicated that the performance of protective garments decreased by four times when irradiance is doubled, from 41 to 84 kW/m2, and reduced by more than a quarter when increased from 84 to 126 kW/m2. The introduced notion of critical time significantly reduced the iterative process. An increase in second-degree burn time is observed in vertically oriented bench-scale tests compared to horizontal tests. The current protective garment is incapable of protecting firefighters at severe conditions of 126 kW/m2. The inclusion of critical time into existing TPP test standards will aid firefighters by better understanding the upper limitations of their protective suit. Work done in this study is limited to tested fabric; however, the introduced concept of critical time can be expanded to any other protective material and full-scale manikin tests.
Footnotes
Acknowledgements
The author(s) express their gratitude to Dr Sungwook Kang and Dr J Yoon Choi at Korean Conformity Laboratories (KCL) in South Korea for their support in the procurement of the test materials and for providing technical assistance during the experiments.
Declaration of conflicting interests
The author(s) declared no potential conflicts of interest with respect to the research, authorship, and/or publication of this article.
Funding
The author(s) disclosed receipt of the following financial support for the research, authorship, and/or publication of this article: This project was funded by the National Fire Agency through the R&D programme on Development of Fire Safety Technologies for Emergency Response to Fire Hazards (No. 20008021).