
Abstract
The simulative development of clothing and other textile products requires a complete set of material parameters to be provided. Currently, different simulation software providers users with different values and formats for these parameters. This paper provides an overview about the most important values and proposed structures for storing both the raw data and the extracted parameters. The structure is implemented in both JSON and XML formats, allowing integration in proven formats for three-dimensional worlds such as gltf and x3d. Finally, a structure for organization of the raw data of the testing devices is described. Following this structure allows automatic processing, normalization and extraction of the parameters in short time. The goal of the paper is to simplify and unify the exchange of material parameters for textile fabrics.
Keywords
Today’s modern simulation clothing software provides impressive photorealistic simulation of the drape behavior of textile products over human bodies.1–5 These programs have changed radically the workflow in the design of clothing and textile-based products in general. The main part of clothing today is developed based on a large set of previously prepared and well-sorted patterns, which are then modified and adjusted using a numerical fitting procedure over scanned or generated bodies, named avatars. These steps are performed completely digitally and the world of fashion has moved to a digital orientation, one example – the first virtually made cloth – was sold for 950,00 USD in 2019. 6 All of these developments require stable and realistic algorithms for draping simulation of textiles. It is a common trend that different software vendors use their own methods that differ from those of other software vendors and they normally do not publish any details about the algorithms they use. A fundamental research about this is based on discretized mass–spring systems, explained in several works.7–12
Three-dimensional (3D) simulation software is nowadays widely used in the industry and one important problem is the data preparation of the different samples for the 3D simulation. There are several groups13,14 working in this direction and a white paper 15 has been published with the intention to develop a system in this area. A first trial for achieving a common format has also already been proposed – the company Vizoo GmbH proposed an extension of their JSON based U3M format with a proposal for accommodation of parameters for material characterization. 16 All of these works and meetings represent positive moves in the right direction, but there is still a lack of a clear, scientific-founded background for the selection of the descriptive language and strategy for solving the problems with the different measurement systems.
This paper has the goal to provide a background for a unified approach in the data preparation, data exchange and preparation for the use in the different clothing systems and finite element method (FEM) simulation software.
State of the art
The storage of material data processing has become a serious problem at the current time. The European Union founded a special program for material modeling 17 and the German Ministry for Education and Research (BMBF) founded a larger program, MaterialDigital, 18 in order to support projects, working for the unification of the methods to store material data. These founding programs support a small number of single projects. Currently there are no related activities in textile structures.
For a mechanically correct 3D (draping) simulation of textile fabrics a large set of data is required, namely geometry of the body avatar and clothing pattern, which provide the geometry of the single pieces, information about the connecting sewing lines, images for the rendering of the fabrics surface and a set of material properties, which are the subject of the current investigation.
In FEM software these material properties are defined in well-described specific formats, often named “cards.” Each software has its own, normally open, text-based format for storing the elasticity modulus, density, ultimate strength and material behavior, such as linear elastic, plastic, nonlinear, etc. In LS-Dyna®, 19 Abaqus® 20 and Ansys® 21 these are open, which means they are not encrypted; text-based files in which the material parameters appear are listed after specific keywords. The measurement of the elasticity modulus and the density of solid materials can be done according to standardized methods and is usually provided by the material supplier. Normally, there is no discussion about the units and the testing conditions of these values. Even if these software packages belong to competitors, the formats for the materials are normally open and the transfer from one to another one is a question of simple scripting, and the data is interchangeable and editable.
Clothing simulation software, in most cases, uses closed, proprietary formats for storing of this data and, in most cases, it can be edited only in its graphical user interface. Only a few programs provide not well documented, open formats, but their use remains limited to their developers and a small number of experts.
Clothing simulation targets lower cost projects compared to FEM simulation software, where cars, airplanes, etc., are computed, because the number of users is smaller and the market is narrower. That is why such “closed format” behavior is understandable and any opening of the theoretical models of the simulation (such as the 1286 pages of the theory manuals of Ansys
22
or 680 pages of LS-Dyna
23
) cannot be expected in the near future. The required material parameters depend on the simulation models, so there are two possible scenarios that could improve the current state and support the simplified exchange of material data.
Common open exchange format: if all software providers would agree to be able to read and save in one, open format for storing the material data and implement an import/export function in their software, this could be a good solution for all textile fabrics providers, designers, students, researchers and engineers. Recomputing software or rules: until such a format is determined and implemented, another solution can be the use of standardized testing data and derived extraction of the parameters for each single software, depending on the requirements of the different algorithms.
For definition of the common format the single parameters have to be analyzed, described and suitably named. In the following sections, an overview of these parameters, methods for their measurement and proposal for savings is given.
Material properties for drape simulation
The fast simulation of clothing today uses mass–spring systems. In the future, this could change as more accurate FEMs become faster and more powerful. Probably in the next-generation FEM, they will be able to work directly with free form surfaces, but at the current time, the fabrics are represented as distributed masses, connected by springs. Three groups of springs – tensile, bending and shear – represent the main mechanical parameters of the fabrics, and their stiffness has to be determined.
Sample orientation
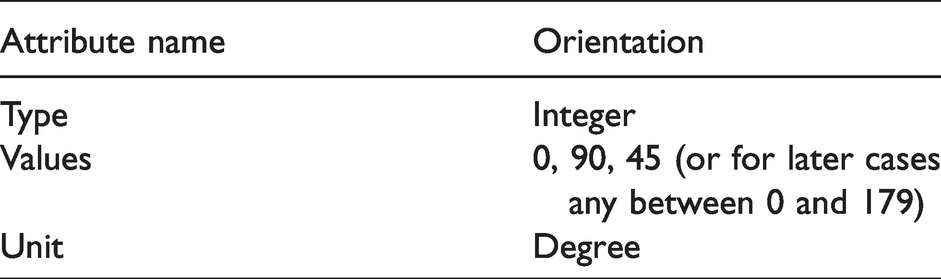
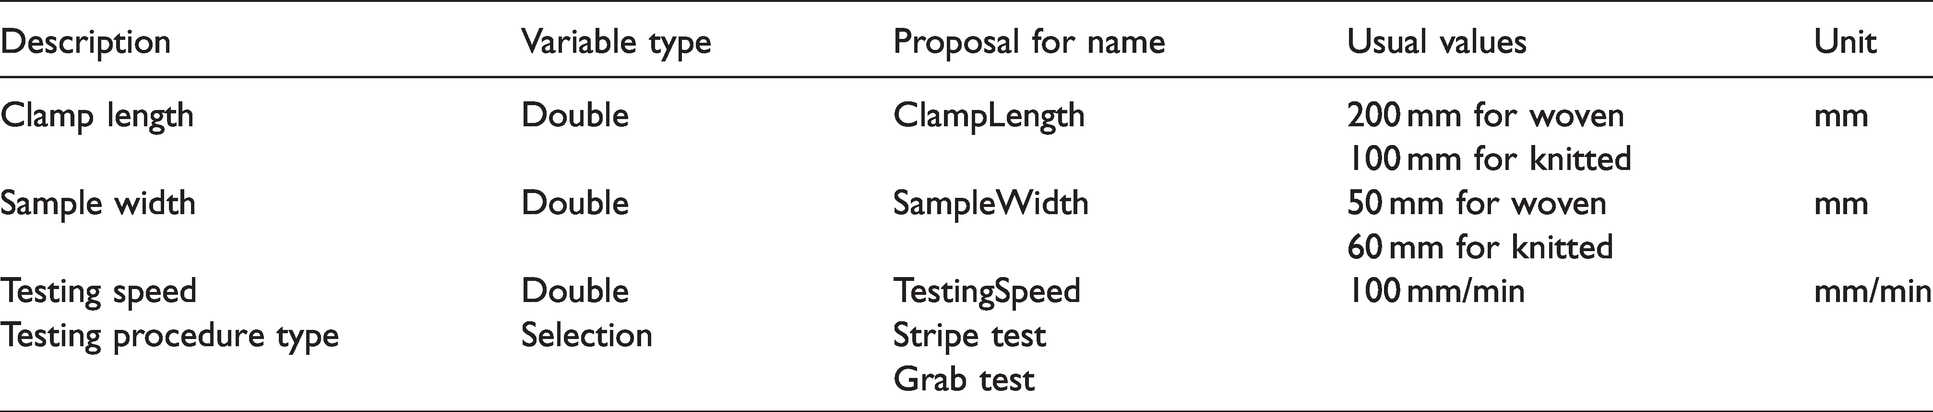
In drape simulation software, the elastic behavior of the fabric is represented normally by springs between the mass points (Figure 1(a)). A 0º orientation is normally assumed in the direction of the warp yarns of the woven fabrics (Figure 1(b)), in the direction of the loop columns of the knitted fabrics (Figure 1(c)) and in the production direction of all other fabrics and laminates. Using the generalized orientation based on the angle to the main direction as 0º and 90º allows the application of a unified system for coding of the directions of any sample type. In U3M format, for these directions, L, W and D are proposed for the length, width and diagonal, respectively, 16 but this has two disadvantages. The first disadvantage is that, in the case of rectangular or circular samples (for instance, for biaxial testing in the future), it is not clear which is the length. The second disadvantage is in the missing option of collecting data for additional directions, different from the length, width and diagonal. For anisotropy analysis tests are required in multiple directions. In this case, the angle of the loading force to the main sample direction has to be saved. Based on these considerations, it can be concluded that one attribute, “orientation,” where the angle between the main sample direction (length) and the direction of the applied load can be any number between 0° and 179°, is the best solution. For the simulation, the main directions 0º, 45º and 90º have to be used (Table 1).
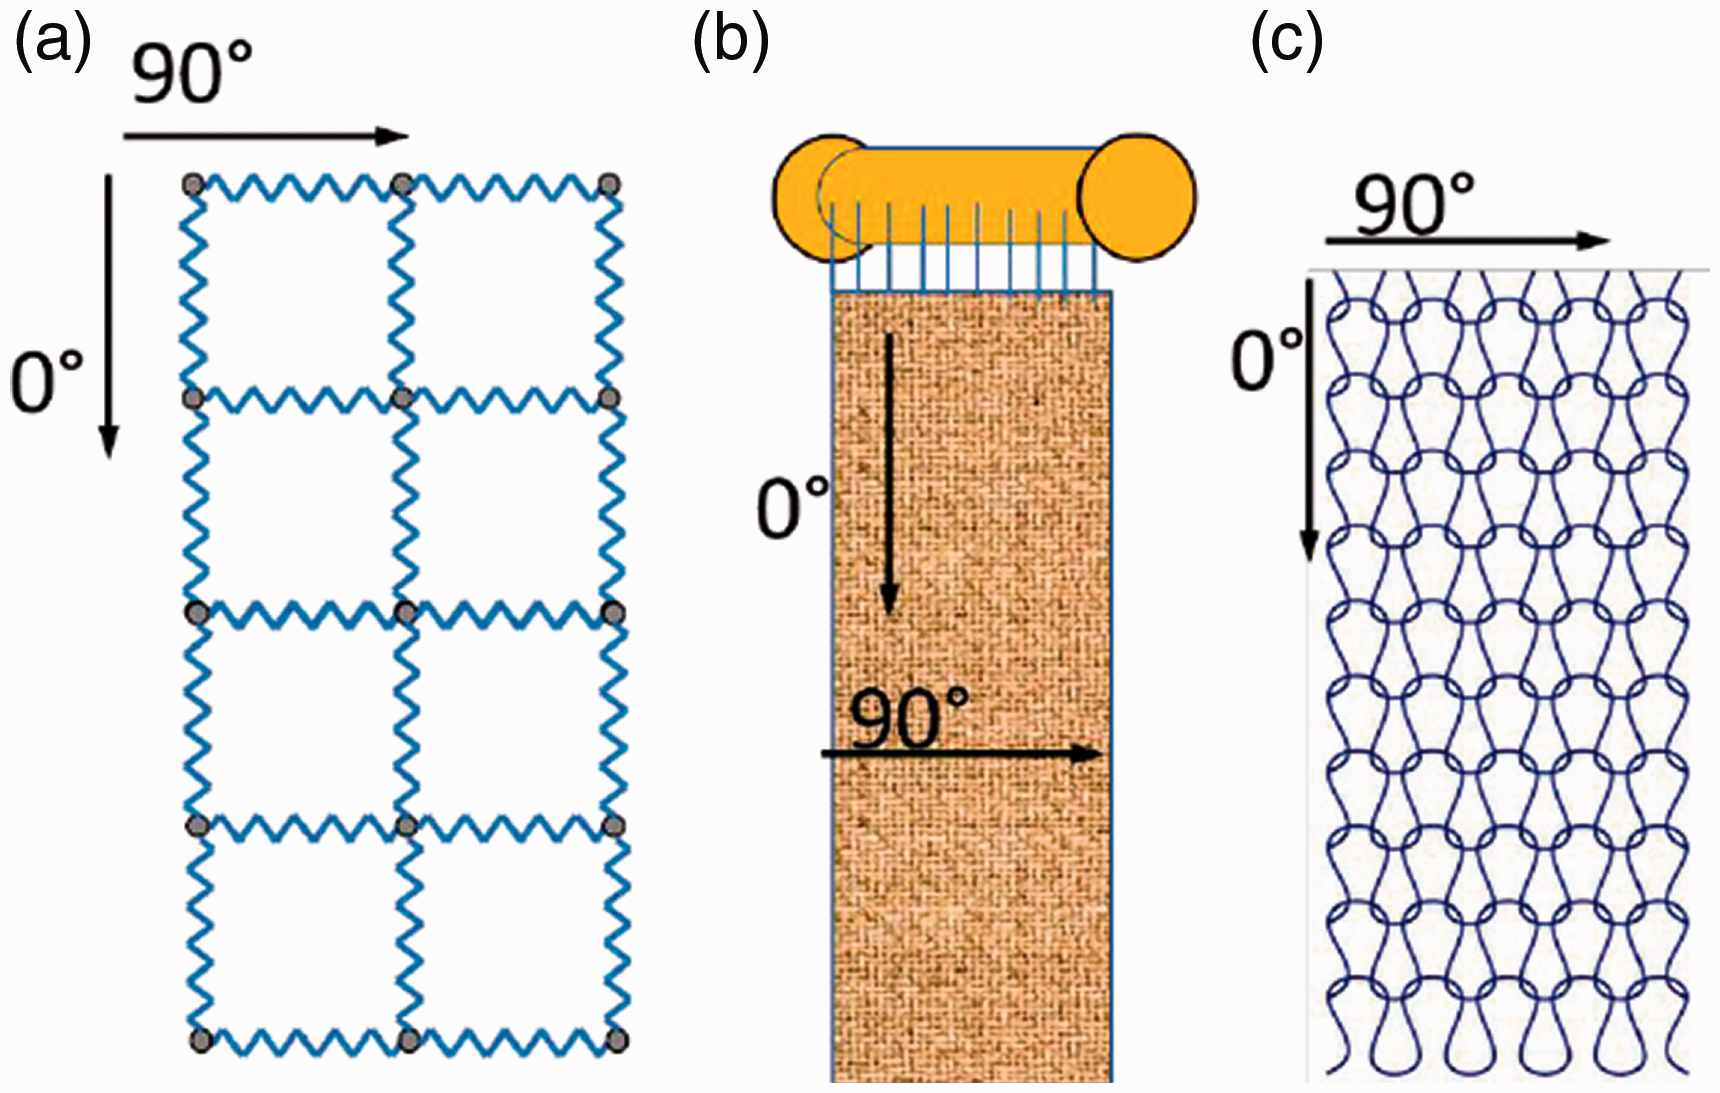
Main directions of textile fabrics: (a) mass–spring model for tensile behavior; (b) directions of woven fabrics; (c) directions of knitted fabrics.
Orientation attributes
Tensile behavior characteristics
Elasticity parameters
An example of the force–elongation diagram of a tensile test is represented in Figure 2.
Example of the force–elongation curve of textile fabrics.
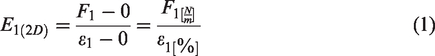
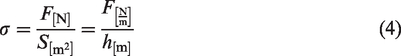
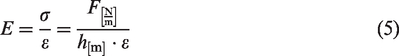
The usual diagram of textile material demonstrates clear nonlinear behavior. During the draping process, the tensile loads are exceptionally low and this nonlinearity can be neglected. For this reason, in most software, the springs in the 0º and 90º directions have constant stiffness K1, which is derived from the initial linear part of the curve and is related to the initial, tangential, Young’s – or elasticity – modulus E in the mechanics. The correct elasticity modulus in Pascal units is not commonly used in the textile mechanics, because for its calculation the cross-section of the fabrics is required. For fabrics it is reasonable for the normalized parameter for force per cross-section width per percent to be used, in order for unified dimensions to be provided.
The elasticity modulus is defined as
Software providers try to be more user-friendly and not confuse the users. That is why they use one of the following values:
force elongation
This leads very often to misunderstandings of the term “elongation of the fabrics,” because there are many values for elongations.
For the case of close-to-body clothing, compression textiles and other applications, the deformation of the fabrics can be higher than the limits 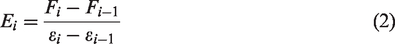
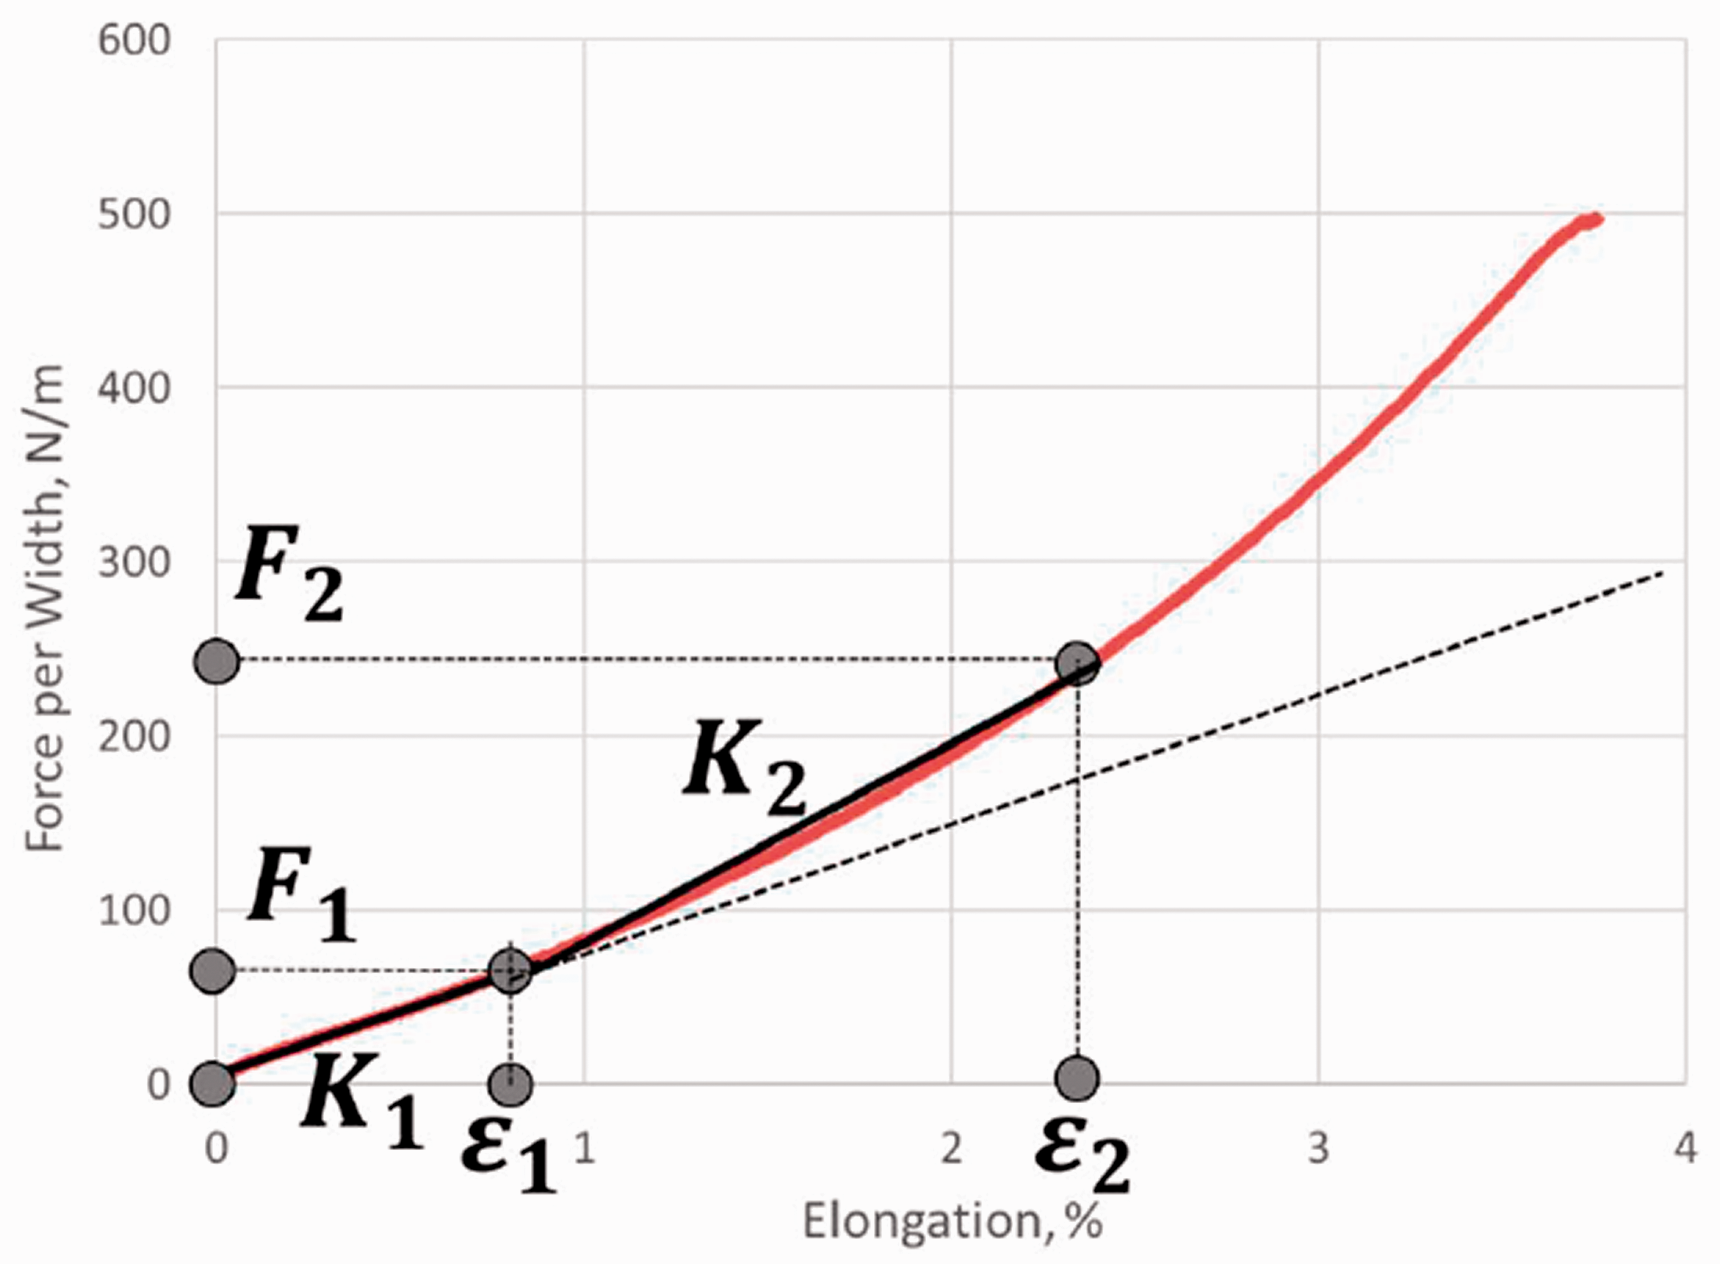
To avoid misunderstandings, it makes sense that the end of the linear elasticity limit and the elongation, used for the initial stiffness, are defined independently – one is required for determination of the stiffness and the other defines the limit of the initial linear elastic area (as visualized in Figure 3).
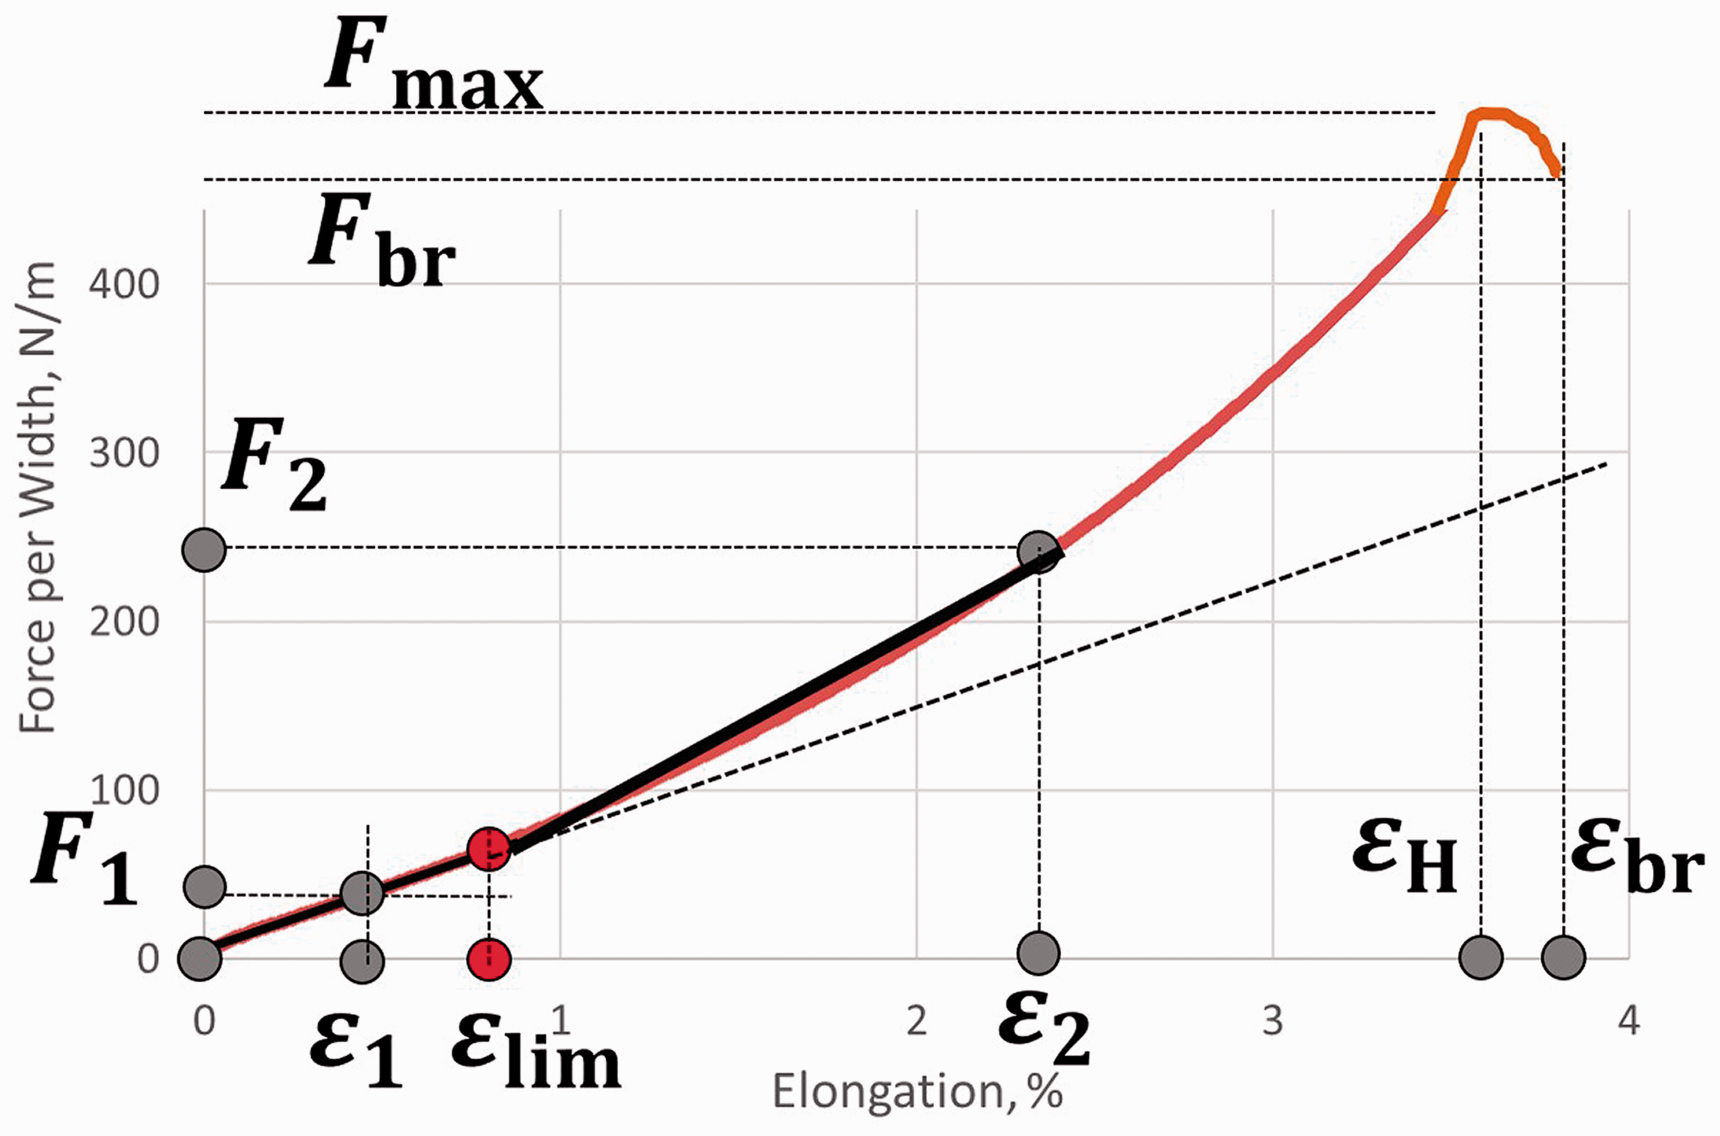
Example of important elongation and force values in one force–elongation diagram.
For several mechanical simulations, several parameters are required. The maximal tensile force
Parameters for the description of the tensile behavior of fabrics
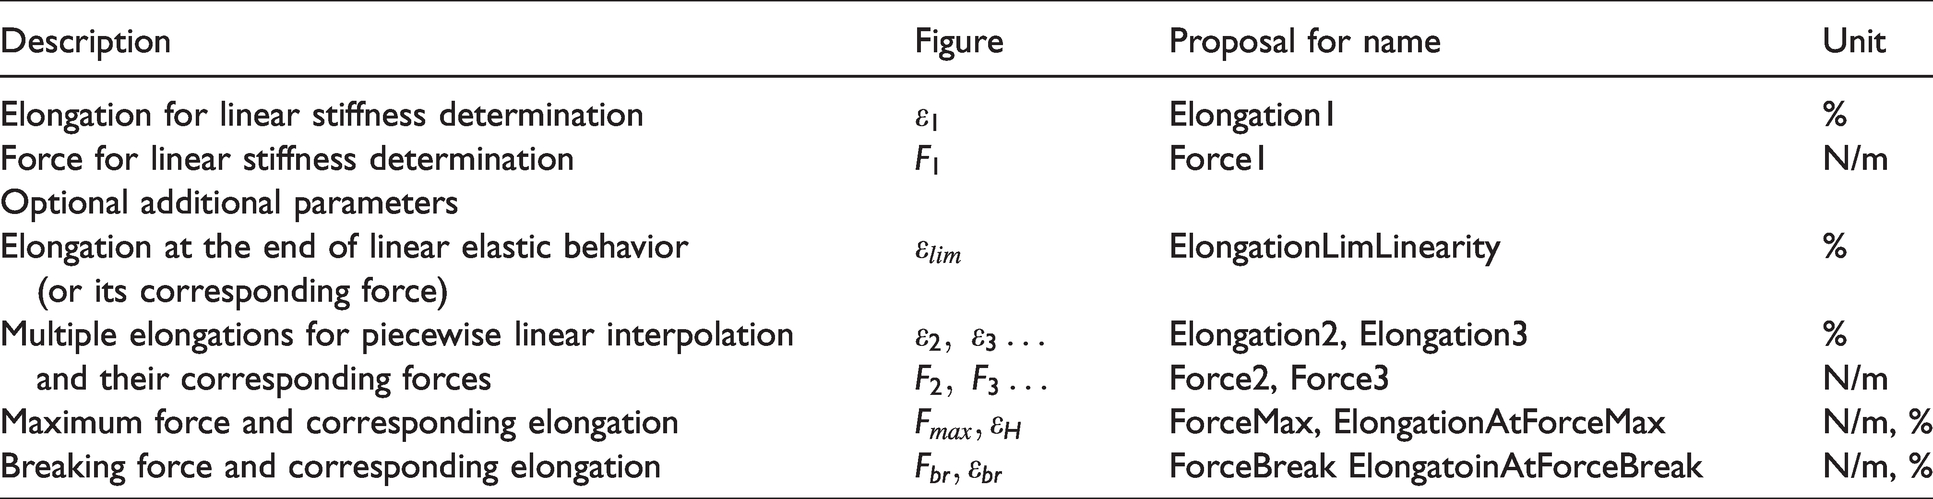
With these values, all the software vendors, researchers and engineers would be able to (re)-compute the required stiffness and the behavior of the sample for the different requirements of the different 3D clothing simulation packages.
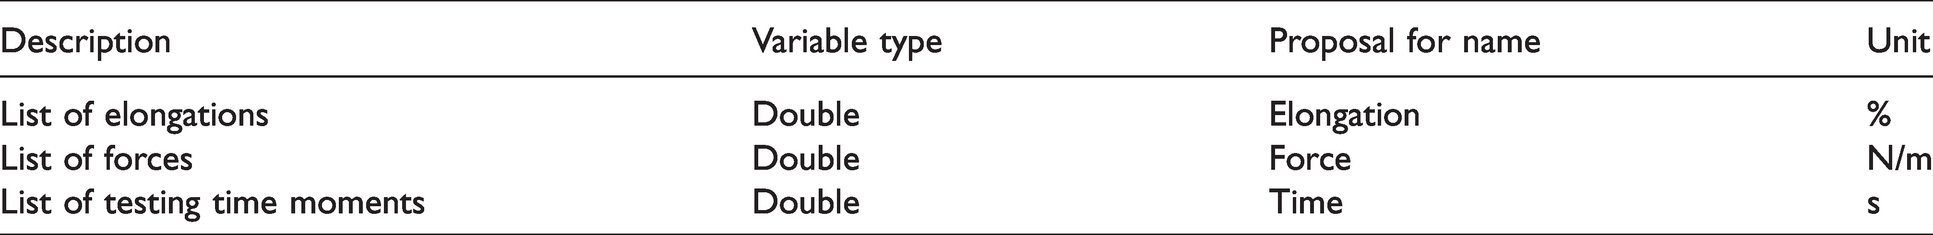
Another problem of fabric producers is that they are not always equipped with testing machines. A further serious issue is that they often do not know what has to be simulated with their sample and with which software. Because of this, they cannot provide all type of elongations and forces for each of the textile 3D pattern development software or for finite element simulation. It is important that producers can store the complete force–elongation curve after the testing process. This option is provided in the U3M 16 tool, but the data is saved in a suitable form for the sample geometry and as a list of pairs [e1, F1, e2, F2, e3, F3,…, eN, FN]. An independent and unified format should include normalized force in N/m (and not the force per any given width). The paired single list could be rearranged in a quick loop into two separated vectors of values of the elongations and forces. In the case that additional data have to be stored, such as for example electric resistance, pore size or other parameters, it would be more efficient to have the single parameters as single lists, as proposed in Table 3. Most testing devices and software are able to track and save the time at each recorded point. As this data is available, it makes sense to be provided, too, in order to allow for instance control about the testing velocity, which has influence over the values for viscous-elastic materials.
Proposal for storing the normalized raw data of tensile tests
Additional parameters
The theory and experiments prove that the tensile data depends on the sample size.24,25 The shorter the pieces are, the stronger the samples are, because the probability of getting weaker becomes lower. From another point of view, the textiles are polymer-based materials with clear velocity-dependent behavior, and the testing speed influences the properties too.24,25 Keeping in mind that there are two standard tests – stripe and grab for textiles – and knitted fabric behavior differs and often has to be tested by using a grab test or by using a wider clamp, this information should be in the complete record too.
It is well known that textile fabrics demonstrate large deviations in their parameters and at least three samples per width have to be tested in order to get acceptable statistical information. Clothing specialists do not always understand this requirement and often tend to use a single test, but in the fabric production is well known that the edges of the fabrics have different stress states than the central region, so they relax and behave differently.
Under the assumptions that the climatic conditions for the tests remain standard (20°C ± 2°C 65% relative humidity ±4% (following DIN EN ISO 139)), one normalized set of tensile data should contain the data as well, as proposed in Table 4.
Additional parameters for tensile tests
Based on this data, a mean curve could be calculated, deviations in the parameters could be evaluated and all required data about the elasticity modulus, elongation at given force, force at given elongation, maximum elongation etc. could be obtained for both zero (warp) and 90 degree (weft) directions.
Continuum mechanics values
For FEM simulation with shell and plate elements, the spring constant is not enough. For such a case the textile material is modeled usually as an orthotropic material for two-dimensional (2D) plain stress.
26
The relation between the strain and stress can be described as
27
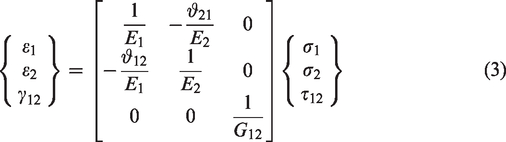
and then the real elasticity modulus is
If the testing data in both directions is provided, then both elasticity moduli E1 and E2 can be provided. For the complete description of the material data, the shear modulus G is missing, the determination of which is discussed in the next section, along with the Poisson’s ratio 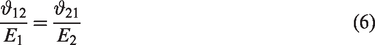
For the determination of the Poisson’s ratio, the lateral contraction of the fabrics has to be measured. This is not a common procedure in the clothing area yet, but is required if compression clothing has to be calculated. If the lateral compression of the sample during the elongation test is measured using an optical device for the computing of the Poisson’s ratio, the set of the elongations
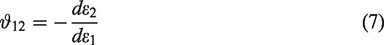
Poisson’s ratio storage
Biaxial extension or shear
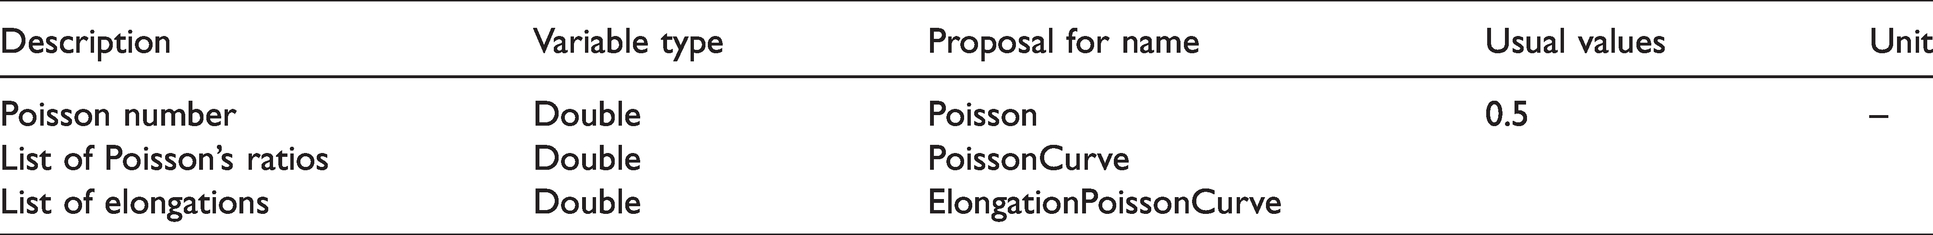
The proper modeling of the mechanical behavior requires knowledge of the shear modulus G, which determines the resistance of the fabrics against shear deformation as a relation between the pure shear force 
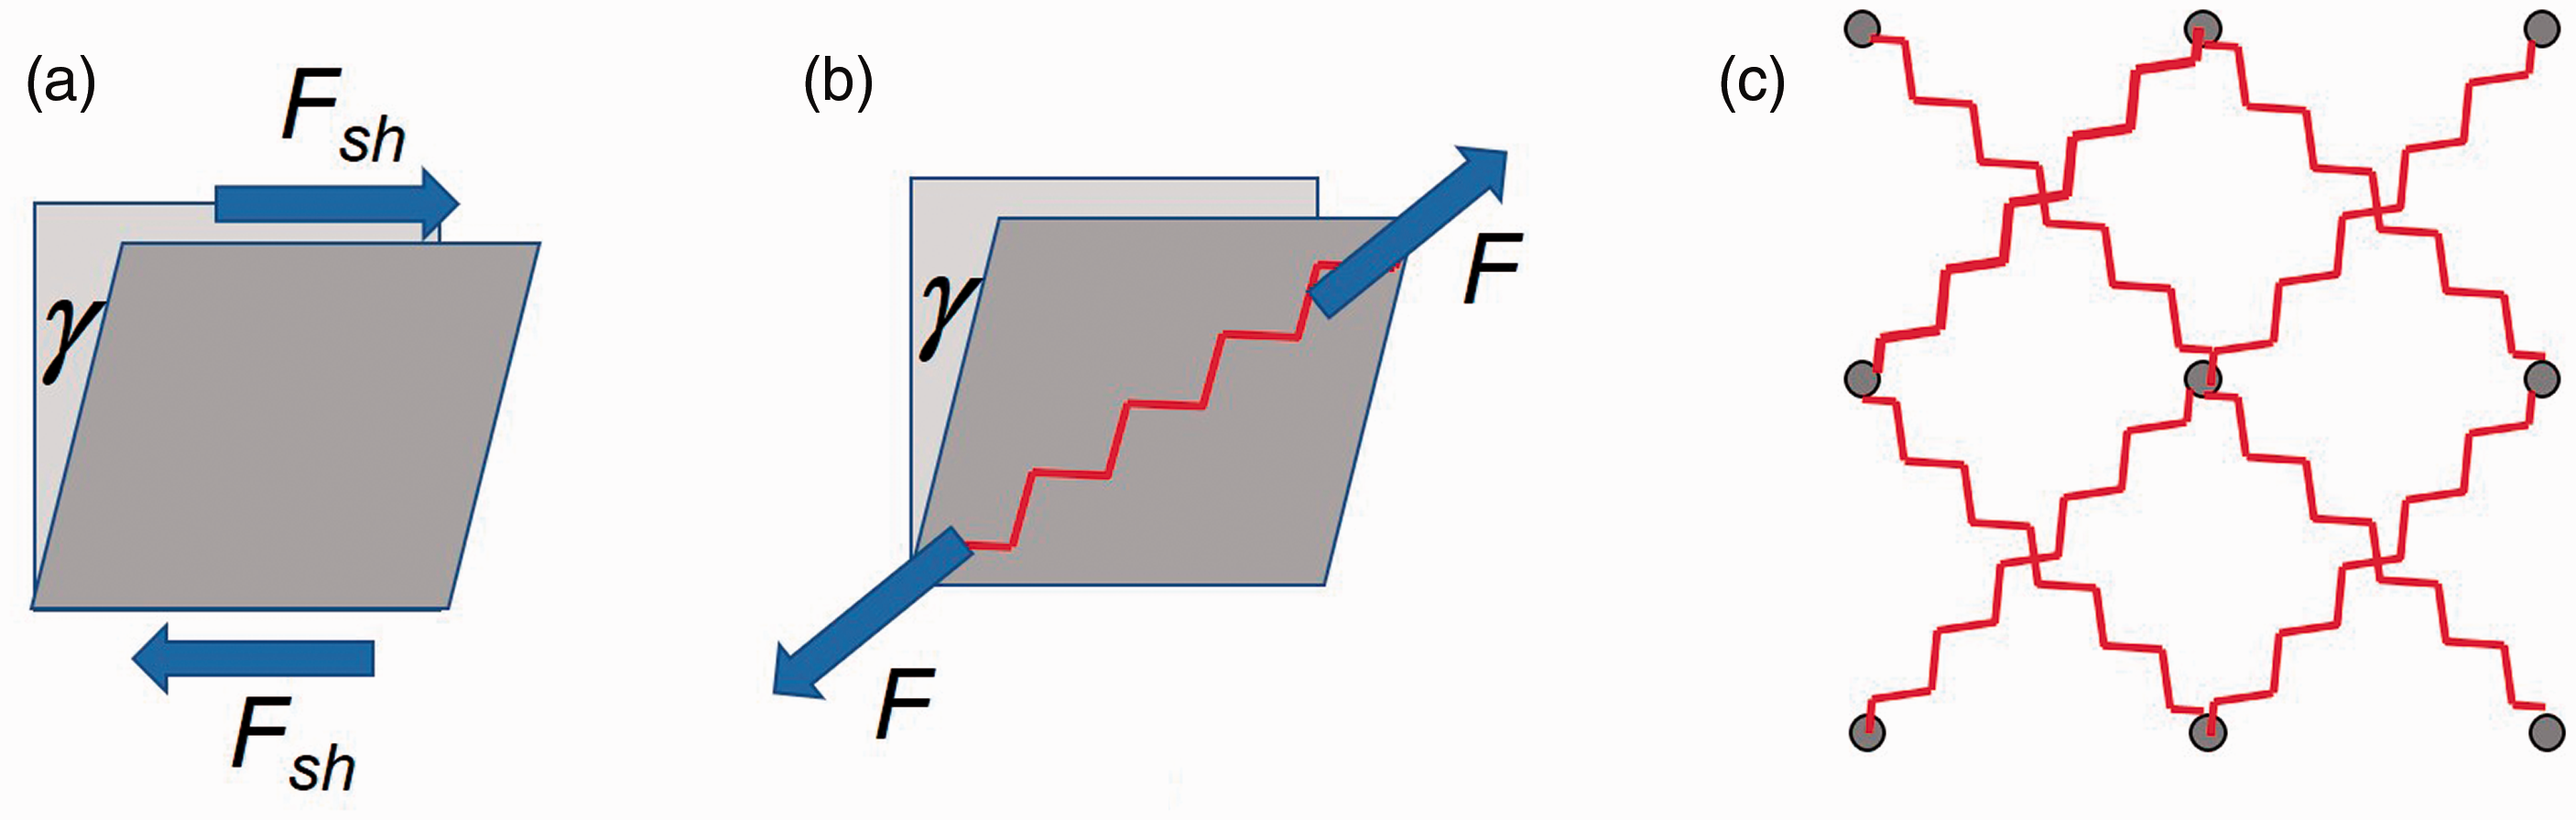
Modeling of shear behavior of fabrics: (a) shear forces and angle; (b) diagonal spring for the case of the picture frame test; (c) shear springs in mass–spring models.
Testing of the shear modulus is a complex procedure, the practical implementation of which is expensive and seldom available in the industry Kawabata Evaluation System (KES) device29,30 or a high-precision picture frame.
31
The picture frame is a kinematic frame with four links connected with cylindrical joints (Figure 4(b)), which can be mounted on any standard tensile testing machine. The shear force could be obtained by using the relation
The production of the joints requires high-precision techniques and materials, because any deviation from the parallelism of the axes leads to false forces based on the additional friction there. A larger problem is the clamping of the sample in the linkage and the definition and guaranteeing of the pretension in the initial state of the tested sample. Any pretension in one or the other direction can change the results, because it can influence the movability of the yarns. Despite of the technological difficulties and missing well-proven clamping and testing procedure, which provides repeatable results, this picture frame is used for characterization of the shear behavior of textiles especially for composites, because there the shear modulus G is required for the FEM simulations. In the clothing simulations, the effect of the shear is represented by a spring, which connects the diagonal masses (Figure 4(b)), representing the direct clamp force F of the picture frame and not the shear force
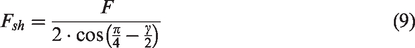
For this test, a sample with width w is placed under the 45° direction of the yarns or loops on a tensile testing machine with clamp distance L (Figure 5).
32
The diagonal D of the square area in the middle, where the material is loaded on pure shear (Figure 5(a)), has the length

Geometric relations of the bias extension test following the work of Boisse et al. 32
Bending stiffness in
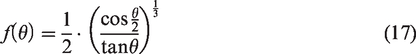
and the shear angle 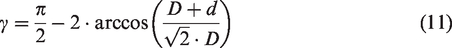
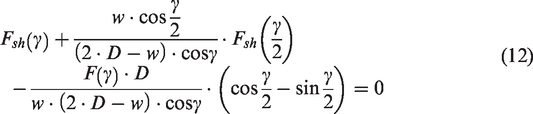
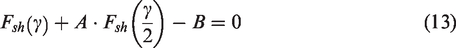
Based on the energy relations in the different areas obtained by Boisse et al.,
32
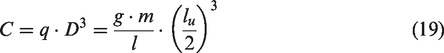
the shear force can then be defined by the nonlinear equation
Based on the analysis of the literature, it can be summarized that for the shear properties several different sets of data could be available – the clothing simulation software requires spring stiffness, while the FEM models require shear modulus, and different testing devices can be used. For the diagonal spring stiffness, the same raw data set from the tensile test can be used – where both different forces and elongations and the data set are provided. The sample width and clamp distance have to be available. For these properties it makes sense in the data structure for a main group for shear to be defined and after that subgroups for the separate device types to be available (Table 6).
Groups and subgroups for the raw data in the shear-related measurement
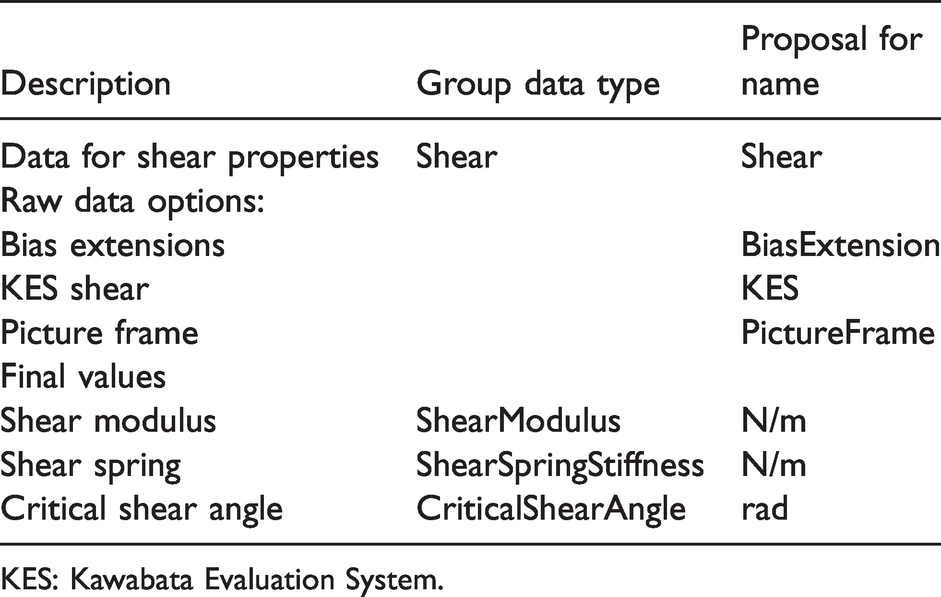
KES: Kawabata Evaluation System.
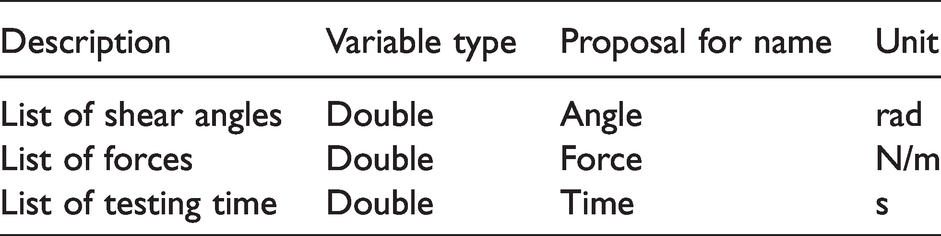
In the case that KES or picture frame data is available, the lists of the forces, shear angles and, in the best case, the testing time have to be saved (Table 7).
Shear angle, force and time variables
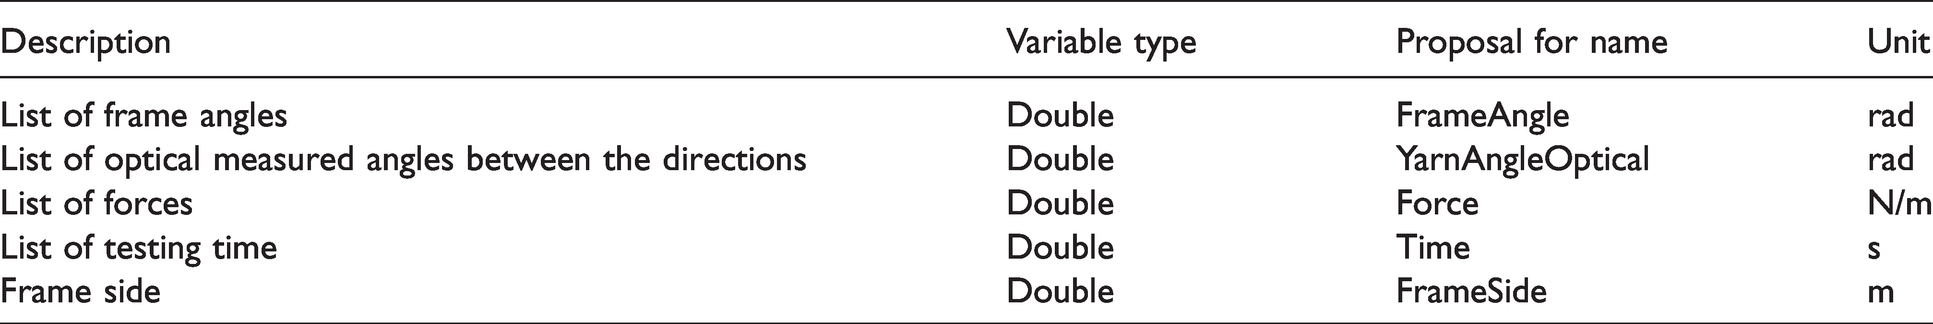
In the normal case, the picture frame is combined with an additional optical device and analysis of the angle between the yarns. This data is essential, but in order to avoid confusion, it makes sense to use separate variables FrameAngle and YarnAngleOptical (Table 8).
Angle between the yarns for pictures
With these data, procedures for computing of the required shear modulus and spring stiffness can be developed and integrated.
Bending
Textile materials are soft materials and, in several modeling works and tasks, their bending rigidity can be neglected, but for draping simulation in both clothing and technical textiles and composites, bending is of great importance. This is modeled normally as a linear spring between two masses 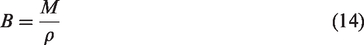
Even if some differences and inaccuracies in the measurement are observed, in 1951 Abbott42,43 found that the most promising and simple method for realization is the cantilever test, proposed by Peirce
44
in 1930. During this test, for which the theory is explained as well by Wei,
45
the left-hand edge of the sample is fixed on a horizontal surface and the right-hand side falls down only under the action of its gravity. Having the sample mass m and its length 
Peirce
44
introduces the bending length (which is different from the hanging length) as

The angle 
Then the bending rigidity can be calculated based on the linear elastic beam without shear effects in the cross-section as
If it can be assumed that the mass of the sample and its length are measured with good enough accuracy, the accuracy of the bending rigidity estimation depends only on the human who performs the experiment. The correct reading of the hanging length
In the literature are described several other testing methods and machines for determination of the bending stiffness of soft materials. They use stripes in different initial geometry, often as a closed circle, similar to loop forms and pure geometrical measurements. 39 As demonstrated, 39 they deliver comparable results, but the evaluation of the results requires again conversion to nondimensional parameters, polynomials of a higher degree and numerical procedures that are not easy to apply by fabric producers. There are as well devices based on the precise measurement of the bending moment or reaction forces51,52 and, of course, the classical KES device. 29
Some of these methods can have advantages for very soft or very hard structures or avoid irregularities based on free edges, etc., and it is advisable to keep an open data set prepared for using this data, too. For this data, separated optional blocks in the data structure have to be used, with specific information about the method, sample geometry parameters, etc. (Tables 9 and 10).
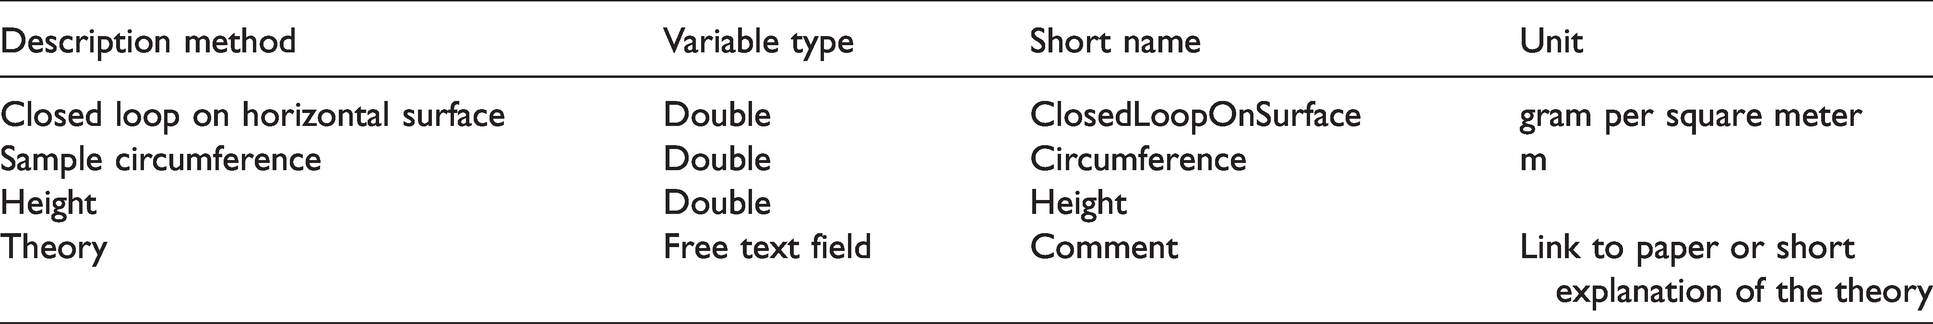
Parameters for the closed loop method 39
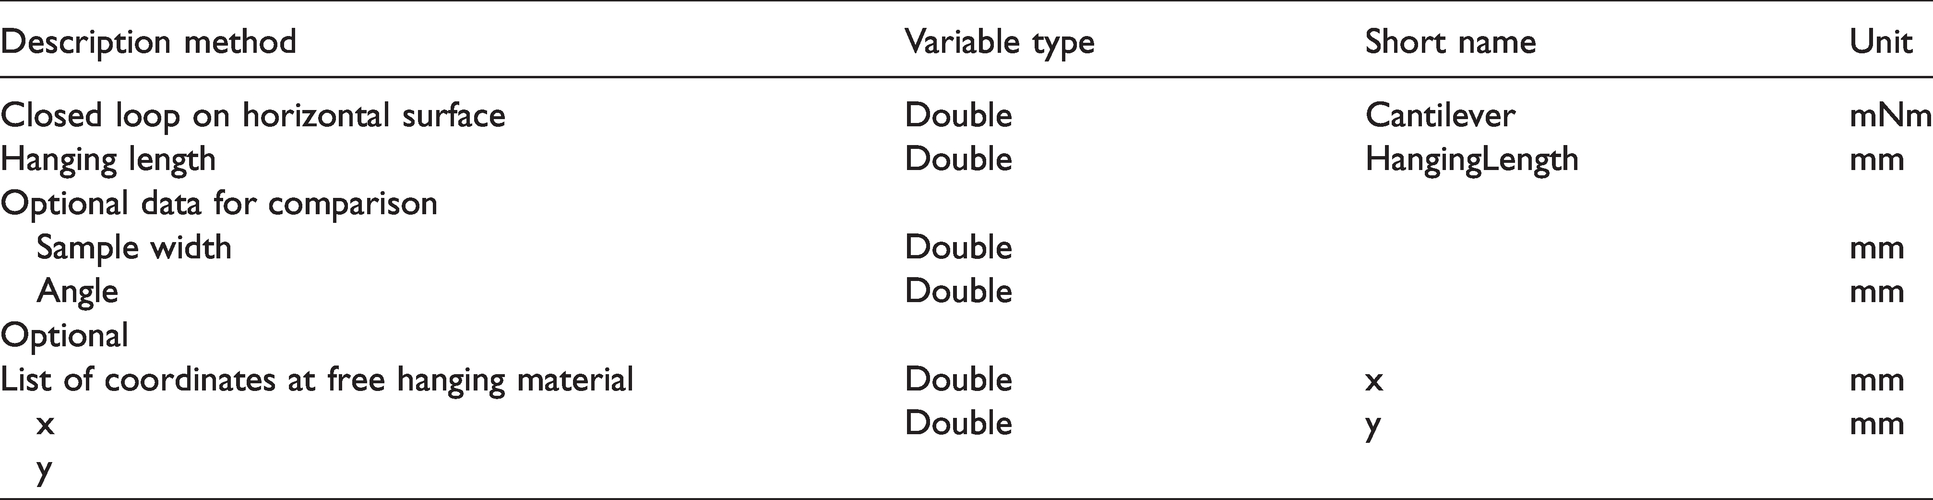
Data fields for the cantilever method
Independent of the measuring method, for the bending rigidity itself the mean value has to be available and optional different data groups for the raw data sets based on different methods have to be provided.
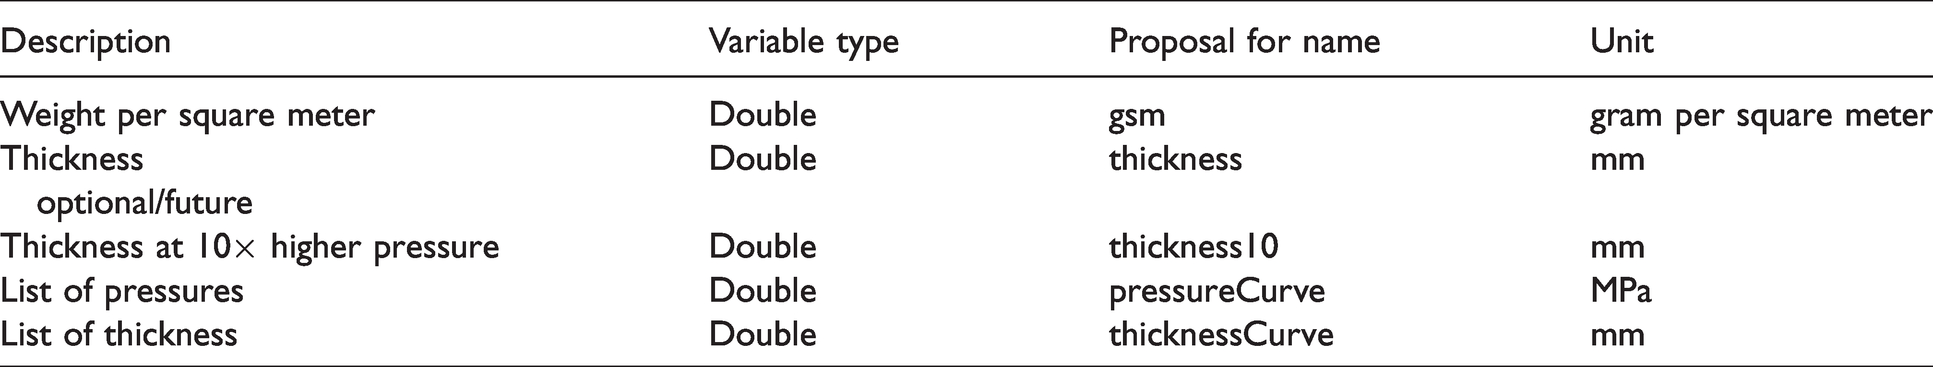
Weight and thickness
The measurements of the specific weight and thickness of the fabrics are well known and described. For these parameters, single values are enough. For the measurement of the thickness it has to be considered, however, that in the norm a specific pressure (0.1kPa for textiles, DIN EN ISO 5084) 25 is defined and it has to be used, otherwise the measurement will not provide reproducible values. For various materials, such as fleece, down jacket fillings, etc., additionally, the lateral compressibility is important. The standard defines “compressibility” as thickness at 10 times the higher measuring pressure. Principally, the thickness of the materials is reduced during the compression and at some point reaches a final point, after which fewer changes occur. For such detailed simulation for the future for this purpose the complete set with “pressure–thickness” can be useful, in the same way as it is stored for the compressibility of yarns in the software Wisetex53,54 (Table 11).
Parameters for weight, thickness and lateral compressibility
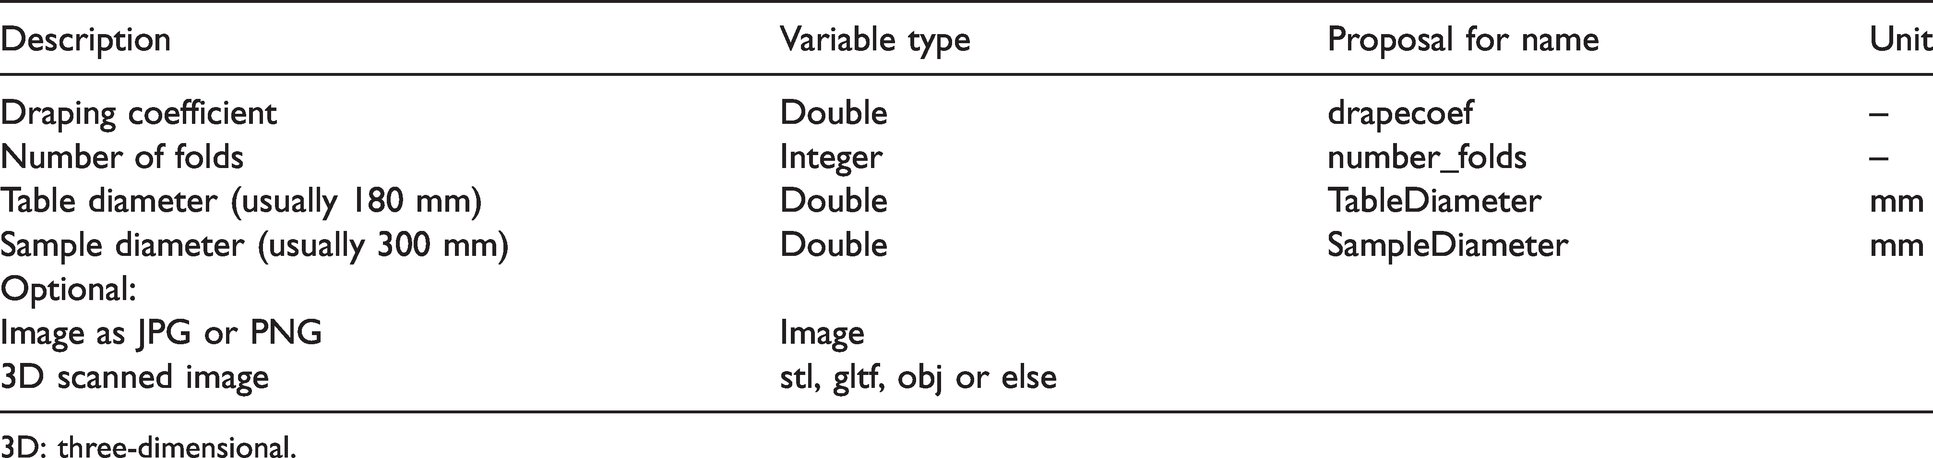
Draping coefficient and volume
The draping coefficient normally is not used as an input parameter for the simulations, but the existence of this value, the number of the folds or even images of the draped fabrics allow a quick check of the remaining values. The coefficient itself and the number of the folds are two numbers that can be obtained by using an optical device. It is advisable that the information about the testing sample is added too, because the sample size influences these coefficients (Table 12).
Draping parameters
3D: three-dimensional.
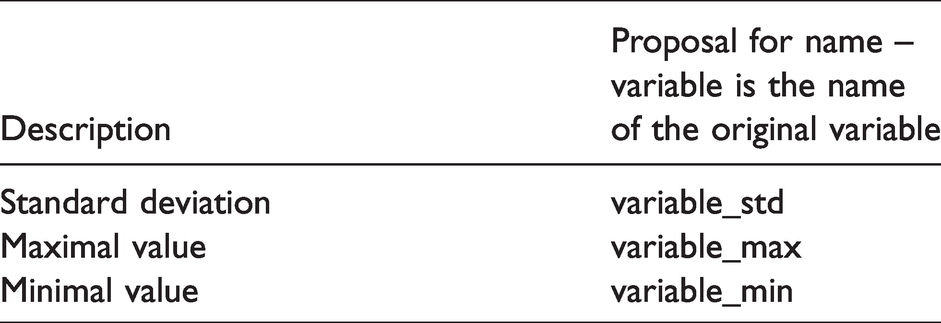
Statistical data and units
In order to allow sensible analysis with the data and evaluate the errors for all mean values, at least the standard deviation should be provided. In praxis three tests are often made, where the computed standard deviation under- or overestimates the real distribution. Optional here is to provide the range of the raw data with minimal and maximal values. All of these values can be stored in the fields of the main variables, using the same variable name with a suffix (Table 13).
Statistical details for the parameters
In several situations for samples with different scales (very fine, microfibers and micro textiles, very large – architecture membranes), the selected scales lead to overfilling or poor rounding of the numbers during the calculations. Adding a field for the units for each specific group of properties would allow using different units and scales and avoid such problems. The lists of the allowed derivative units, Pa, MPa, GPa, or m, cm, mm, can be defined in the format specification.
Implementation
Workflow
The identification of all required parameter values requires tests on different machines, where the raw data has different formats. The different devices, sample types and file types build one complete “raw data set.” In the tests, where multiple curves or values are available it makes sense for a mean curve to be calculated, if possible, as well minimal and maximal curves, too, and to be stored in a normalized way as a “normalized raw data set” for detection of the single parameters. For example, in the case of tensile testing, the raw data can be saved as force in Newtons per 5 cm versus clamp motion by the testing machine, but it has to be normalized into Newtons per meter versus elongation for the analysis. Using the normalized data will allow the development of unified algorithms for the extraction of the required values independent of the origin. This is a significant difference to the currently proposed format in U3M, 16 where the raw data is device-related. Figure 7 presents an overall structure of the proposed and implemented method in a software workflow.
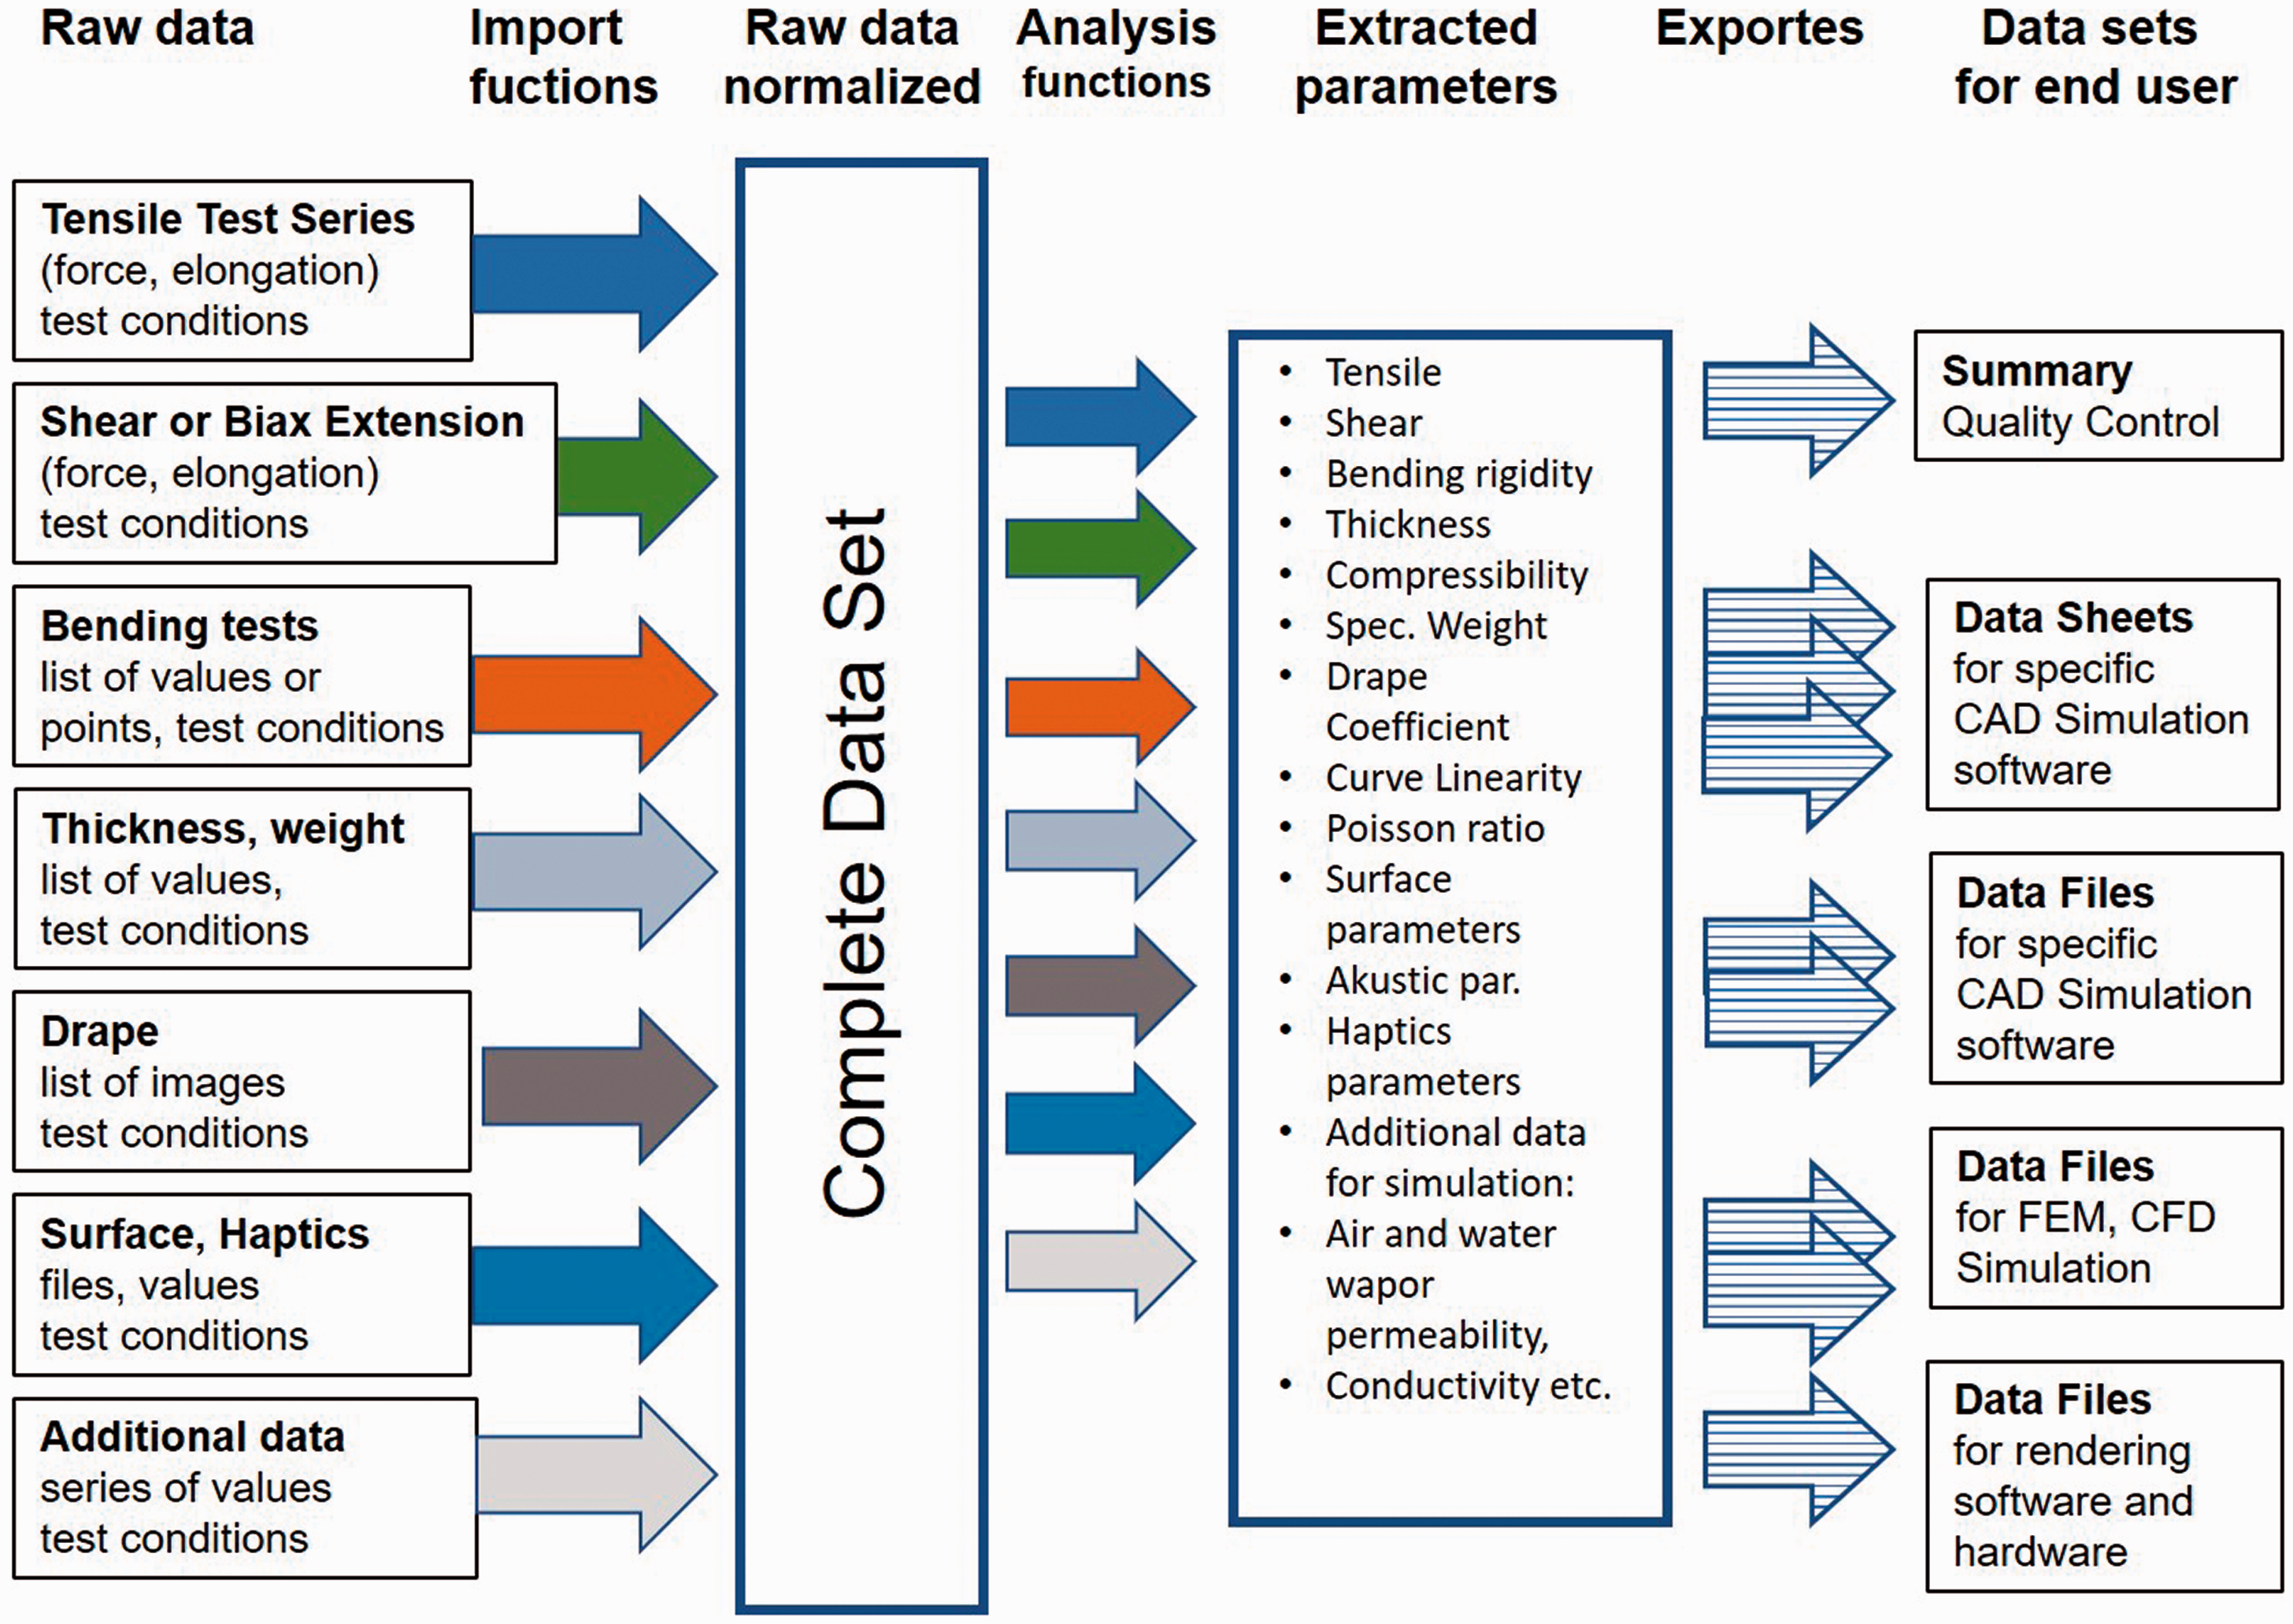
Overall structure of the data analysis workflow and modules. CAD: computer-aided design; FEM: finite element method; CFD: computational fluid dynamics.
Data format
There are currently various possibilities of formats for saving the complete data set. The complexity of the data, with the several levels and subgroups, requires a structure language, such as XML or/and JSON. XML in X3D format 55 is used widely in the web for 3D visualization, while JSON is the basis of the GLTF 56 format, which is in active use and development for 3D visualization, too.
Once the language descriptors, the units and orientations are approved by the community and the software developers, there is no problem with both formats XML and JSON being used, so that the material data block can be quickly included in any XML- or JSON-related file formats. The practical implementation in Python langue as the dictionary allows automatic saving and loading of the structure as JSON, using the built-in modules JSON and, for instance, dicttoxml, 57 allowing quick conversion between both formats. Example files and a module for saving and loading of the files are uploaded to github at https://github.com/virtualtextiles/fabrics-drape-data.
The final data file currently has four levels of groups, as visualized in Figures 8 and 9. The extracted parameters can be stored in separated subgroups for the different providers.
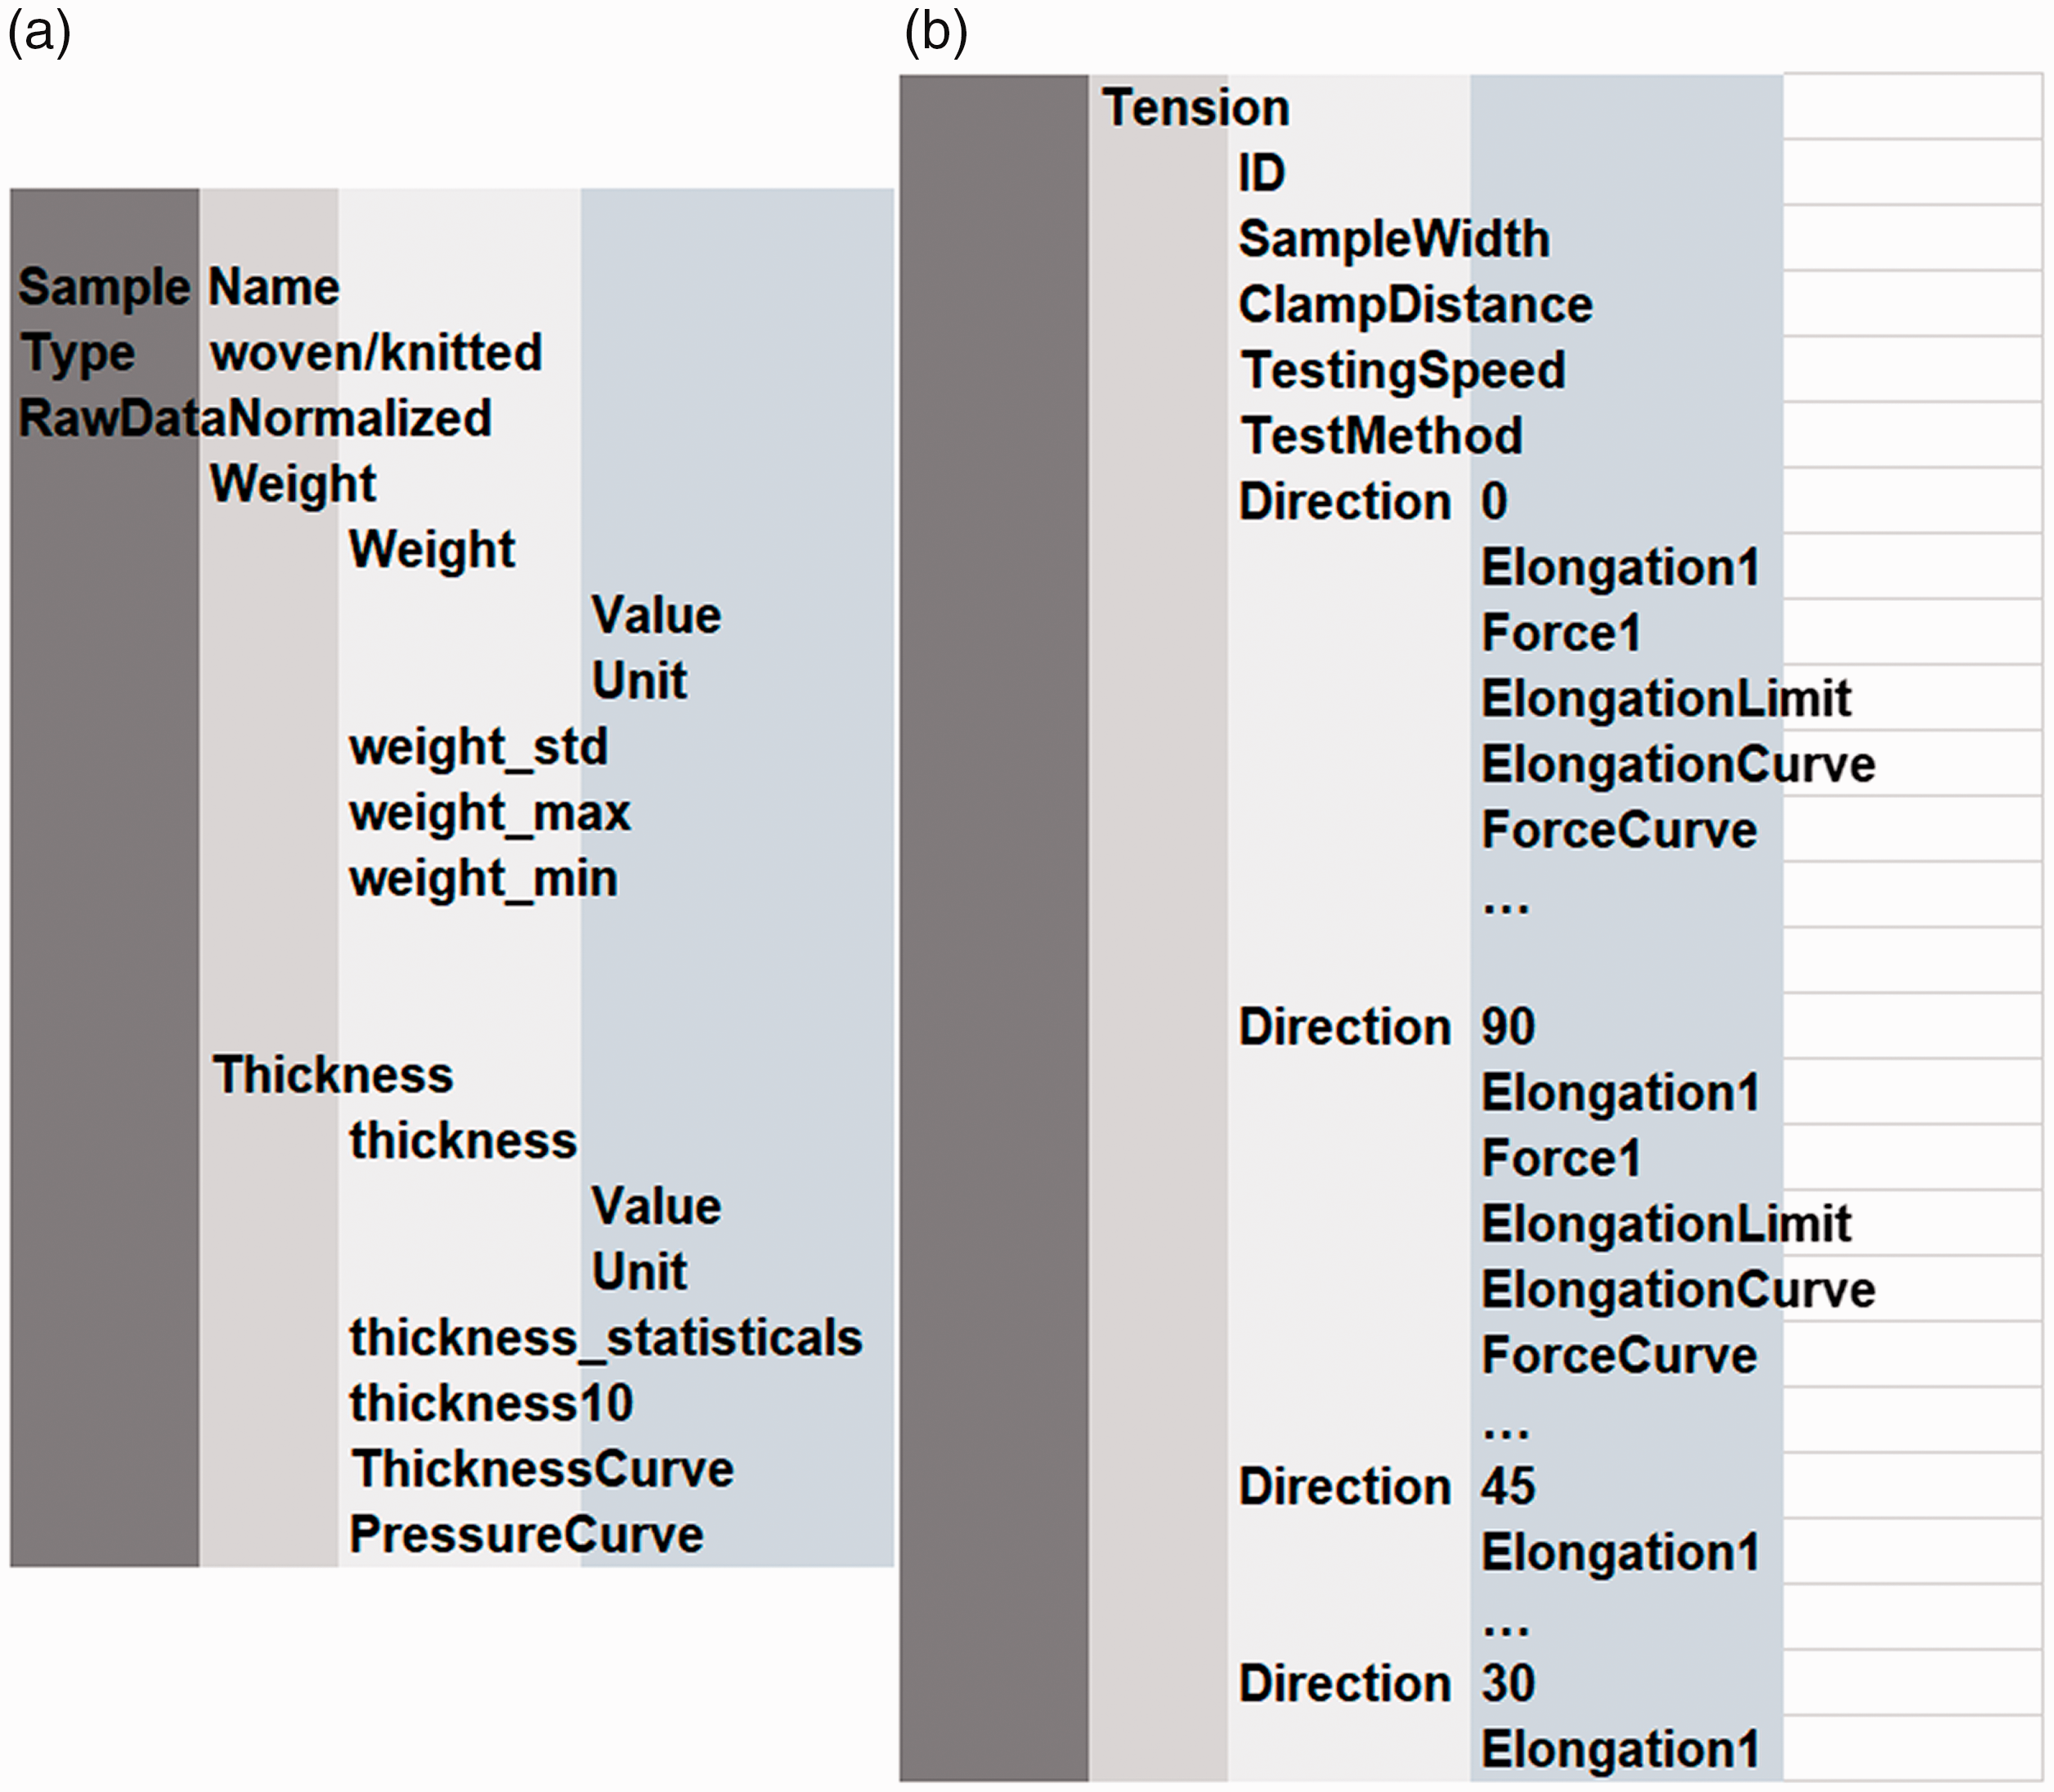
Visualization of the levels of the parameters. (a) Weight and thickness and (b) tension.
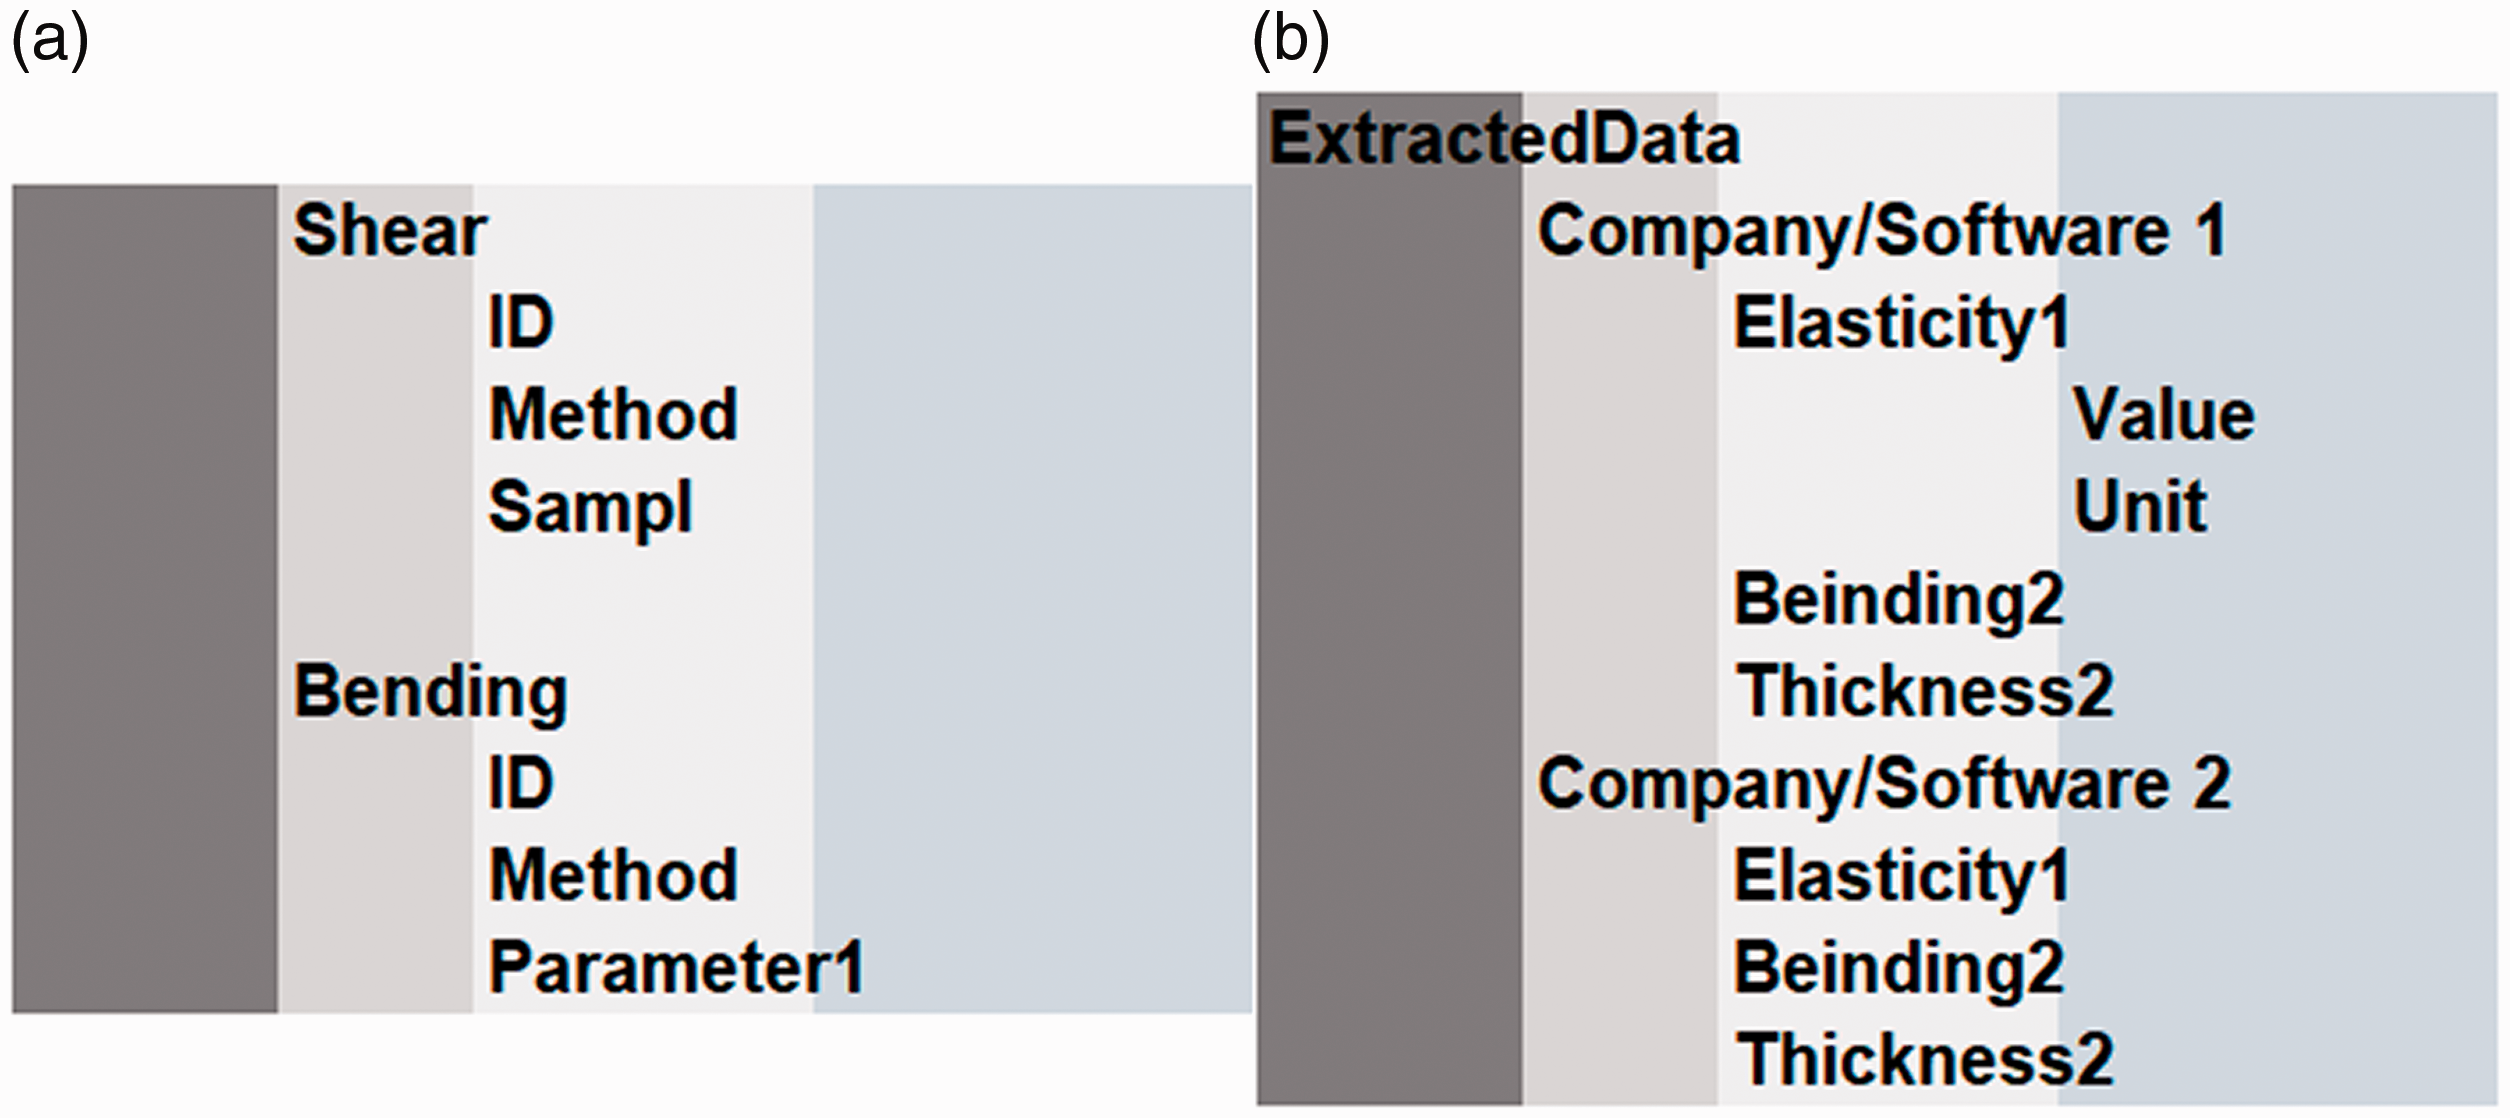
Visualization of the levels of the parameters. (a) Shear and bending and (b) extracted data for different software tools.
Raw data storage and processing
The workflow presented in Figure 7 was implemented as Python software for reading, normalizing and evaluating the data and extraction of the parameters. In order to automize the process, a certain convention for the storage was used. The data for each testing material is stored in a separate folder. It consists of one specification file with information about the type of the fabric (knitted, woven) and single values, such as thickness and weight. The remaining testing data from the testing machines is distributed in subfolders with names “tensile” and “bending,” each of which containing subfolders named “dir0,” “dir45” and “dir90,” where “dir” means direction and the number after that is the orientation of the sample during the test. Using this convention, additional tests at different angles, such as for instance “dir10,”, “dir20,” etc., can be stored and processed in the same way, in this case for instance the anisotropic behavior has to be investigated. An additional folder, “drape,” consists of drape images. There can be more, such as for instance calibration images, drape coefficient testing images and images from other points of view for control.
The single test results as CSV, TXT or MS Excel files are stored depending on the direction and the test in a suitable place. The software asks for the sample folder and in a defined sequence analyzes all tensile curves, normalizes these, compute the mean curve and extracts the required values, currently for the Software Assyst Vydia 3D, but additional tools and FEM material charts are under development. For more compact storage, the complete folder can be used under the same convention as a ZIP file, which is then opened in the memory and processed. The advantage of such an approach against HDF5 is that the ZIP file can be directly opened and analyzed without special software. Figure 10 represents an overview of the graphical interface for the evaluation of one sample.
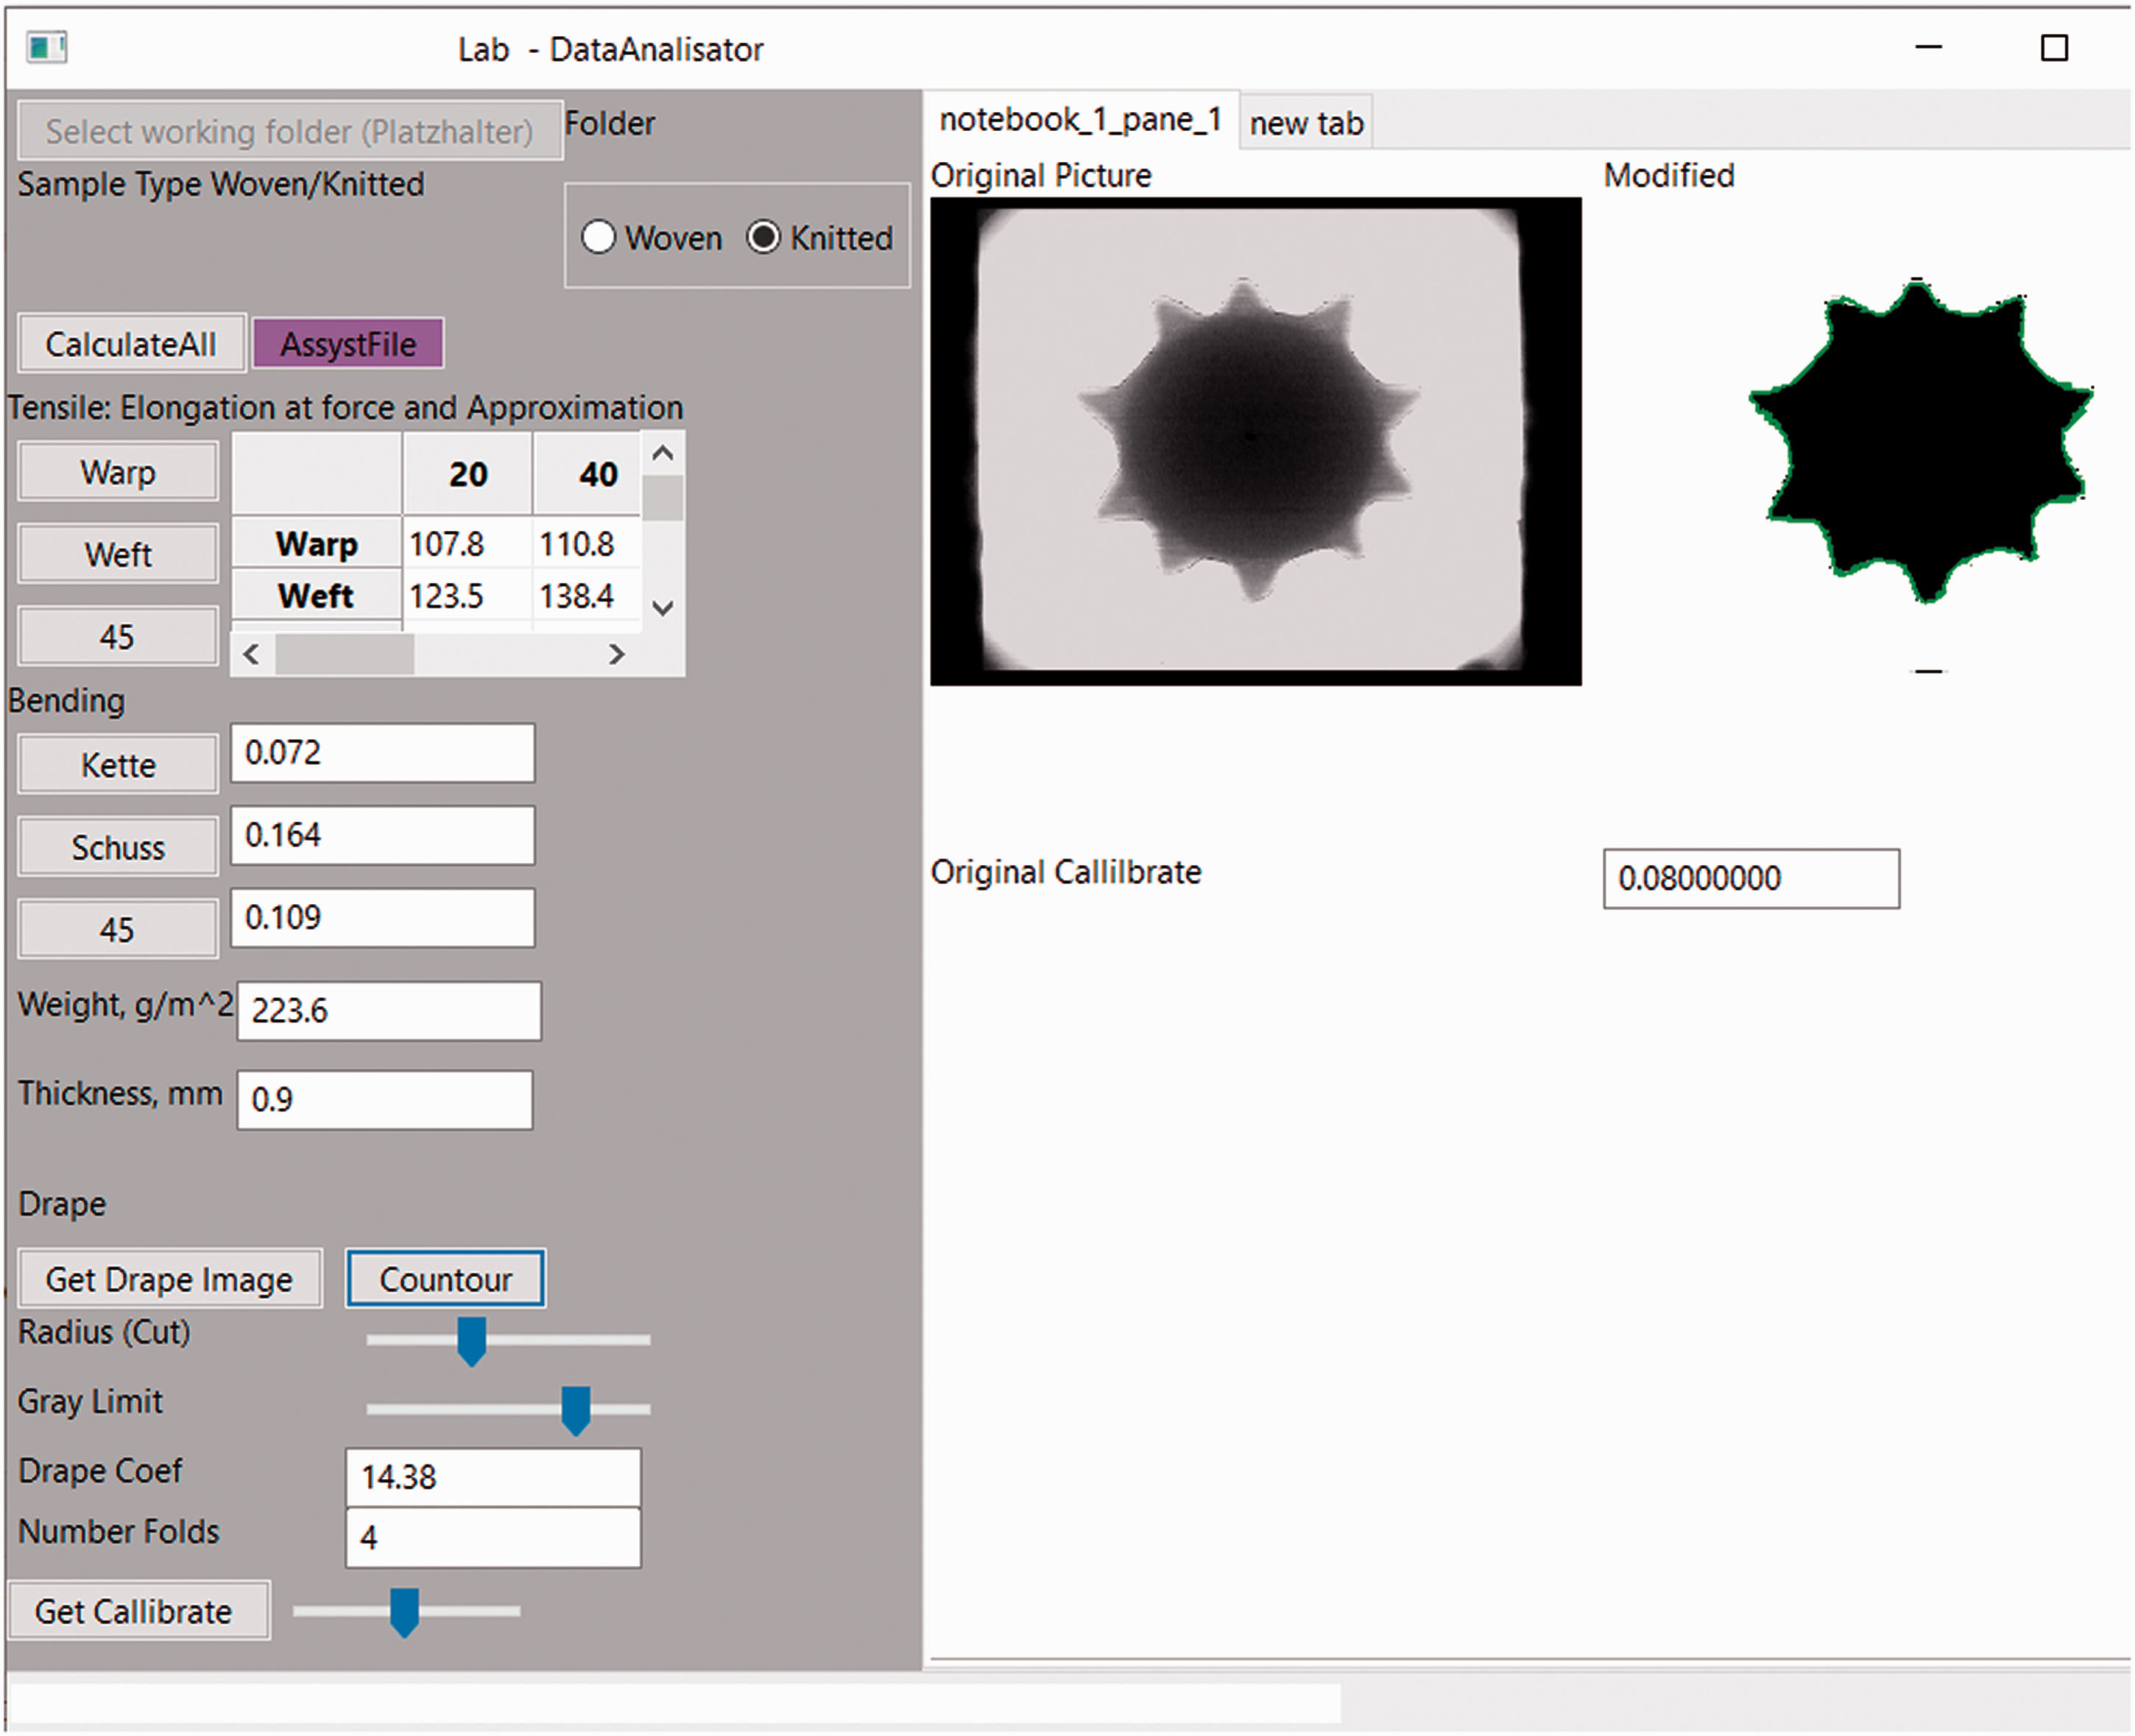
Graphical interface for the visualization of the results from the raw data analysis.
Practical evaluation and discussion
The proposed data structure and software were implemented and applied practically. The first larger use was for the analysis and preparation of data sets for 72 awarded materials for Exhibition https://www.ispo.com/munich provided throught the platform of Foursource https://foursource.com/, which had to be processed within two weeks. In this case, no statistical data about the time and effort were collected, because of the urgency of the task and the required additional fine tuning for serial processing of all samples. The expected positive result was that the collected data of all samples was processed within 4 hours after the last data record from the testing machine was saved. The manual extraction of the elasticity modulus and remaining parameters and their entering in a format suitable for the computer-aided design (CAD) system would take approximately one additional week. At this step it was observed how important the integrity of the raw data set is. Beside the explanations, for several samples the subfolders were created not exactly following the name convention “dir0,” “dir90,” but rather adding an empty space between the abbreviation for “direction” and the number, in the form “dir 0” and “dir 90.” This recognizable additional empty space was the reason that the software did not find the data for these samples, and it required about 2 hours of debugging time to find the reason for it. After, this case was created as a separate script, which creates an empty folder structure per sample, so that the data has only to be placed there. Despite this solution, this problem demonstrated that the simplicity and the available direct access to the folder structure has its disadvantage. One advanced solution to this problem could be the development of software that allows the selection of the data per drag and drop or file dialog and copies them in the required subfolder in a ZIP archive, for instance, as the current open document files for word and sheet processing (DOCX and XLSX) are working. Principally, it is the same idea as the HDF5 format, but the pros and cons of the selection of the (ZIP) archive versus hdf5 requires separate technical comparison, which remains independent of the required naming, units, methods and folder agreement.
Another convention problem was the missing knowledge about the behavior of the CAD software if some fields are not filled with numbers. The bending rigidity for several samples in the direction of 45º was initially tested, computed and provided as a number in the given field. After receiving information from the company that this value is currently not being used in the software, this test (bending rigidity in 45º) was skipped for the remaining untested samples. For the samples where no number was provided, the software wrote “nan” in the exported file. This file could not to be imported in the CAD software and the problem was solved by writing of a default number there, but it principally demonstrated that additionally some agreement has to be found regarding the storage of data in a field where no information is available. One reasonable solution would be that the importing CAD software detects by itself these fields and decides depending on the importance of the fields which steps are required – getting a complete error, accepting the remaining data and filling this field with a default value, reporting or not. Another solution would be the adding of an additional attribute to each of the extracted parameters – coding such as “0 data missing,” “1measured,” “2 missing, but set to default” – that would keep the records both useful and complete.
In addition, the second largest application of the software and the data set convention was observed more systematically. The following numbers do not present results of a statistically planned experiment, because this would require comparison among more persons with different qualifications for the same samples. They present only the recorded observation of the application in the real testing case of set of 11 materials (six woven and five knitted), processed by a team of four persons with different qualifications and speeds.
The process of the preparation of the samples for testing and the testing represents the main time-consuming part of the sample digitalization. The procedure of receiving the samples, creating folders for the data, cutting of the samples (excluding the 24 hour time of conditioning under standard climatic conditions), testing and after that copying all data to the proper place took in total 25.3 working person-hours for all 11 samples, where the tensile tests were performed only once per sample and not at least three repetitions (the data was less relevant for this case). The results in 2.3 hours (2 hours and 18 minutes) per sample set of pure testing and working time, while the knitted samples required longer (approximately 2.5 hours) than the woven (approximately 2 hours). Near the mean value, the large deviation between the testing persons and their experience has to be considered. A difference of about 1.2 hours in total between the fastest and slowest person for single pieces was estimated, and based on the smaller number of persons was not more precisely statistically analyzed.
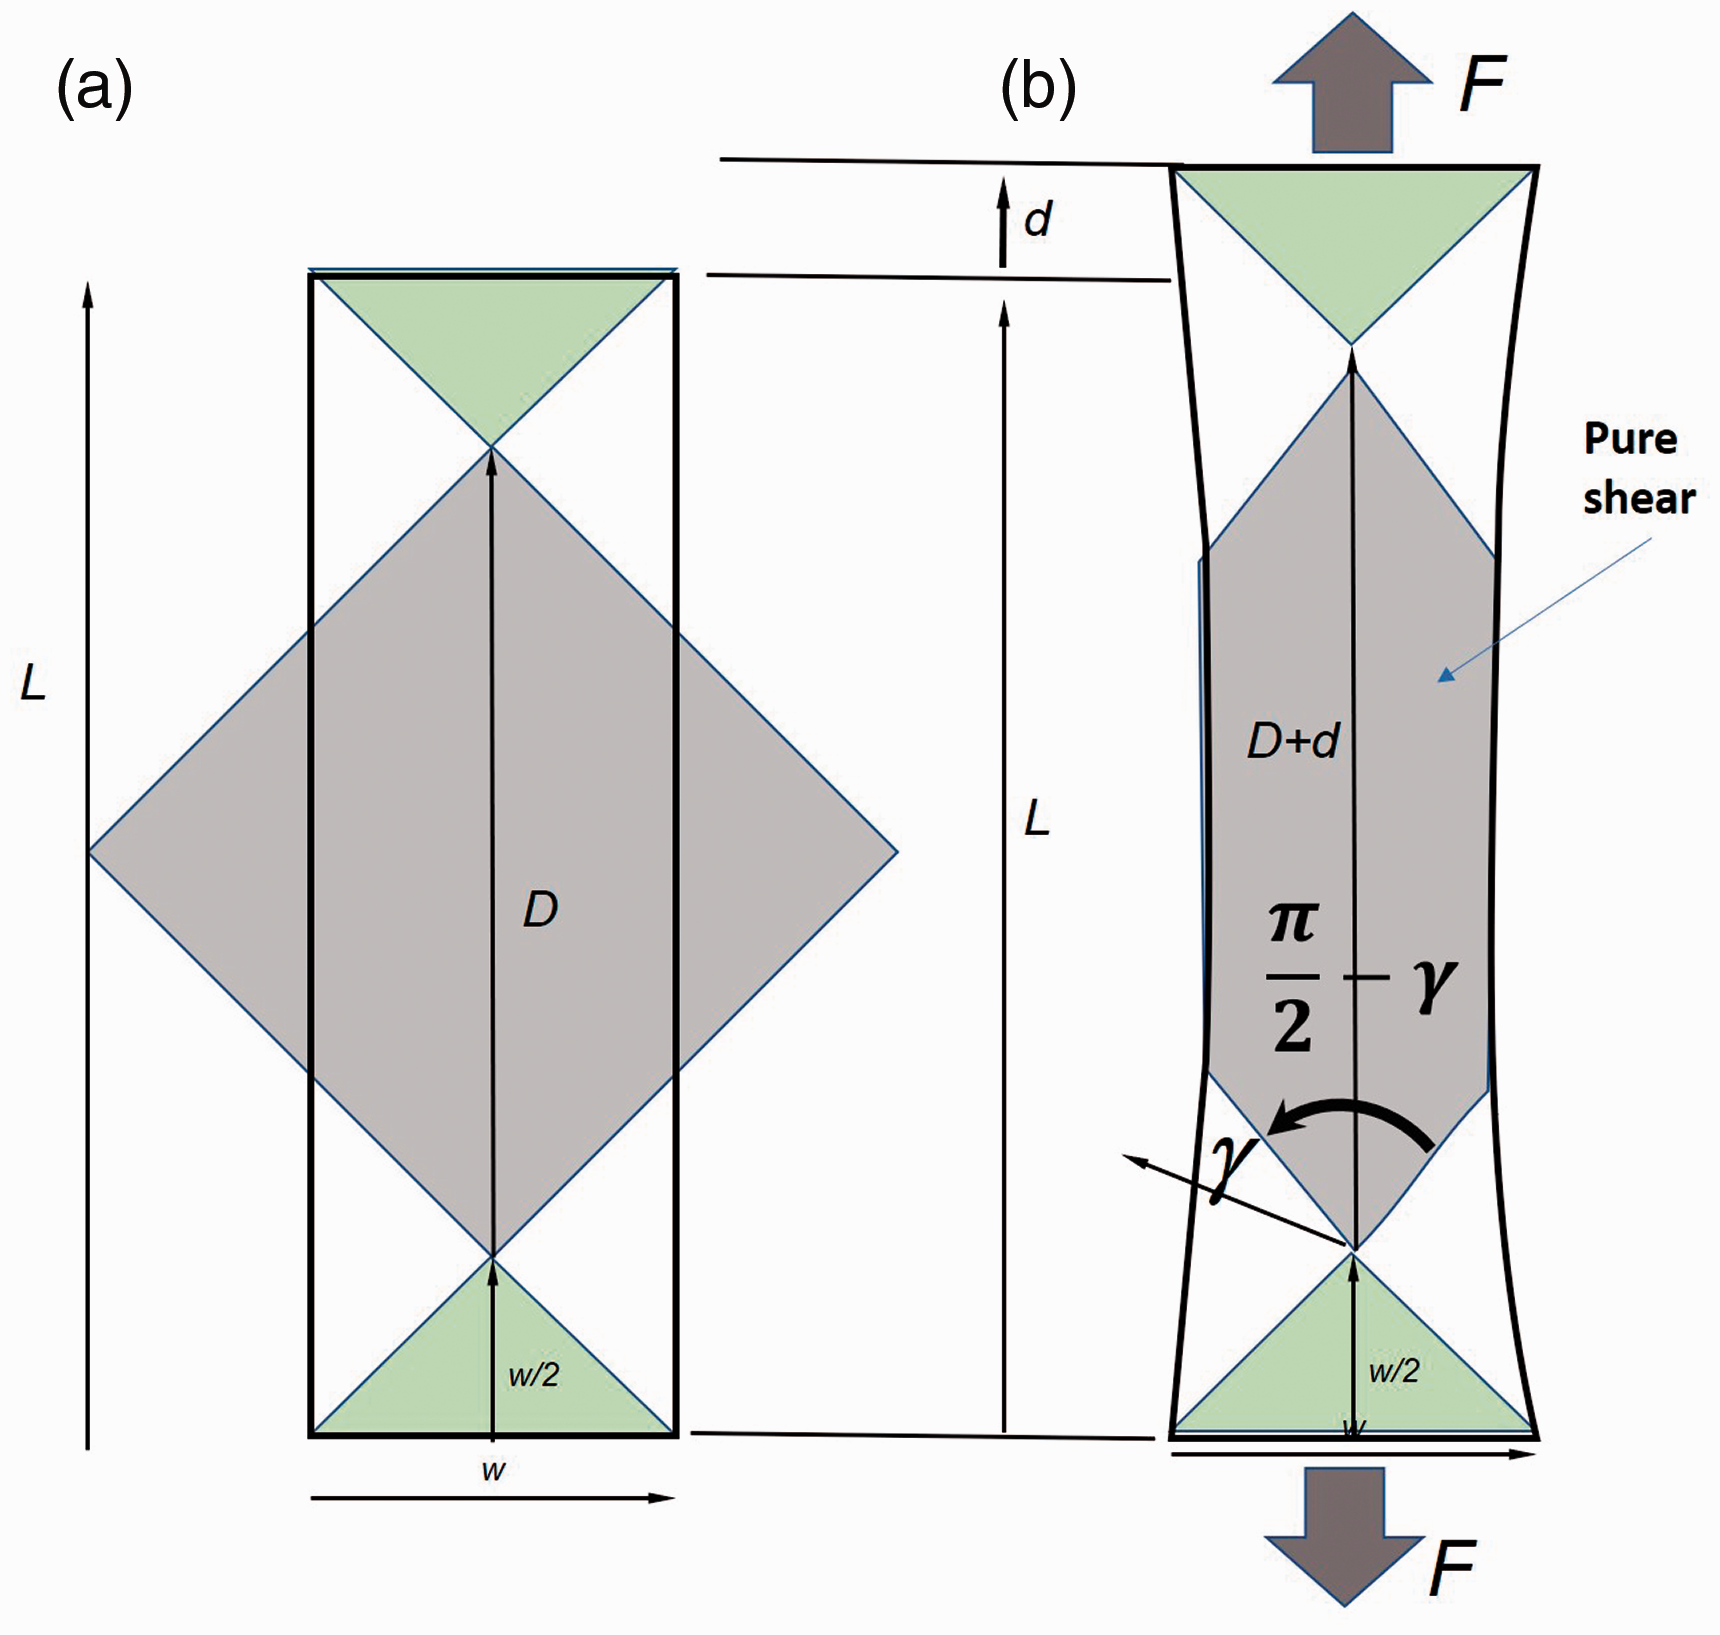
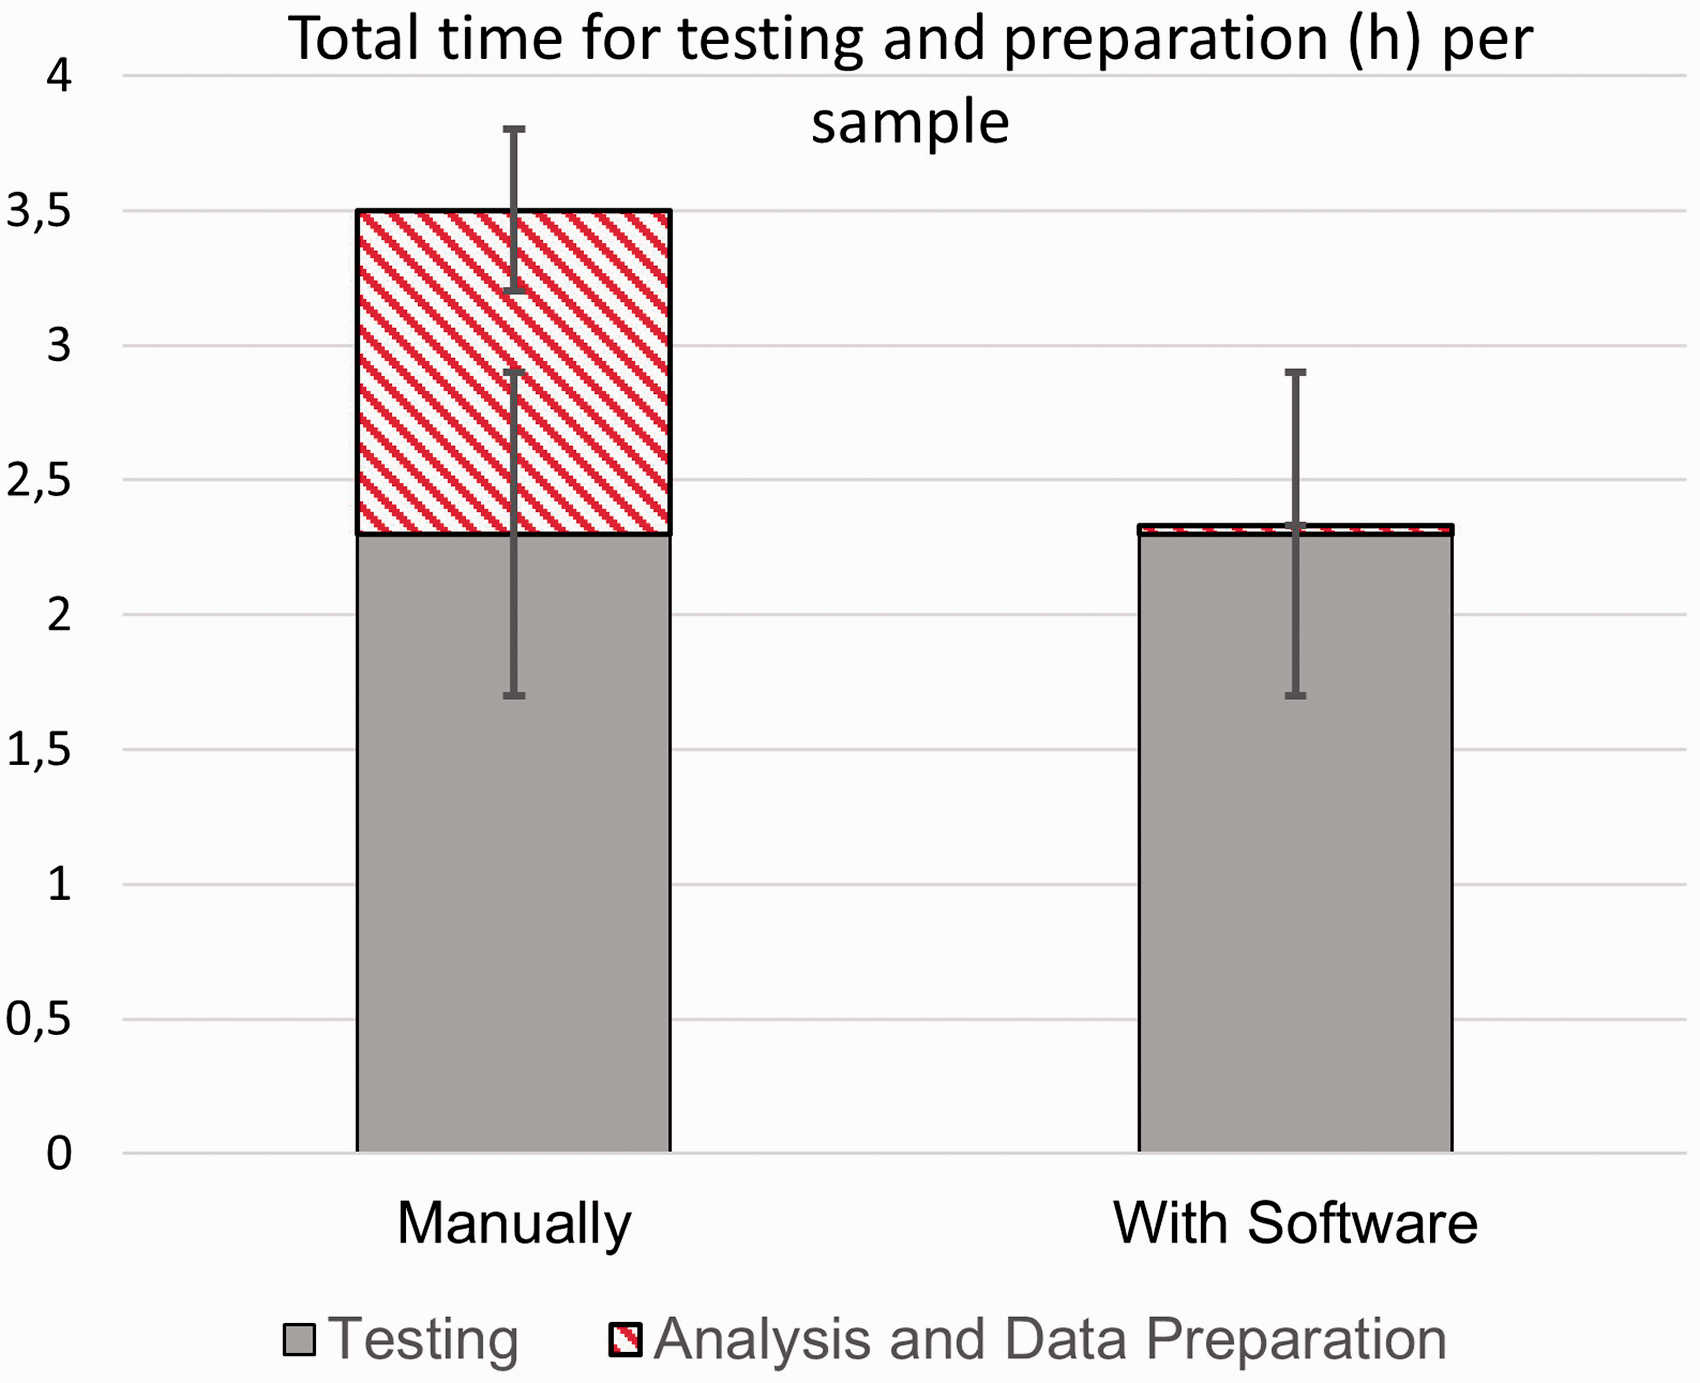
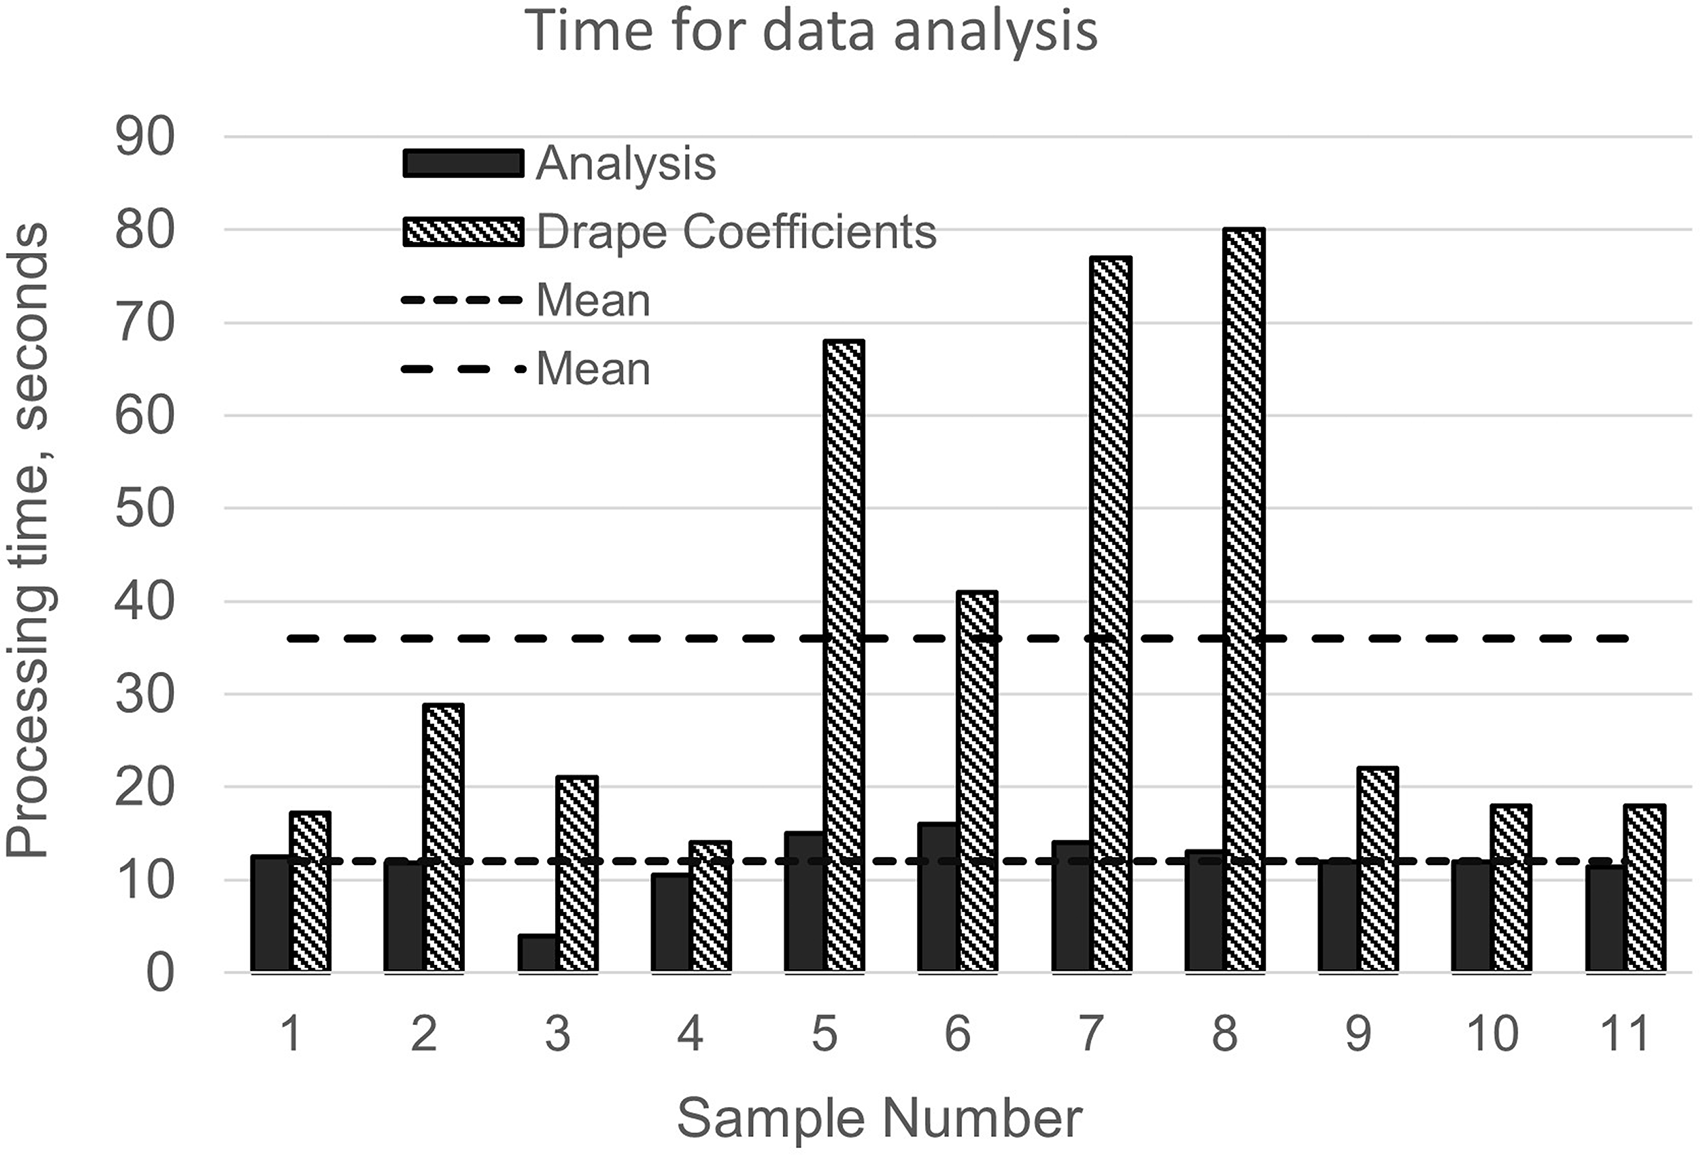
The obtained data files with the results of the 11 samples were processed both manually and with the software for internal validation purposes and for time comparison. The mean value for processing of one sample manually is about 1 hour and 12 minutes, with the difference between persons being more than 30 minutes, against only 48 seconds for software-based automatic processing per sample (Figure 11). Here it has to be remarked that the mean values and the variations in the processing time by the persons are biased, because for all persons these steps were already known at a certain level. Depending on the frequency of repeating these steps, they can be processed faster if the operations are performed often – or more time will be needed, if the testing has to be done with a delay of more than few weeks – then again the exactly same settings, units and conversions have to be refreshed and checked. As the visualization in Figure 12 demonstrates, the use of the software for processing reduces at least 30% of the processing time per sample.
Duration of the data analysis of 11 samples, split into two parts – automatic analysis of the physical data and semi-automatic image processing-based determination of the drape coefficient.
Comparison of the total time for sample testing and analysis up to ready-to-use material parameters in the computer-aided design system by manual data processing and with software.
The time for the processing of the data sets using the software “Material Analyzer” was recoded accurately directly with the software in two steps – data analysis and image processing. The mean processing time with the software step of the data analysis was 12 seconds per sample. The image processing step for computation of the drape coefficient was performed by using a specially developed routine, based on OpenCV library. For this step, the threshold for greyscale images and the radius for cropping the boundary around the photo of the figure were adjusted manually, and then the algorithm for the recognition of the contour of the shaded surfaces after draping was applied. The algorithm for the computation of the drape coefficient together with the difficulties and problems are prepared for publishing separately, because they are outside the scope of this manuscript. The duration of these trials was between 10 and 80 seconds, with the mean value around 38 seconds per sample. Some of the samples were transparent or the detected polygons were not the correct shadows, which required several trials with samples 5–8 (Figure 11). These differences were the reason why these steps remain currently manually assisted, but even in this situation the largest processing time of 94 seconds for sample 8 is negligible small compared to the required time for the manual processing of the data of about 80 minutes.
The resulting set of material data currently covers only the file format for the software Assyst Vidya, but the data can be extended for FEM data sets as K-Files and more programs, where the formats are open and described. The final exporting of the values in these formats will not take more than a few seconds and will allow for reducing the tests significantly. An example of the current state of the implementation of the data structure as XML is given in Figures 13 and 14. The XML specification allows different methods for representation of the information – as nodes or attributes to some node. The author is aware that the first working version of this structure is suboptimal. The best method for its improvement can be found in the next version, with detailed format specification, after conversations and discussions with peers in the area of implementation of the code, and is less related to textile science. For this reason more detailed discussion about it is omitted here.
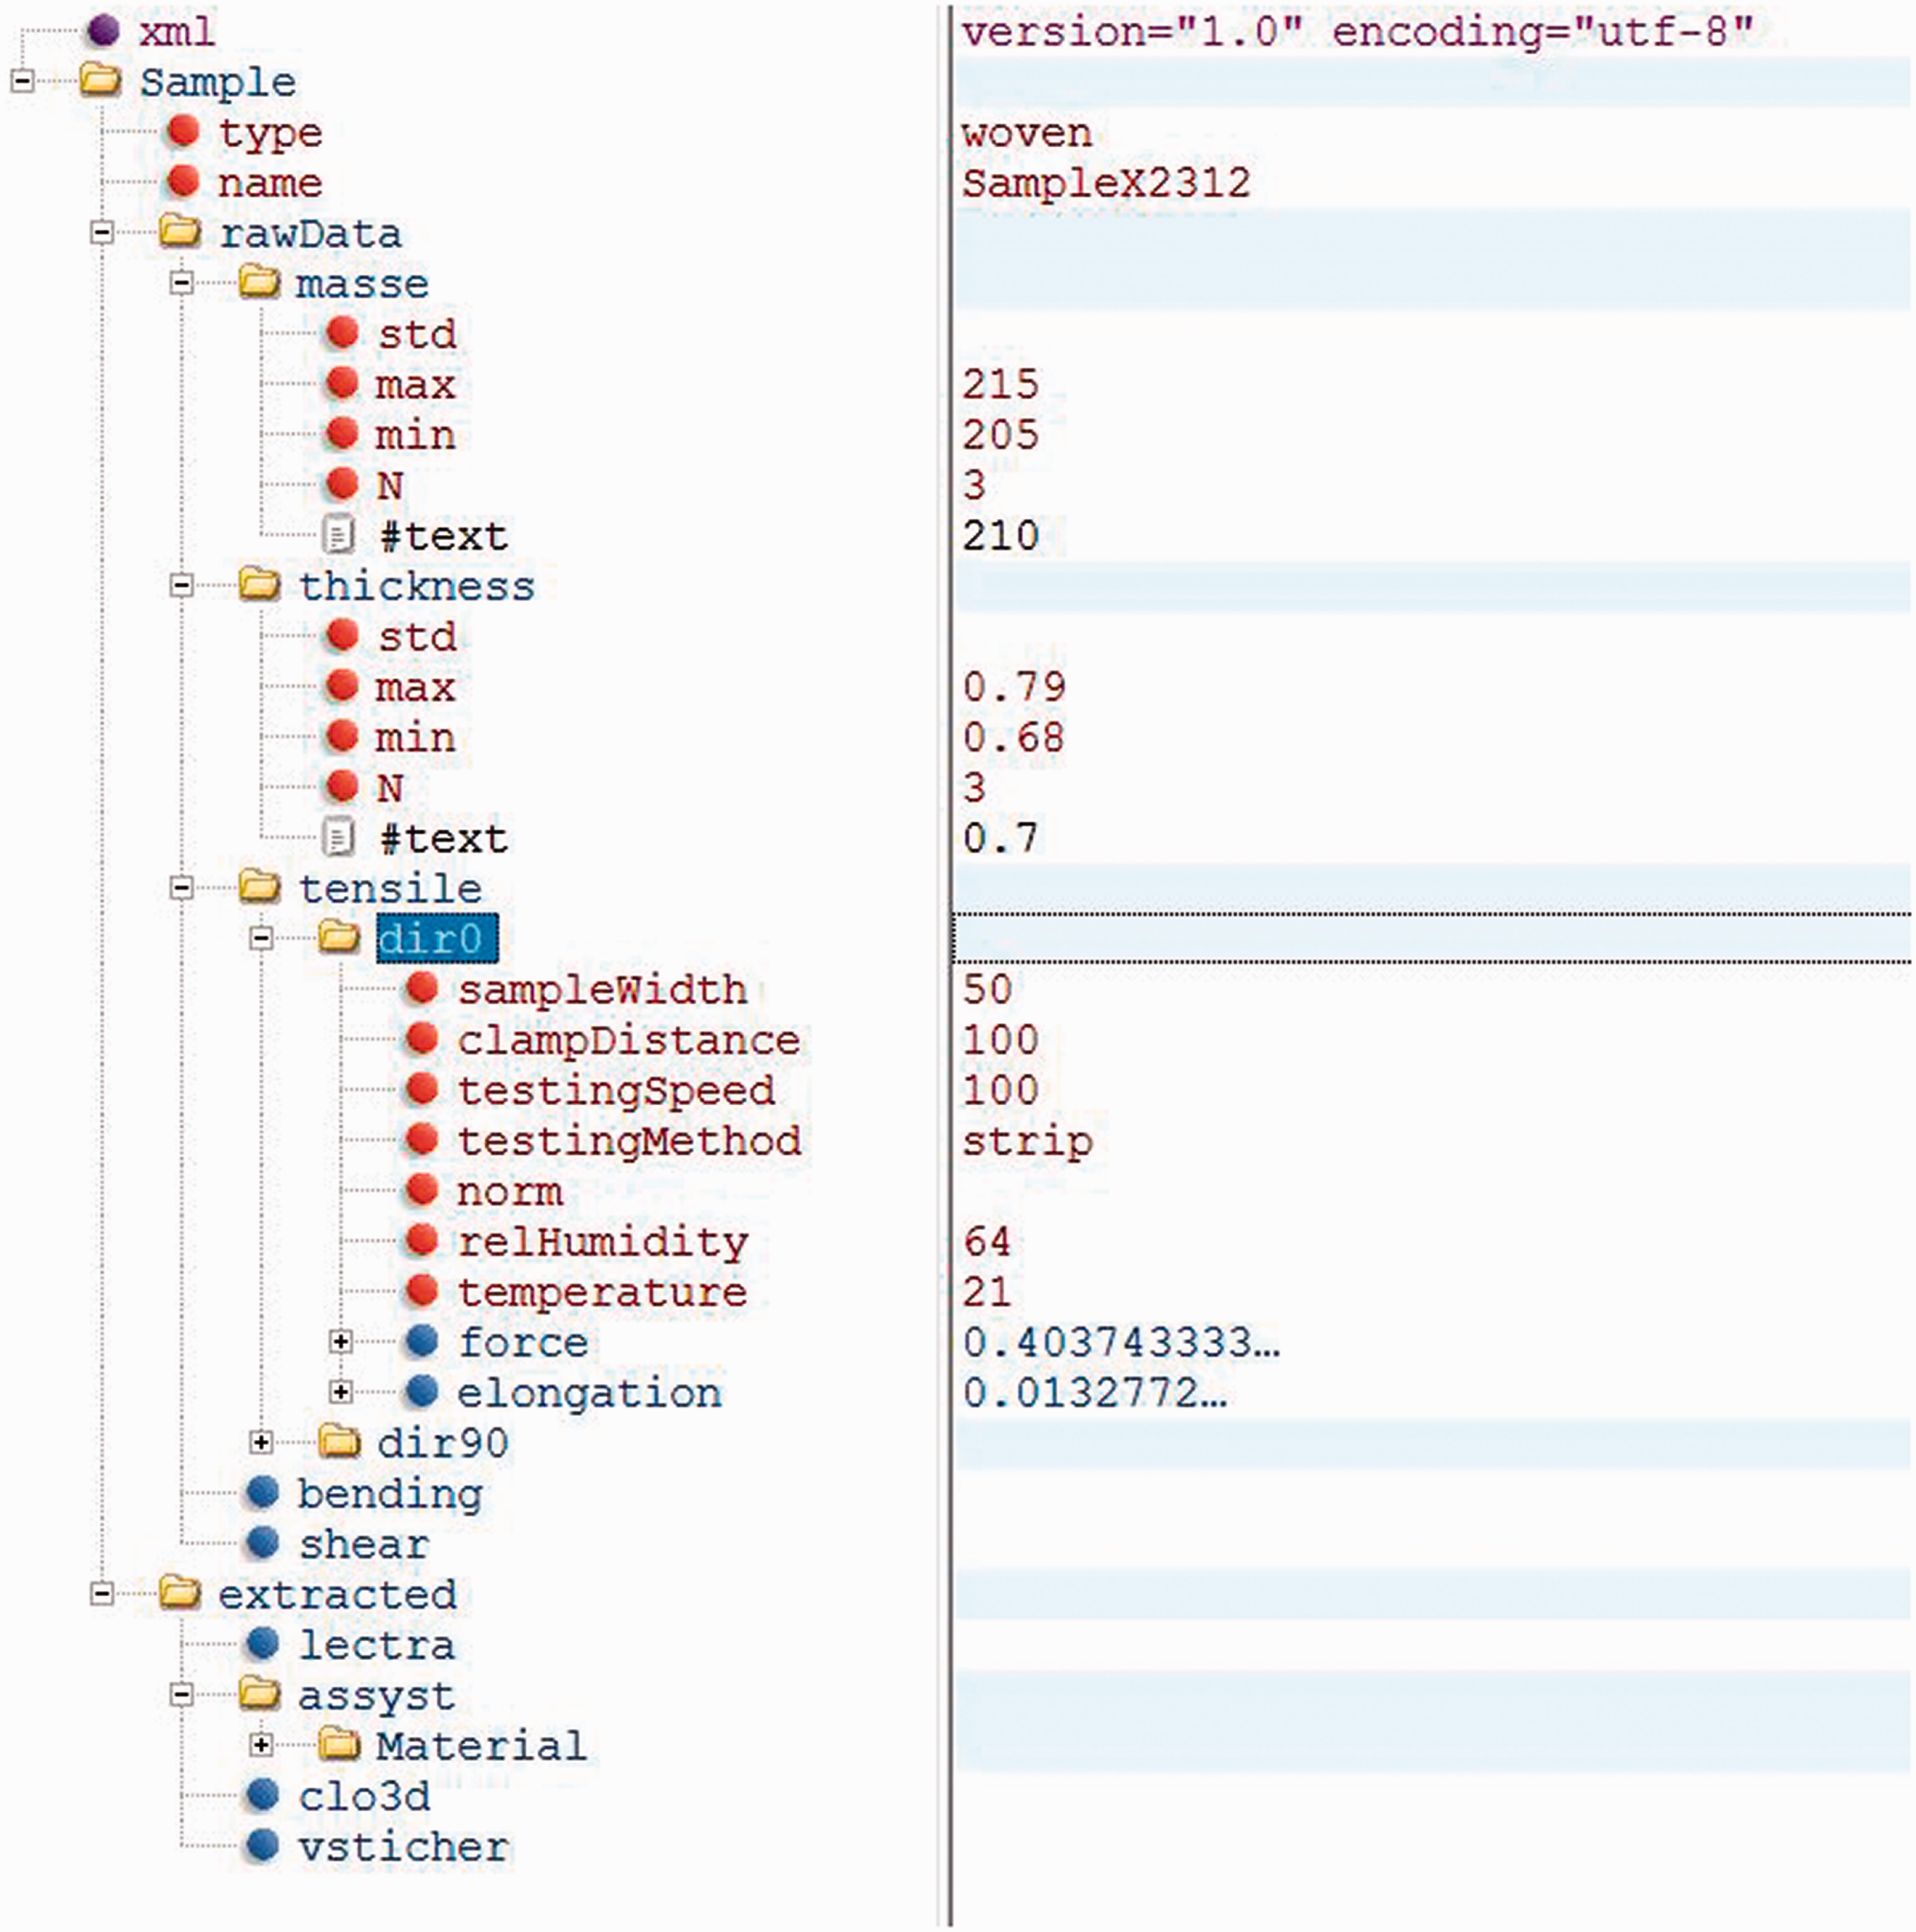
Structure of XML implementation of the data structure.
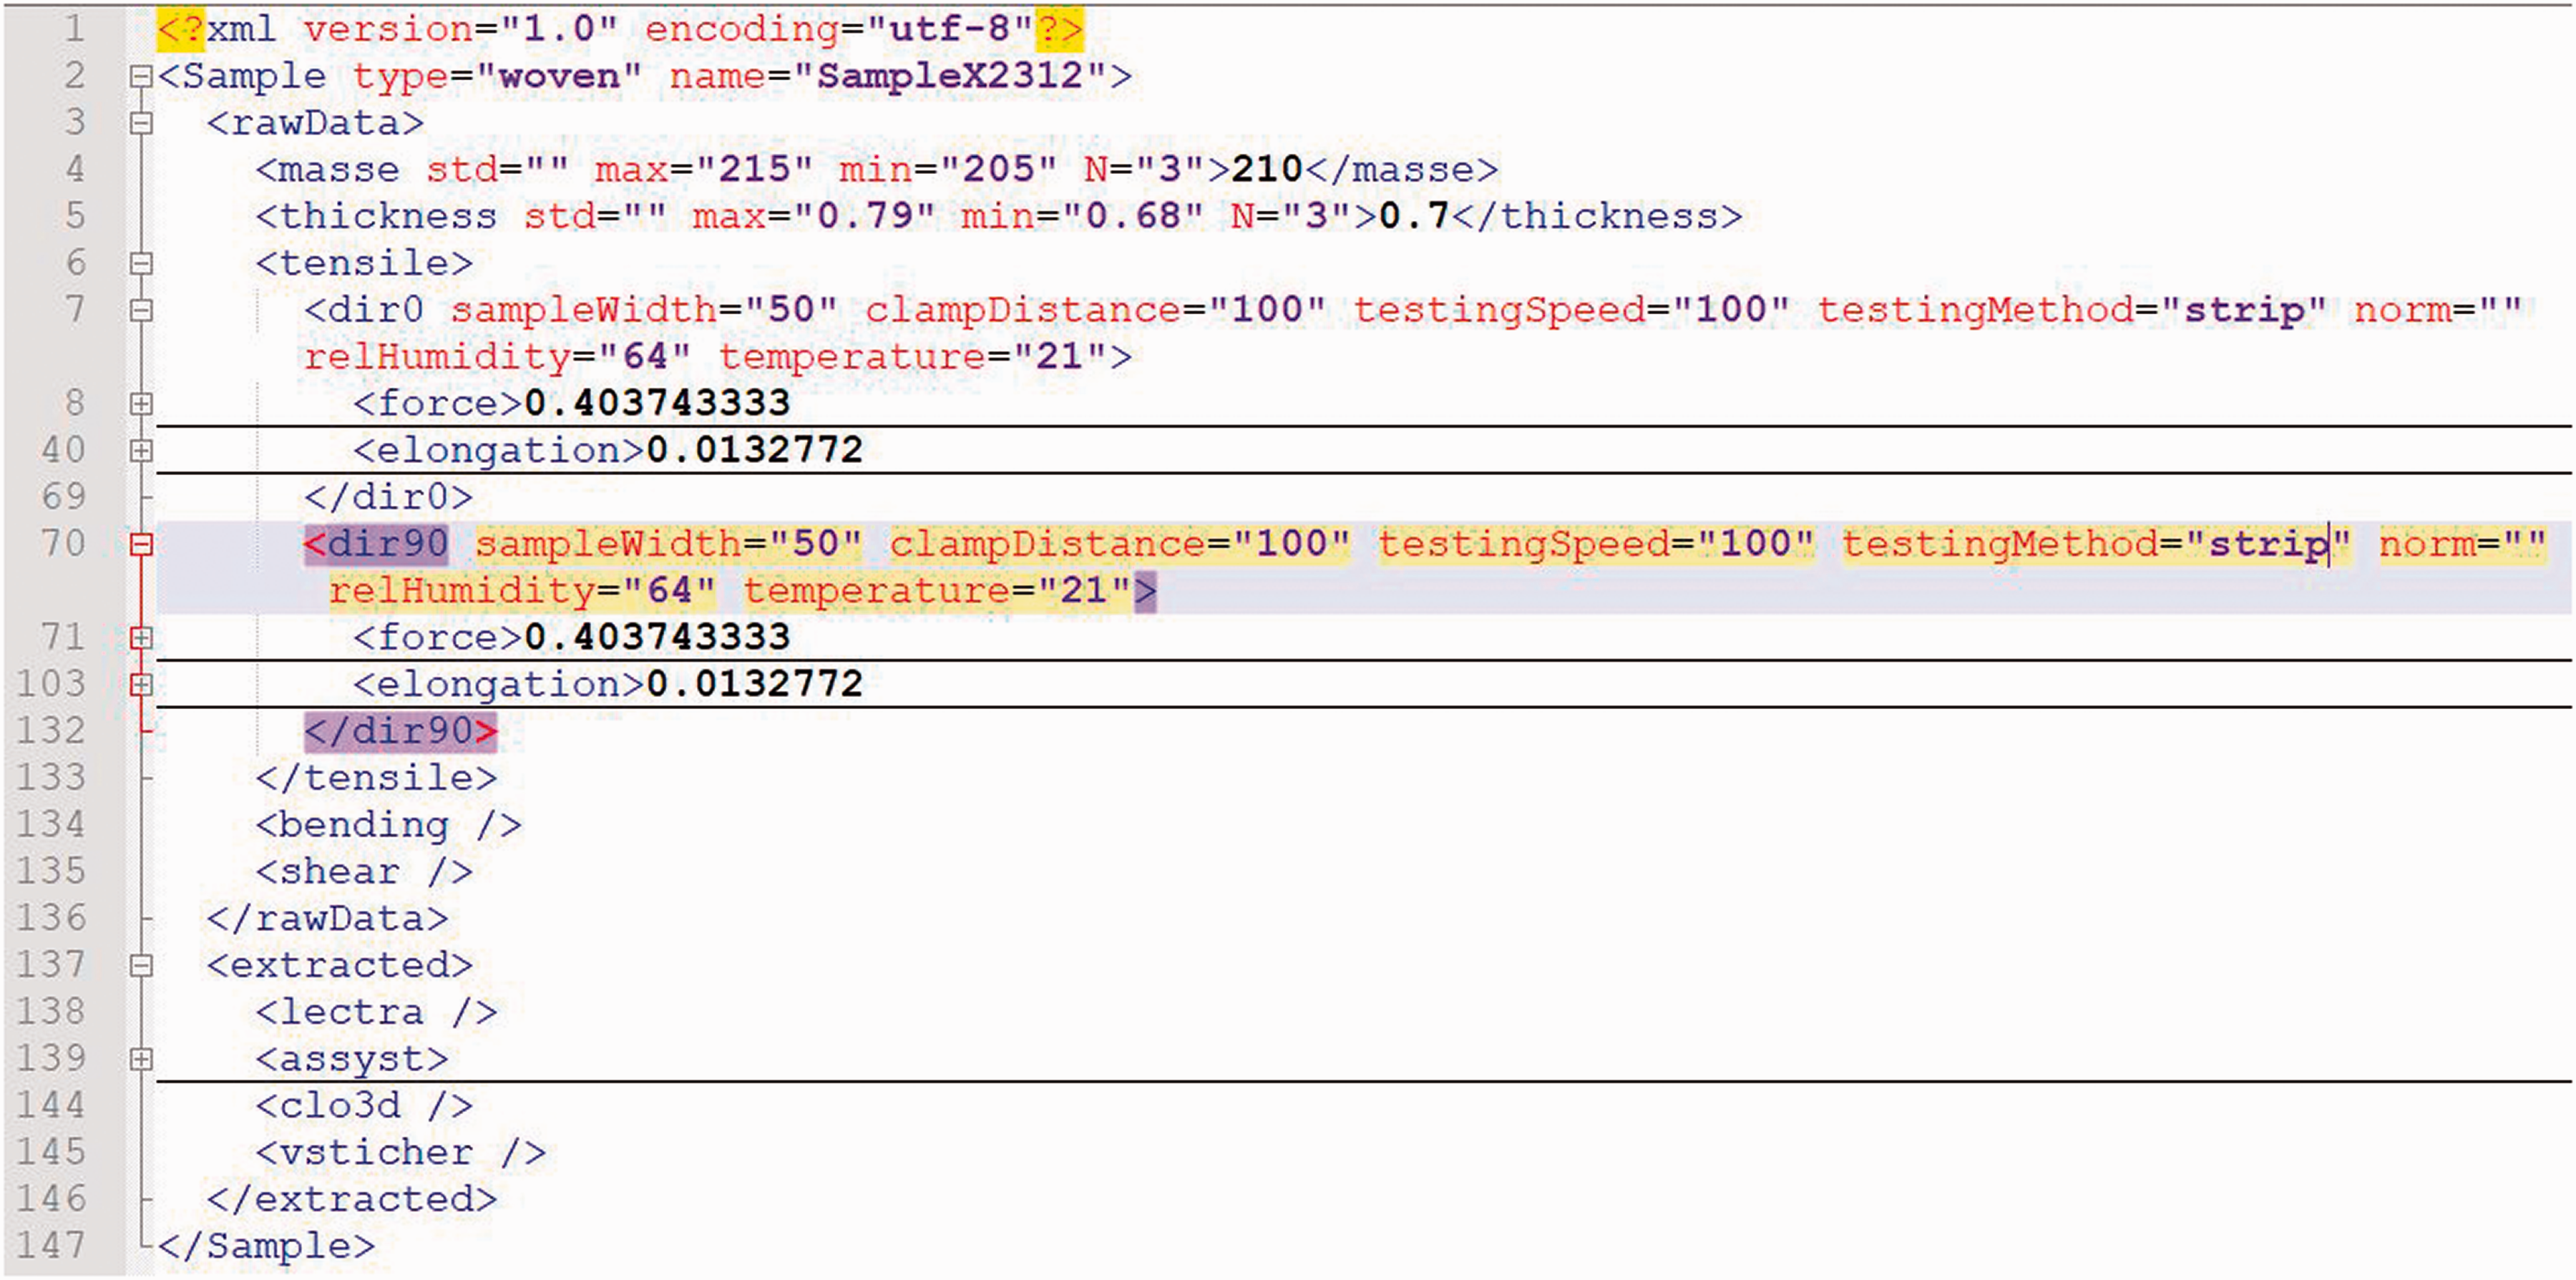
Extract of raw code of the XML example.
Conclusions
An overview of the testing methods for evaluation of the parameters of textile materials, required for their 3D simulation, is given. Based on the analysis of the values and methods, a structure for data storage in a neutral format is proposed, and the Python module for saving and loading it in both XML and JSON is implemented and provided as an open source package. The author believes these steps will result in a large impulse and motivation for both software vendors and researchers to adapt the unified open format for the exchange of material data and boost the development of the simulation software and testing algorithms. Storage of normalized data will allow a unified approach for the extraction of required parameters (elongation at given force, etc.) for the different software packages. In addition, a structure for the organization and saving of the non-normalized raw data of different testing machines is proposed, and separate analysis software “Material Analyzer” is developed. It reads the raw data from the testing devices and manually prepared files with the sample specification, analyses them and converts them into normalized ones by using the library. Finally, an export of extracted parameters of the data into a useful CAD software format is implemented and more updates are to follow. The practical application of the system in two cases demonstrated a significant reduction of the total testing and processing time of at least 30% related to the entire manual processing. With these tools, the number of tests and the costs for testing will be significantly reduced and the exchange of data between material producers, researchers, software developers, etc., will be sped up significantly.
Footnotes
Declaration of conflicting interests
The author(s) declared no potential conflicts of interest with respect to the research, authorship, and/or publication of this article.
Funding
The author received no financial support for the research, authorship and/or publication of this article.