
Abstract
This study investigated existing dimensional variations in knitted fabrics produced by weft-knitting technology for knitting and dry relaxation, dyed and dry relaxation, and dyed and wash relaxation for the interlock, 1 × 1 rib, and single jersey structures. This paper demonstrates that once the structure has been knitted, the shape that the loop takes in the fabric, and loop length and loop width, for each relaxation state will be the main factor responsible for dimensional variations in cotton knitted fabrics. It also shows how loop length affects knitted fabric dimensions when knitting machine parameters are modified by varying the use of feeders, and obtaining more loosely or more tightly knitted fabrics. In this study a model to predict the longitudinal and transversal shrinkage of interlock, 1 × 1 rib, and single jersey fabrics after the dyeing process is presented. This avoids following the conventional analysis procedure according to Standard UNE-EN ISO 6330 of September 2012 and, thus, avoids investing relatively long calculation times, which speeds up the production process by avoiding product lots being stopped. These results are important for textile industry technicians as they substantially simplify production calculations in weft-knitted fabrics companies. This work offers an effective method for predicting the longitudinal and transversal shrinkage and width of knitting fabrics after the dyeing process from the loop dimension after the knitting process. The application of the study results may help businesses to significantly save time and, consequently, imply an intermediate product stock investment saving.
Controlling the dimensional stability of knitted fabrics throughout the production process is one of the most problematic purposes for people in charge of quality in textile industries. Any dimensional variations made to fabrics by stretching during the production process have to be removed or minimized as much as possible before moving on to the product’s pattern cutting process because, otherwise, this stretching will cause the final garment to shrink. This is why an intermediate operation must be followed before the cutting process that confers the fabric the best possible maximum relaxation state. Compacting fabrics minimizes such shrinkage, but to do so entails having to previously know the dimensional variations of the fabric being dealt with by means of an analysis based on Standard UNE-EN ISO 63301 of September 2012. This analysis might take 1 day to perform, which entails stopping fabric production processes until its result is known. Knowing variations in knitted fabrics earlier would speed up the production process, avoid stopping the process and, thus, better optimizing the production process and be, therefore, more competitive.
Obtaining dimensionally stable fabrics is what many researchers have focused on, as shown by the many studies found on this matter. The models proposed by Chamberlain, 2 Münden’s equations,3–5 introducing the variable yarn count into Münden’s equations by Nutting and Leaf, 6 or Knapton et al.’s ways to achieve dimensional stability,7,8 are examples of the interest that has long since been shown to obtain dimensionally stable fabrics. Ulson et al. 9 proposed that the K factors put forward by Münden must be determined during each production process. Saravana and Sampath 10 predicted the dimensional properties of a “double cardigan” structure. Mobarock 11 proposed some models to predict the weight (GSM), width and shrinkage of a finished cotton knitted fabric. Eltahan et al.12,13 determined some dimensional variables using mathematical equations. Sitotaw and Adamu14,15 studied the dimensional properties of 100% cotton and cotton/elastane fabrics. Llinares et al. 16 proposed a procedure to calculate loop length in interlock fabrics and 1 × 1 rib 17 by means of some mathematical models. Lu and Jiang 18 proposed an algorithm that maps the yarn texture to the loop based on the loop geometrical model. Jiang et al. 19 put forward a method to deform the loop central curve thought the interlacing point of the flat-knitted fabric. Fouda et al. 20 developed a mathematical model of plain single jersey knitted fabric.
Other research works have undertaken relevant studies which conceptualize, define, and mathematically formulate the dimensional behavior of knitted fabrics.21–37
Objectives
The main objective of this study was to predict the dimensional variation of interlock, 1 × 1 rib, and single jersey knitted fabrics without having to apply Standard UNE-EN ISO 6330 of September 2012. Another of its objectives was to determine the existing relation between the different variables that influence the dimensional variation in knitted fabrics in the distinct production process stages in order to define a mathematical model that allows dimensional variations to be very simply predicted.
Consequently, this not only reduces the production process, but also improves competitiveness.
Experimental
Materials and methods
To maintain the representativeness of the possible knitting structures, several analyses were done of the different variables: structures, gauge, count yarn and feeding strains. The analyzed fabrics represented the three basic structures in circular knitting machines: interlock, 1 × 1 rib, and single jersey. The machine gauge employed in the interlock fabrics was E20, two gauges were used in the 1 × 1 rib fabrics, E16 was employed for the 100% cotton fabrics, and E18 for the cotton/elastane ones. Machine gauge E22 was selected for the single jersey fabrics.
To conduct this study, the following knitted fabric pieces were analyzed:
Single Jersey (cotton): 80 pieces of 15.83 Tex, 80 pieces of 19.44 Tex and 80 pieces of 21.96 Tex. Interlock (cotton): 80 pieces of 19.44 Tex (loosely knitted loops), 80 pieces of 19.44 tex (intermediately knitted loops) and 80 pieces of 19.44 tex (tightly knitted loops). 1 × 1 (cotton) 80 pieces of 19.44 Tex, 80 pieces of 21.96 Tex and 80 pieces of 11.77 Tex (these last pieces were half-plated EA).
These pieces were selected and traced throughout the production process, which involved 14,400 manufactured pieces (20 kg) corresponding to 720 lots of 20 pieces each.
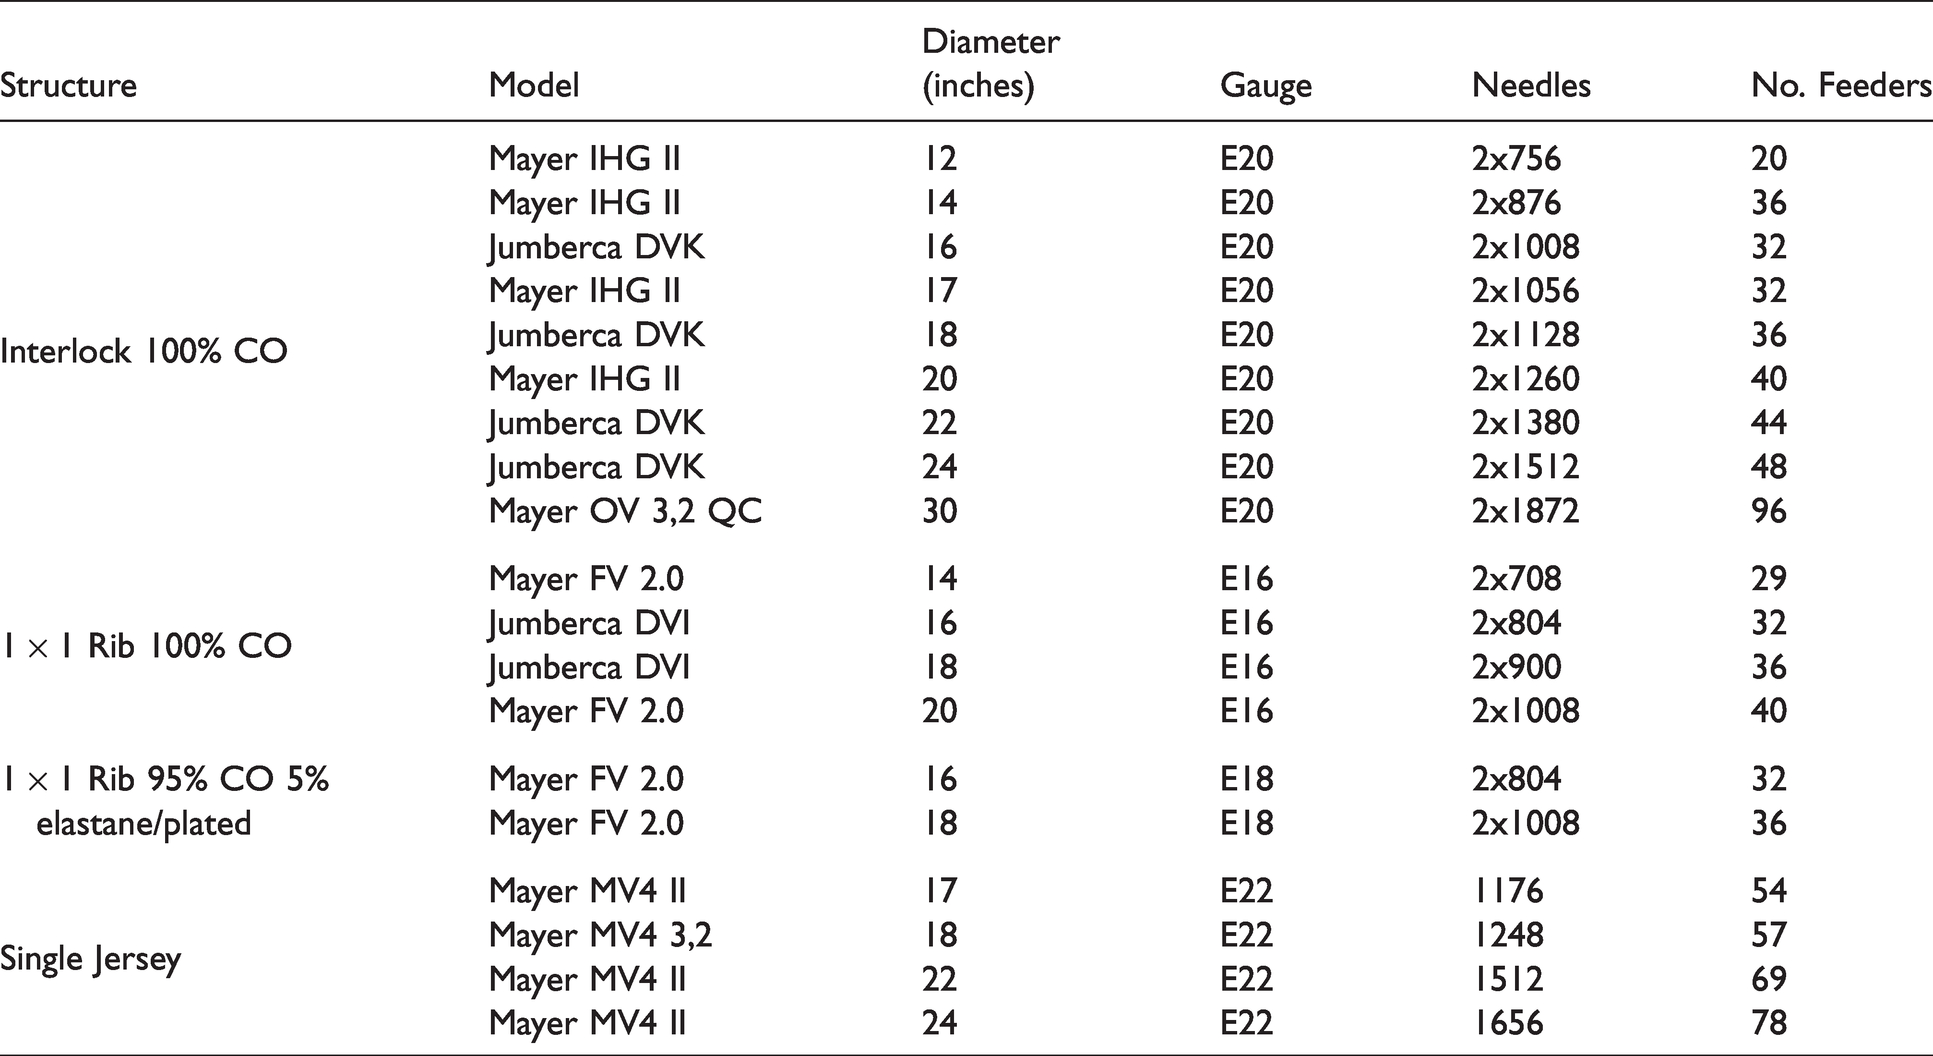
The machines employed to make these knitted fabrics are shown in Table 1.
The circular machines used to produce the knitted fabrics with interlock, 1 × 1 Rib 100% cotton, 1 × 1 Rib plated with EA, and 100% plain-knitted cotton structures
This study differentiated among three fabric relaxation states: one corresponded to that obtained after the knitting process, and two others by the dyeing process:
The experimental process began by knitting the indicated pieces after following the necessary processes so the cited relaxation states were achieved with them all, as follows:
Number of loops per length/area unit (wales per centimeter, courses per centimeter, and stitch density) according to Standard UNE-EN 14971
38
Laminar weight according to Standard UNE-EN 12127:1998
39
Linear density and loop length according to Standard UNE-EN 14970
40
Fabric width, variation in area, wale spacing and course spacing.
Then the selected lots underwent an exhaustion chemical bleaching process. After the hydroextraction and subsequent drying steps, the pieces to be analyzed were identified by taking one sample of these pieces and leaving it in a conditioning atmosphere until the different states had been accomplished. In these states, they were analyzed to obtain the dimensional stability in accordance with Standard UNE-EN ISO 6330 of September 2012.
Having obtained the result of the variables wales/cm (WPCM), courses/cm (CPCM), stitch density/cm2 (SD), weight (W), loop length (SL), course spacing (CS), wale spacing (WS), width, weight one loop (W 1 loop), and count for relaxation states KDR, DDR and DWR, longitudinal and transversal shrinkage for relaxation states DDR and DWR, the percentage variation obtained between relaxation states KDR–DDR and DDR–DWR was calculated by applying equations (1) and (2). Figure 1 represents the analyzed variables.


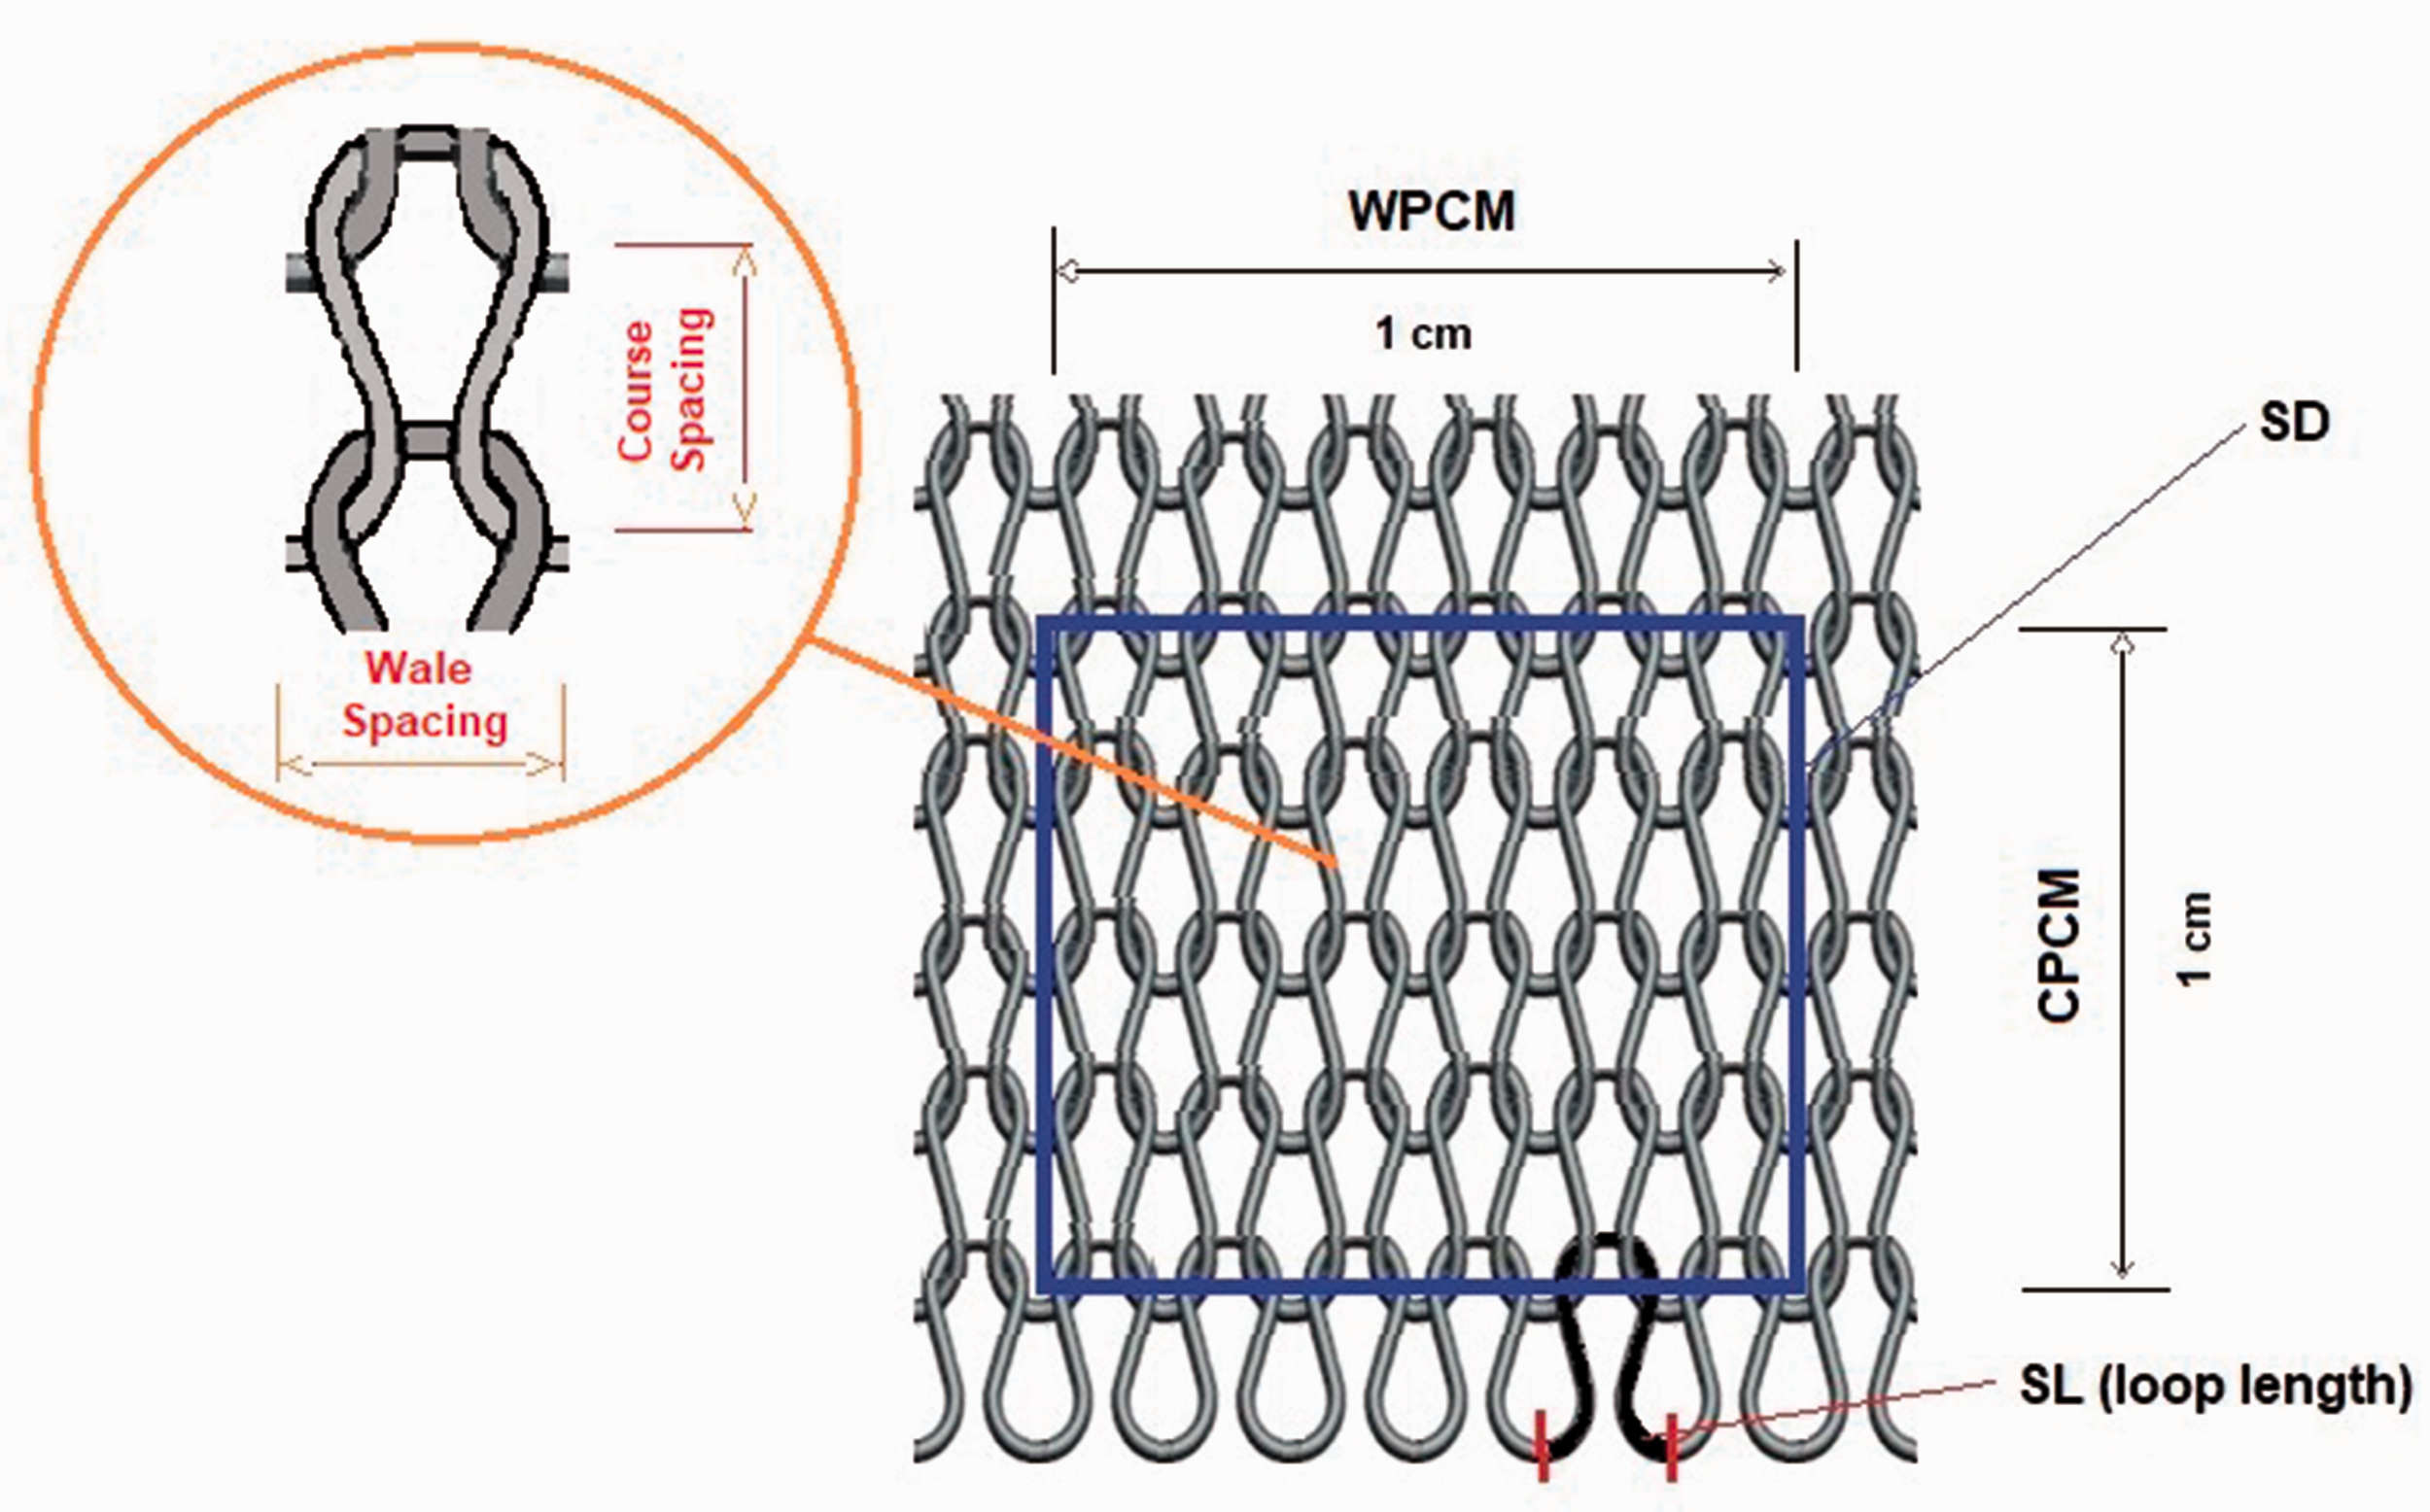
Graphical representation of the studied dimensional variables.
Tables 2–4 represent the percentage variations of these variables between relaxation states KDR–DDR and DDR–DWR, which were considered the most relevant ones for the interlock, 1 × 1 rib, and single jersey fabrics.
Percentage variations obtained from the analysis of three interlock structures between relaxation states KDR–DDR and DDR–DWR
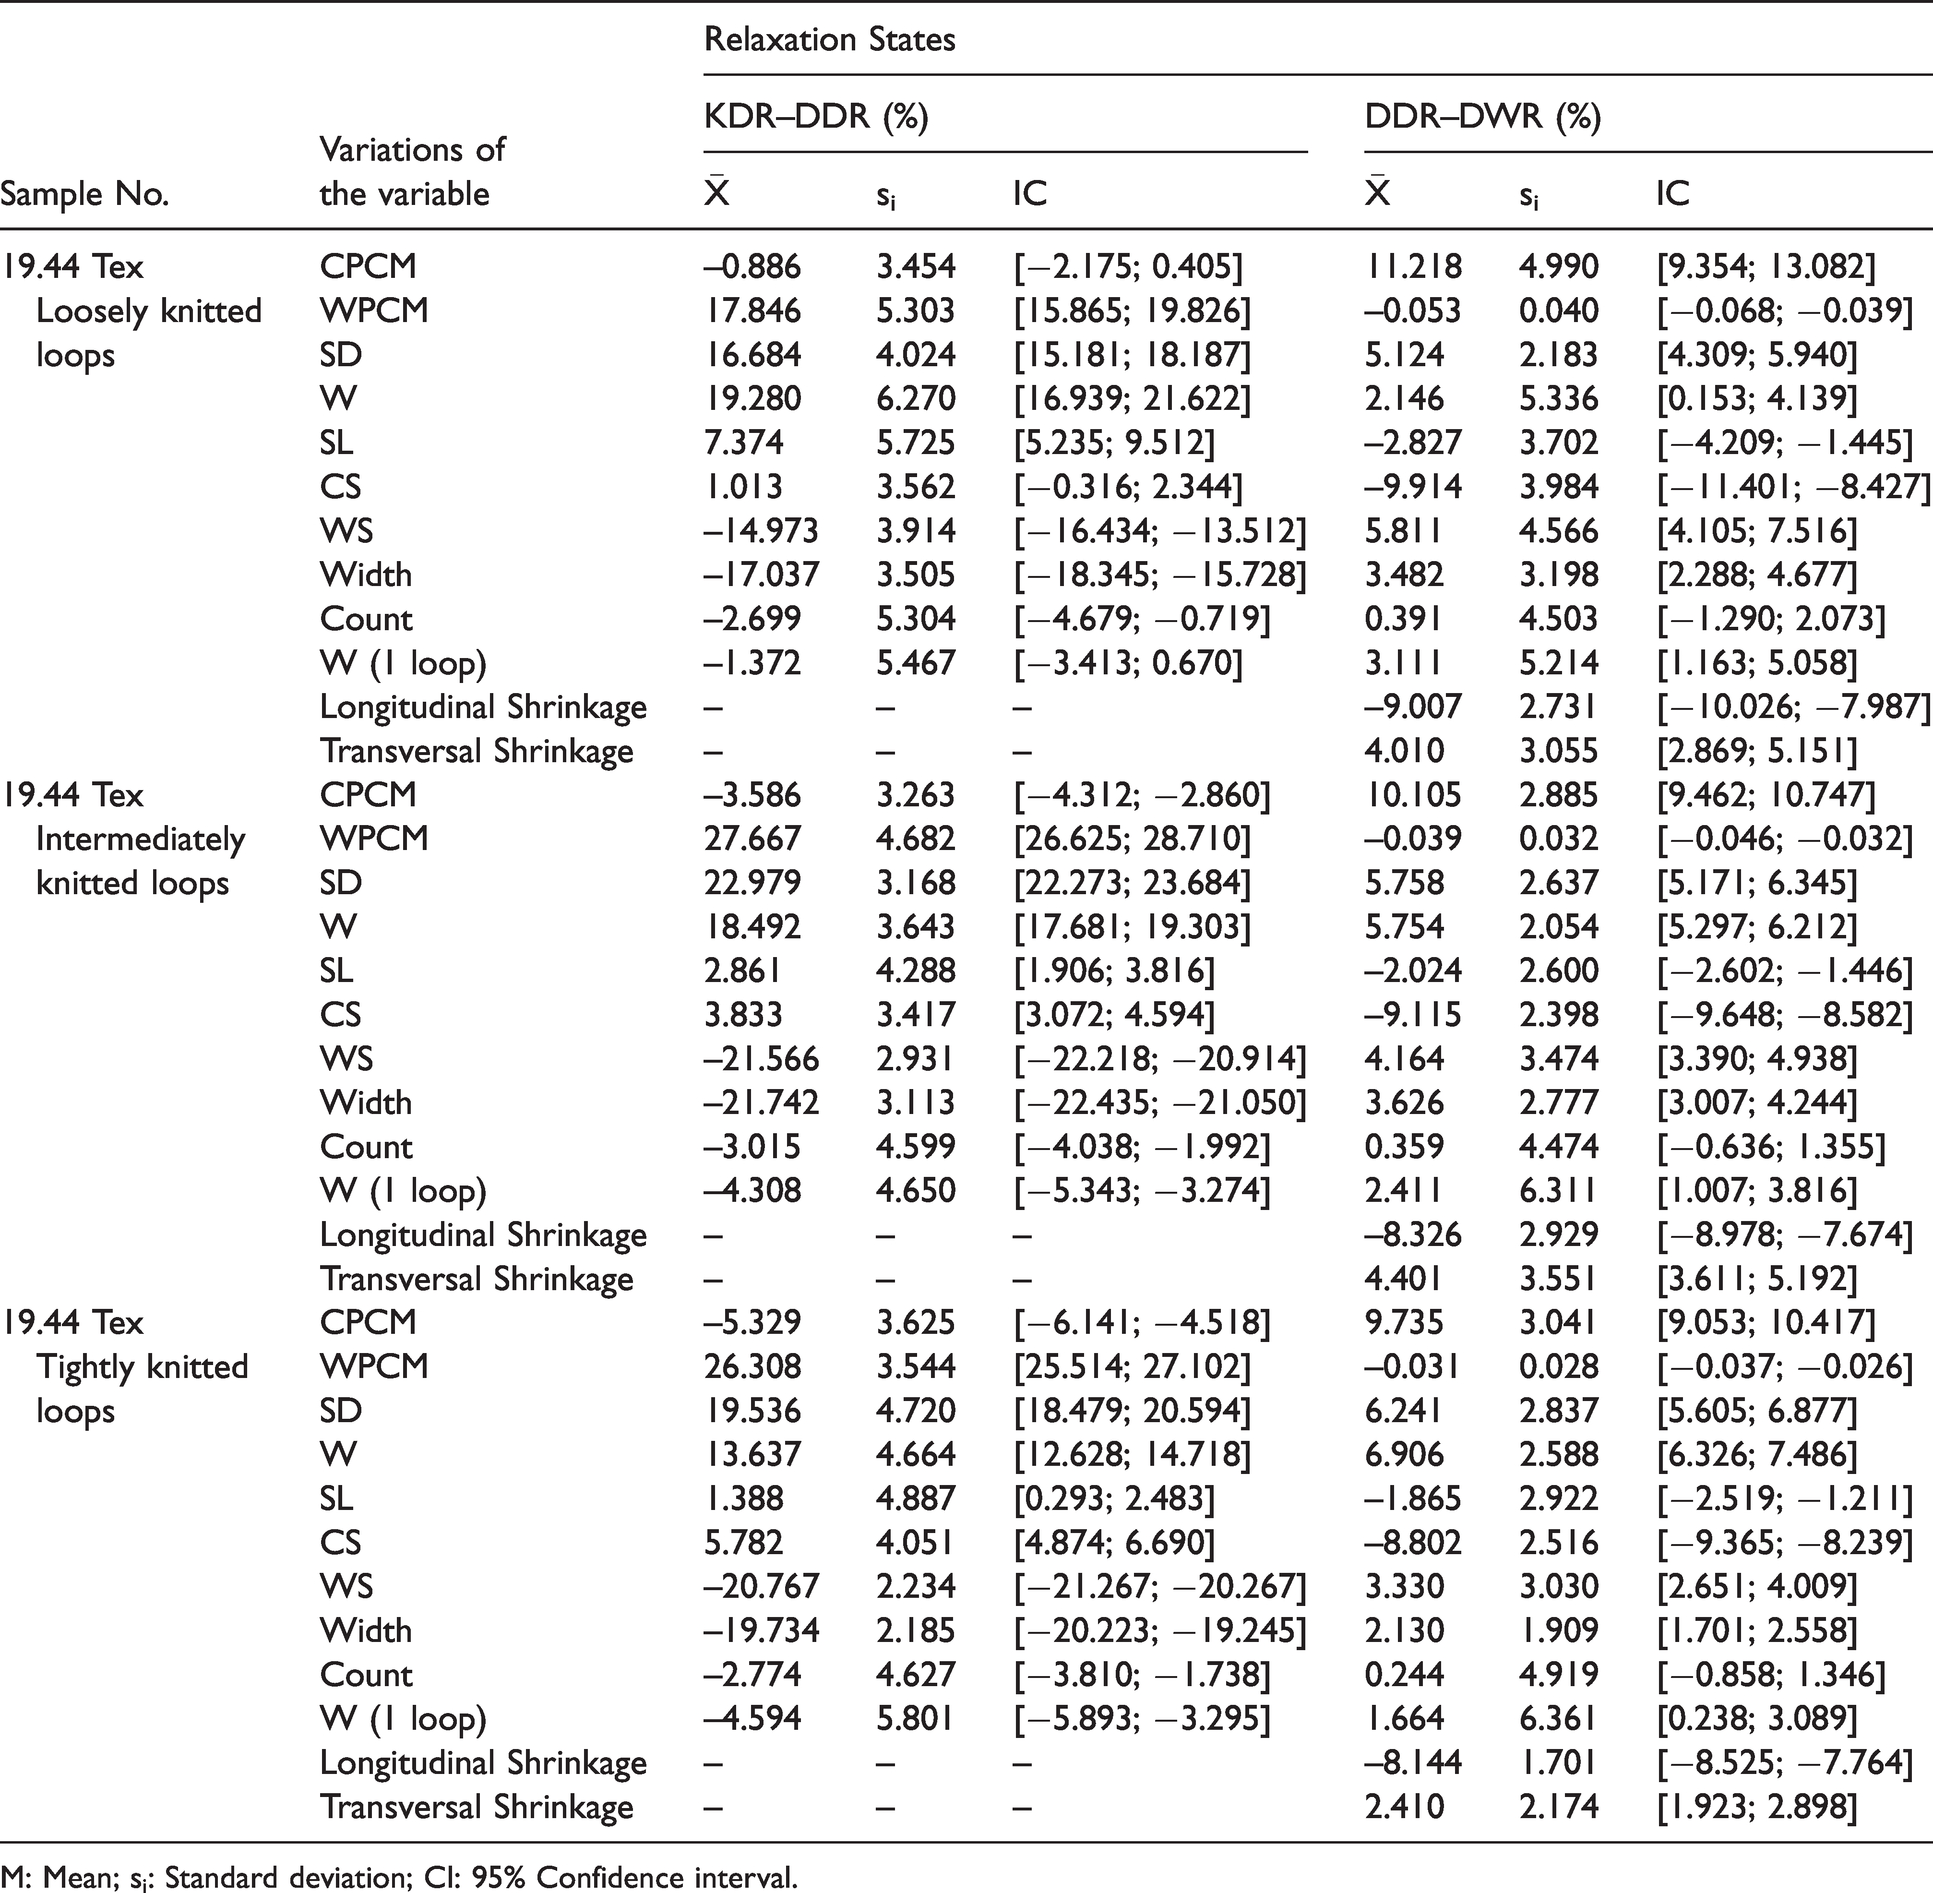
M: Mean; si: Standard deviation; CI: 95% Confidence interval.
Percentage variations obtained from the analysis of three analyzed and produced 1 × 1 Rib structures between relaxation states KDR–DDR and DDR–DWR
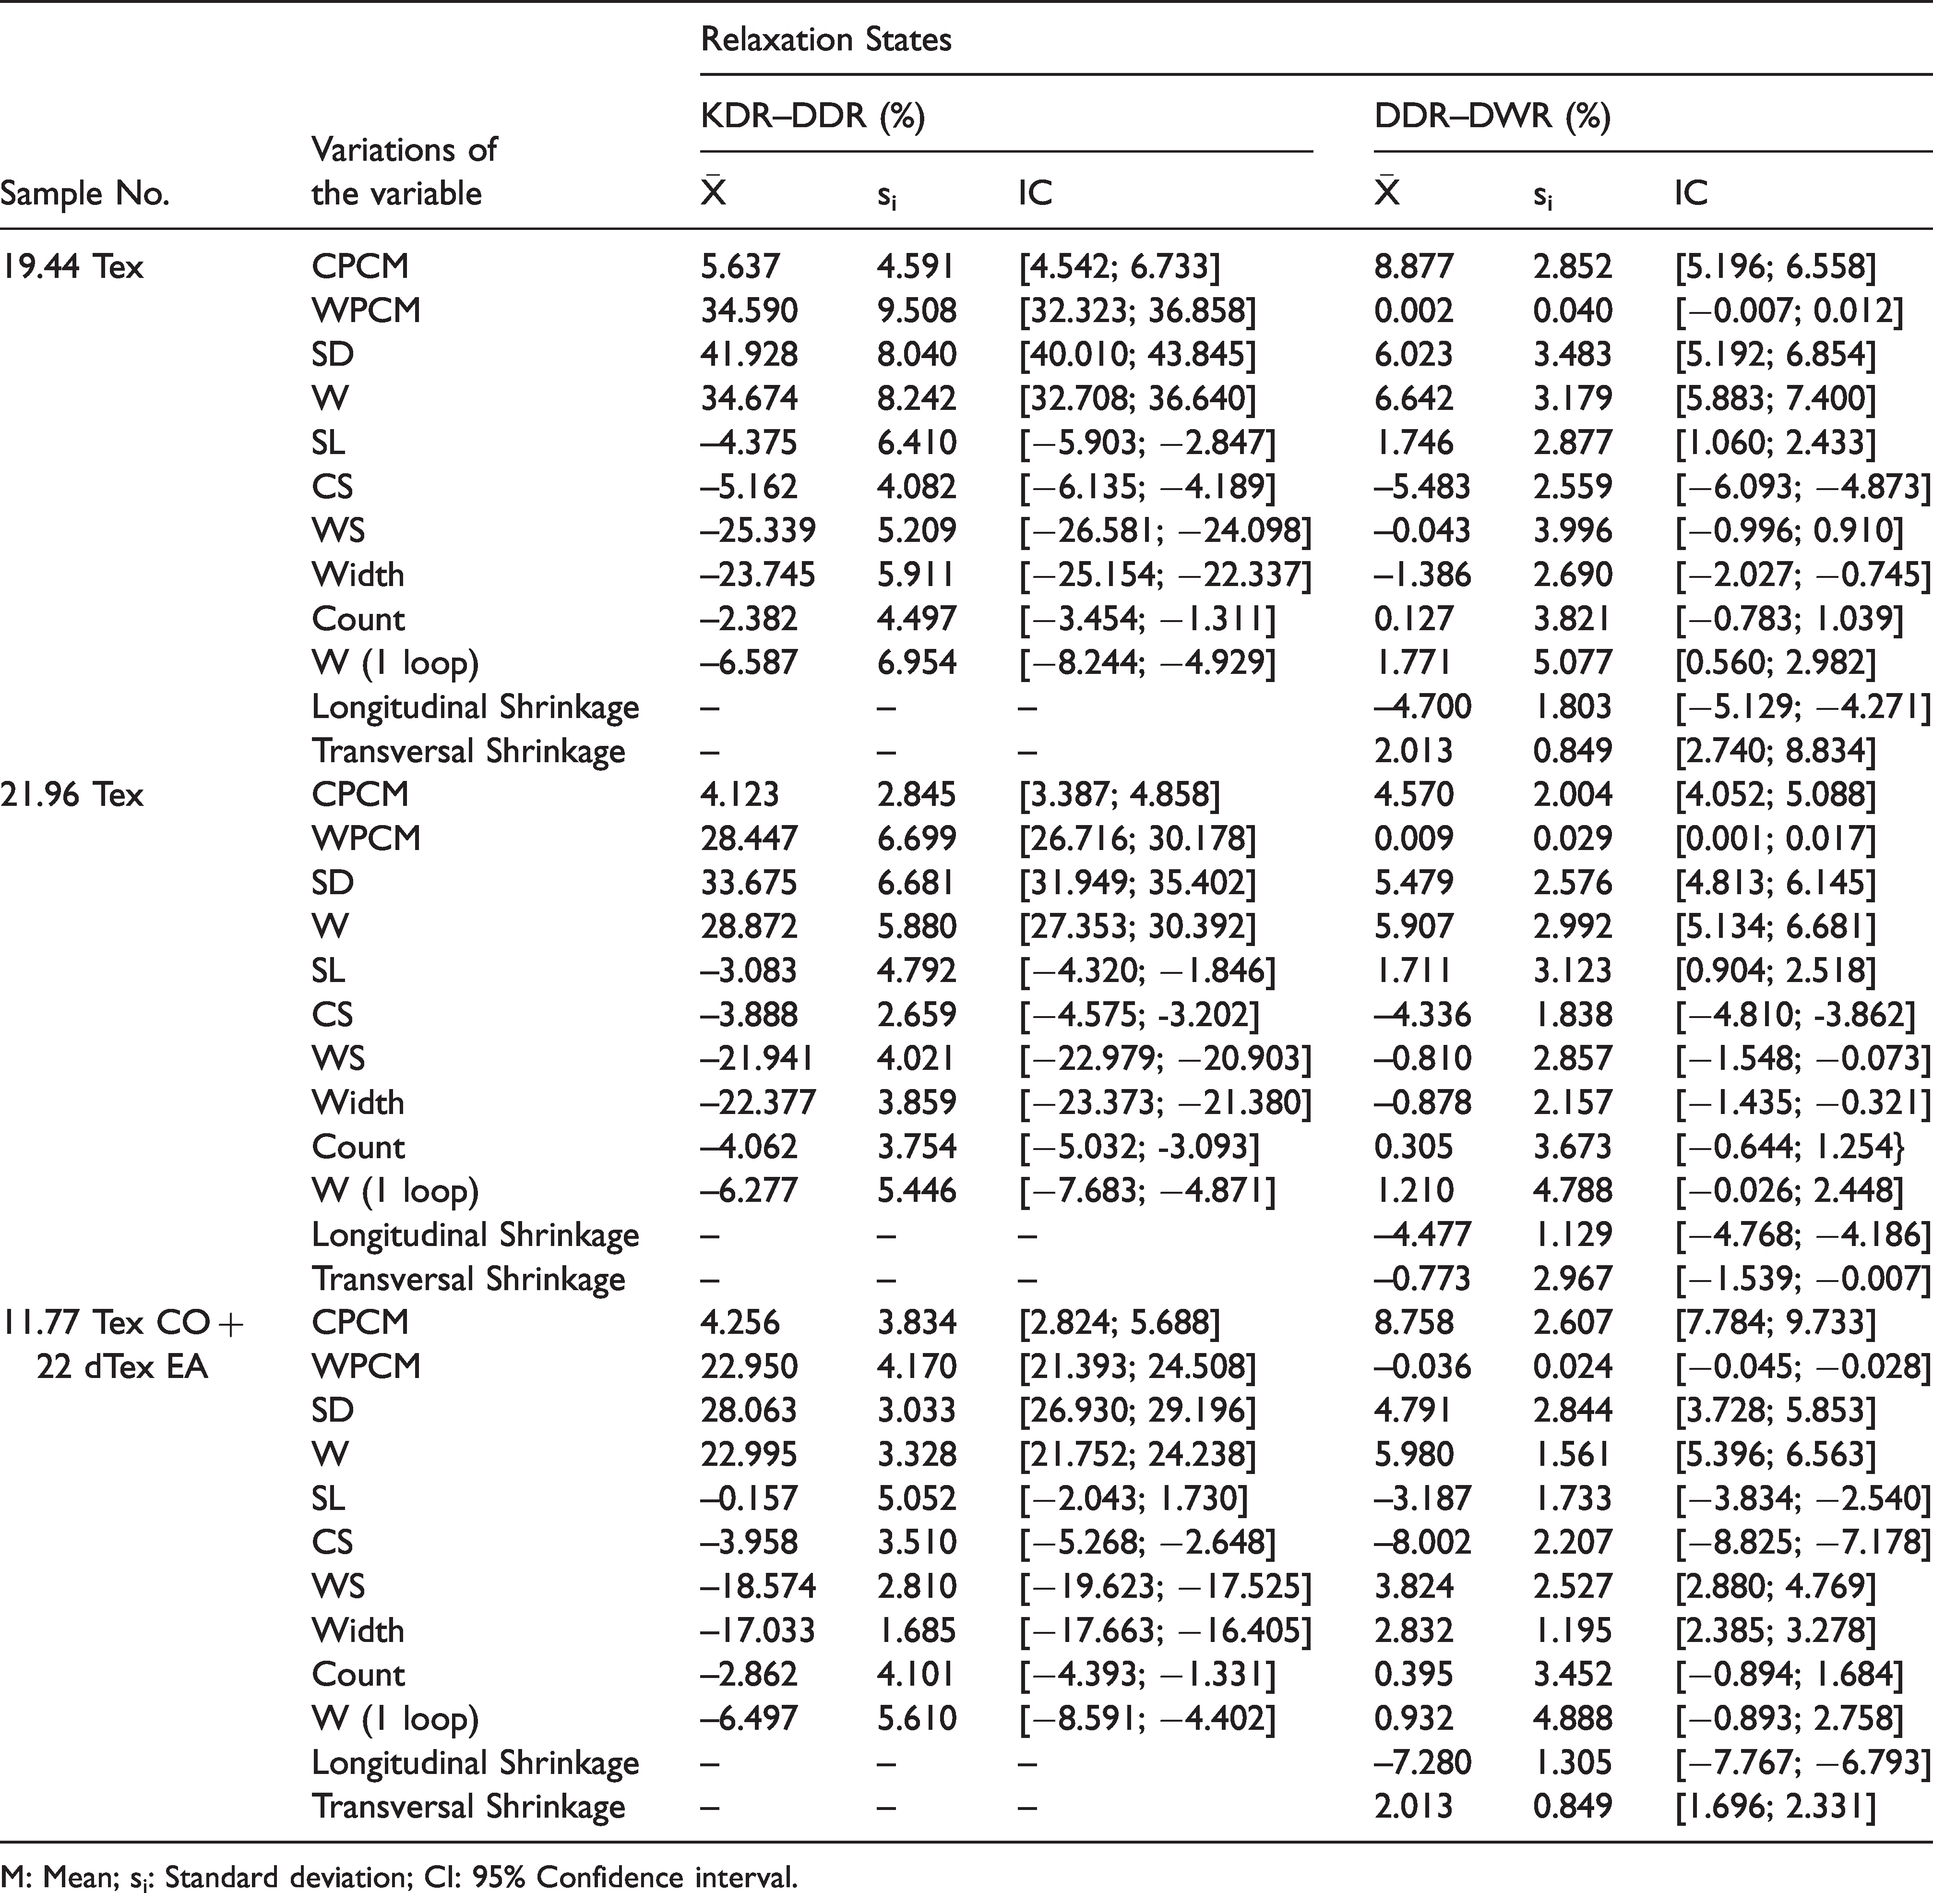
M: Mean; si: Standard deviation; CI: 95% Confidence interval.
Percentage variations obtained from the analysis of three analyzed and produced single jersey structures between relaxation states KDR–DDR and DDR–DWR.
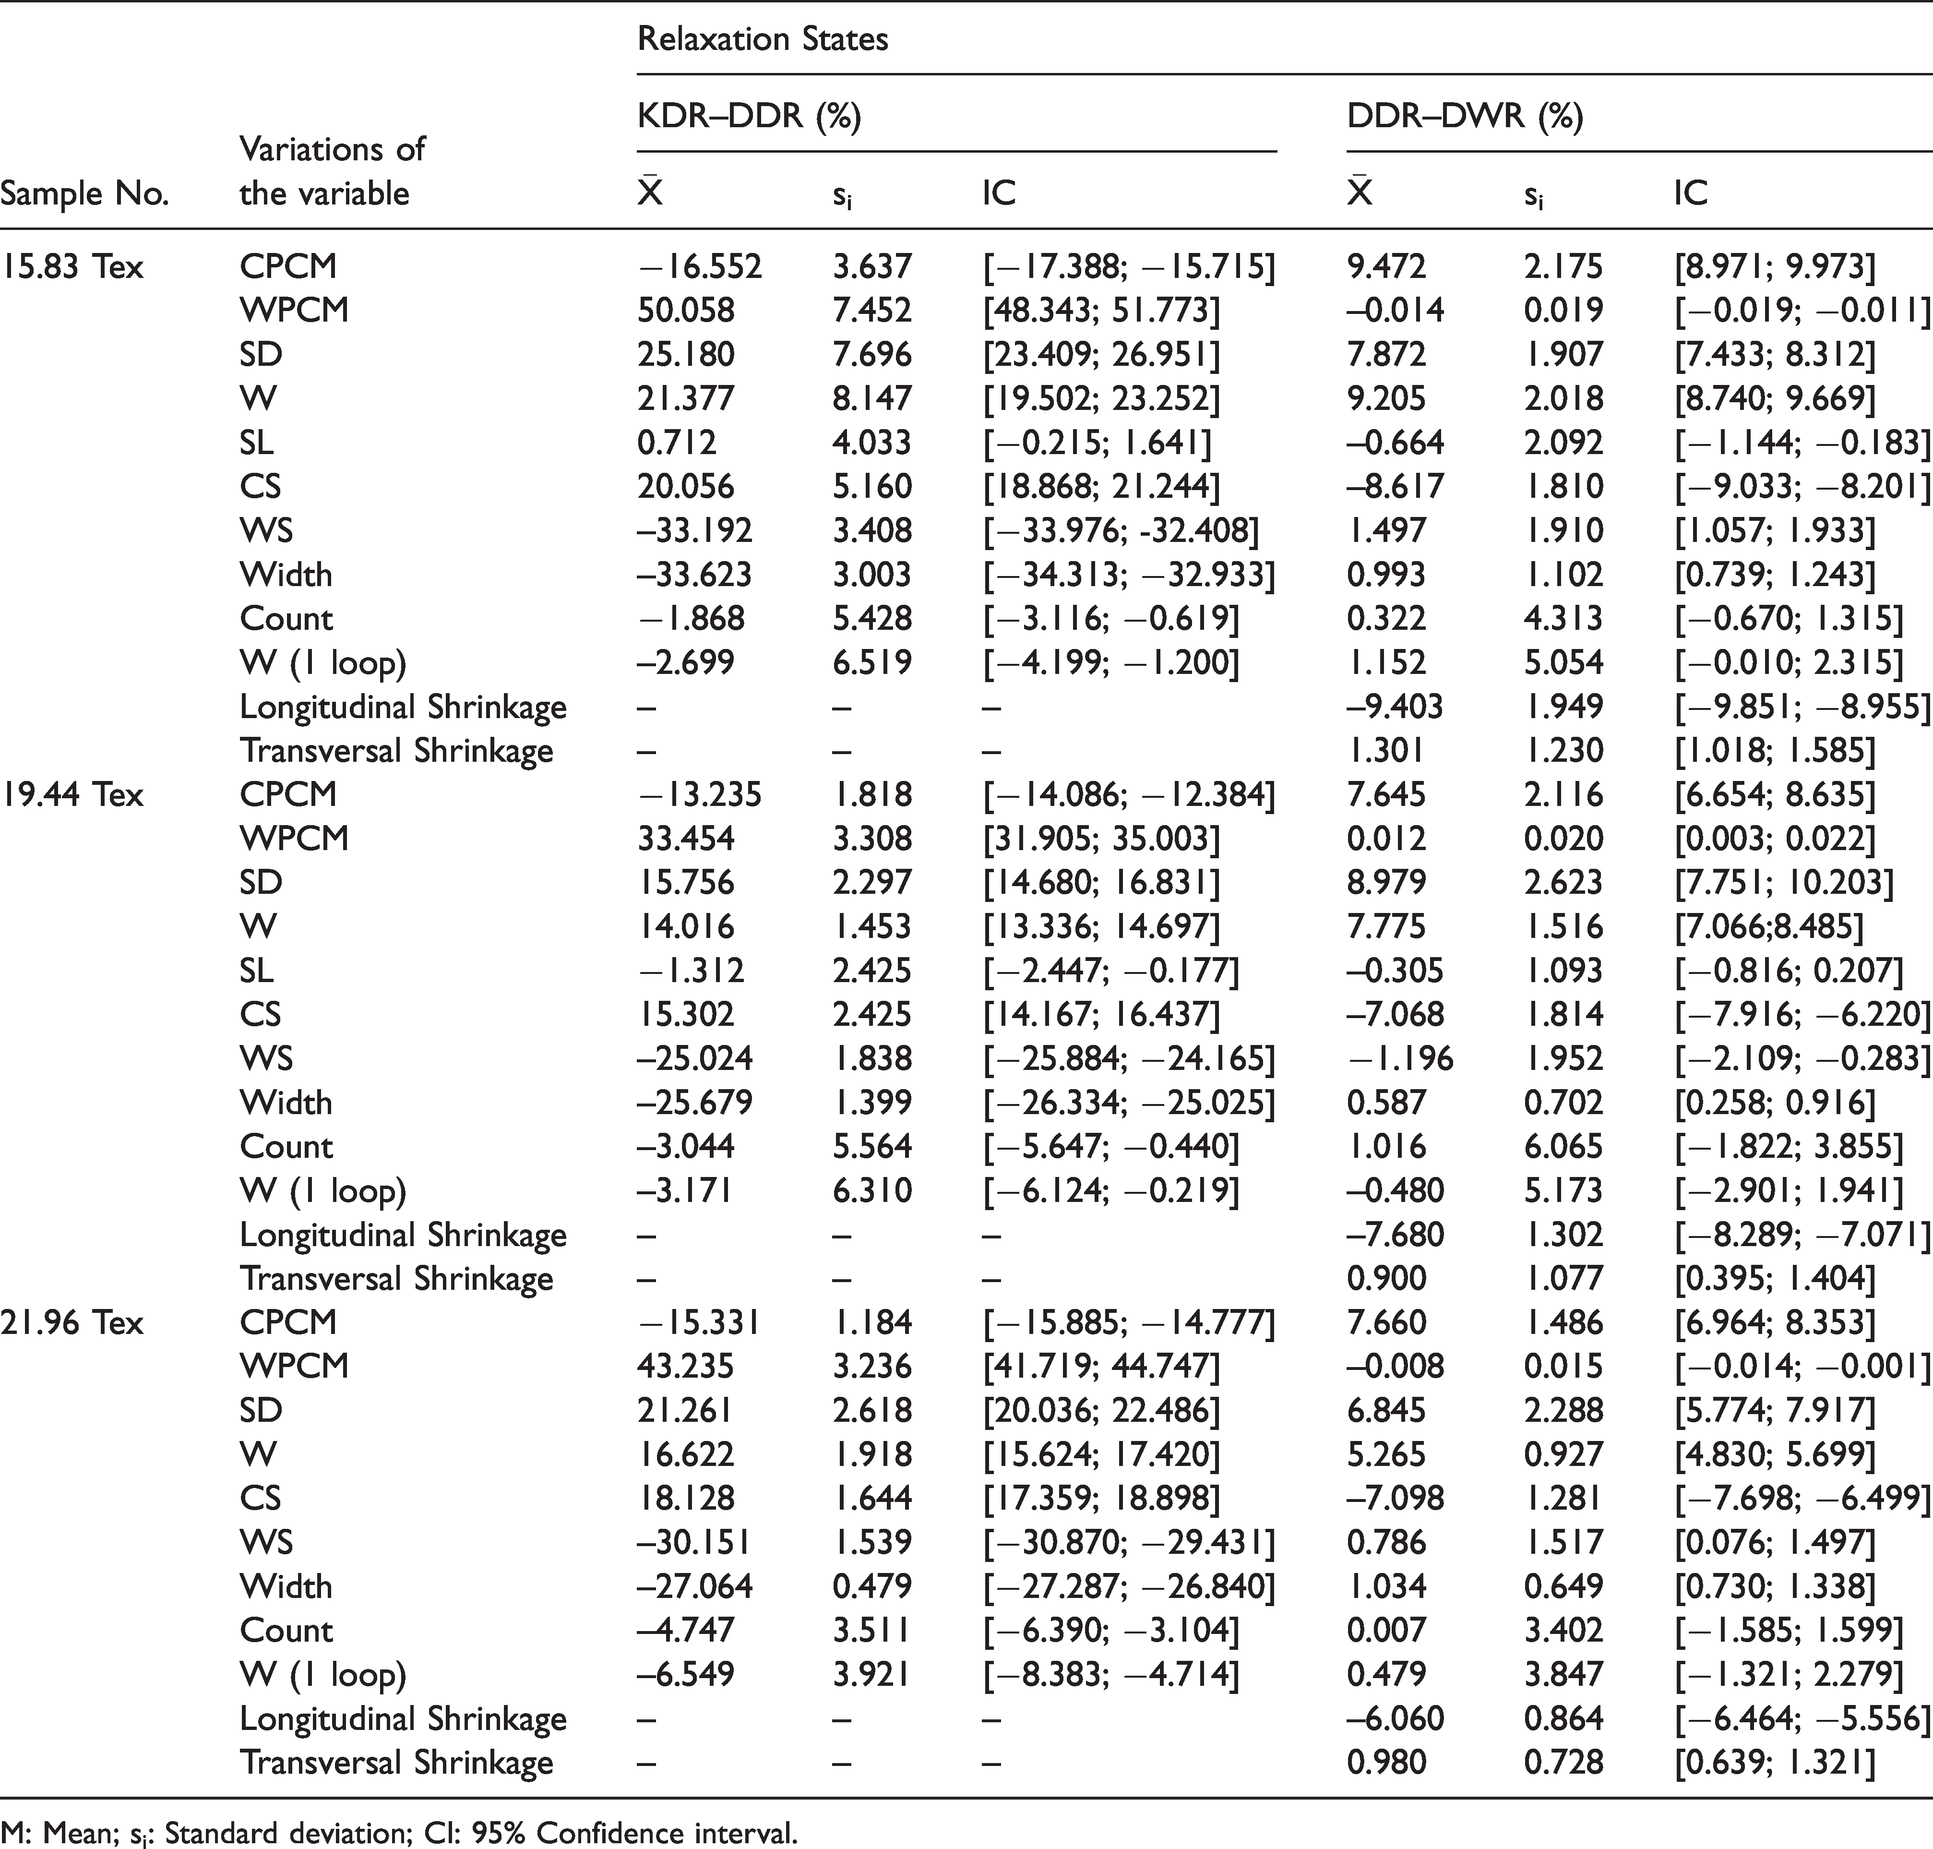
M: Mean; si: Standard deviation; CI: 95% Confidence interval.
Results and discussion
The conclusions drawn from the results obtained with the three analyzed fabric types are provided below: interlock, 1 × 1 rib, and single jersey.
Interlock fabrics
Table 2 shows the results of the percentage variations of the analyzed variables of interlock fabrics.
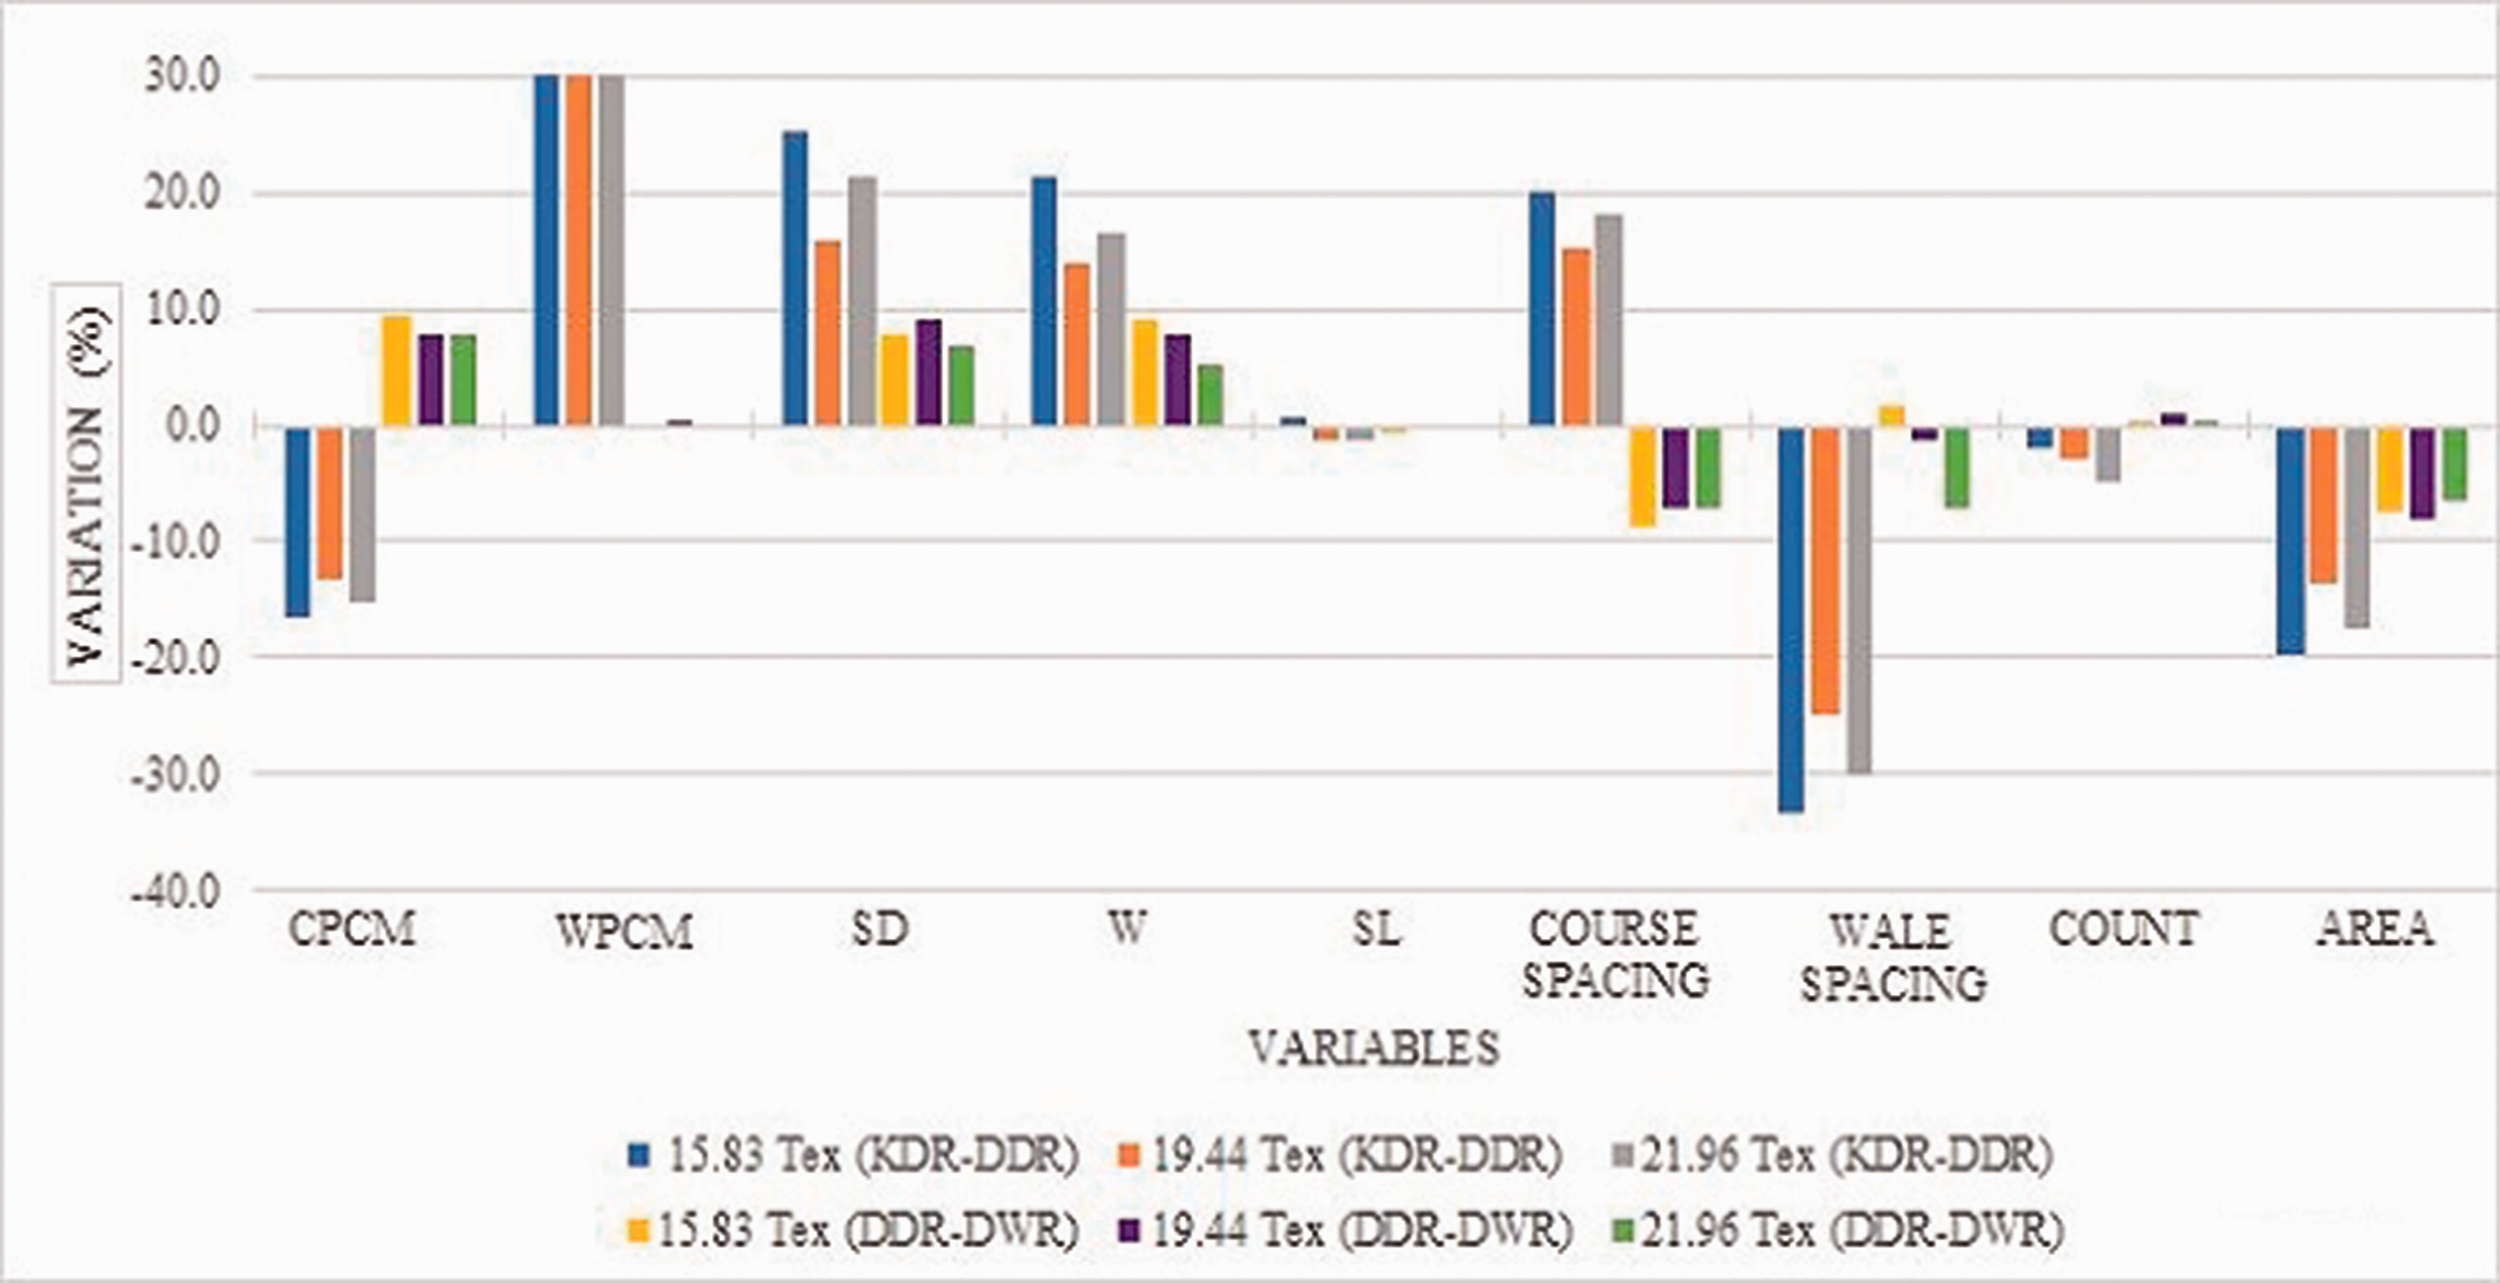
Figure 2 shows the percentage dimensional variations of the most significant variables of the three analyzed interlock structures. We can see how between relaxation states KDR–DDR, the variable that most increased was WPCM, while the wale spacing variable was that which most decreased. The variables weight and SD also significantly increased. Between relaxation states DDR–DWR, the greatest increase was for the CPCM variable, while the course spacing variable decreased the most.
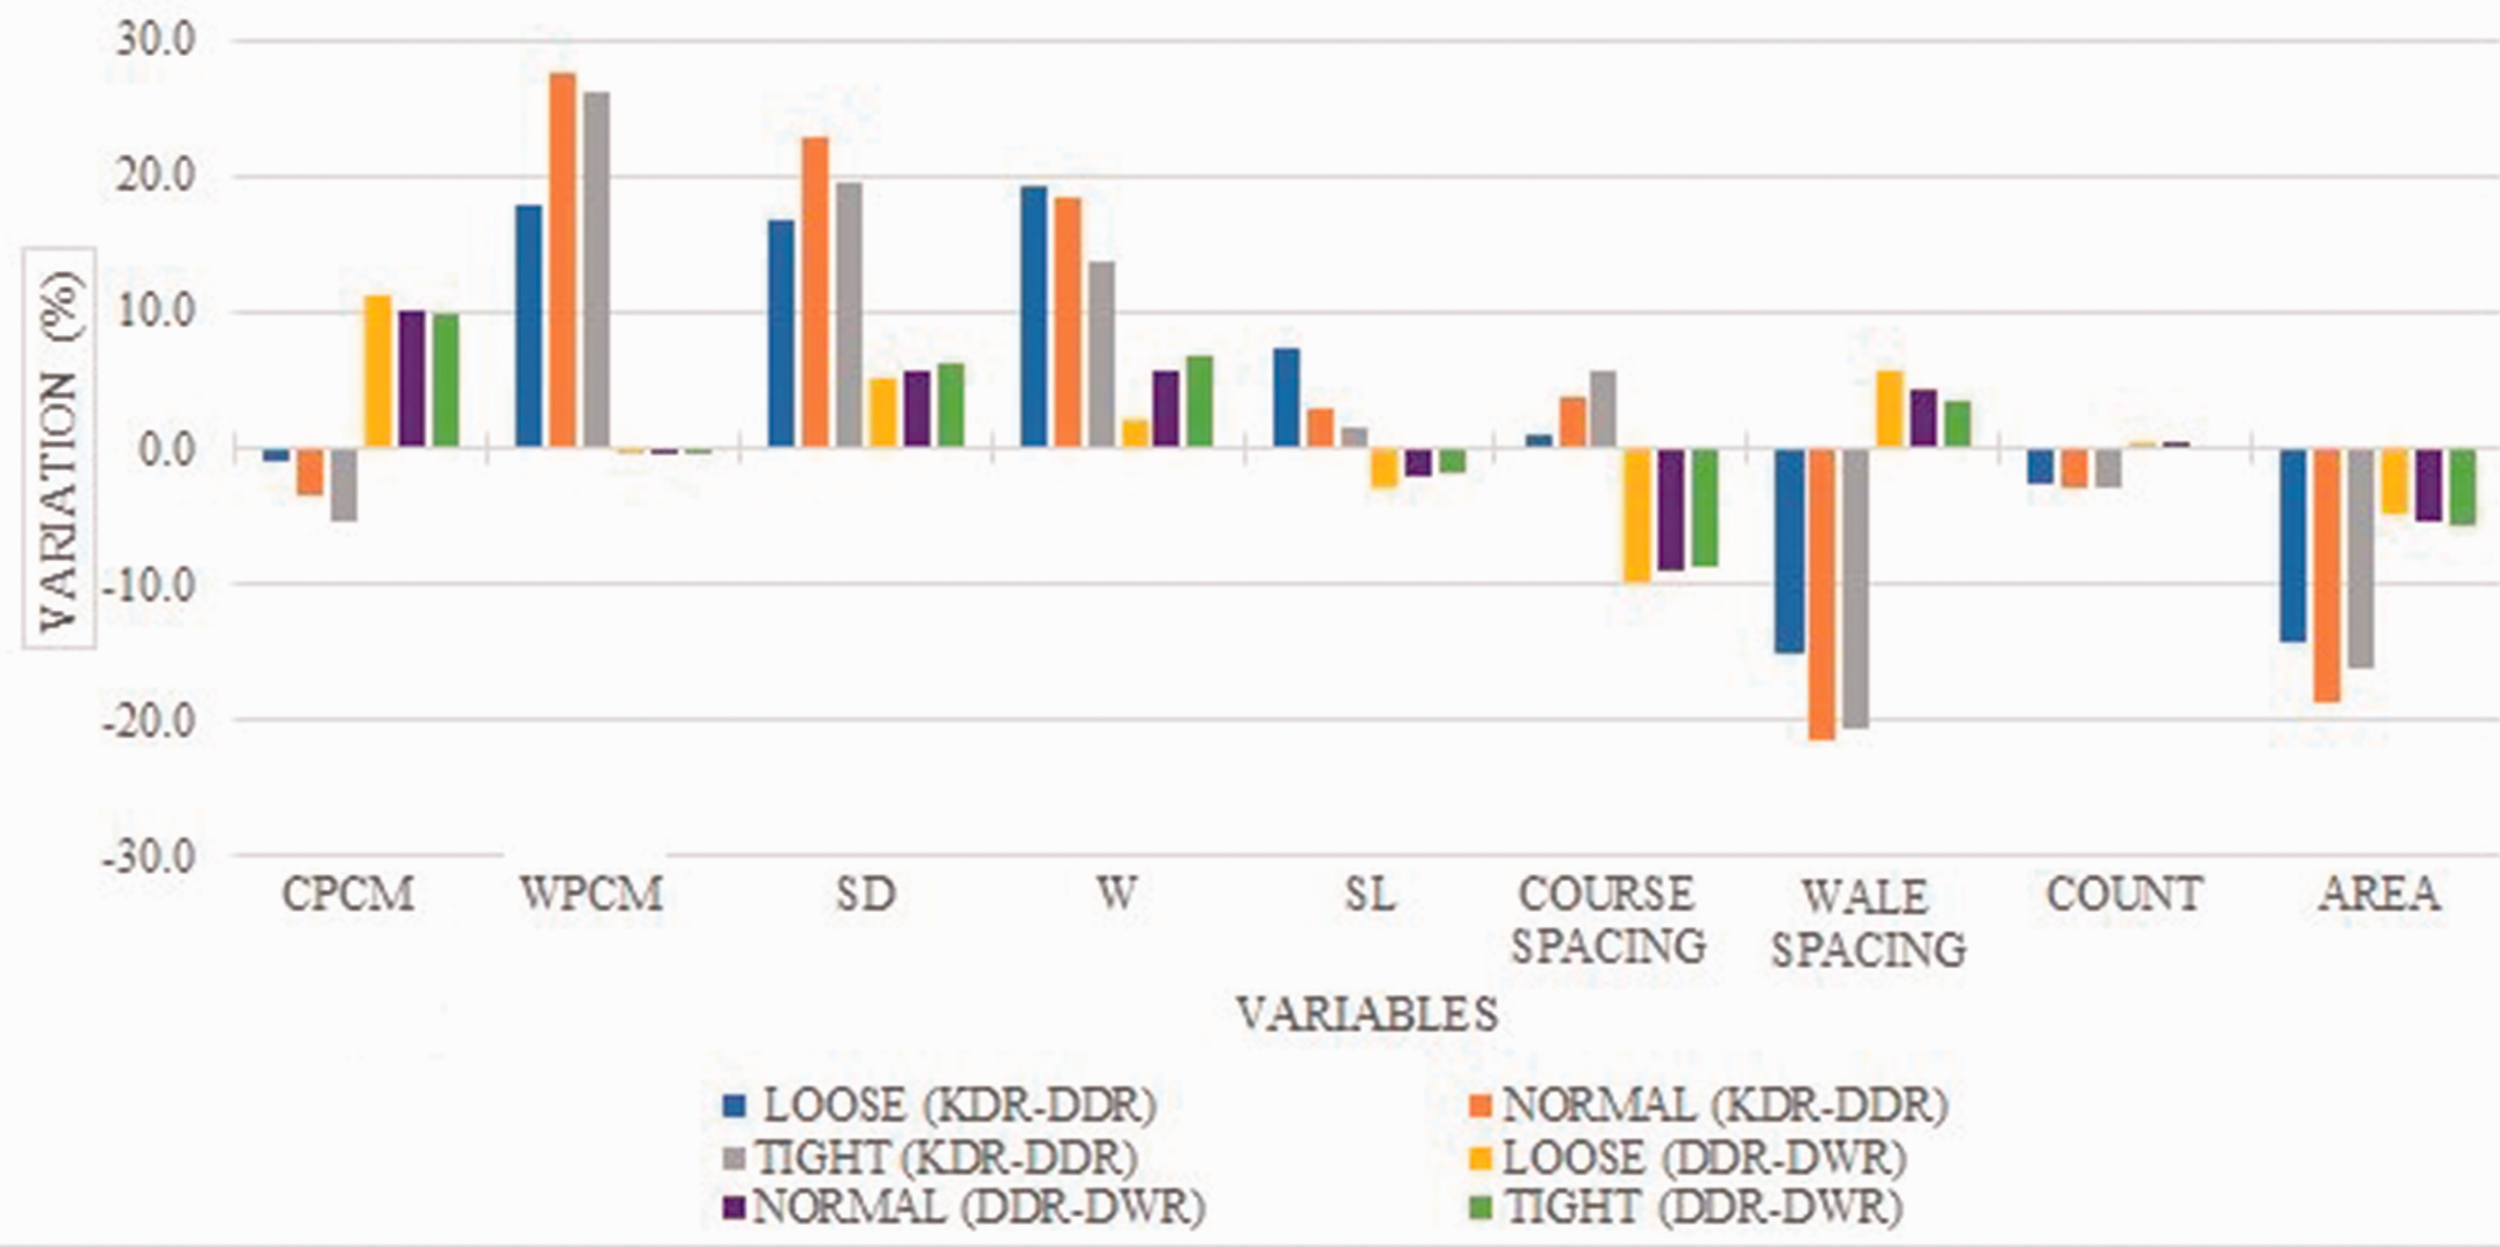
The dimensional variations as percentages obtained by analyzing the three interlock structures made with 19.44 Tex 100% cotton with loosely knitted loops (SL=0.360 cm), intermediately knitted loops (SL=0.340 cm) and tightly knitted loops (SL = 0.320 cm) between relaxation states KDR–DDR and DDR–DWR.
We conclude that the percentage variation of the loop length forming the interlock fabrics showed a more marked dimensional change after the dyeing process, and its length was prolonged up to 7.5% in the more loosely knitted fabrics.
In state DWR, variation did not exceed 3.1% shrinkage. However, this is a relatively minor variation compared with those obtained in dimensional variables Course spacing and Wale spacing, where the variable Course spacing presented the greatest shrinkage after the dyeing process, whereas the widest variation went to the variable Wale spacing after the DWR state.
These two variables are those that determine loop shape in each relaxation state. Therefore, the shape that it takes in the fabric in each relaxation state will be that which will determine a fabric’s dimensional variation to a greater extent.
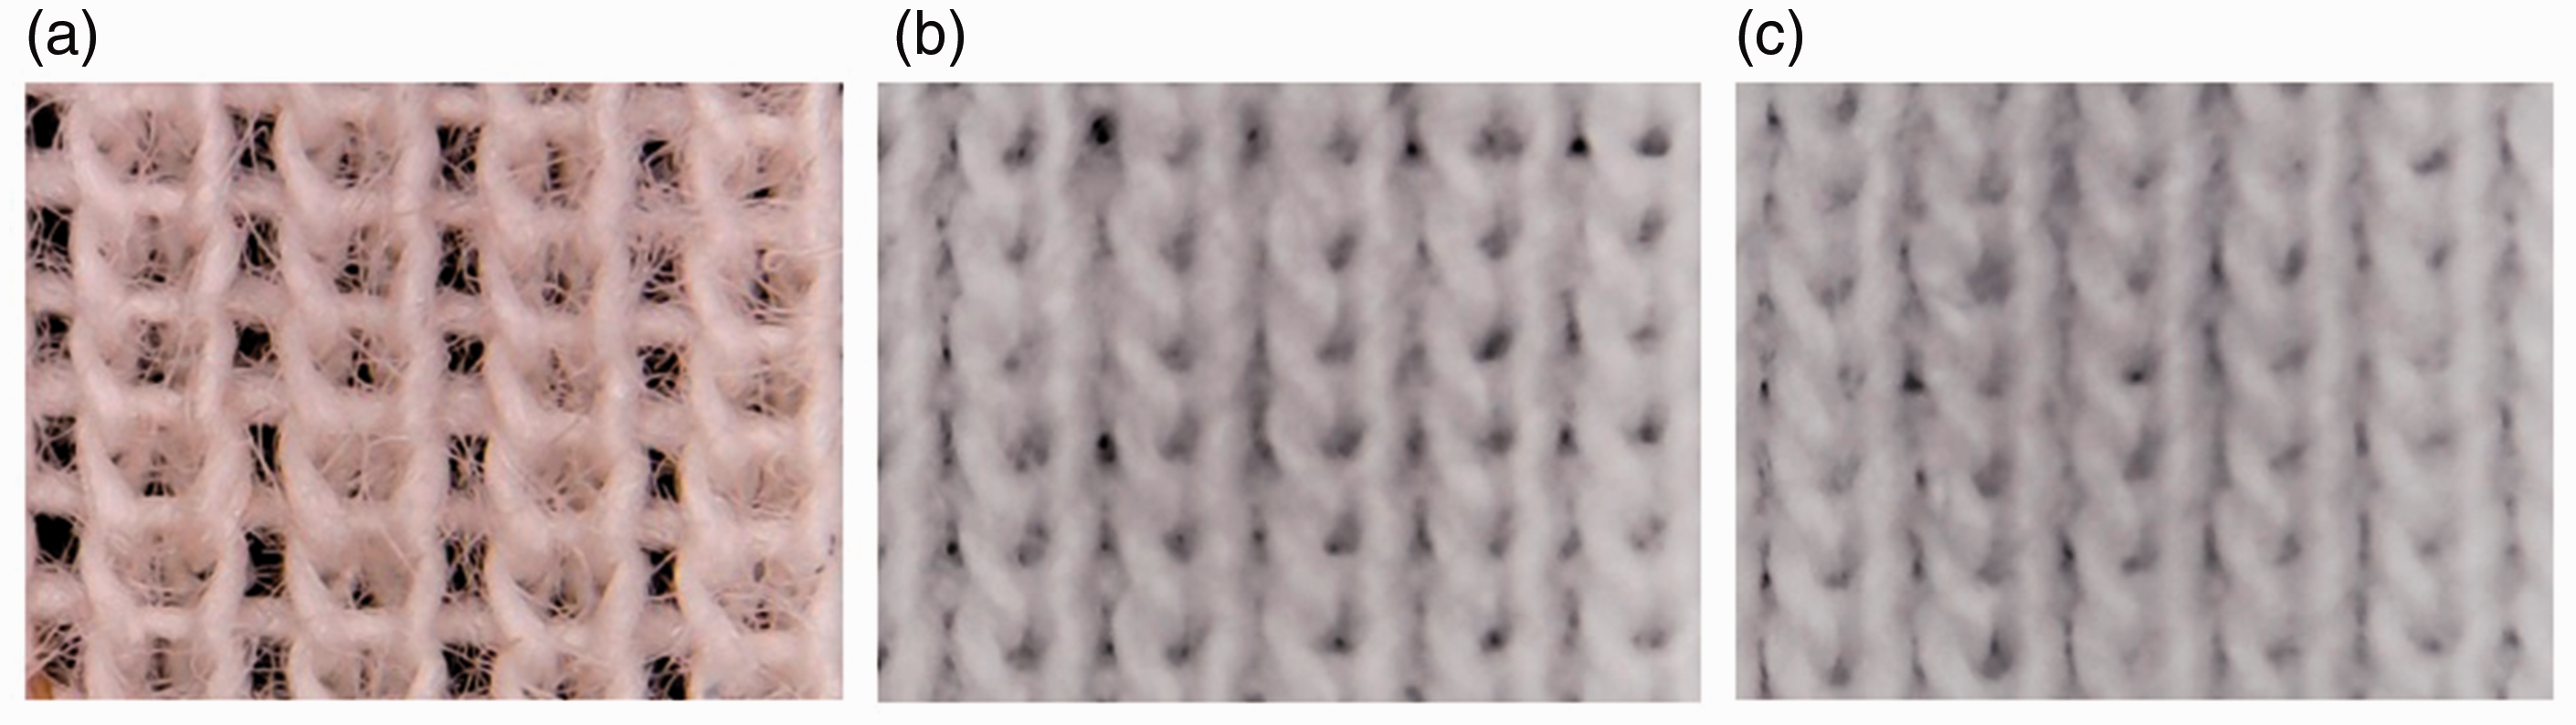
Figure 3 shows the same interlock structure with the yarn count for 19.44 Tex 100% cotton with intermediately knitted loops in relaxation states KDR, DDR, and DWR.
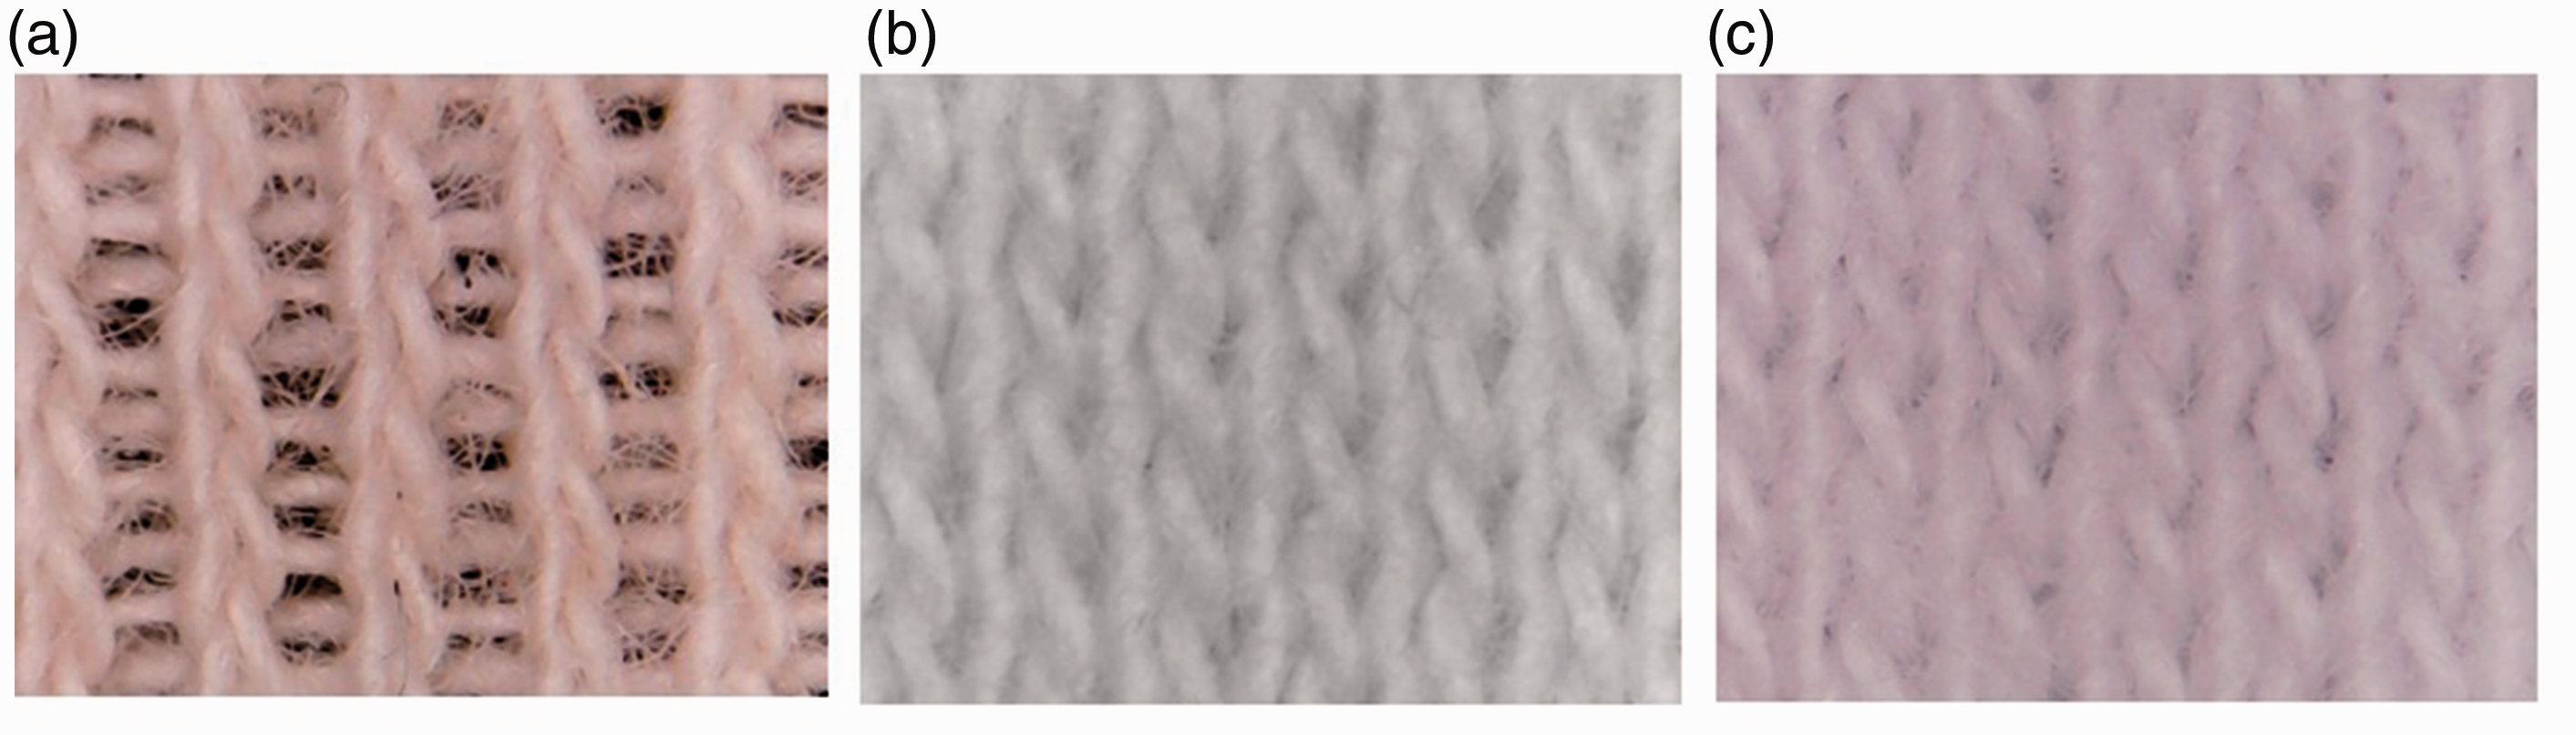
The interlock structure with intermediately knitted loops in relaxation states KDR (a), DDR (b), and DWR (c).
1×1 rib fabrics
Table 3 shows the results of the percentage variations of the analyzed variables of the 1 × 1 rib fabrics.
Figure 4 shows the percentage dimensional variations of the most significant variables for the analyzed 1 × 1 rib structures. The widest variations were obtained between relaxation states KDR–DDR, where the variables WPCM, SD and weight increased the most, and the variables wale spacing and area decreased the most. However, the percentage variations were not so significant between relaxation states DDR–DWR.
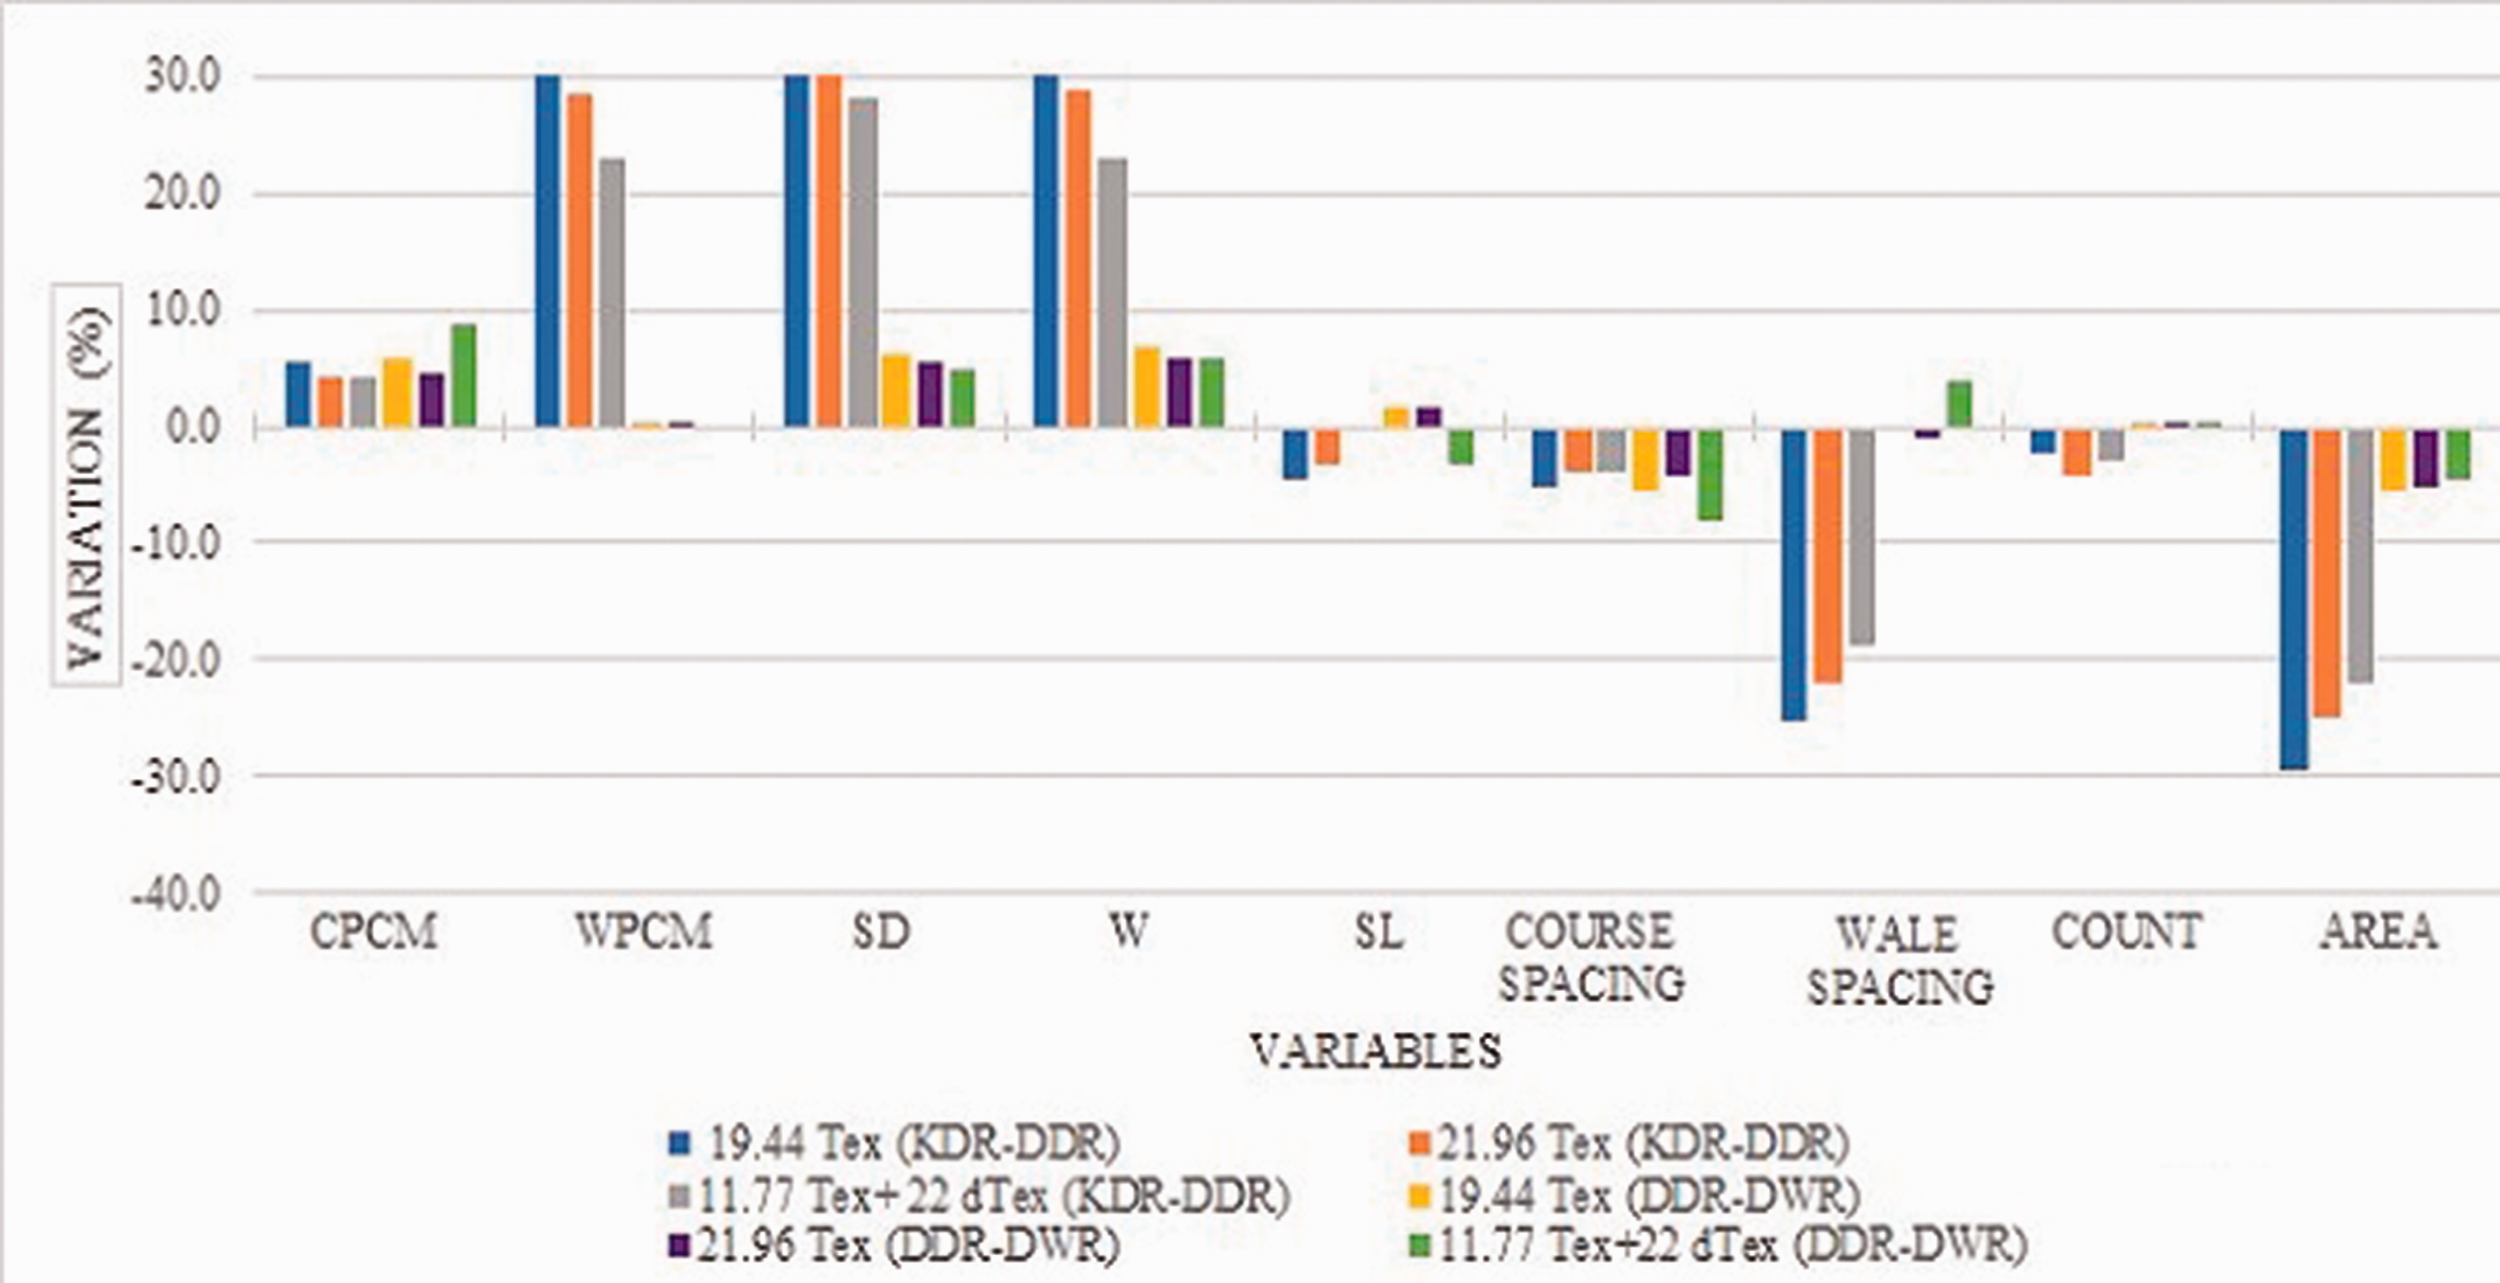
Dimensional variations as the percentages obtained from analyzing the three produced 1 × 1 rib structures, two of which with 19.44 and 21.96 Tex 100% cotton, and one with 11.77 Tex with half-plated 22 dTex elastane, between relaxation states KDR–DDR and DDR–DWR.
The variable Wale spacing presented the widest variation after the dyeing process by shrinking up to a mean of 22% and not stretching by more than 0.9% in the cotton fabrics, but stretched by more than 4% in the cotton/elastane fabrics when it reached its maximum relaxation state. Thus its loop shape changed in width terms. After the dyeing process, the variable Course spacing shrunk less than a mean of 5.2% in all cases. It underwent its most marked change by shrinking by up to 8% between relaxation states DDR–DWR, which conferred the fabric its maximum relaxation state.
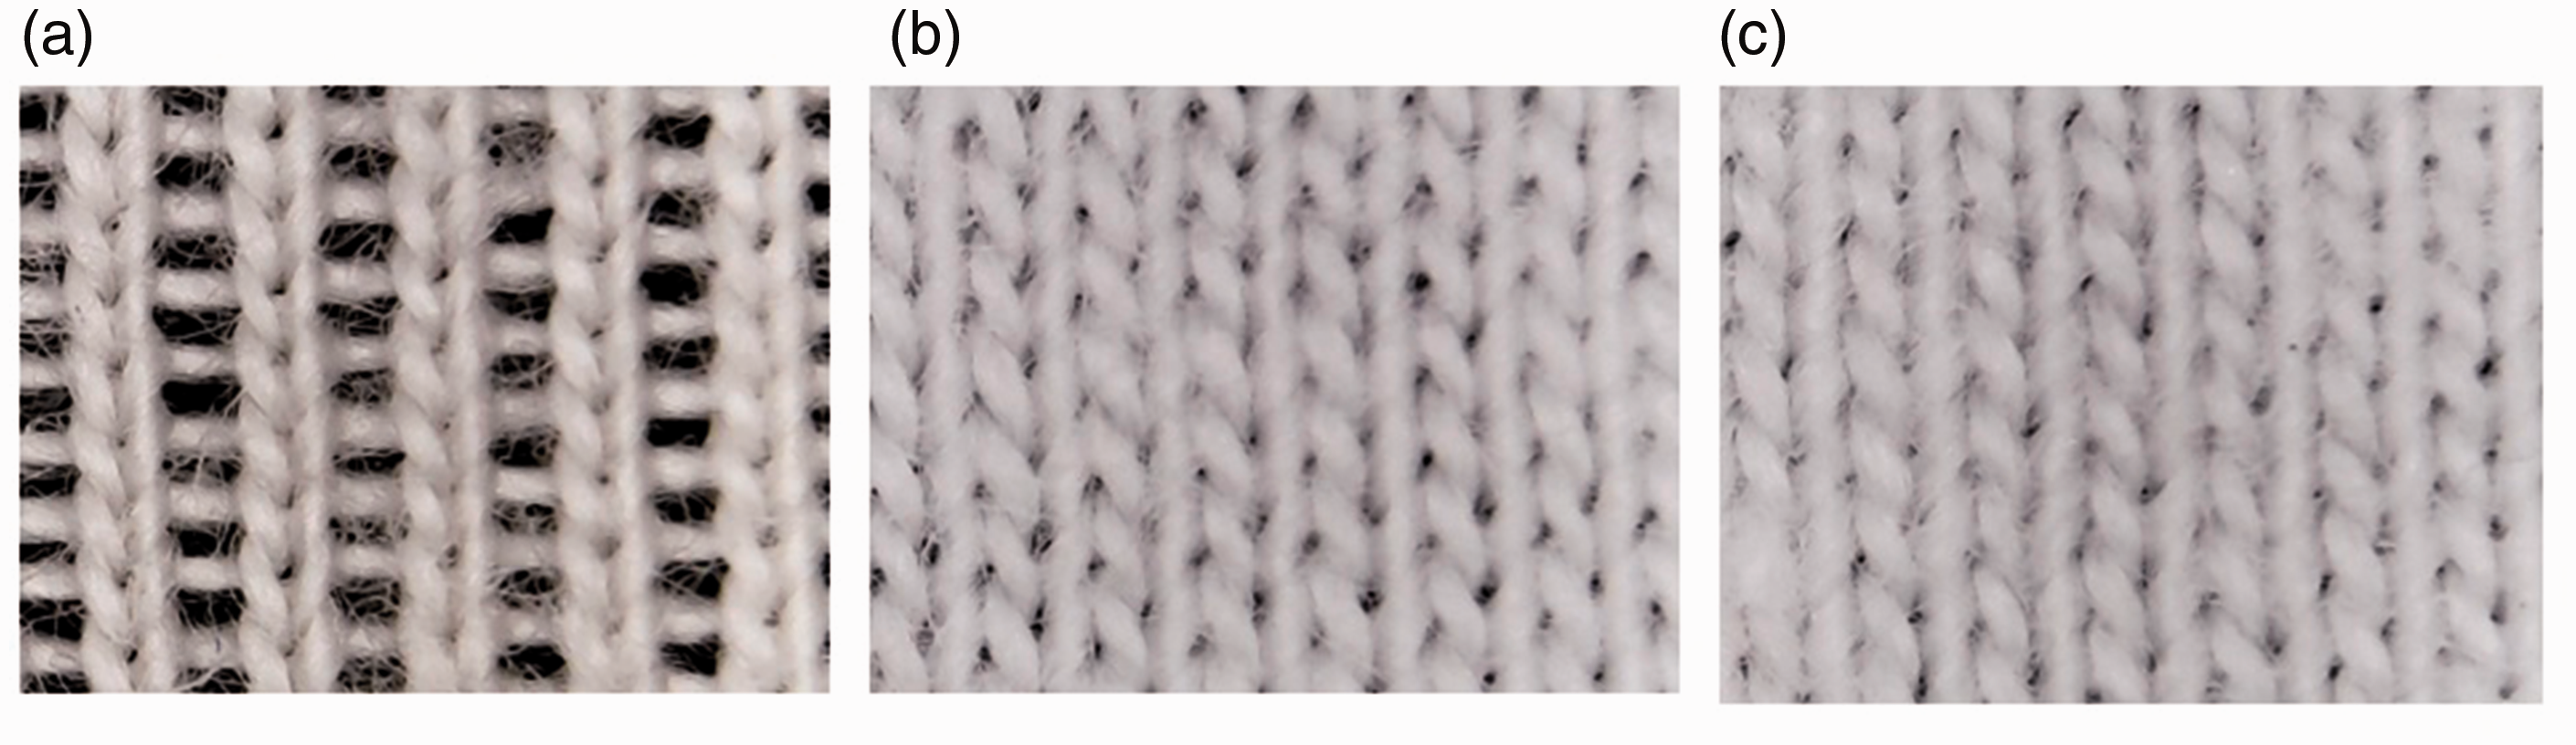
Figure 5 shows the same 1 × 1 rib structure with the 21.96 Tex 100% cotton yarn count in relaxation states KDR, DDR, and DWR.
The 1 × 1 rib structure with the 21.96 Tex yarn count in relaxation states KDR (a), DDR (b), and DWR (c).
Single jersey fabrics
Table 4 shows the results of the percentage variations of the analyzed variables of the single jersey fabrics. Figure 6 graphically illustrates the percentage variations of the variables studied in the single jersey structures.
Dimensional variations in the percentages obtained by analyzing the three single jersey structures made with 15.83, 19.44 and 21.96 Tex 100% cotton between relaxation states KDR–DDR and DDR–DWR.
In the single jersey fabrics, the WPCM variable increased the most between relaxation states KDR–DDR, while the CPCM variable decreased much more discreetly. The variables SD and weight also significantly increased between these two relaxation states, while the variables wale spacing and area decreased the most. However, neither the variations between relaxation states DDR–DWR nor the variation in loop length in all the relaxation states were so relevant.
We concluded that the variable
Figure 7 shows the same single jersey structure with the 21.96 Tex 100% cotton yarn count in relaxation states KDR, DDR, and DWR.
The single jersey structure in relaxation states KDR (a), DDR (b), and DWR (c).
The conclusion drawn from the results obtained after analyzing the fabrics with the interlock, single jersey, and 1 × 1 rib structures, was that fabric shrinkage is not caused by changes in loop length because the loop configuration in each relaxation state is mainly responsible.
After concluding that the loop shape in each relaxation state is responsible mainly for the dimensional variation in all the fabric interlock, 1 × 1 rib, and single jersey structures analyzed between relaxation states KDR–DDR and DDR–DWR, we then analyzed the existing relation among these structures to obtain models to predict the dimensional stability in the longitudinal and transversal directions in the maximum relaxation state (DWR). The loop shape adopted in each relaxation state, which is characterized by the dimensional variables Wale spacing and Course spacing, would be responsible mostly for dimensional variation. The variables chosen to predict dimensional variation were Course spacing (CS) and Wale spacing (WS). As Figure 1 shows, these variables respectively represent the longitudinal and transverse dimension of the tool.
The models obtained by linear regression to predict the variables Wale spacing and Course spacing in relaxation state DWR, by using the same variables known in relaxation state DDR, are found in Table 5.
The linear regression models proposed to estimate the Wale spacing and Course spacing of the analyzed interlock, 1 × 1 rib, and single jersey fabrics in relaxation state DWR.
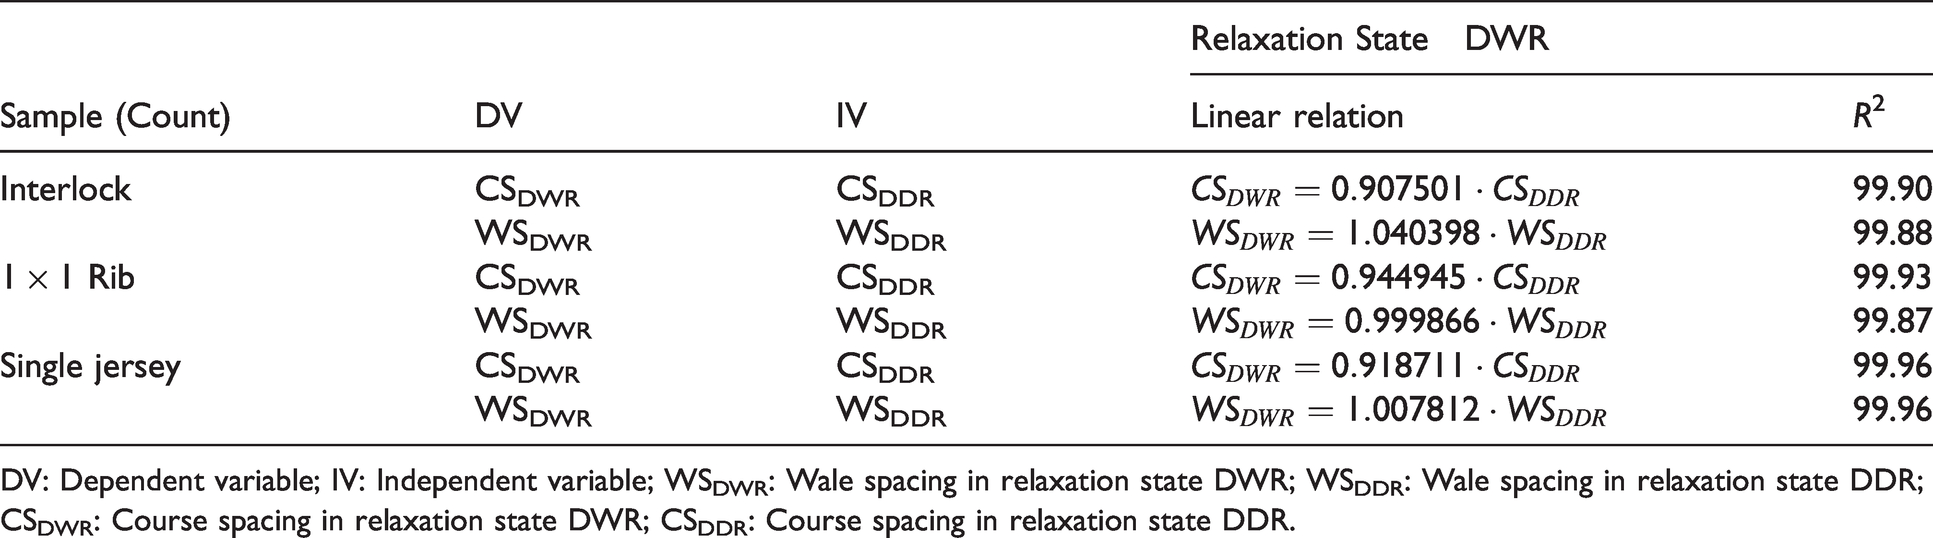
DV: Dependent variable; IV: Independent variable; WSDWR: Wale spacing in relaxation state DWR; WSDDR: Wale spacing in relaxation state DDR; CSDWR: Course spacing in relaxation state DWR; CSDDR: Course spacing in relaxation state DDR.
Figures 8 and 9 graphically represent the models obtained by linear regression to estimate Course spacing in relaxation state DWR according to knowledge of the same variable in state DDR for the 1 × 1 rib and single jersey structures, respectively.
Graphical representation of the model obtained by linear regression to predict the variable Course spacing in relaxation state DWR knowing the same variable in state DDR for the 1 × 1 rib structures.
Graphical representation of the model obtained by linear regression to predict the variable Course spacing in relaxation state DWR knowing the same variable in state DDR for the single jersey structures.
Once the value of variables WSDWR and CSDWR are known, the dimensional variation in length and width can be estimated by these equations:


With the models proposed for the interlock, 1 × 1 rib, and single jersey structures (Table 5), longitudinal shrinkage and transversal shrinkage can be predicted with knowledge about the independent variables Wale spacing and Course spacing in relaxation state DDR. These models presented an R2 above 99% in all cases, which very well explains variability according to the linearity with the independent variables Wale spacing and Course spacing. This speeds up the process to calculate them because it avoids having to apply the normal procedure according to Standard UNE-EN ISO 6330 of September 2012, procedure 4N. This saves time by not having to perform the whole process.
Next the proposed models were validated by a process that consisted of analyzing the set of the representative items of each fabric and machine diameter. This analysis involved determining the dimensional variation in length and width according to Standard UNE-EN ISO 6330 of September 2012 to, thus, obtain the real value. In parallel, these variables were estimated using the proposed models. The estimated error would be the difference between the estimated values and the real values.
The estimated errors of the models proposed to estimate the dimensional variation in the 1 × 1 rib, interlock, and single jersey knitted fabrics in relaxation state DWR were minor and always below 2% for both length and width. Thus we conclude that these models very efficiently presented the variability obtained from all the proposed fabric structures. This was evidenced in the results obtained in the interlock, single jersey, and 1 × 1 rib structures: fabric shrinkage was not caused by changes in yarn length because the loop configuration in each relaxation state was the most responsible factor.
Conclusions
This study investigated variations in the percentage values obtained with the dimensional variables analyzed in the three basic single jersey, 1 × 1 rib, and interlock structures. For each structure, three fabric types were analyzed with different counts and loop lengths.
The results obtained in the interlock, single jersey, and 1 × 1 rib structures evidenced that fabric shrinkage is not caused by changes in yarn length because the loop configuration in each relaxation state was the most responsible factor.
Loop length was found to affect fabric dimensions when knitting machine feeders were fed more or less yarn which would, hence, lead to more tightly or more loosely knitted fabrics. After knitting the structure, the loop shape inside the fabric in each relaxation state would be responsible mainly for its dimensional variations. To a great extent, loop shape would depend on the strains that fabrics undergo, caused by stretchings during the production process. This means that the loop has to take a given shape because the loop itself is unable to overcome any friction forces between these loops to return to its minimum energy state. This also means that several washing cycles with stirring are necessary so that fabrics can return to their maximum relaxation state.
We proposed linear regression models to predict the dimensional variables Wale spacing and Course spacing in relaxation state DWR for the interlock, 1 × 1 rib, and single jersey structures. With knowledge about these variables, the longitudinal shrinkage and transversal shrinkage of the proposed fabrics were predicted, which speeds up the process to calculate them because it avoids having to apply the conventional procedure in line with Standard UNE-EN ISO 6330 of September 2012. Consequently, this saves time being spent on performing the whole process.
While validating these models, any estimated errors were only very slight. Therefore, we conclude that these models explained the variability obtained with all the proposed fabric structures.
All these results demonstrate that the proposed models are suitable for calculating the dimensional stability of both the length and width of the analyzed interlock, 1 × 1 rib, and single jersey fabrics using knowledge about the variables Wale spacing and Course spacing in relaxation state DDR.
This study is of much relevance for technicians of textile industries as it greatly simplifies the production calculations made in weft-knitted fabrics companies. It offers an effective method to predict both longitudinal and transversal shrinkages of knitted fabrics after the dyeing process from loop dimension after the knitting process. Applying the results of this study may save businesses considerable time and, consequently, imply an intermediate product stock investment saving. By applying the developed model, businesses will no longer need to use common calculation methods in line with Standard EN ISO 6330 – 2012, which requires a 1-day production standstill.
Footnotes
Declaration of conflicting interests
The authors declared no potential conflicts of interest with respect to the research, authorship, and/or publication of this article.
Funding
The authors received no financial support for the research, authorship, and/or publication of this article.