
Abstract
Temperature-sensing textiles have been proposed for a variety of applications, including health monitoring and sports. Skin temperature (Tsk) measurements are an important parameter in performance sports and can be used to better understand thermoregulation during exercise. Currently, most Tsk measurements are taken using skin-mounted thermistors, which can be uncomfortable to the wearer, or thermal imaging, which can be difficult to implement and analyze. This work investigates the feasibility of using textile temperature-sensing electronic yarns (E-yarns) to measure human skin temperature during sub-maximal cycling trials. E-yarns were attached to commercially available cycling suits and measurements were recorded using both the E-yarns and the skin-mounted thermistors at rest and during sub-maximal cycling. Temperature readings were compared between the two temperature-sensing methodologies to determine the viability of using the temperature-sensing E-yarns for this application. Differences in the Tsk measurements as high as 5.9℃ between the E-yarns and skin-mounted thermistors for participants at rest have been shown. This work has also identified that a build-up of sweat significantly altered the Tsk recorded by the E-yarns in some cases. Further experiments explored the effect of saline solutions (simulating sweat) on the response of the temperature-sensing E-yarns. This work has highlighted boundary conditions for taking point Tsk measurement using electronic textiles.
Keywords
Various temperature-sensing electronic textiles (E-textiles) have been presented in the literature.1–3 Despite the number of devices proposed there has been limited work where these devices have been practically tested for a specified use case, especially for extreme circumstances, such as for sports applications where there would be significant physical movement and dynamic temperature changes.
This study presents a rigorous user trial of temperature-sensing electronic yarns (E-yarns) for the on-body monitoring of skin temperature (Tsk) during sub-maximal cycling trials. The temperature measurements were compared to skin-mounted thermistors, which is the current state-of-the-art for Tsk measurement in the field of thermal physiology.
In sport, changes in body temperature are associated with alterations in performance, owing to perceptual and physiological changes that inform pacing strategies.4–6 To combat the impact of environmental temperature on performance, athletes often undergo a period of acclimatization when preparing for competitions in the heat.7,8 Measurement of Tsk during such activities may help in the optimization of acclimatization protocols to ensure that an athlete is well prepared for exposure to the heat. In addition, heat stress in the form of exertional heat illness is particularly prevalent in some sports and can lead to significant health complications and even fatalities.9,10 To a lesser degree, heat stress can also impair athletic performance during endurance sports, with the extent to which this effect is evident being determined by changes in the core and skin temperature of the body. 11 Further, Tsk can be used in combination with other measurements to better understand whole body thermo-physiology. 11
Currently, the monitoring of body temperature during exercise is limited by the available technology and is largely confined to the laboratory. While Tsk is typically recorded using skin-mounted thermistors,12,13 these thermistors may not prove to be comfortable when placed in certain locations, which may subsequently affect the performance of an athlete. Further, the thermistors may not remain adhered to the skin during excessive sweating or for water-based studies (i.e. swimming), which reduces the reliability of the data collected.
An alternative method involves the use of infrared (IR) thermal imaging cameras,14–18 which can provide a whole-body surface map of skin temperature. However, the cost of these cameras is often prohibitive, preventing widespread adoption outside of the laboratory. Thermal imaging is also influenced by a number of factors, including the emissivity levels of the skin. 14 While early work suggested that emissivity may change with sweating, 15 more recent studies have disputed this. 16 Finally, thermal cameras require careful calibration before use and are not well suited to local measurements, in part because the camera takes a two-dimensional (2D) image of a three-dimensional (3D) structure. 16
E-textiles can offer a platform for the integration of electronics that are comfortable to wear 19 and therefore would offer an excellent substitute for taking Tsk measurements using skin-mounted thermistors. This work focuses on the use of temperature-sensing E-yarns, 20 allowing for accurate point measurements of temperature, which is not possible with some other temperature-sensing E-textile types. The moisture management characteristics of a fabric woven with E-yarns (solar cell embedded E-yarns) has previously been demonstrated in the literature, and the drapability of the woven fabric was also shown. 21 As well as through weaving, E-yarns can also be integrated into a garment using knitting or embroidery. A wealth of work has been conducted with temperature-sensing E-yarns20,22,23; however, to date, an extensive user trial with corresponding data from a commercially available skin-mounted temperature sensor has yet to be conducted.
The aim of this investigation was to understand whether E-yarns could be used to accurately measure Tsk and to identify boundary conditions for their use. A secondary aim of this study was to provide a resource for those developing E-textiles for the determination of skin temperature during various activities.
Materials and methods
Temperature-sensing electronic yarns
The temperature-sensing E-yarns utilized in this work were similar to those previously described in the literature20,22,23 and identical to the design described here.
24
Unless otherwise stated, the E-yarns were produced using a four-stage, semi-automated production process.25,26 Firstly, IR reflow soldering was used to solder a 10 kΩ Negative Temperature Coefficient (NTC) thermistor (1.0 mm × 0.5 mm × 0.5 mm; Murata 10 kΩ 100 mW 0402 SMD NTC thermistors, part number NCP15XH103F03RC; Murata, Kyoto, Japan) onto thin, multi-strand, copper wires (seven strands; single strand diameter = 50 µm; Knight Wire, Potters Bar, UK). The thermistor, solder-joints, and a supporting yarn (100 denier multifilament Vectran yarn; Vectran™, Kuraray America Inc., Houston, USA) were then protected within a cylindrical polymer resin micro-pod (approximately 4 mm length, 1 mm diameter; Dymax Multi-Cure® 9001-E-V3.5, Dymax, Torrington, CT, USA). The copper wires, supporting yarn, and micro-pod were then twisted together with three cotton yarns (Nm 30/1*2 Davido; Boyar Textile, Istanbul, Turkey) using an Agteks DirecTwist 2B6 machine (Agteks, Istanbul, Turkey) in order to prevent the migration of fine copper wires to the outer surface of the E-yarn. The resulting twisted ensemble was then surrounded by four polyester packing fibers (167 dtex/48 filaments; J. H. Ashworth and Son Ltd, Hyde, UK) to increase the yarn uniformity, and finally was covered by a tubular warp-knitted structure using a knit-braiding machine (six-needle, 2 mm cylinder diameter; RIUS MC-Knit braider; RIUS, Barcelona, Spain); the tubular warp-knitted structure was made using six polyester yarns (167 dtex/36 filaments; J. H. Ashworth and Son Ltd). This resulted in a temperature-sensing E-yarn with an outer diameter of approximately 1.5 mm and the look and feel of a normal textile yarn (see Figure 1). A 200 mm long yarn, with a single micro-pod, weighed 0.15 g.
Stages in the temperature-sensing electronic yarn production: (a) a commercially available thermistor was soldered onto two multi-strand copper wires; (b) the solder-joints, thermistor, and a high-strength supporting fiber were encapsulated within a resin micro-pod; (c) the copper wire micro-pod filament was twisted around additional supporting yarns; (d) the copper wire micro-pod filament was covered with packing fibers and a knitted fibrous sheath, consolidating the structure and providing the final electronic yarn with the look and feel of a normal yarn.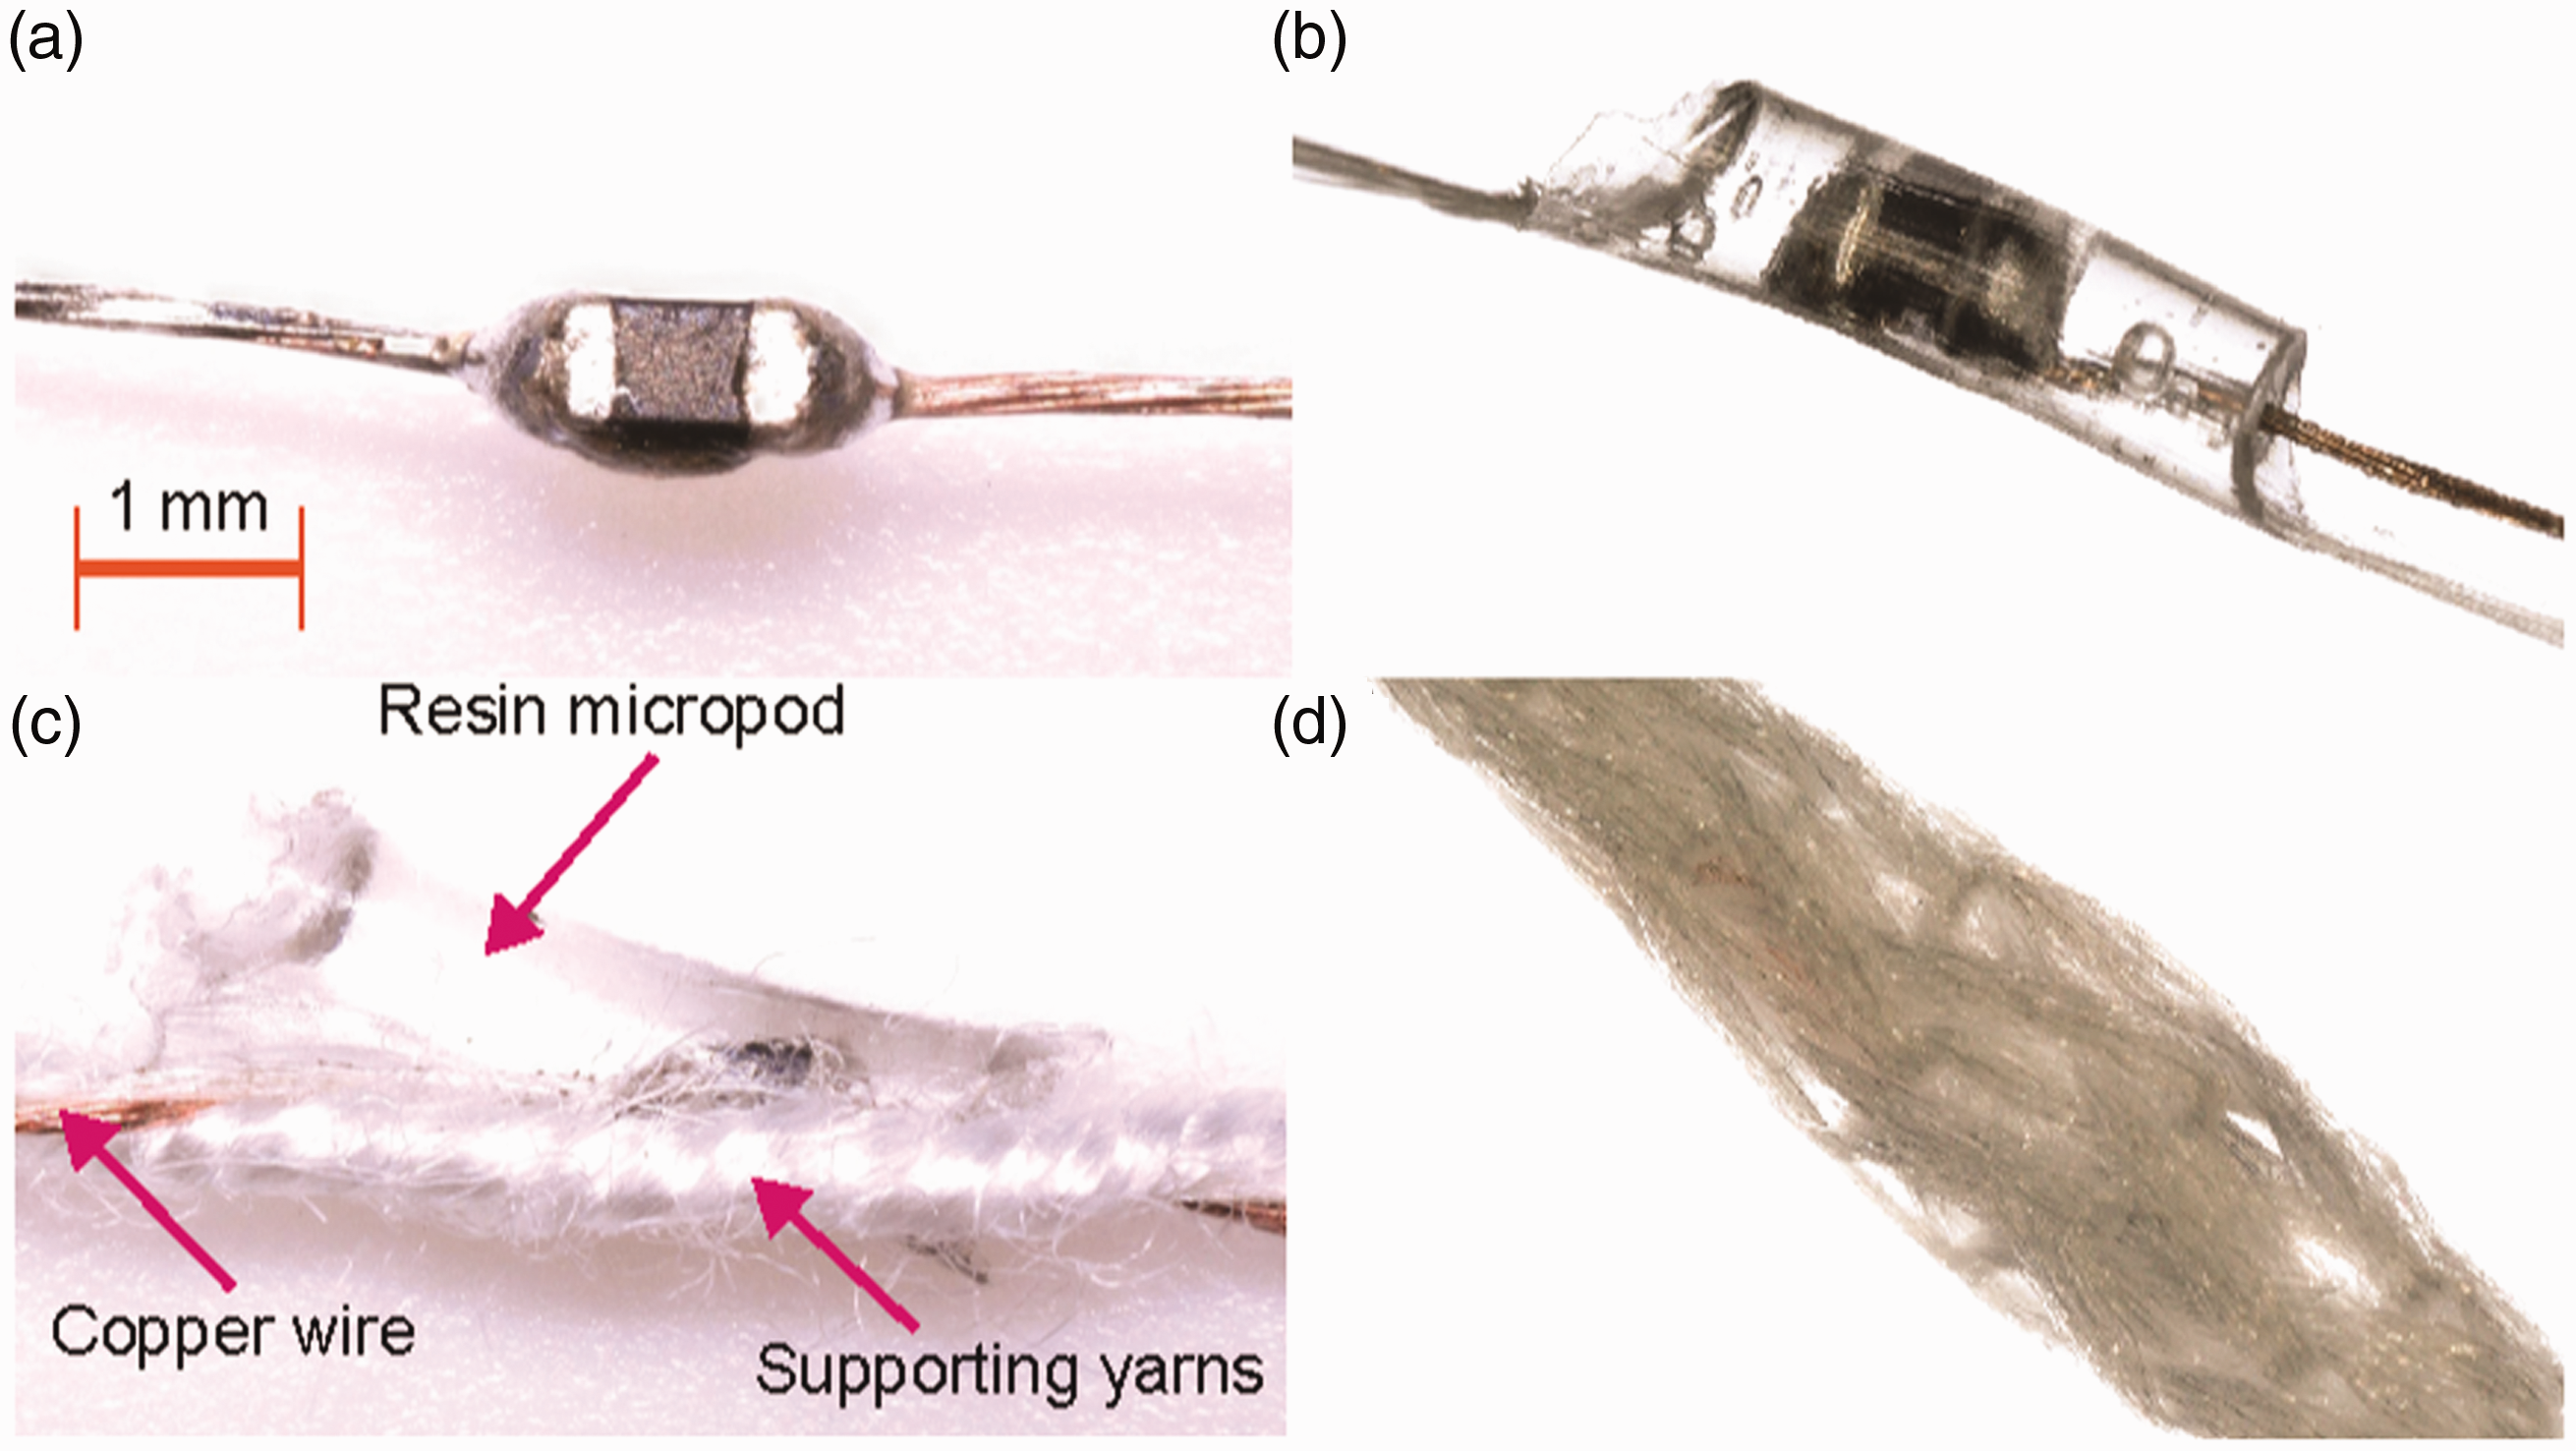
The twisting stage was not used in most of the previous temperature-sensing E-yarn studies.20,22,23 The twisting stage was included to ensure that the conductive copper wire remained fixed in the center of the E-yarn, which helped to provide a more uniform feel. With other E-yarns, it has been observed that without this step the copper wire interconnects would sometimes migrate to the surface of the E-yarn.
Temperature-sensing E-yarns of up to 1.5 m in length were used in this study; however, different lengths were used depending on the location of the sensor relative to the hardware module. The copper wire used for interconnections had a resistance ∼1.5 Ω per meter when held straight, but not under tension (as a multi-strand wire the resistance changed depending on the tension applied and resistances as high as 2.5 Ω/m were recorded in some cases). This resistance was significantly less than the resistance of the embedded thermistor, which was of the order of kilo-ohms, and therefore the yarn length would not affect the readings of the temperature-sensing E-yarn. The low resistance of the copper wire interconnects relative to the thermistor also meant that the motion, tensioning, or heating of the copper wire would have a negligible effect on the temperature readings from the E-yarns.
During this research project 29 temperature-sensing E-yarns were produced using this method (six per suit and five replacements).
Completed temperature-sensing E-yarns were tested prior to them being attached to the cycling suits. The temperature-sensing E-yarns were attached to a precision temperature control plate (EchoTherm™ IC50 digital Chilling/Heating Dry Bath; Torrey Pines Scientific Inc., Carlsbad, USA), which was brought to a pre-determined temperature, and resistance measurements were recorded using a digital multi-meter (Agilent 34410A 6 ½; Agilent Technologies, Santa Clara, CA, USA). Initially, temperature-sensing E-yarns were tested at six different temperatures (∼10℃, ∼20℃, ∼30℃, ∼37℃, ∼40℃, ∼50℃) to ensure that the addition of the twisting step did not significantly alter their behavior. Later batches of E-yarns were only tested at one temperature to ensure correct functionality. The temperature control plate was monitored using a k-type thermocouple throughout the experiments.
Attaching the temperature-sensing E-yarns to the cycling suits
Temperature-sensing E-yarns were attached to the interior of commercially available tri suits (Core Long Course Tri suit: SS18; Huub Design, Derby, UK) using a hand embroidery technique, where the embroidery thread was stitched over the yarns to hold them securely onto the suit (Figures 2(a) and (b)). The E-yarns were embroidered in a sine-wave-like pattern (see Figure 2(b)) to allow the tri suit to remain stretchable without breaking the E-yarns. The use of a sine-wave-like pattern was informed by a previous study where light-emitting diode (LED) E-yarns were embroidered onto a stretch fabric.
27
Results from this study indicated that E-yarns embroidered onto a stretch fabric in a curved pattern could be subjected to around 50% strain without breakages occurring, whereas straight lengths of E-yarn embroidered onto stretch fabric broke under the same testing conditions. Each suit included six temperature-sensing E-yarns located at the forearm, bicep, chest, thigh, scapula, and lower back (as shown in Figures 2(c) and (d)). For this study, four cycling suits were prepared with temperature-sensing E-yarns (one small, two medium, one large). The participants wore correctly sized suits to provide a close fit, with two using the small suit, two the large suit, and the rest using the medium suits. Despite the addition of the E-yarns it was believed that the suits were still comfortable to wear, and there were no complaints about comfort during this study. It should be noted that comfort was not a major concern in this feasibility study as ultimately the intention would be to have the E-yarns knitted or woven into the base fabric.
Cycling suits with attached temperature-sensing electronic yarns (E-yarns): (a) photograph of the completed suit (photograph by Jim Boxall); (b) photograph of the interior of the suit showing an embroidered temperature-sensing E-yarn; (c) annotated photograph of the front of the cycling suit showing the positions of the temperature-sensing elements; (d) annotated photograph of the back of the cycling suit showing the positions of the temperature-sensing elements.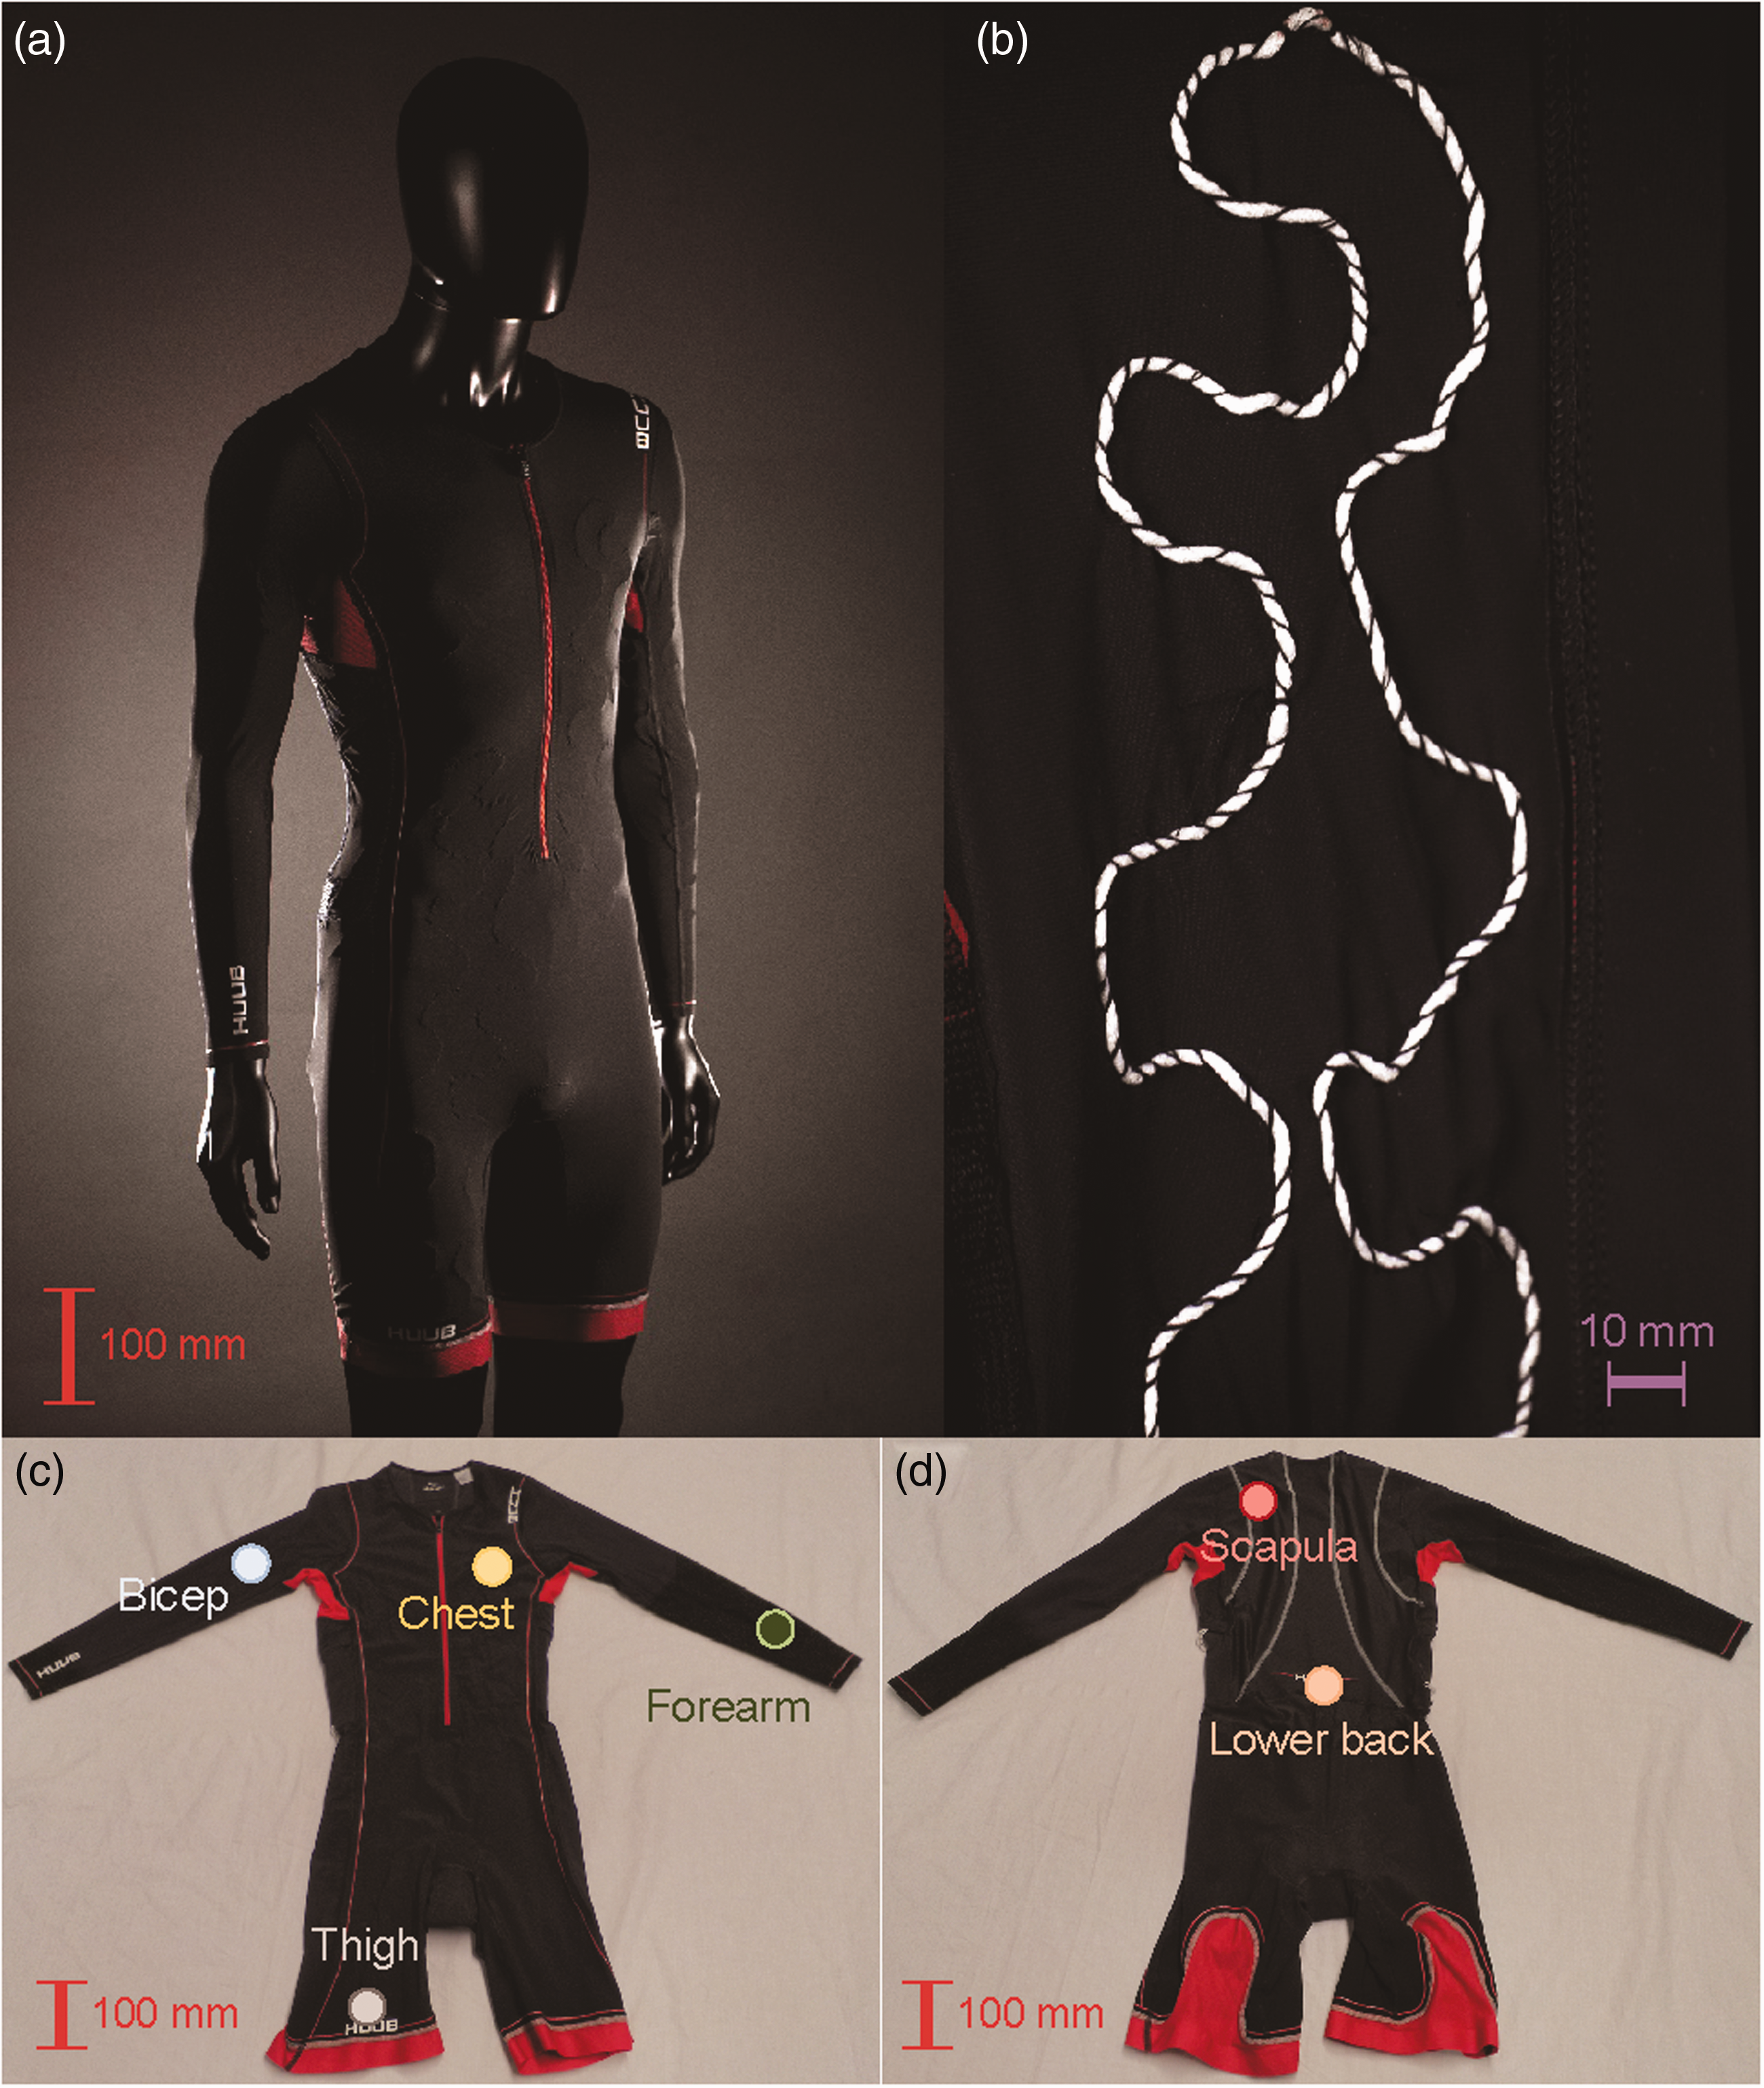
For on-body temperature measurements, bespoke hardware modules were produced (Figure 3) and used to record the resistances from each of the temperature-sensing E-yarns at approximately 0.9 s intervals. The hardware modules comprised a Teensy 3.5 (PJRC, Sherwood, OR, USA), a circuit that allowed for a Li-Ion battery to power the circuit (LiIon/LiPoly Backpack Add-On for Pro Trinket; Adafruit®, New York, USA), a 500 mAh battery (3.7 V Li-Ion; model: LP503035, Shenzhen PKCELL Battery Co., Shenzhen, China), a custom-made voltage divider (containing 10 kΩ resistors, of which six were typically used), and a micro Secure Digital card (8 GB; Kingston® Technology, Fountain Valley, USA) for storing data. The temperature-sensing E-yarns were attached to the hardware using 2 mm pitch header pins, which could be easily attached or removed to corresponding sockets soldered onto the voltage divider board. Both straight and bent (90°) header pins were used in this work. The script running on the Teensy was created using the Arduino programming language (Arduino LLC, Boston, USA) in combination with Teensyduino v1.35 software (PJRC, Sherwood, USA). Two hardware modules were used over the course of this study. The modules were approximately 60 mm × 30 mm × 20 mm and were held in the pocket of the cycling suit.
An example of the hardware modules used as part of this study: (a) top down view; (b) side view.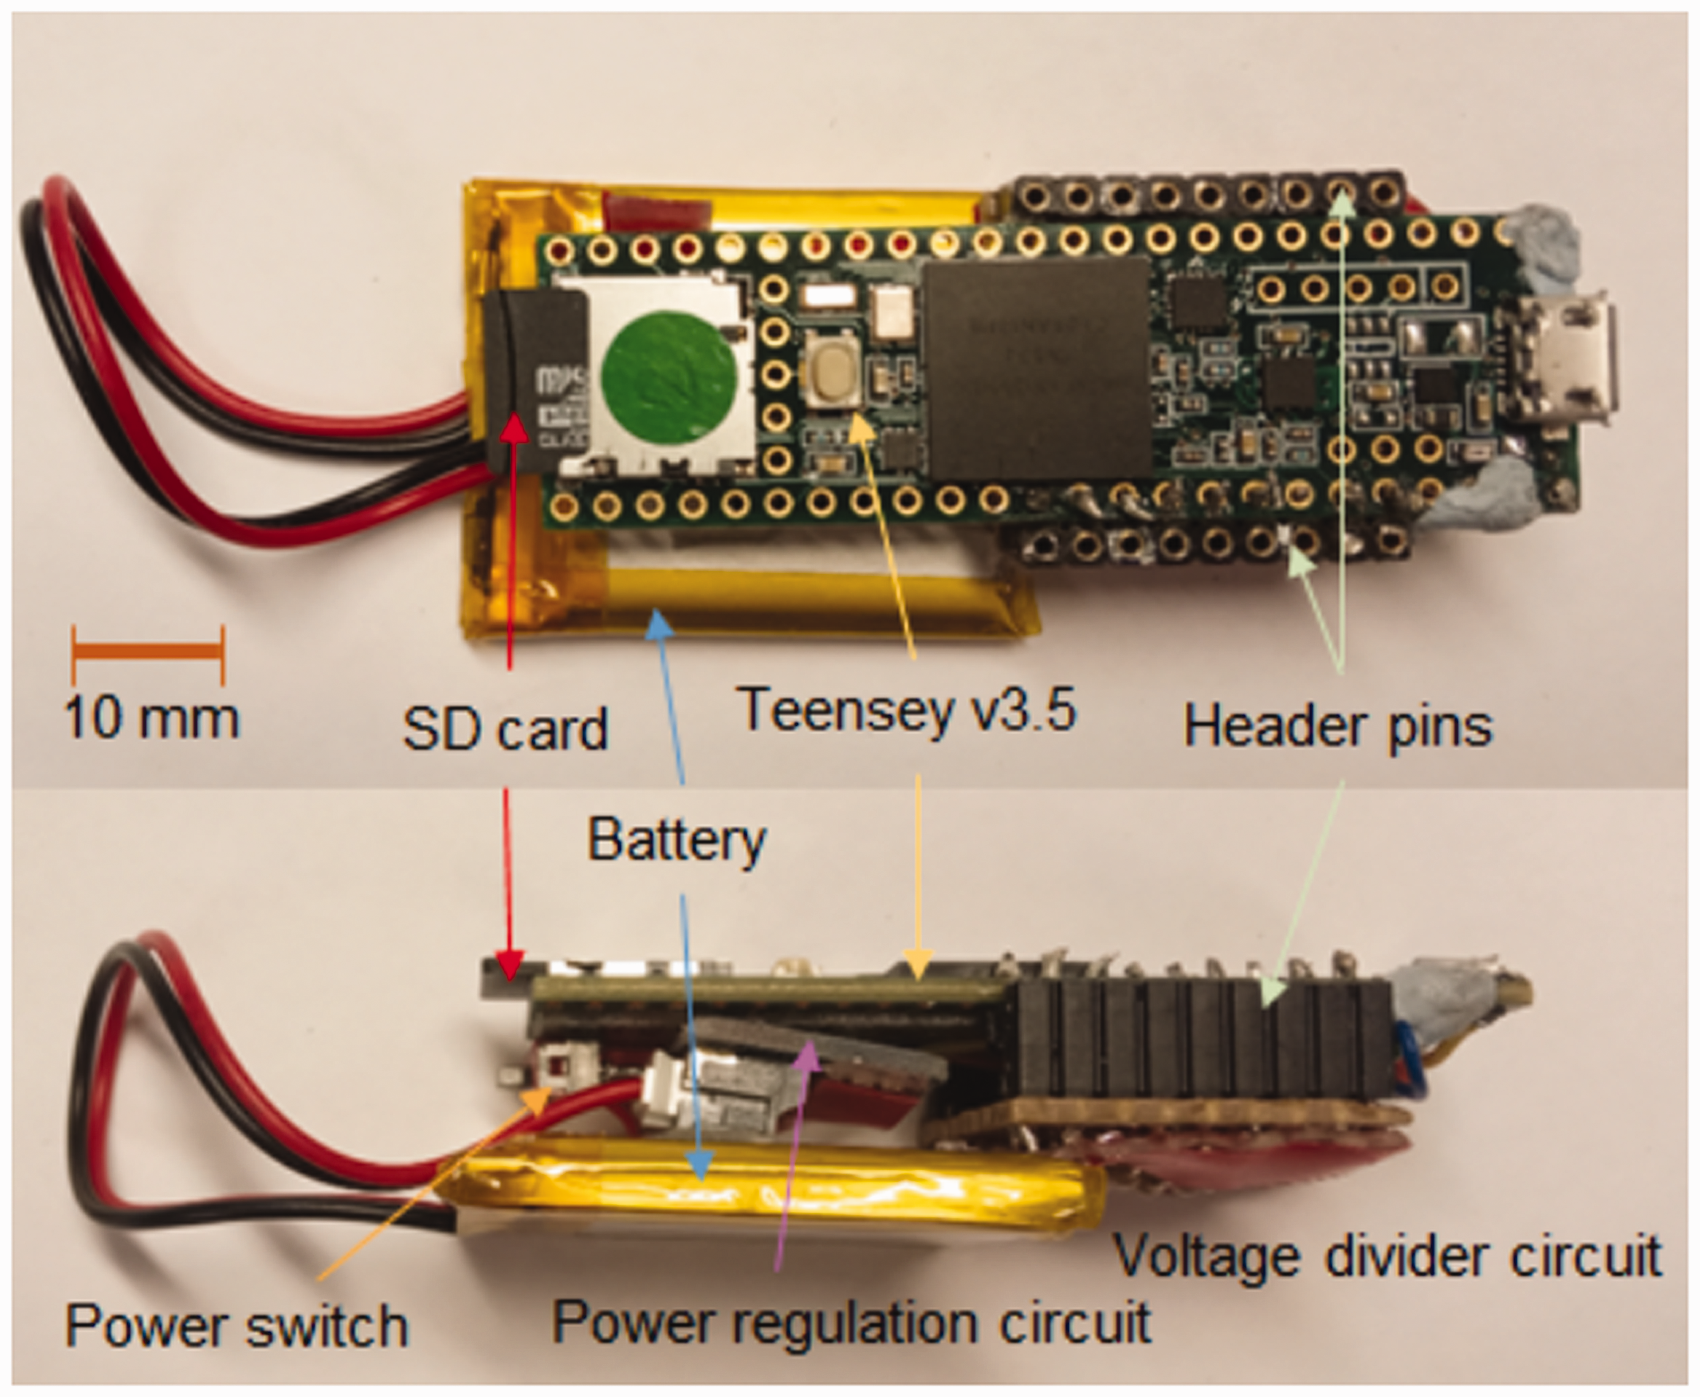
The cycling suits, which incorporated the temperature-sensing E-yarns, required washing between cycling trials. The hardware module was removed before washing; however, the E-yarns, which were incorporated onto the cycling suit’s inner surface, were not. It has been shown in the literature that after 25 cycles of machine washing and line drying that 80% of temperature-sensing E-yarns continue to function correctly 24 ; for the temperature-sensing E-yarn that broke during this study a partial failure occurred, where readings at room temperature could be taken but not at 37℃, which implied a partial breakage in the wire interconnections. When subjected to machine washing and machine drying trials the only observed failure mechanism for the temperature-sensing E-yarns was the physical breakage of the copper wire at the wire–micro-pod interface 24 ; this type of breakage should not result in erroneous temperature readings. Despite good wash durability the suits were hand washed for this study to avoid any possible risk of breakage to the E-yarns. The suits were first carefully agitated within a soap and water mixture (∼40℃) for 15 min. The suits were subsequently rinsed in water (∼7℃) for 5 min, and line dried.
Temperature measurements
Commercially available skin mountable thermistors (iButtons, DS1922; Maxim Integrated™, San Jose, USA) were attached to the participants’ skin using porous tape (Transpore, 3 M, UK) and positioned adjacent to the sensing element of the temperature-sensing E-yarns. Presented skin-mounted thermistor measurements are the average of six readings over 30 s.
For the majority of the temperature-sensing E-yarn readings, the presented measurements were the average of 30 readings over ∼30 s. All error bars presented in this work are the standard deviation of multiple discrete temperature readings. The figures presented in this work (with the exception of Figures 1, 2, 3, and 17) were produced using IGOR Pro (Version 7.0.2.2; Wavemetrics, Portland, USA).
Data is only presented when temperature readings from both the temperature-sensing E-yarns and the skin-mounted thermistors could be obtained. This was not always possible due to hardware failures (described later). It was not always possible to correct hardware problems immediately after failures due to the tight schedule to conduct the sub-maximal cycling trials (as these experiments were part of a larger study). As discussed later, some of the temperature-sensing E-yarns physically broke during this study and, in many cases, these could not be replaced immediately, limiting the total amount of data that could be collected.
Participant information
Participant characteristics. All data presented as mean ± SD. N = 11
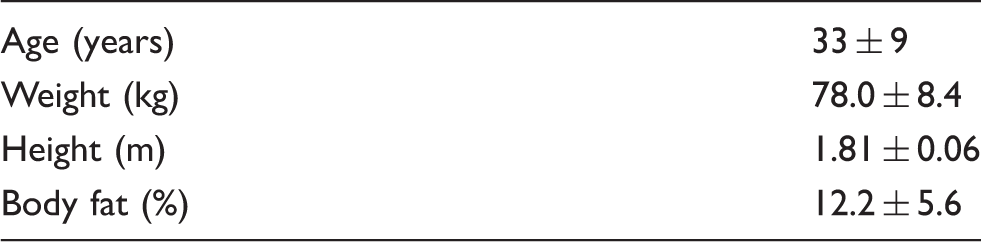
During the testing period, participants were asked to maintain their normal training and to refrain from heavy exercise, caffeine, and alcohol during the 24 hours prior to each laboratory visit. Each participant completed their sessions at the same time of day to minimize the effects of circadian and diurnal rhythms on performance and physiological measurements. Individual sessions were separated by a minimum of 7 days.
The study was approved by the ethics board at the University and performed in accordance with the Declaration of Helsinki. Participants provided their written informed consent prior to testing.
Sub-maximal cycling trials
All trials were completed in the laboratory environment using a cycle ergometer (Lode Excalibur Sport, Lode, Groningen, Netherlands). Each participant completed the trials using an identical protocol. Once they were instrumented with the cycling suit and the skin-mounted thermistors, they mounted the ergometer, which was positioned to replicate the geometry of their own time trial bike. The protocol consisted of a 5-min rest period with the participant seated on the exercise bike, followed by an incremental exercise test. The initial output power was 95 W, and this was incrementally increased by 35 W every 3 min. At the end of each stage, heart rate and perceptual measurements were recorded.
Saline solution experiments
Two sets of four E-yarns were constructed to conduct the saline solution experiments. The first set of four E-yarns was constructed as described earlier. The second set of four E-yarns was constructed using an insulated litz wire with a nylon coating and seven individually insulated copper strands (∼250 µm total o.d.; part number BXL2001, Type 1 Litz 36 AWG 7/44 AWG, MW79-C, Nylon Serve; Osco Ltd, Milton Keynes, UK). This set of E-yarns was hand-crafted and ultimately had 1.5 mm diameter micro-pods; however, otherwise they were the same as the other temperature-sensing E-yarns used in this work. The E-yarns were submerged into a 50 mL saline solution, four yarns at a time.
Distilled water was used for the first experiment (i.e. 0 mmol/L NaCl). A range of concentrations of NaCl was then explored between 0 and 342 mmol/L in 43 mmol/L increments, covering a greater range of salt concentrations than those explored in studies using artificial sweat 30 and well beyond the normal physiological range. 31
The saline solution was held at 24.2 ± 0.4℃ using the precision temperature control plate. A calibration thermistor was used during these experiments to measure the temperature of the saline solution (USP11493, US Sensor Corp., Orange, CA, USA). Resistance measurements, from which temperature was calculated, were taken using the digital multi-meter. Initial experiments were conducted with the bath close to body temperature (∼37℃); however, it was difficult to consistently maintain this temperature and, hence, experiments were conducted at room temperature. It should be noted that while the conductivity of saline solutions will be higher at greater temperatures, the large range of salinities explored should have still covered the likely levels of conductivity encountered during the cycling trials.
Results
Initial temperature-sensing E-yarn functionality testing
Measurements from 12 temperature-sensing E-yarns were compared to the temperature at the surface of a temperature-controlled plate (Figure 4(a)) to provide a calibration for the temperature-sensing E-yarns.
Temperature measurements recorded using the temperature-sensing electronic yarns (E-yarns) compared to the actual temperature of the temperature-controlled plate. (a) Comparison of the recorded temperatures for 12 temperature-sensing E-yarns. (b) Average difference in the temperatures recorded by the E-yarn and the actual temperature (actual temperature reading minus E-yarn reading), compared to the temperature-sensing E-yarn reading. Error bars represent the standard deviation. The linear data fitting is given by Equation (1). (c) The maximum difference between the temperature-sensing E-yarn readings for five E-yarns at different temperatures.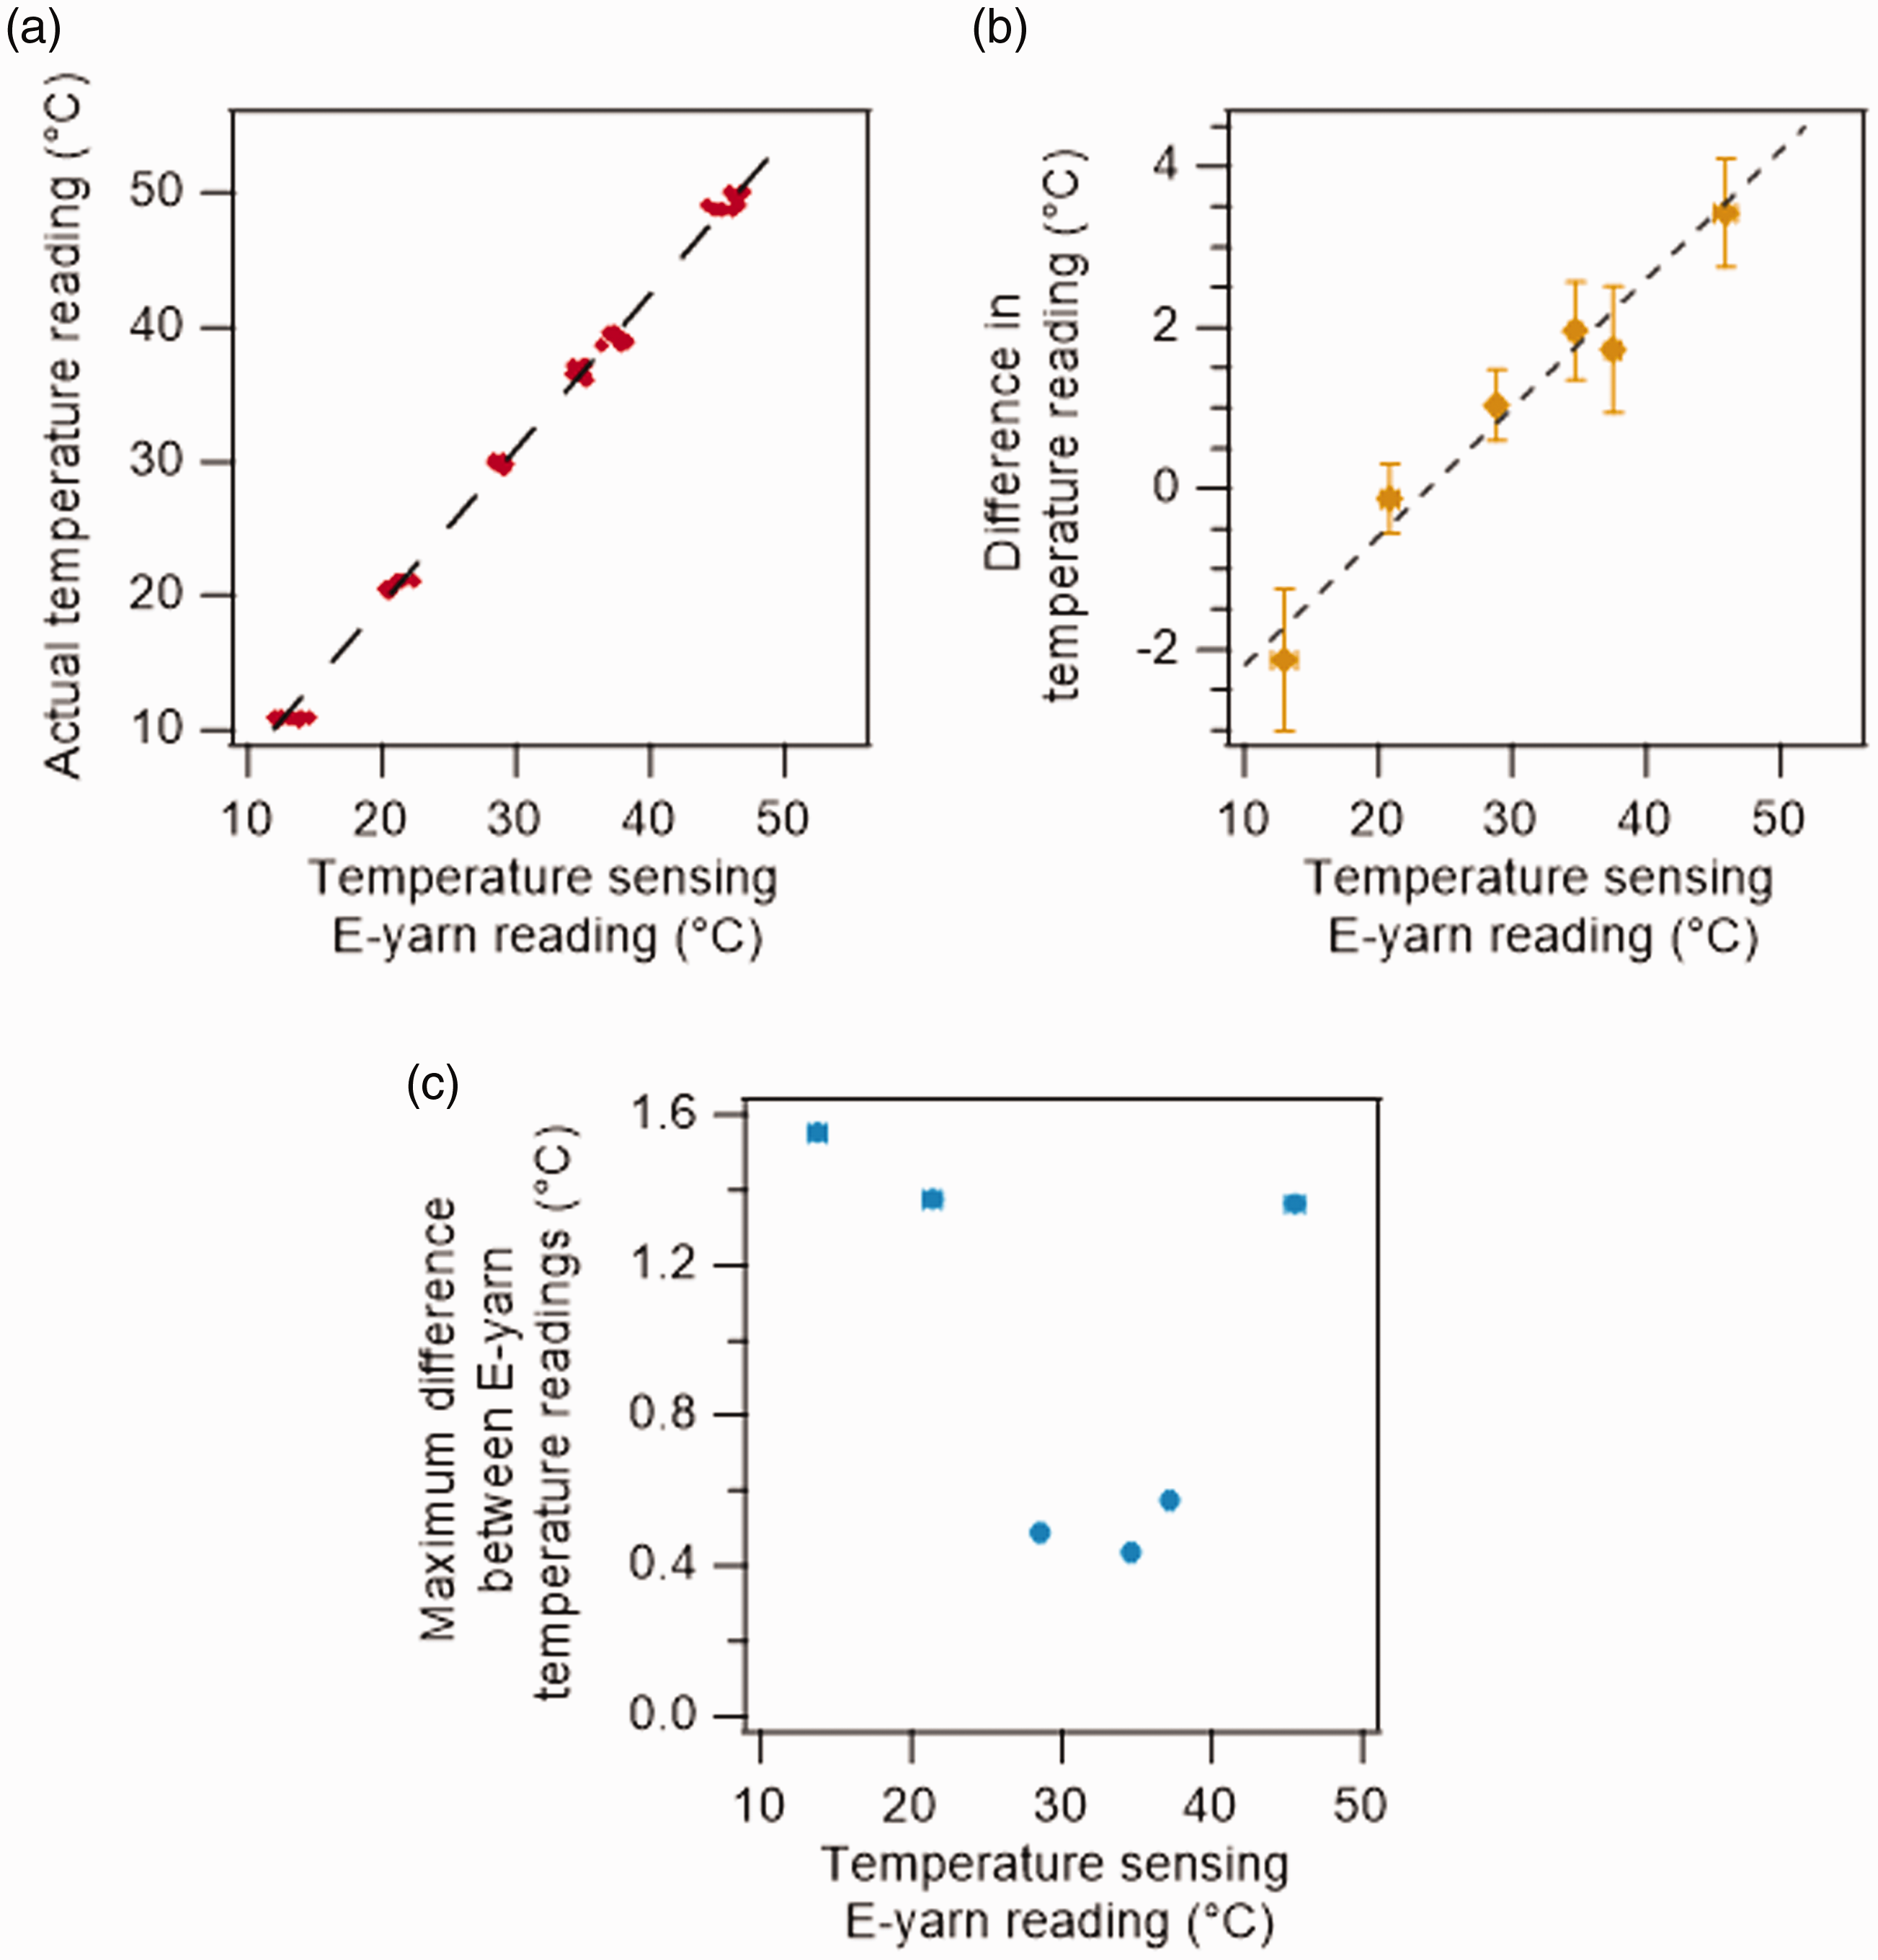
Figure 4(a) shows that the temperature-sensing E-yarn readings generally agreed with the results recorded at the surface of the temperature-controlled plate (coefficient of determination = 0.996). Figure 4(b) better highlights the difference in these measurements, showing the difference between the temperatures recorded using the temperature-sensing E-yarn and the plate temperature. The observed trend was in agreement with previous studies. 22 The difference in the recorded temperatures was due to the inclusion of the polymer micro-pod and covering fibers around the thermistor at the core of the temperature-sensing E-yarn. This restricted the heat flow to the internal thermistor from the adjacent bodies, leading to lower temperature readings when next to a warm thermal body (warm compared to room temperature) and higher temperature readings when next to a cool thermal body (cool compared to room temperature). A temperature difference of 1.0 ± 0.4℃ was observed at 28.8 ± 0.3℃ and 2.0 ± 0.6℃ was observed at 34.7 ± 0.4℃, with these values being larger than the ∼0.5–1.5℃ difference observed for similar E-yarns over this temperature range in previous work. 22 The disparity in these results was likely due to the slightly different E-yarn design used in this study. Further, it should be noted that the room temperature varied between 22.4℃ and 27.6℃ while these measurements were taken, which may have influenced the accuracy of the results.
A linear fitting has been applied to the data in Figure 4(b) (see Equation (1)), providing an estimate of the difference between the temperature-sensing E-yarn readings and plate temperature. This could be used as a correction value, allowing the plate temperature to be extrapolated from the E-yarn temperature reading

Finally, Figure 4(c) shows the largest difference in temperature readings between identical E-yarns at different temperatures. The presented data was from five E-yarns, with the temperature readings taken sequentially. This ensured that the results were not influenced by changes in either the plate temperature or ambient temperature. It was observed that the results were most similar around body temperature. It was uncertain whether the differences observed between the yarns were solely due to the manufacturing tolerances of the embedded thermistor, the manufacturing tolerances of the E-yarn fabrication process, the thermistors’ inherent accuracy (∼±1℃), or a combination of these factors.
Ultimately, these results indicated that the temperature-sensing E-yarn design used in this work provided consistent results with one another within 0.6℃ (in the 30–40℃ temperature range relevant to this work). Further, the results provided a correction value that could be applied to the temperature-sensing E-yarn readings to correct for the effects of ambient temperature.
Durability of the temperature-sensing electronic yarns
The sub-maximal cycling trials conducted in this work were part of a larger study to better understand thermoregulation during exercise. 29 Temperature measurements using the temperature-sensing E-yarns were recorded whenever possible during these trials. Missing data occurred when there was either a breakage in the E-yarns, a failure in the hardware or connections, or when corresponding skin-mounted thermistor readings were not taken. Due to breakages in the suits during this study, full datasets could not be collected for all participants. As such no data exists for some of the 11 cyclists, and in some cases, data only exists for a given participant in a limited number of locations (ranging from all six locations to just one location), seven sub-maximal cycling trial datasets and another seven at-rest data points are missing due to issues with the skin-mounted thermistors.
Five physical breakages in the temperature-sensing E-yarns (along the copper interconnections) occurred during this study, requiring the E-yarns to be replaced. This was due to physical breakage of the copper wire. Temperature-sensing E-yarns made with similar materials and with a comparable design are known to have a tensile breaking point of 60.0 N, 20 which may have been exceeded when the stretchable garment was being put on or removed. Given the inelasticity of the copper wire it is also possible that the breakage was a fatigue failure form the suits being donned and doffed on multiple occasions. It is not likely that E-yarns that were close to failure would influence the recorded temperature measurements. Prior to failure, in an extreme case, only one strand of the multi-strand wire would still be attached; in this case the wire would have a resistance 10.2 Ω/m, which is negligible compared to the resistance of the embedded thermistor.
The greatest points of failure were the header connectors used to attach the temperature-sensing E-yarns to the hardware module. This led to fatigue failures between the wire and pin after successive attachment and removal of the pins from the hardware module. This resulted in 16 failures over the duration of the project. Connections between the E-yarns and axillary devices remain an area where further work is required, as highlighted by this study. It is possible that the use of a more flexible copper wire would have resulted in fewer failures. The hardware modules also broke on two occasions due to soldering issues with the module itself. This was because the modules were hand soldered and not held within a protective enclosure.
E-yarn functionality when embroidered onto the cycling suit
Attaching the temperature-sensing E-yarns onto the cycling suit would also influence how ambient temperature affected the recorded temperature reading. This was supported by previous studies where covering the temperature-sensing E-yarns with an additional fabric was shown to reduce the influence of the external temperature on the readings 22 (it should be noted that in the literature example the temperature-sensing E-yarns had a slightly different construction and were embedded within a knitted fabric). It was therefore important to understand the E-yarn’s temperature response when embroidered onto the cycling suit, as this may have provided a corrective value that could be used to improve the accuracy of the temperature-sensing E-yarn readings during the study.
Therefore, measurements were taken with four temperature-sensing E-yarns embroidered onto the cycling suits and compared to the temperature-controlled plate temperature to try and obtain a correction value to compensate for the effects of ambient temperature (Figure 5).
Difference in the temperature readings from the temperature-sensing electronic yarns (E-yarns) embroidered onto the cycling suit and a thermocouple attached to the temperature-controlled plate, compared to the recorded temperature from the temperature-sensing E-yarns. All data points are the average of four readings, with the standard deviation presented as error bars. The linear data fitting shown is given by Equation (2).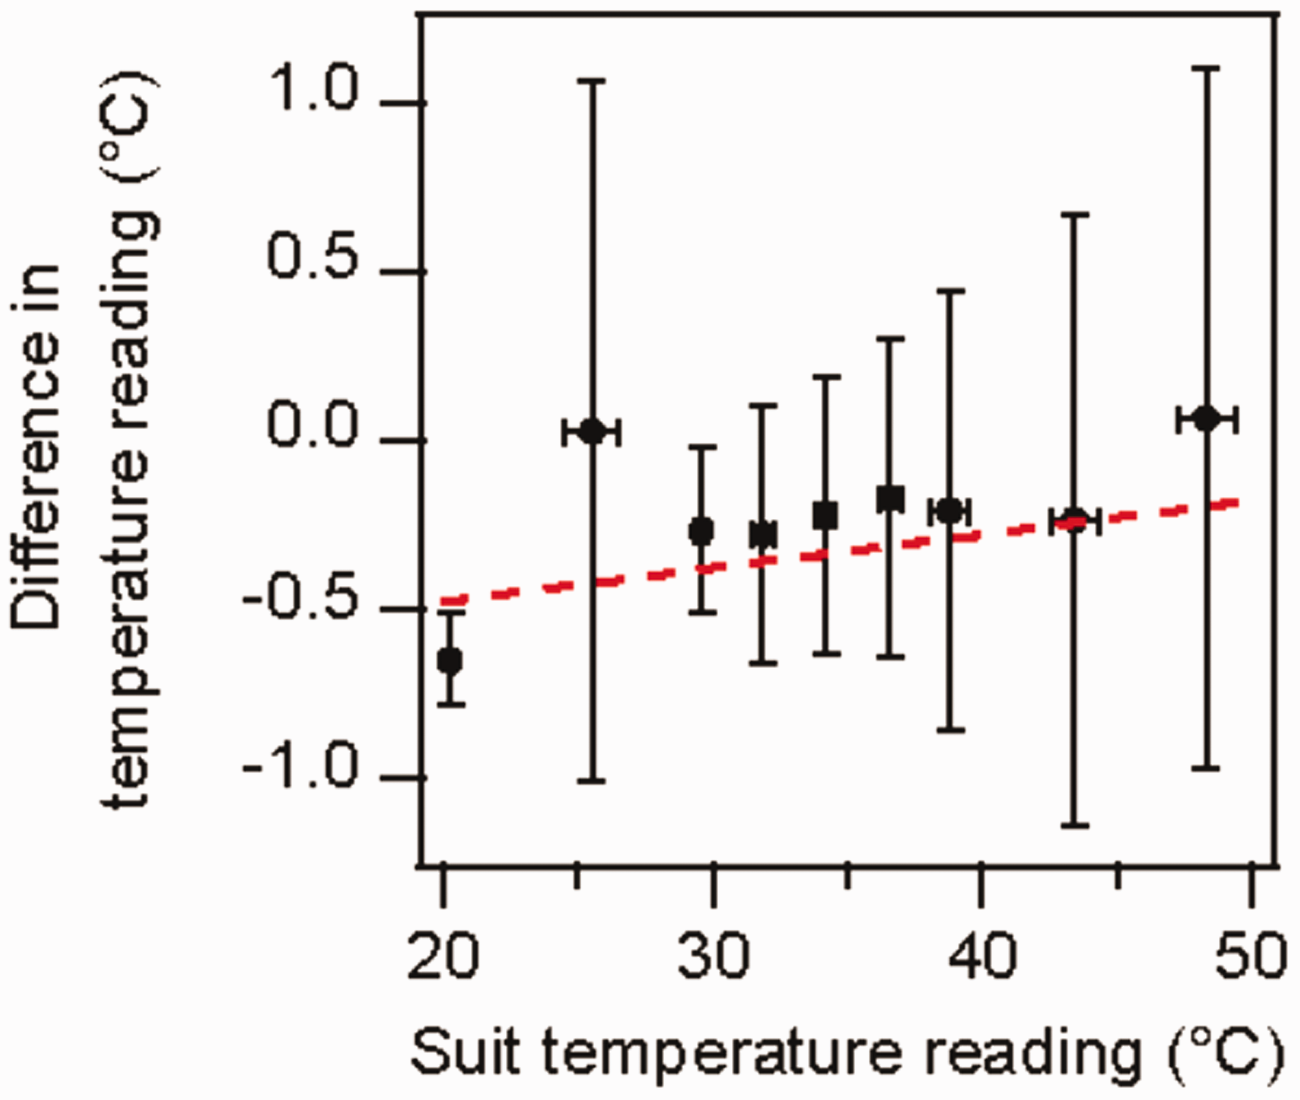
The mean results from this experiment showed only a minimal difference between the temperatures recorded by the temperature-sensing E-yarns embroidered onto the cycling suit and the plate temperature, with no clear relationship between the two (see Equation (2)). The coefficient of determination of this fitting was 0.333

As an example, at 30℃ this would result in a –0.38℃ correction value. As a comparison, the uncovered yarn would require a 1.00℃ correction. These results, and the weak correlation shown in Figure 5, suggested that the inclusion of the cycling suit as a covering material significantly reduced the effects of external temperature on the temperature-sensing E-yarns response. It was also shown that the correction term was less than the variation in readings between some E-yarns (0.6℃) within the temperature range of interest. As such, correction values calculated using Equation (2) were not applied to any of the data collected in this work.
Tsk is known to vary depending on the workload and location, with studies reporting changes of less than 1℃ in some cases 32 to over 5℃ in others. 33 It is therefore possible that the temperature-sensing E-yarn would not be suitable for accurately monitoring Tsk in all cases.
It should be noted that the step-response time of the temperature-sensing E-yarns was not investigated in this work. Previous studies on similar sensors 34 have shown these step-response times to be very short, with the longest times reported being of the order of seconds. The skin-mounted thermistors used in this work (iButtons) are known to have a long step-response time, 35 in part due to their relatively large size.
Skin surface temperature measurements when at rest
Seventy-six skin temperature measurements were successfully taken with the temperature-sensing E-yarns for participants at rest (Figure 6).
Comparison of the temperature responses of the temperature-sensing electronic yarns (E-yarns) and skin-mounted thermistors for eight participants at rest. Data collected at all locations on the body is presented. The thin solid lines have been included as a guide for the eye only. (a) Direct comparison between the temperature-sensing E-yarns and the skin-mounted thermistors. (b) Difference between the temperature readings, as a function of the skin-mounted thermistor temperature reading.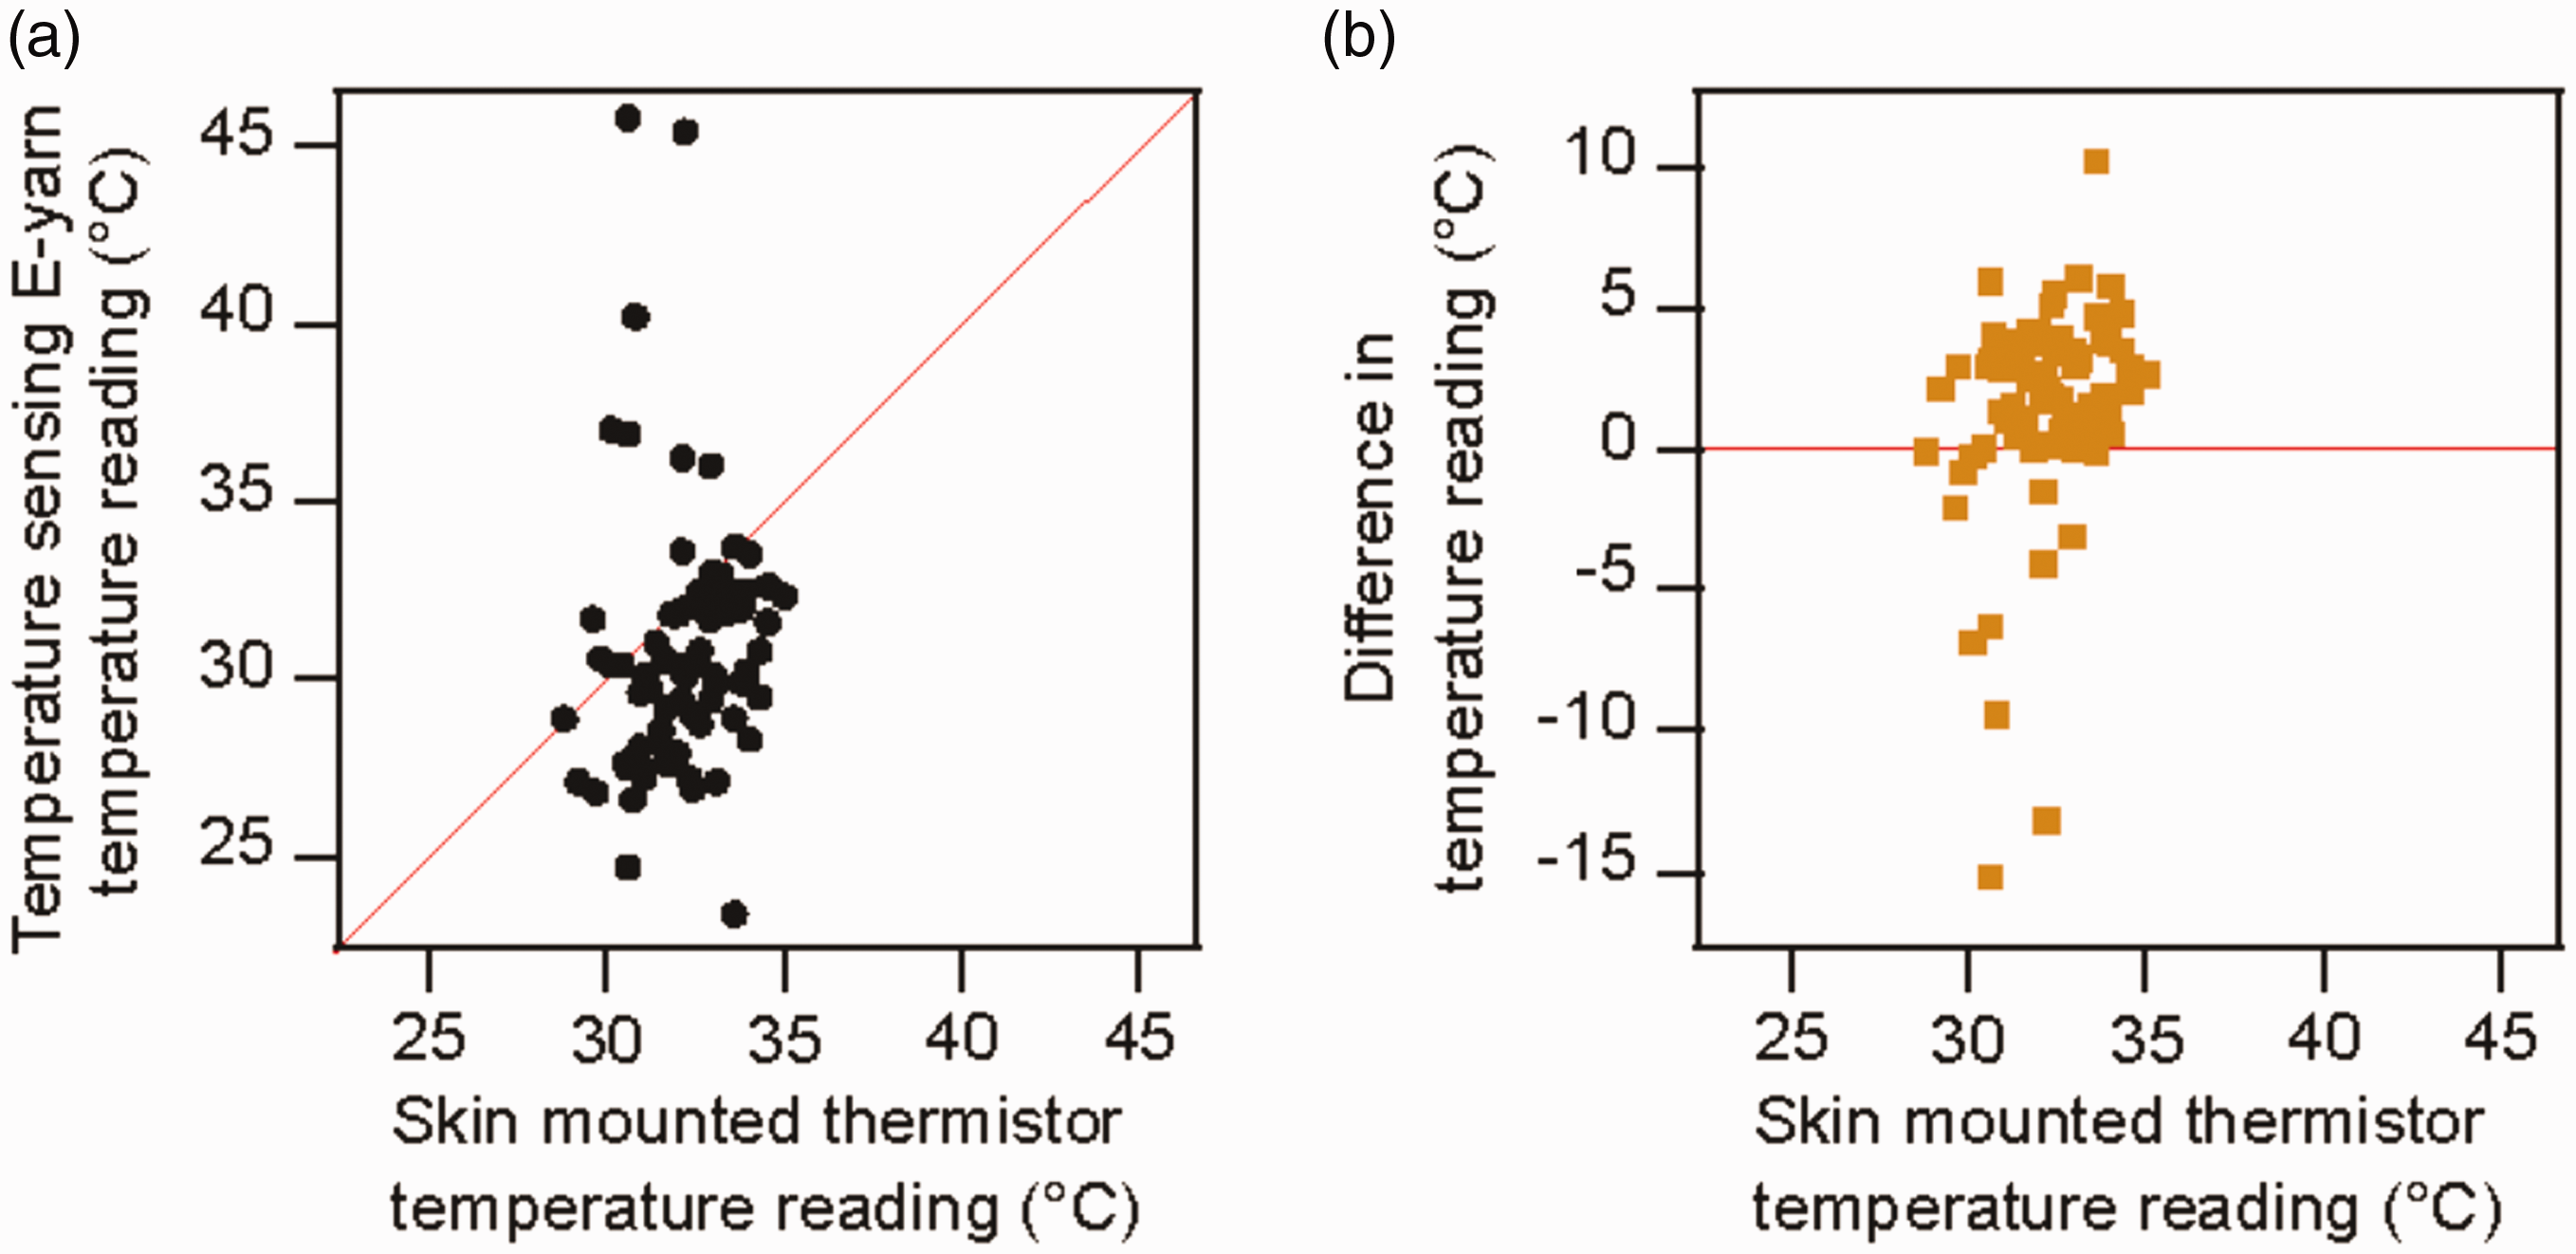
Figure 6(a) shows a comparison between the temperature responses from the temperature-sensing E-yarns and the skin-mounted thermistors. The thin solid line has been included as a guide for the eye; temperature readings that were in agreement would be located on this line. From Figure 6(a) it was clear that, while some readings were in agreement, many temperature readings from the temperature-sensing E-yarns were lower than those taken with the skin-mounted thermistors, thus underestimating the true skin temperature.
Figure 6(b) displays the difference in the temperature readings, showing that the readings from the skin-mounted thermistors were typically between 0℃ and 5℃ higher than for the temperature-sensing E-yarns.
While the intrinsic accuracy of the temperature-sensing E-yarns, and variations between each of the E-yarns, may have introduced some error this would not have likely exceed ±1℃ (see Figure 4(c)). Therefore, temperature-sensing E-yarn readings that were lower than expected were likely due to poor contact between the participant’s skin and the suit. The pressure exerted between the temperature-sensing E-yarns and body has been observed to influence temperature measurements in previous work, which may account for some of the observed differences. 23 Further, the literature has shown that a gap of 5 mm between the heat source and the temperature-sensing E-yarn can result in a discrepancy >6℃. 22
For 13 data points (17%), the temperature-sensing E-yarns gave higher temperature readings than the skin-mounted thermistors, with some readings being significantly higher than expected physiological temperatures. This should have only occurred if there had been a reduced electrical resistance in the circuit (as the embedded thermistors had a negative thermal coefficient). This may have been due to hardware failure, or the creation of an electrical pathway around the thermistor due to an external factor, such as sweat.
To better understand this behavior, the on-body temperature readings were further classified, either by location on the body or by participant. When the data were classified by participant, it was observed that most of the outlying data was collected from a single participant. Figure 7 is a repeat of Figure 6 with the data from this participant removed.
Comparison of the temperature responses of the temperature-sensing electronic yarns (E-yarns) and skin-mounted thermistors for seven participants at rest. This graph is repeat of Figure 6 with data from a single participant removed. Data collected at all locations on the body is presented. The thin solid lines have been included as a guide for the eye only. (a) Direct comparison between the temperature-sensing E-yarns and the skin-mounted thermistors. The equation for the data fitting (dashed line) is given in Table 2. (b) Difference between the temperature readings, as a function of the skin-mounted thermistor temperature reading.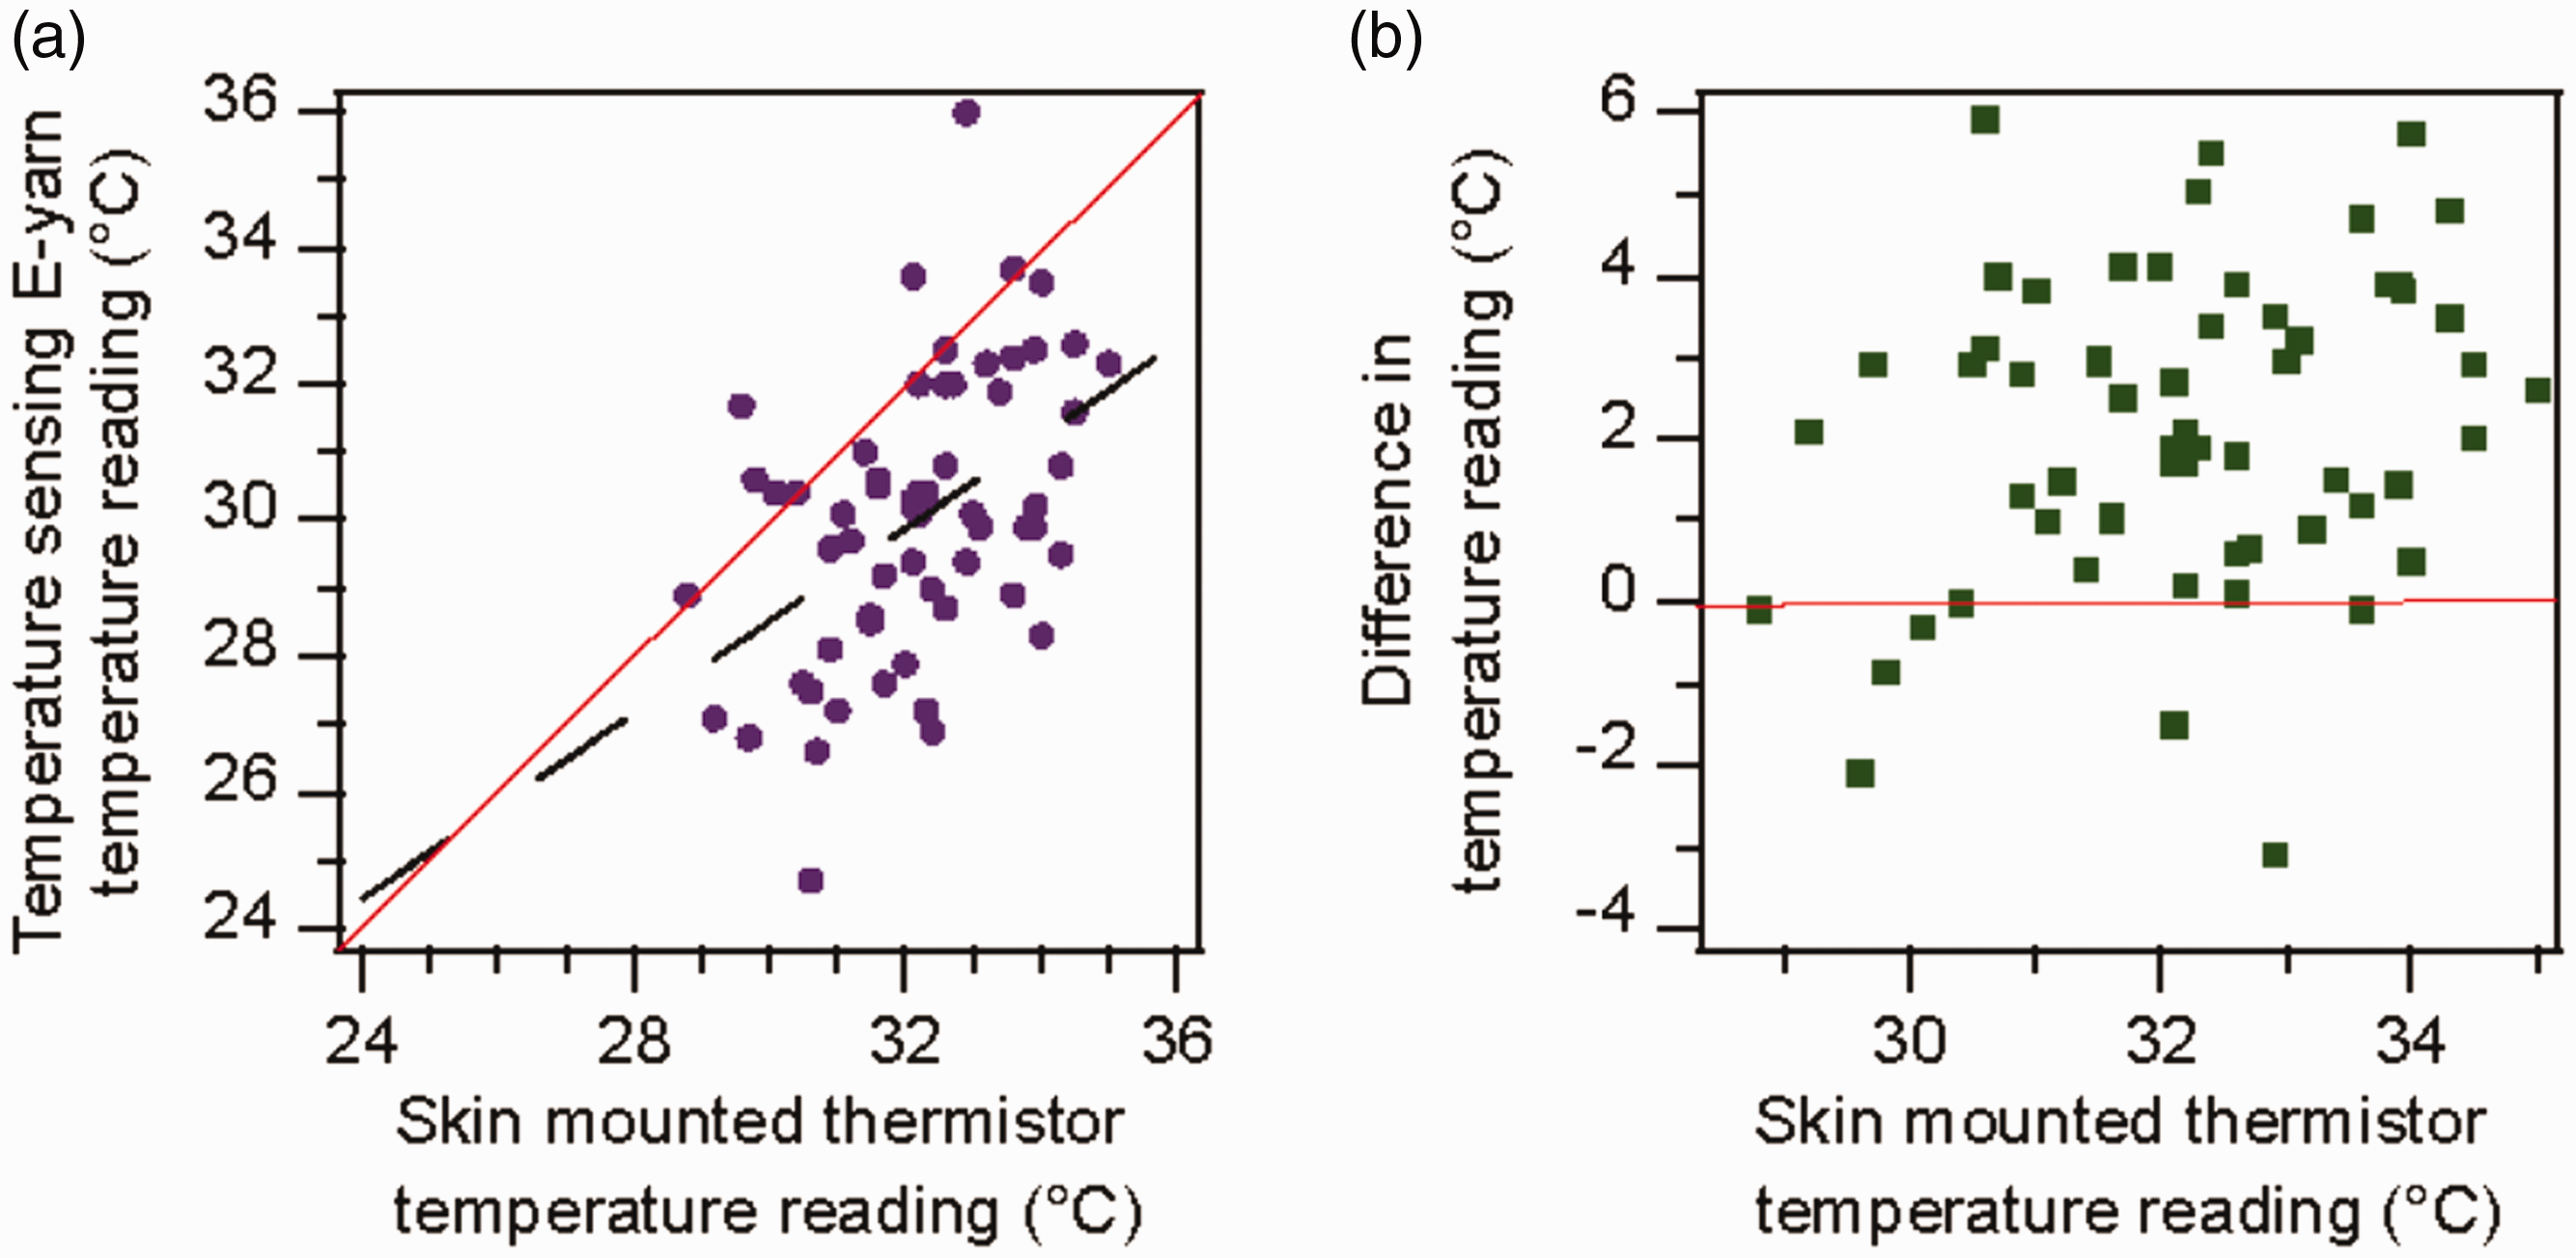
Removing the data from one participant significantly reduced the disparity between the skin-mounted temperature sensor readings and the temperature-sensing E-yarn readings. It was believed that the erroneous results might have been due to a very poor fit between the suit and the participant, leading to significant motion artifacts (due to poor contact between the suit and the skin). It is also possible that there may have been an electrical fault with the E-yarns or hardware module for the given participant during at least one of the trials. This participant’s data has not been included in any further analysis.
Of the 60 remaining data points, the range of temperature differences was between –3.1℃ and 5.9℃. The temperature-sensing E-yarns gave higher temperature readings than the skin-mounted thermistors in seven instances; however, four of those readings showed a difference of less than 1℃, which could be attributed to the accuracy of the temperature-sensing E-yarn or to the presence of sweat.
As the fit of the suit would potentially change based on location, the on-body temperature readings for seven of the participants were classified by position (Figure 8).
Comparison of the temperature responses of the temperature-sensing E-yarns and skin-mounted thermistors for seven participants at rest. The equations for the data fittings (dashed lines) are given in Table 2. The thin solid lines have been included as a guide for the eye only. (a) Forearm; (b) Bicep; (c) Chest; (d) Thigh; (e) Scapula; (f) Lower back.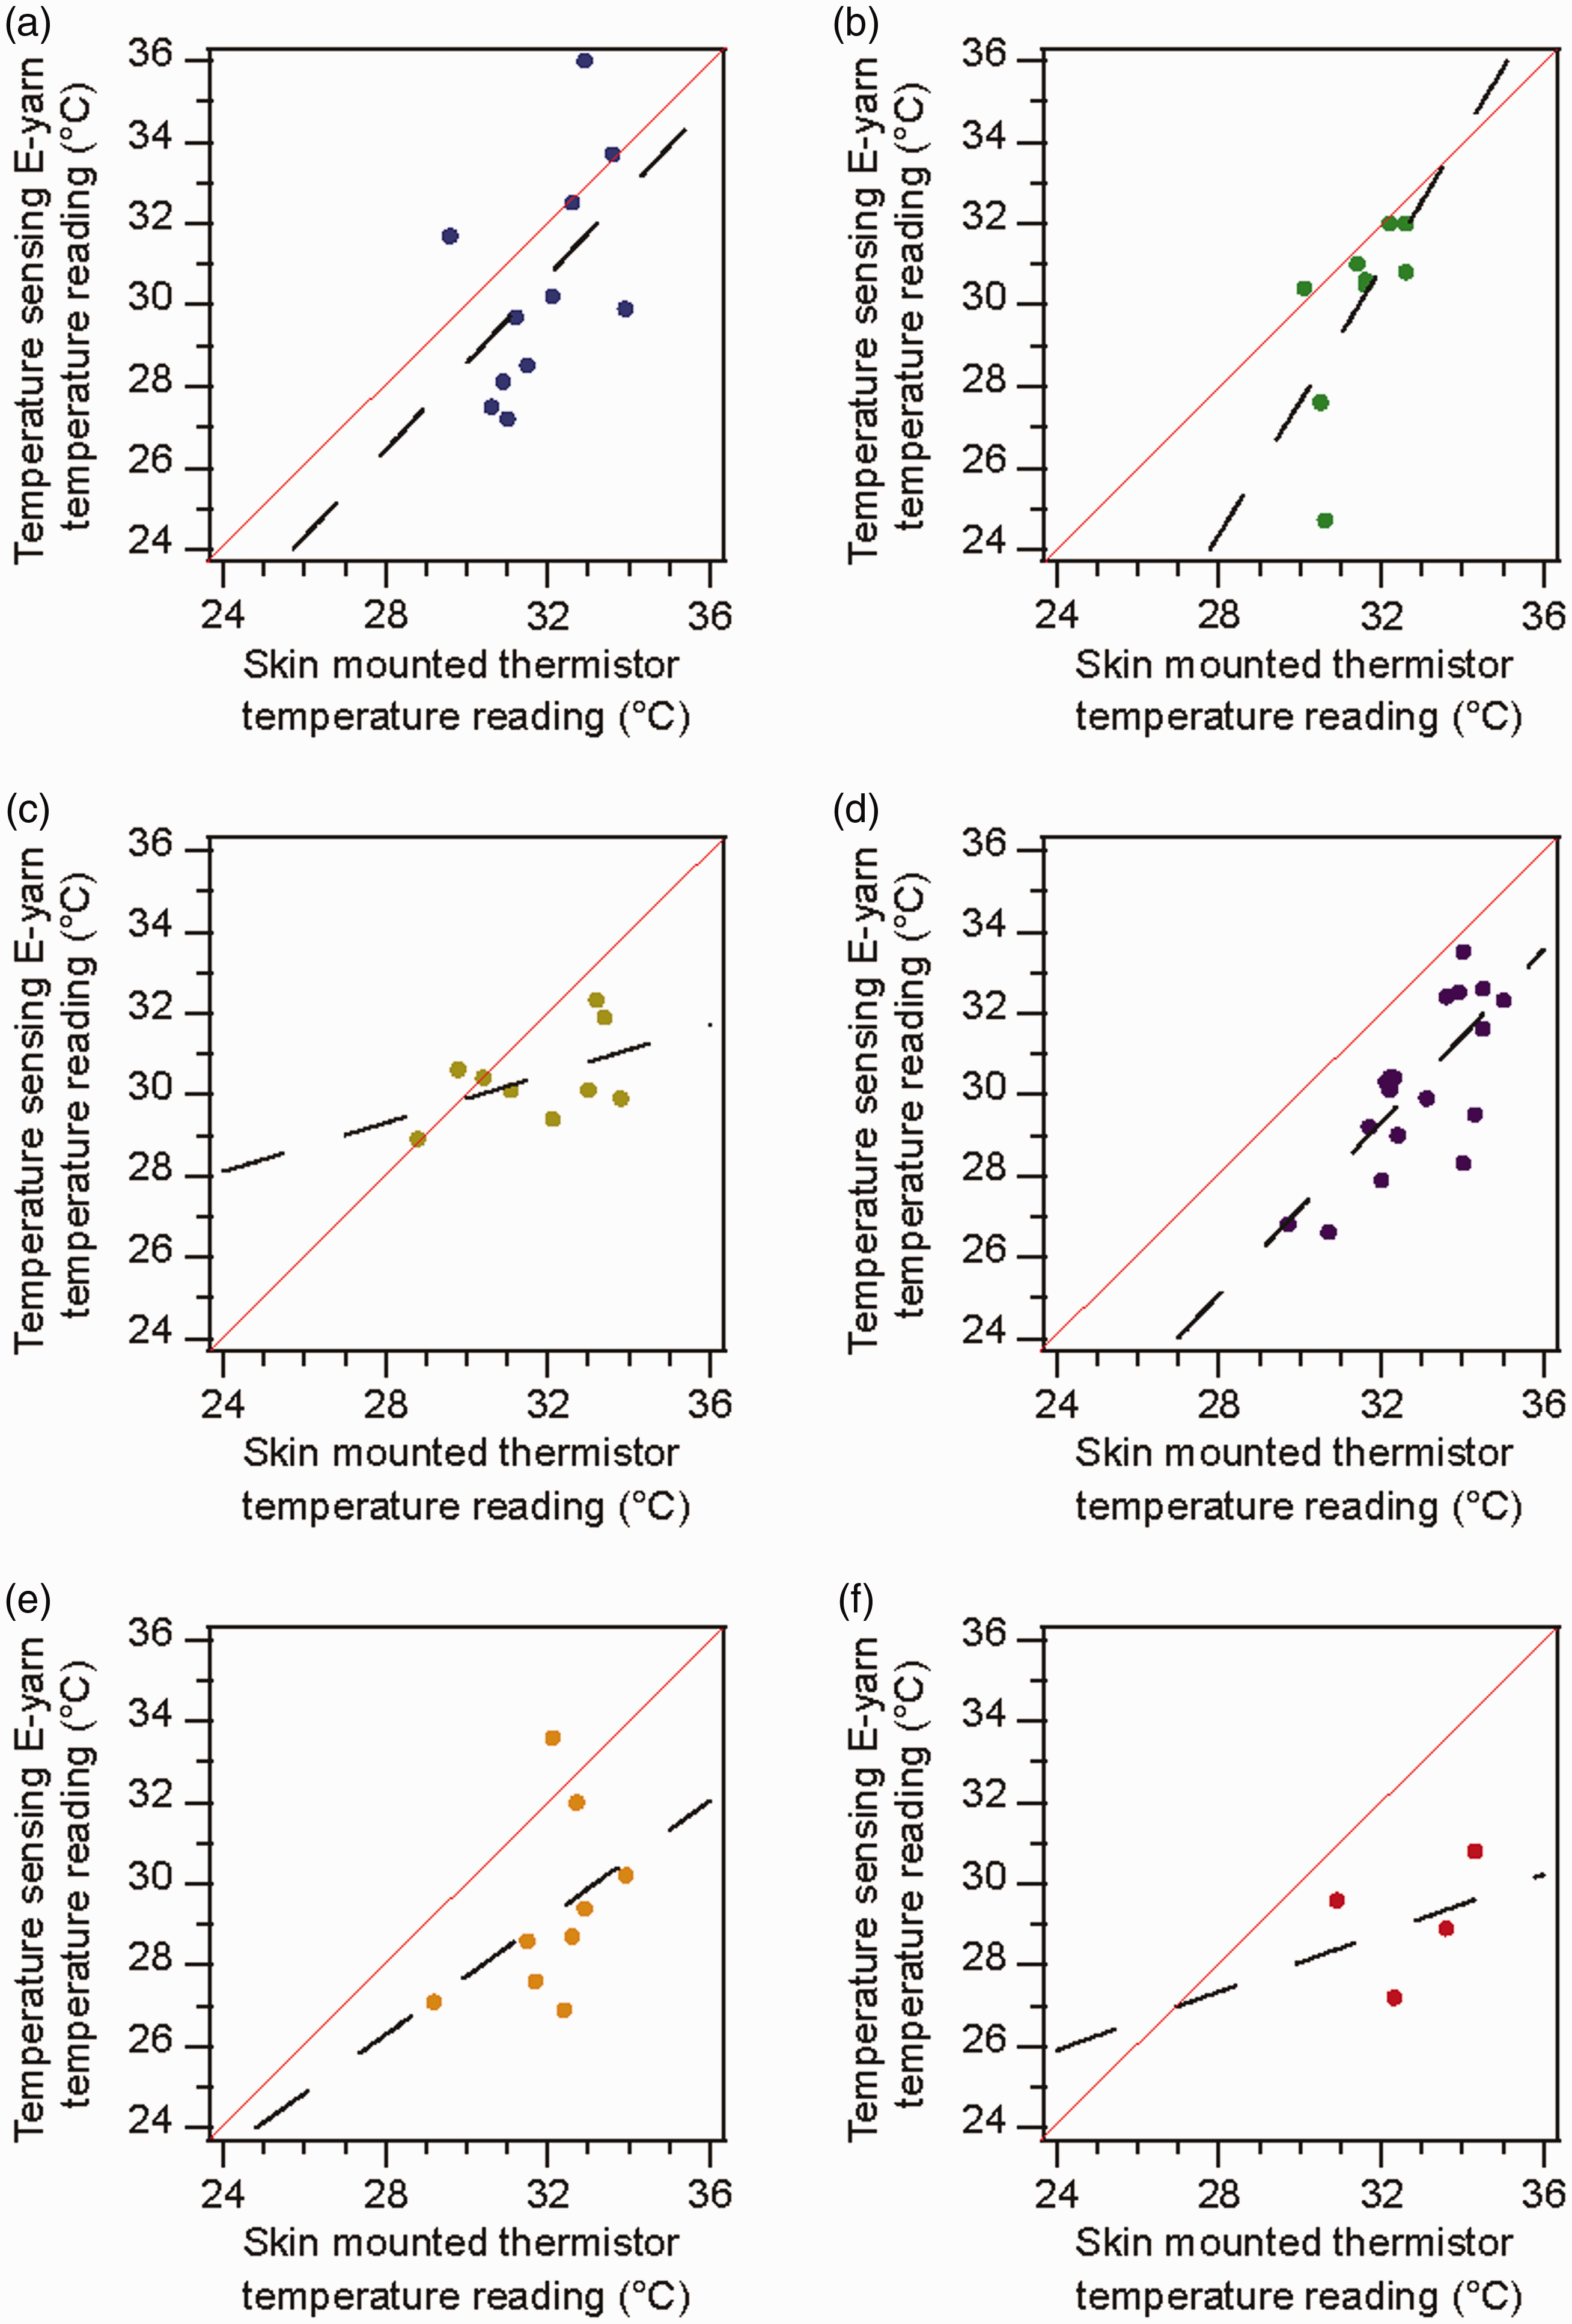
Summary of the difference in the readings from the temperature-sensing electronic yarns and skin-mounted thermistors at different locations for seven participants. The data fittings presented in Figures 7(a) and 8 and their related coefficients of determination are also presented
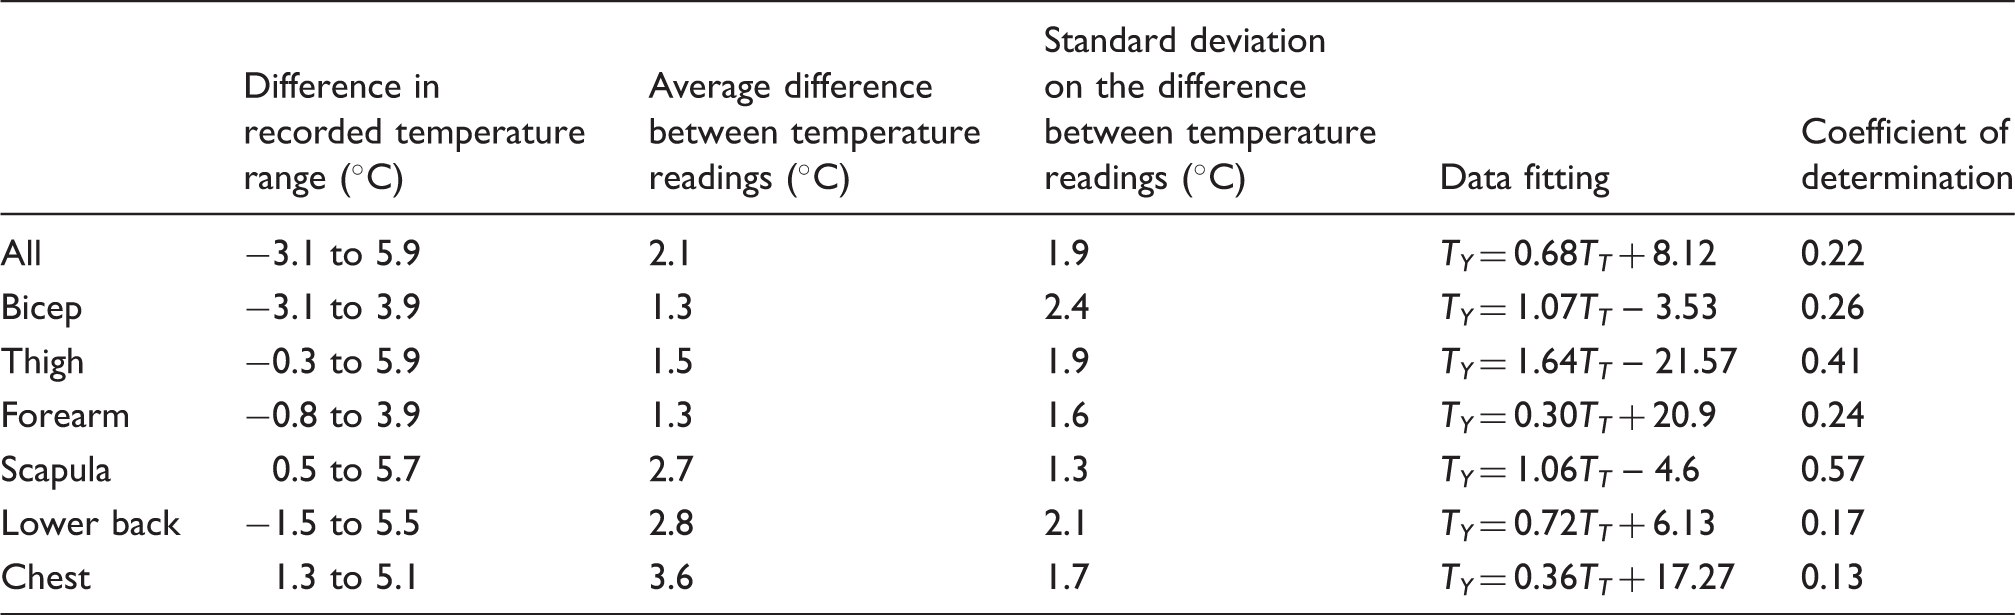
Table 2 shows that the average difference between the temperature readings was between 1.3℃ and 3.6℃. The large standard deviations on these averages showed that the differences observed did not follow a normal distribution. The data did not suggest that there were particular locations where there was a better fit of the suit, likely due to the different body morphologies of the participants. The data fittings showed a lack of (linear) correlation between the two sensing modalities, with the closest relationship observed being for readings taken at the scapula (R2 = 0.57).
Analyzing the data for participants at rest showed that Tsk readings could be taken; however, there were issues with the accuracy of these readings, and in many cases the readings recorded using the temperature-sensing E-yarns were lower than for the skin-mounted thermistors. These results highlight the difficulty in taking temperature measurements using an E-textile on humans.
On-body temperature measurements during cycling trials
Twenty-five datasets were collected from five participants (three bicep, five thigh, four forearm, seven scapula, five lower back, one chest): this corresponded to 174 on-body temperature measurements. These were the only complete datasets with corresponding data from both the temperature-sensing E-yarns and the skin-mounted thermistors. The primary reason for datasets being absent was due to breakages in the E-yarns or supporting hardware. Data from participants cycling at workloads between 95 and 340 W are shown in Figure 9.
Comparison of the skin temperature readings from the temperature-sensing electronic yarns (E-yarns) and skin-mounted thermistors for five participants cycling at different workloads. The equations for the data fittings (dashed lines) are given in Table 3. The thin solid lines have been included as a guide for the eye only. Each of the constituent parts of the figure show results at a different workload: (a) 95 W; (b) 130 W; (c) 165 W; (d) 200 W; (e) 235 W; (f) 270 W; (g) 305 W; (h) 340 W. The maximum workload for each participant limited the number of data points available at higher workloads.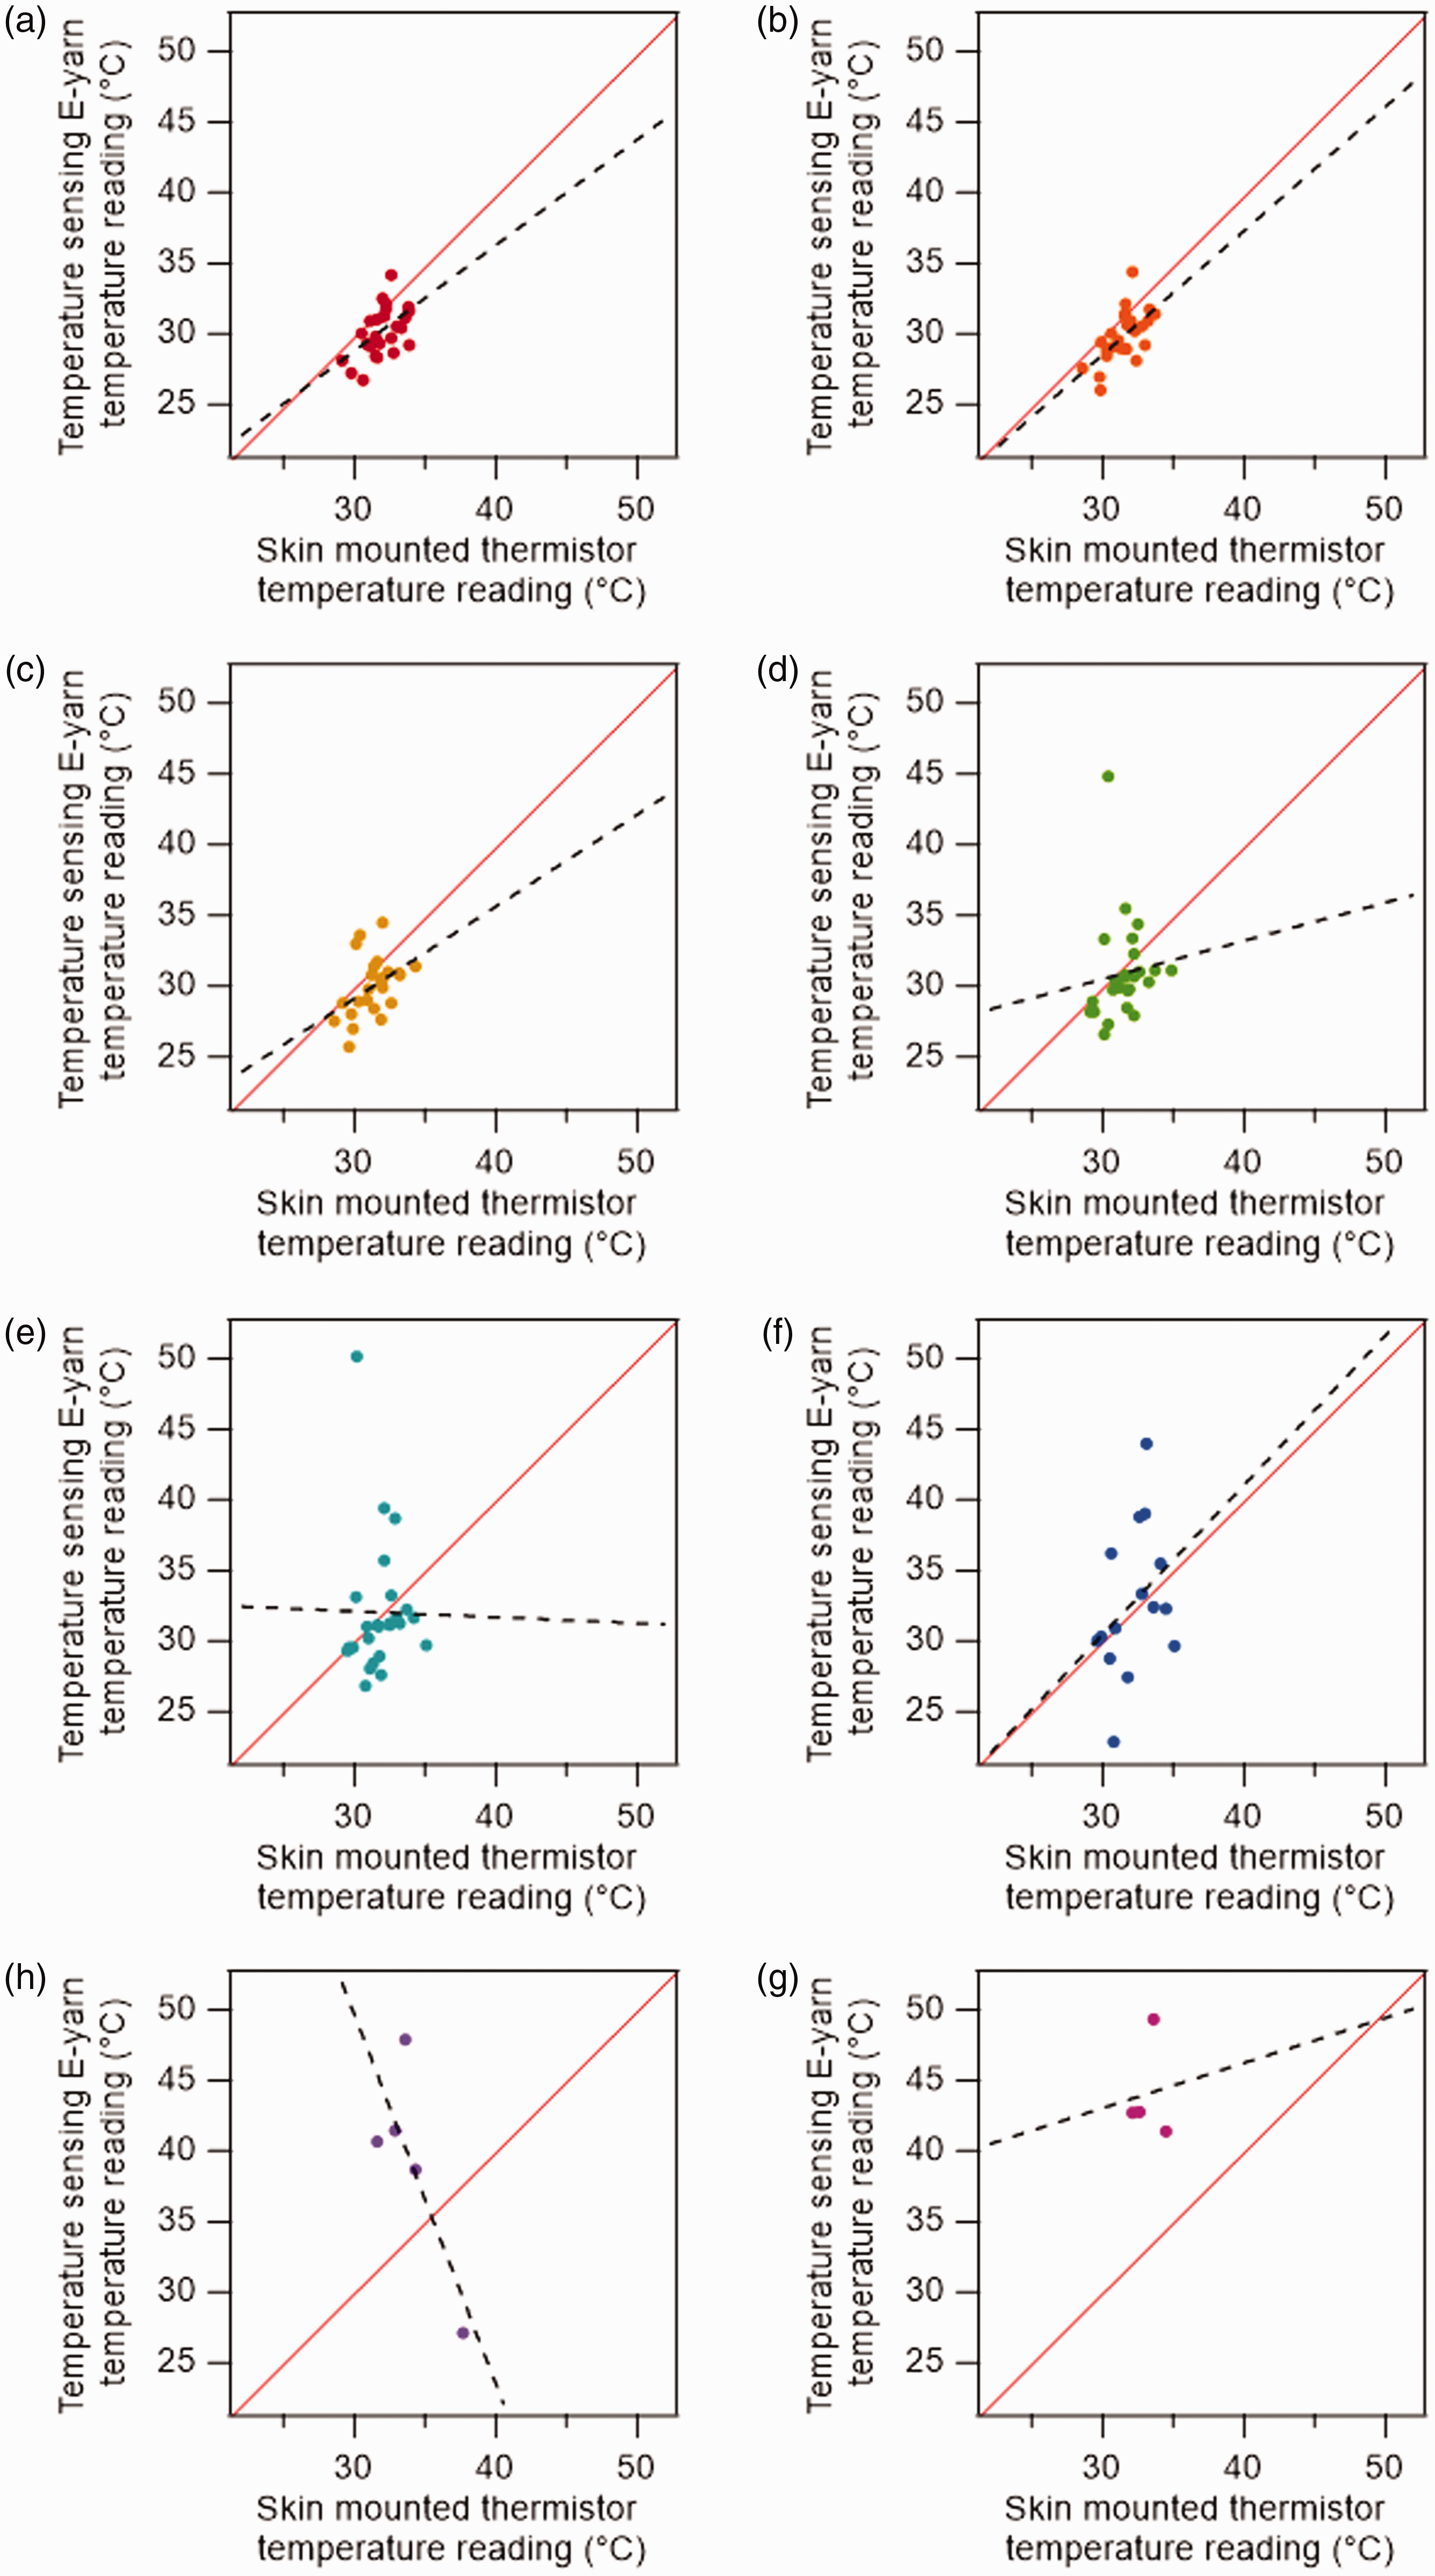
For low workloads (95 and 130 W, Figures 9(a) and (b)), almost all of the temperature-sensing E-yarn measurements were lower than for the skin-mounted thermistors. This could potentially be attributed to poor contact between the temperature-sensing E-yarn and the body, by the yarn adding an additional insulating layer over the skin-mounted thermistor, or by the long step-response time of the skin-mounted thermistors resulting in the temperature-sensing E-yarn (which has a much shorter step-response time) detecting a greater reduction in skin temperature. For the points where higher temperatures were recorded, the temperatures were within the expected physiological range. For 95, 130, and 165 W workloads, the maximum temperature difference observed between the temperature-sensing modalities was 4.7℃, which is comparable to the maximum difference of 5.9℃ observed at rest. This suggests that the temperature-sensing E-yarn’s ability to take skin temperature measurements was not impaired by physical activity related motion artifacts (at low workloads).
Summary of the difference in responses of the temperature-sensing electronic yarns and skin-mounted thermistors at different workloads. The data fittings presented in Figure 9 and their related coefficients of determination are also presented
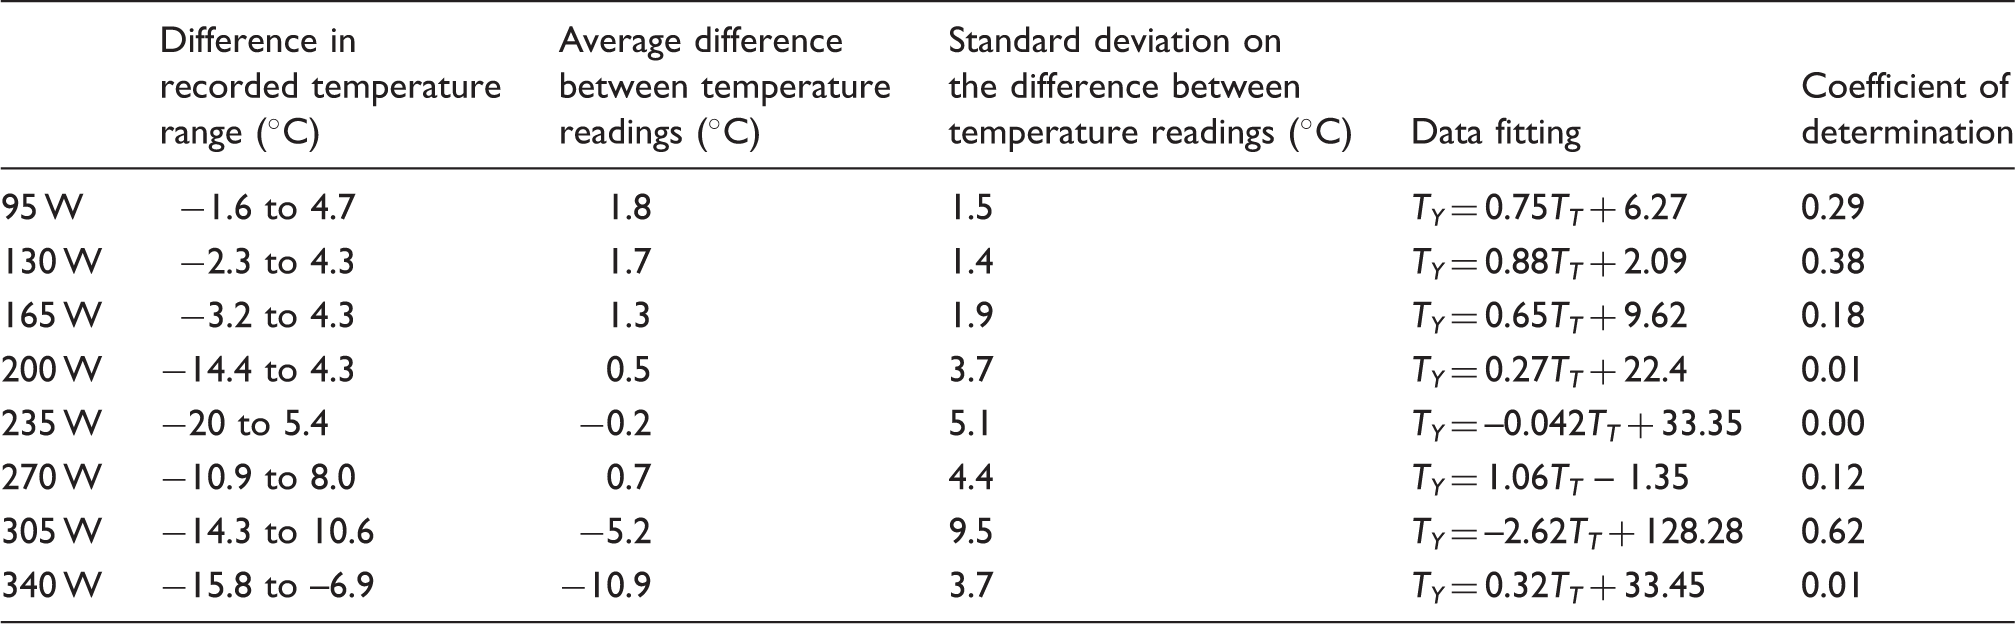
Figure 9(d) (200 W) shows an increasing discrepancy between the readings from the temperature-sensing E-yarns and the skin-mounted thermistors, with some readings being much higher than the upper limits of what would be expected for healthy human skin (∼36℃). The maximum temperature readings from the temperature-sensing E-yarns increased for 235 W and remained high for 270, 305, and 340 W workloads (Figures 9(e)–(g)), with a maximum reading of 50.2℃ recorded. The workload of 235 W likely represents the point at which sweat production increased, and altered the resistance characteristics of the E-yarns.
Temperature readings as a function of workload were then analyzed for different locations on the body. Initially, datasets for different participants were averaged together (when multiple datasets at one location were available), as shown in Figure 10.
Comparison of the temperature responses of the temperature-sensing electronic yarns (E-yarns) and skin-mounted thermistors at different workloads. The data points shown are the average of multiple data points, when available, with the standard deviation represented as error bars. Error bars are not present when there were inadequate data points for a given workload (i.e. at 340 W). (a) Bicep; (b) Thigh; (c) Forearm; (d) Scapula; (e) Lower back; (f) Chest (only one measurement, taken from Participant 1).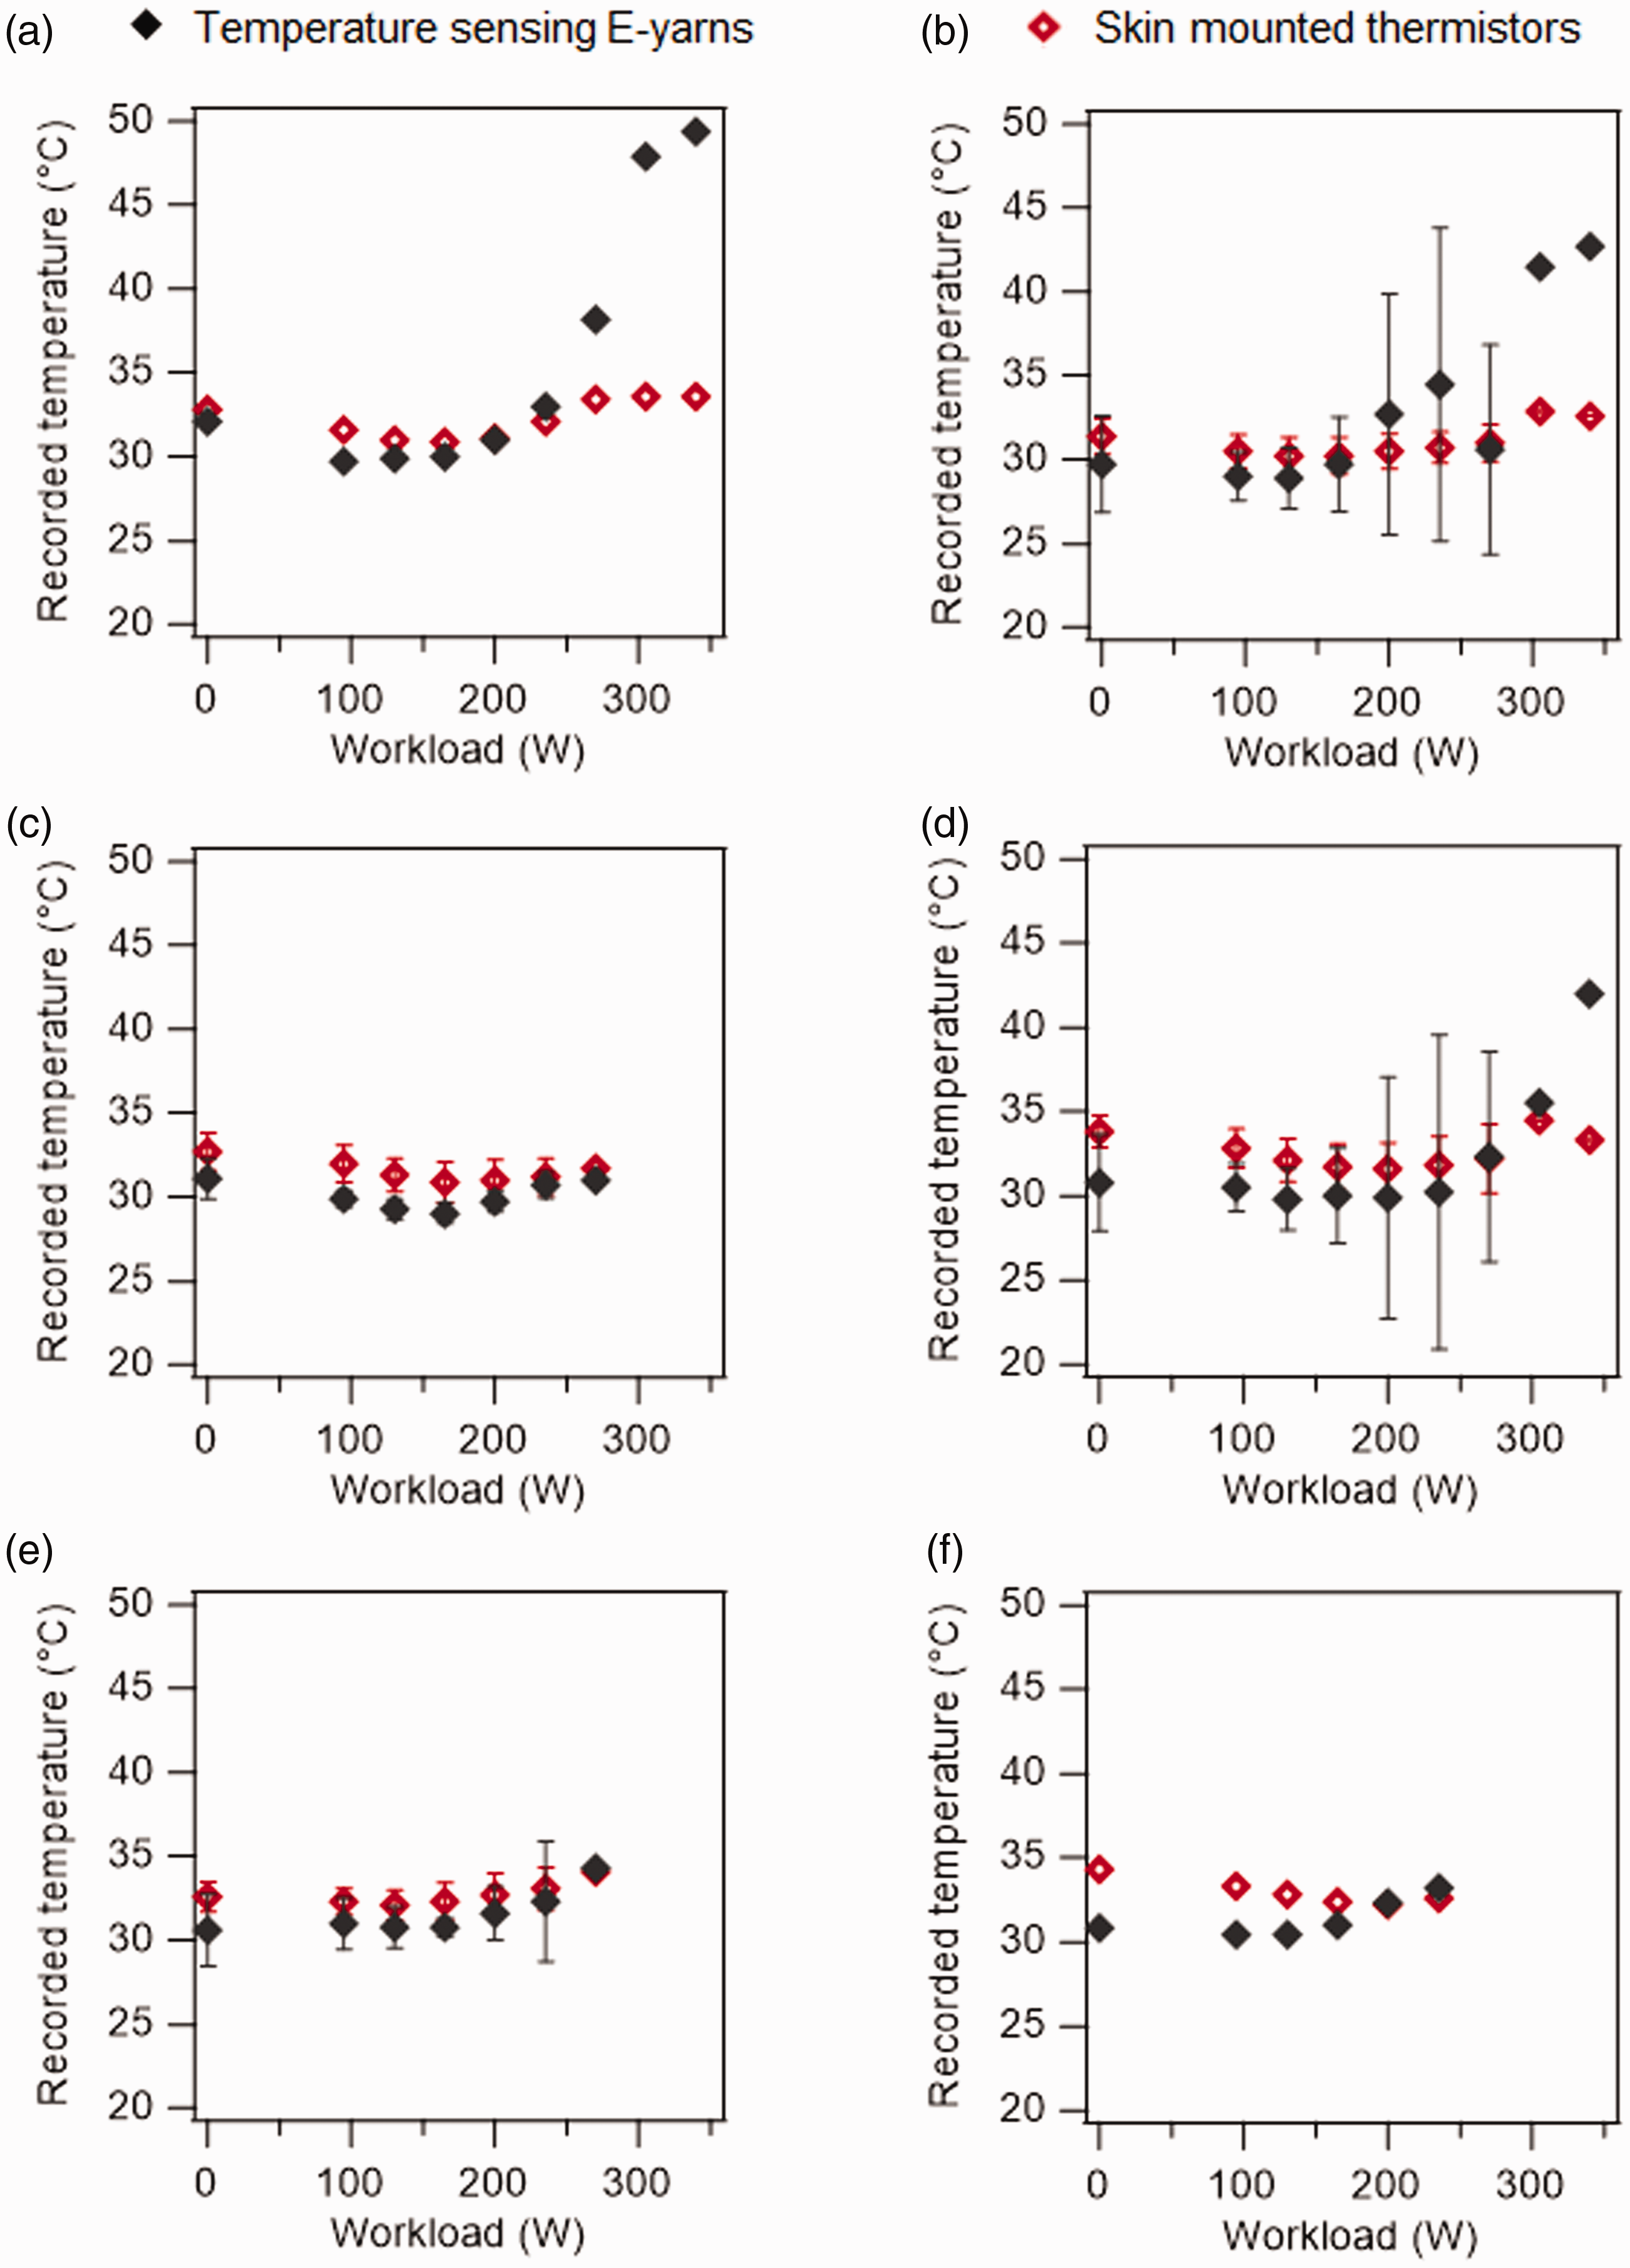
Skin temperature is known to vary between people and the averaging of measurements from different participants results in very large variations, as shown in Figures 10(b)–(e) for both the E-yarn and skin-mounted thermistor measurements. Within the measurement error there appeared to be a correlation between the two sensing modalities at the lower back (Figure 10(e)). The general trend in the temperature-sensing measurements (a slight drop in temperature with workload before an increase) can be seen for measurements at the forearm (Figure 10(c)). Up to workloads of 270 W the temperature-sensing modalities also appear to be in agreement for the thigh (Figure 10(b)) and scapula (Figure 10(d)). In all of these cases the errors in the temperature measurements were large, especially for the E-yarn at high workloads (∼200 W) for the thigh, scapula, and lower back (Figures 10(b), (d), and (e)). As such, it was difficult to draw any meaningful conclusions from these data.
The complete individual datasets from each of the remaining 24 successful trials were subsequently analyzed and the Tsk readings from both sensing methodologies were compared (the Participant 1 chest data in Figure 10(f) has not been repeated below). Figure 11 shows five datasets where the general trend in the temperature changes observed was in reasonably close agreement for both temperature-sensing modalities.
Comparison of the temperature responses of the temperature-sensing electronic yarns (E-yarns) and skin-mounted thermistors at different workloads: (a) Participant 5, thigh; (b) Participant 5, thigh, repeat measurement; (c) Participant 5, forearm; (d) Participant 2, forearm; (e) Participant 1, lower back.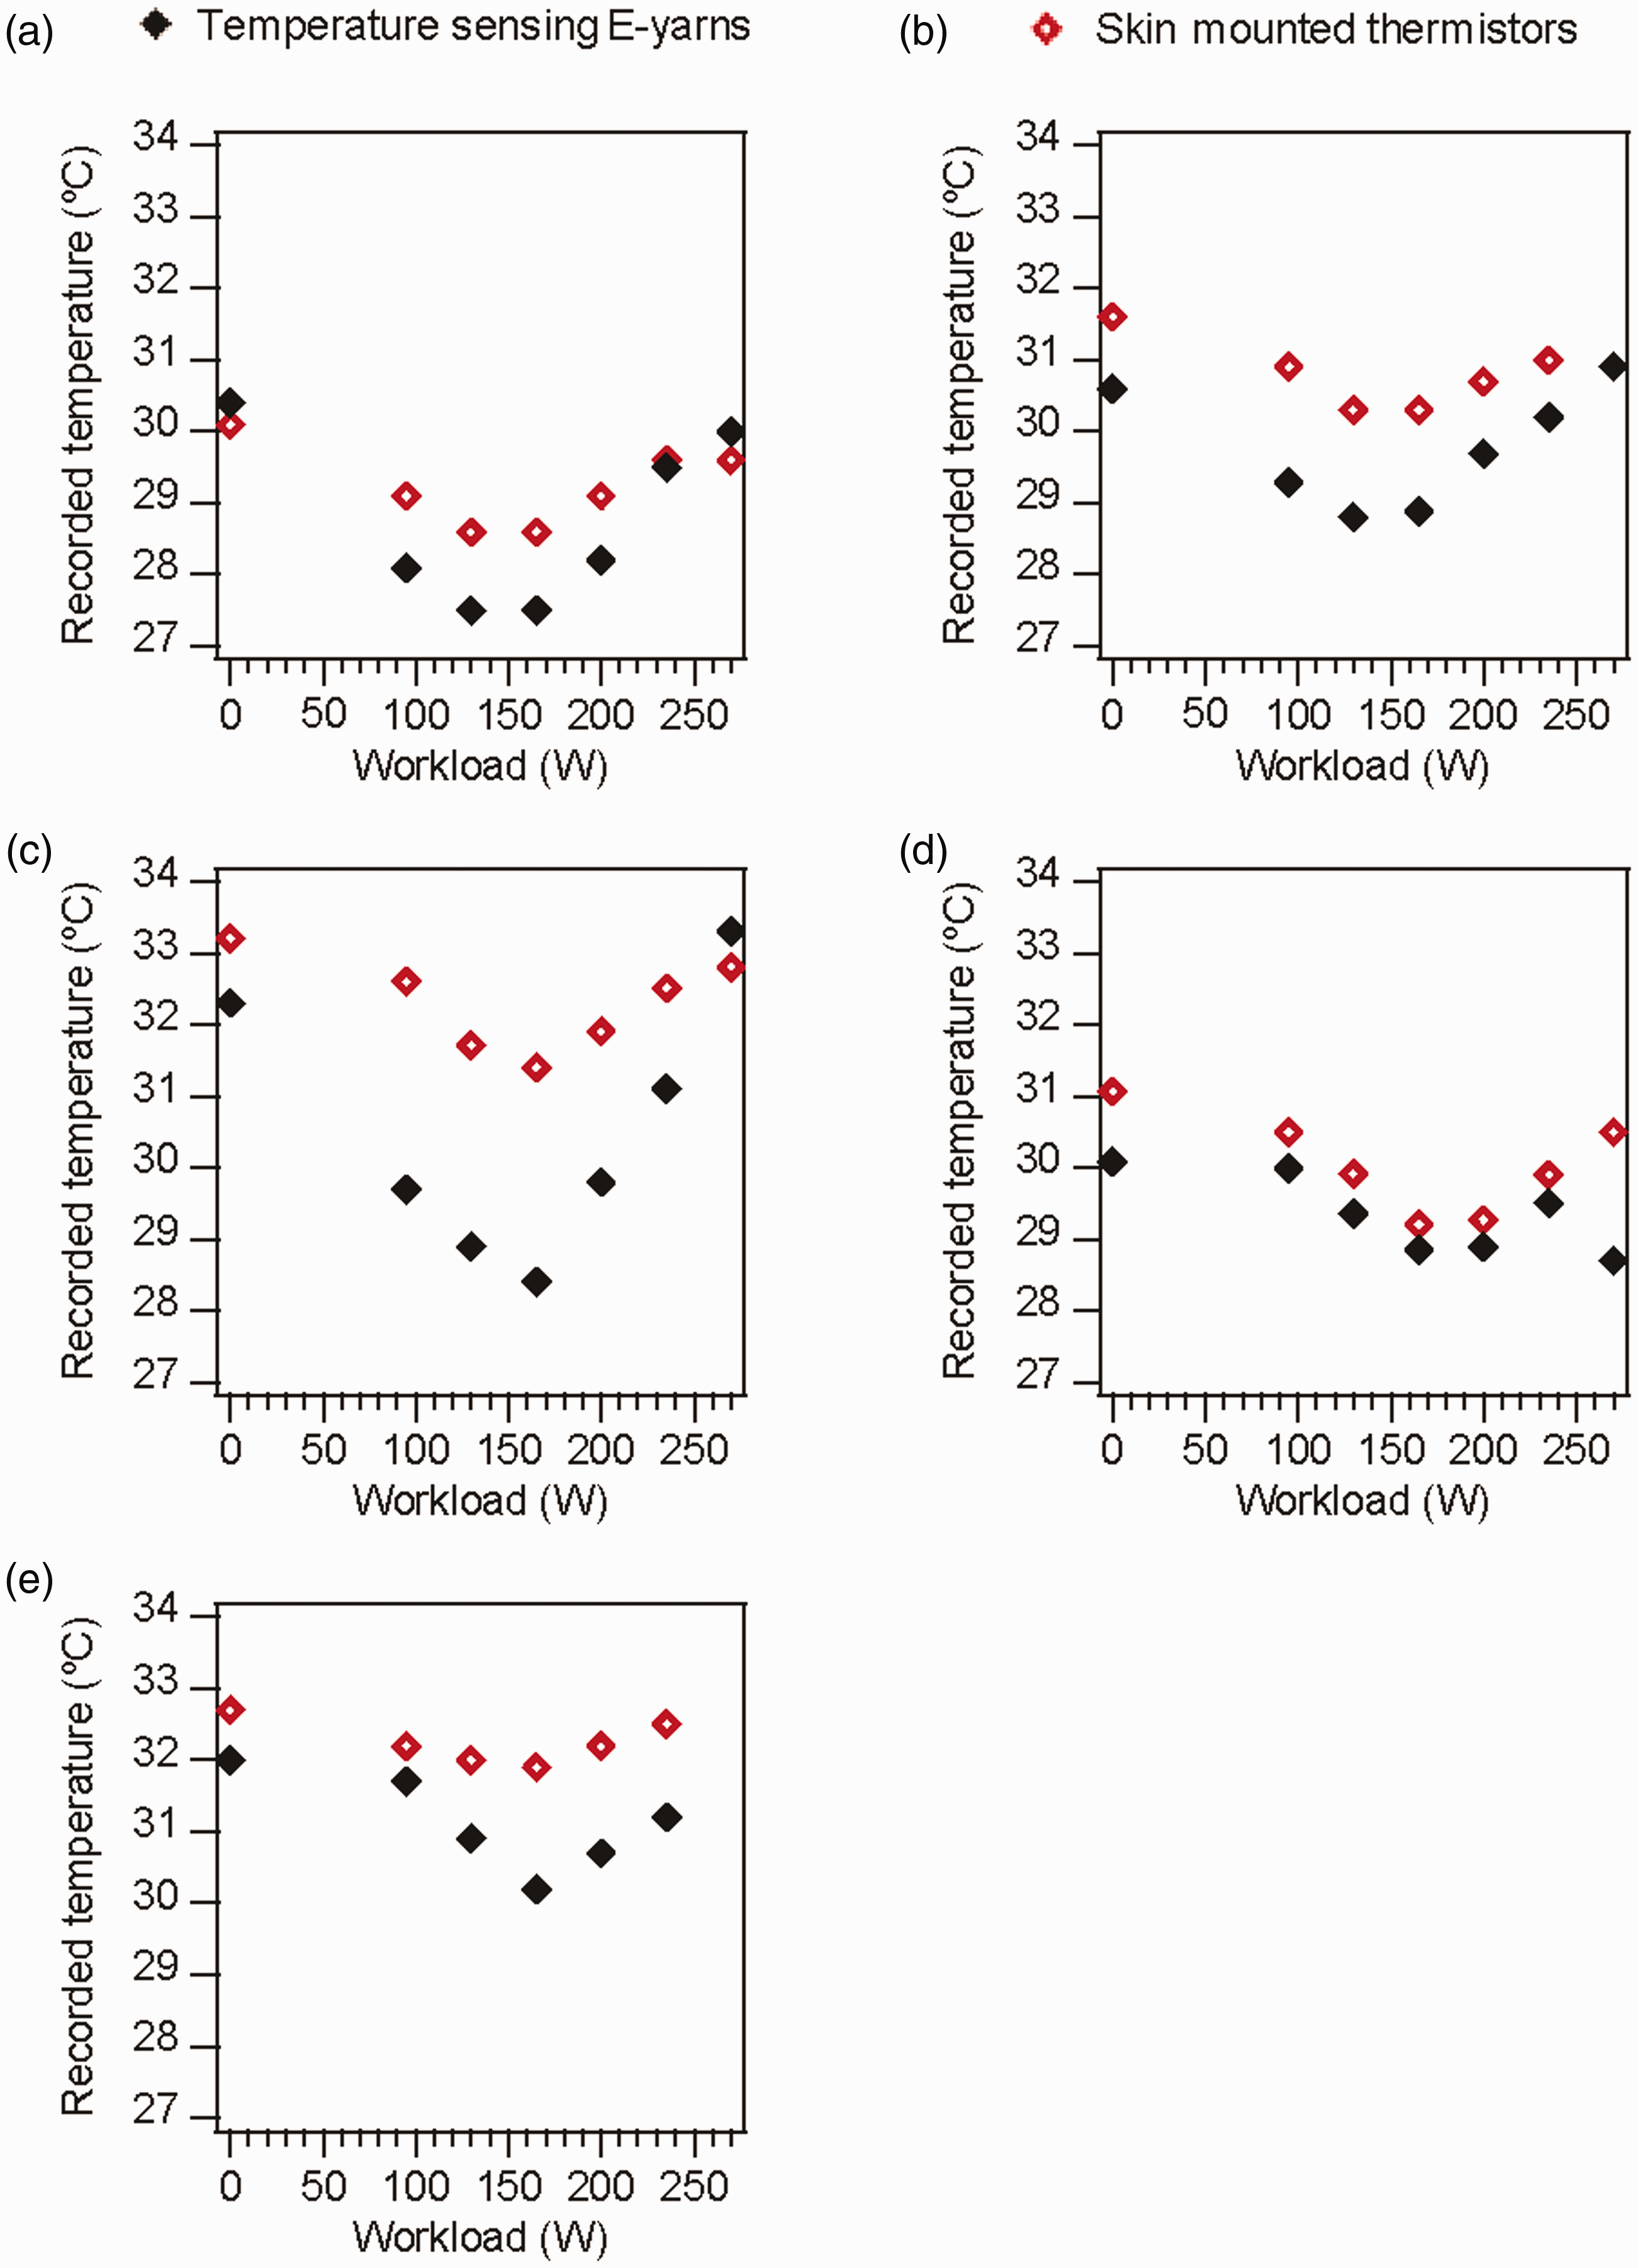
The data in Figure 11 show an initial decrease in skin temperature as the workload increases, as a result of peripheral blood flow redistribution occurring at the onset of exercise. After the core body temperature reaches its threshold, vasodilation will cause the blood flow in the skin to increase to allow the body to rapidly remove excess heat, leading to the observed increase in skin temperature. The distribution of capillary density at the skin surface varies by body region, as does the surface area to mass ratio, which in part explains the variation in surface temperature between different body segments. In general, areas with a high capillary density, such as the forearms, also experience high rates of heat loss.
A reduction in skin temperature during exercise has previously been presented in the literature.32,33,36 Torii et al. 32 observed that during cycling trials a 60 W workload resulted in a drop in the mean skin temperature of around 1℃. For experiments where there was a final workload of 150 W, the chest and abdominal skin temperatures were observed to fall by 1.5–2.0℃. For moderate exercise on a treadmill, de Andrade Fernandes et al. 36 reported a reduction in skin temperature at multiple sites on the body, followed by the skin temperature gradually increasing. Regional variation in skin temperature responses to exercise have also been shown. 33
The general trends observed for both sensing modalities are similar (the 270 W point in Figure 11(d) notwithstanding). However, it is clear that the temperature-sensing E-yarns record much larger temperature changes than the skin-mounted thermistors for Figures 11(a)–(c) and (e). Given that at rest (in these cases) the two sensing modalities were in close agreement, it is possible that the slow step-response time of the skin-mounted thermistors was inadequate to capture the full change in Tsk. This is supported by studies of this type of skin-mounted thermistor in the literature. 35
As the non-permeable micro-pod of the E-yarn was significantly smaller than the skin-mounted thermistors used in this work, it is possible that the effects of evaporation may have influenced the Tsk readings of the two sensor types differently. Work by MacRae et al. 37 compared fine T-type thermocouples to skin-mounted thermistors (iButtons; type DS1922L) during a cycling trial and observed a difference between the Tsk readings from the two sensor types, which indicated that the thermistor obstructing evaporation may have led to measurement errors. The study also showed that obstructing evaporation can lead to an overestimate of the Tsk of up to 1℃. 37
Figure 12 shows five example sets of data where the two temperature-sensing modalities showed poor agreement.
Comparison of the temperature responses of the temperature-sensing electronic yarns (E-yarns) and skin-mounted thermistors at different workloads: (a) Participant 4, scapula; (b) Participant 4, scapula repeat; (c) Participant 1, thigh; (d) Participant 4, thigh; (e) Participant 4, bicep.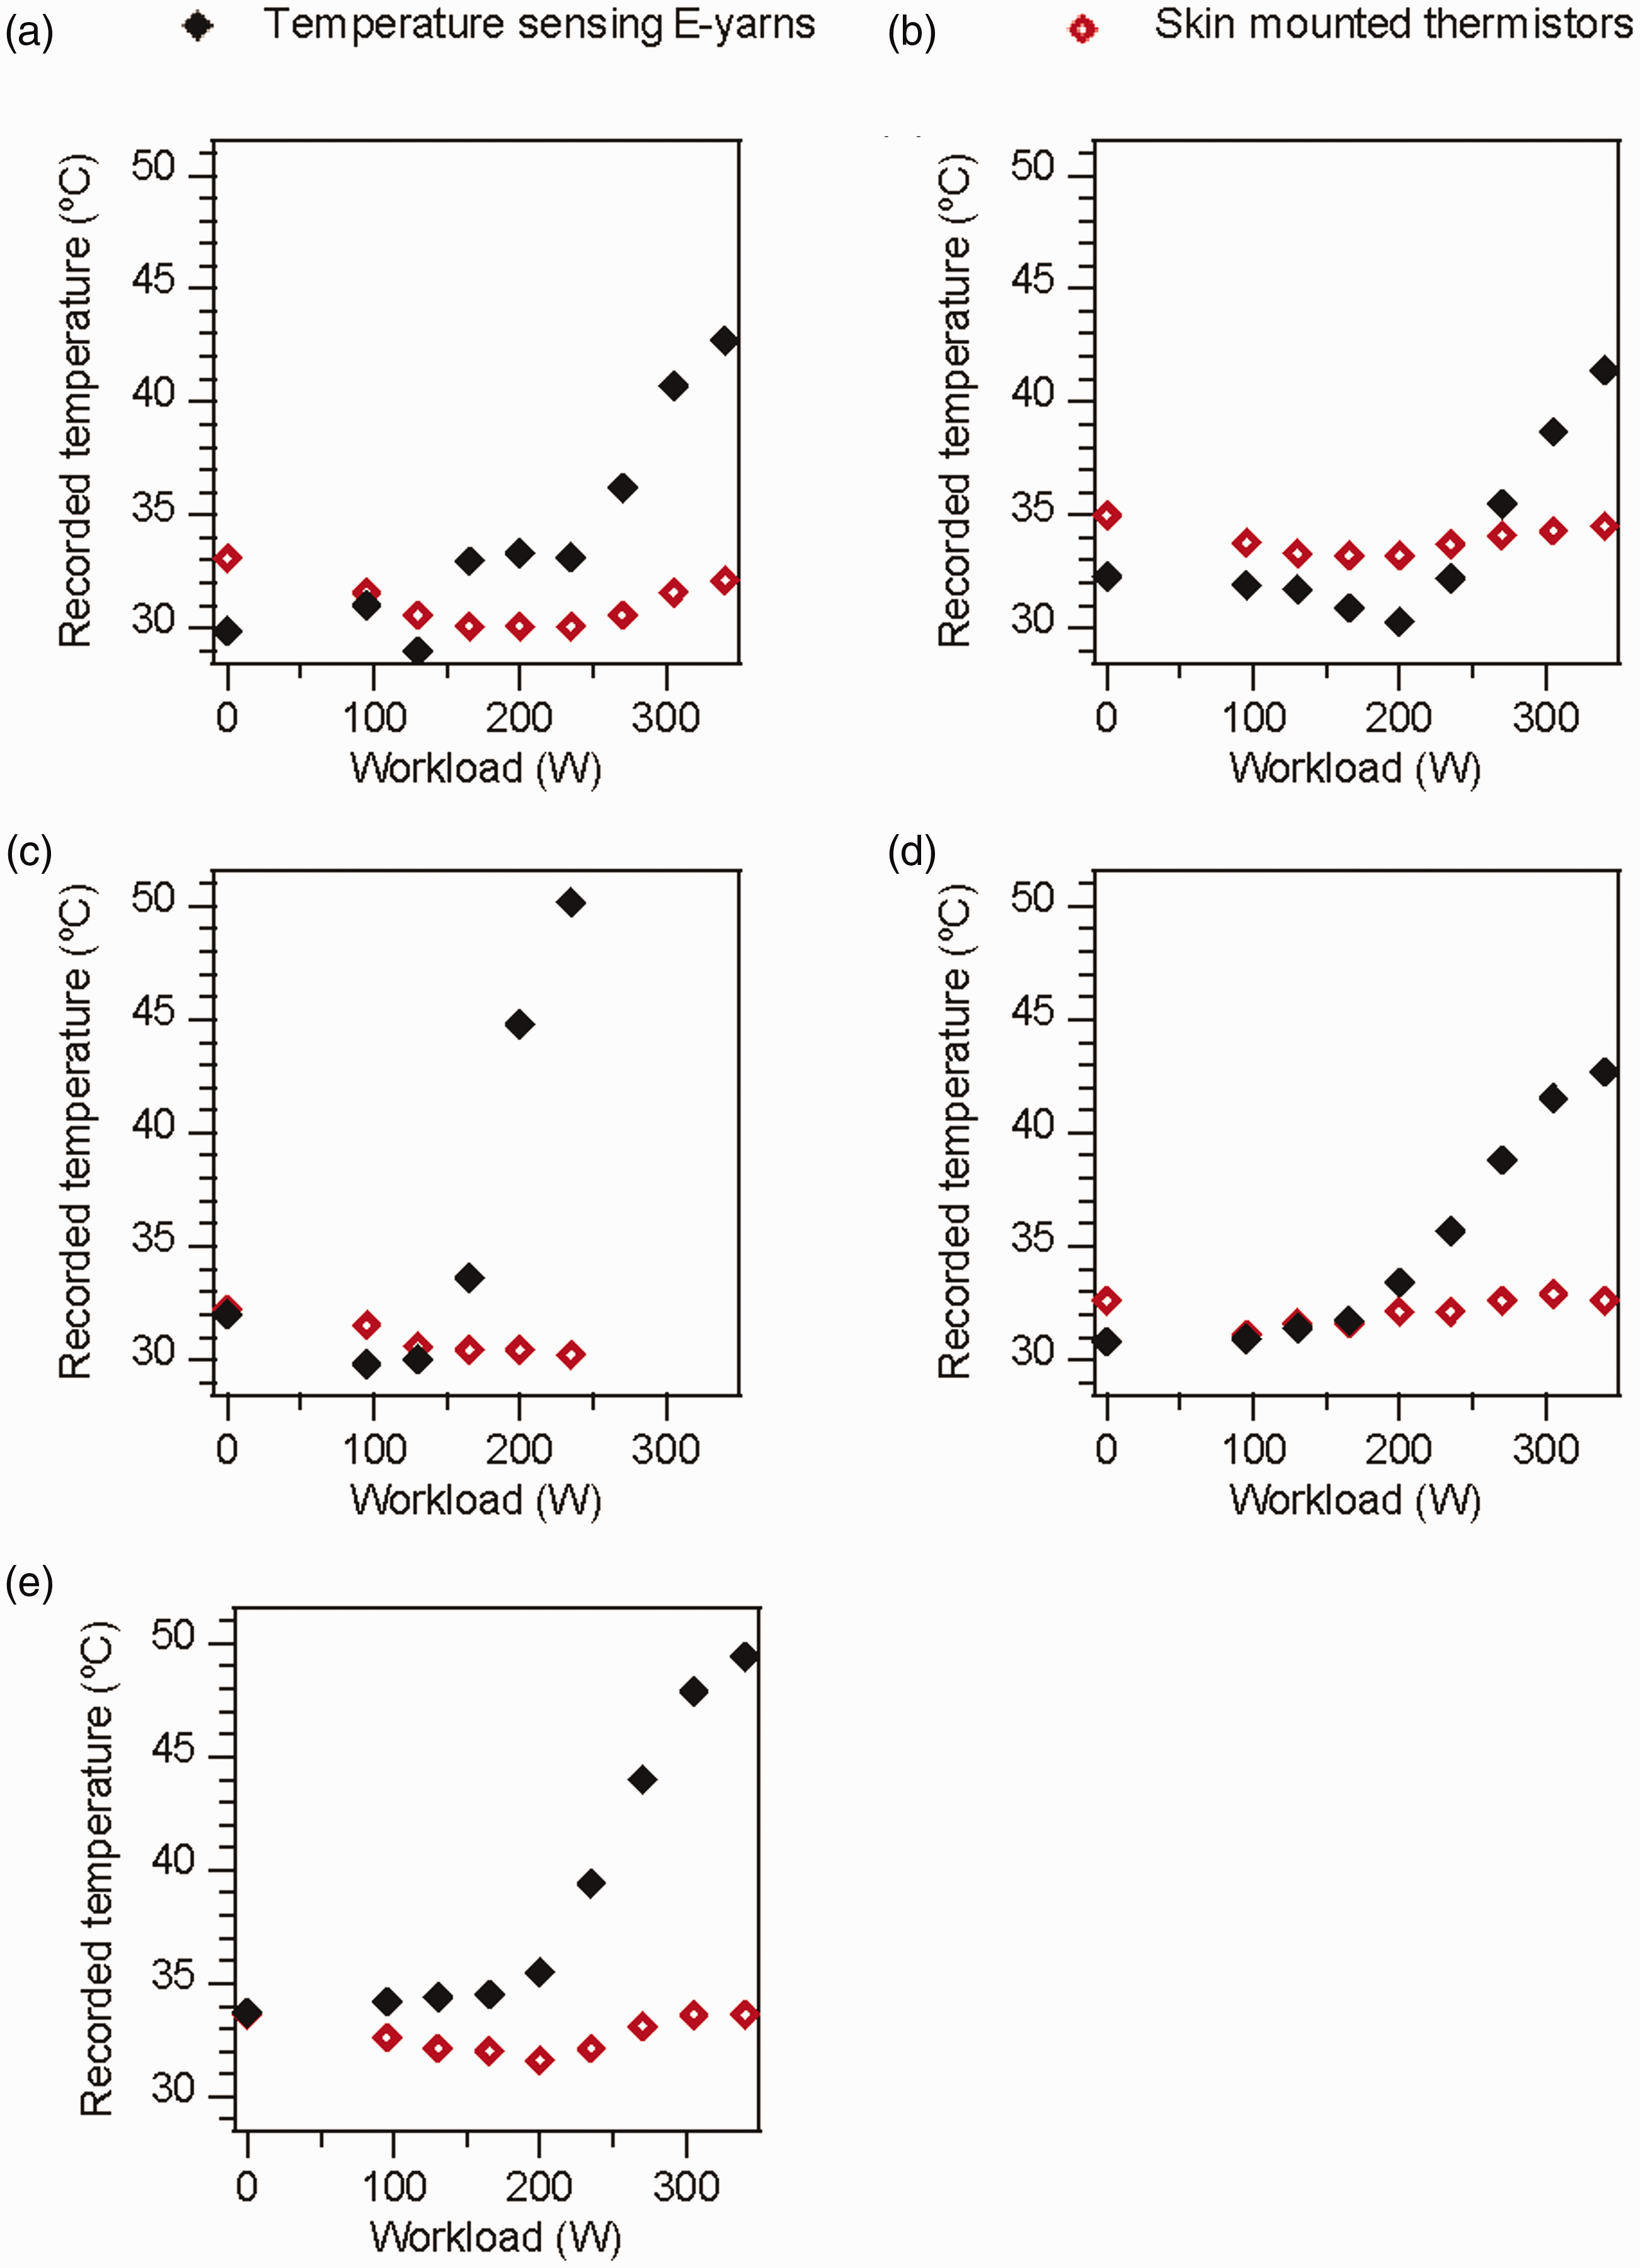
The trends shown by the two temperature-sensing modalities with increasing workload in Figure 12 are in reasonable agreement until 165–200 W, after which the temperature readings from the temperature-sensing E-yarns rapidly increased. Such an increase in Tsk is not a real physiological effect as these temperature readings far exceed the temperatures of healthy human skin. In addition, such high temperatures were not recorded by the skin-mounted thermistors. This apparent increase in temperature must have been due to a reduction in the resistance in the E-yarn. An increased workload would result in two possible effects. Firstly, a greater workload would lead to an increase in the movement of the participant in some locations; in a cycling trial this would have principally been the thigh. If movement had affected the response of the temperature-sensing E-yarn then this affect would not have been observed for the scapula (see Figures 12(a), 12(b), 13(a), 13(b), 13(d), 14(d), and 15(c)) or bicep (see Figures 12(e), 13(c), and 15(d)) at higher workloads, as these would remain stationary throughout the trial.
The second possible factor was the build-up of sweat, which was visible on the body surface throughout testing. While the temperature-sensing E-yarns have been shown to operate when submerged in water or when wet (i.e. water had been absorbed), 22 human sweat contains NaCl and can therefore conduct electricity. While the electrically conducting elements of the E-yarn were buried deep within the yarn, and most of the fibers of the E-yarn were made from polyester, which has poor water absorption properties in most cases, at very high workloads the sweat build-up on the participants may have resulted in the E-yarns becoming soaked in sweat. The sweat may then have provided an electrically conductive pathway that could bypass the high-resistance thermistor chip, essentially acting as a resistor in parallel with the thermistor.
Prior to the analysis of these results it was not believed that sweat would have a significant effect on the temperature-sensing E-yarn responses, as such sweat electrical resistance on the participants was not measured during these trials. However, these results indicated that sweat was a factor. To better understand the possible effect of sweat on the temperature-sensing E-yarn measurements a series of additional benchtop experiments were conducted, which are detailed in the next section.
Figure 13 shows four datasets where the temperature-sensing E-yarns showed consistently lower temperature readings throughout the cycling trial. These lower temperatures were likely due to poor contact between the temperature-sensing E-yarns and the body; however, some of the offset may have been attributed to evaporation effects, as discussed earlier. The measurements for Figures 13(a) and (b) were both taken on the scapula of Participant 1. The repeated temperature offset implies that the suit did not fit the participant well at the scapula.
Comparison of the temperature responses of the temperature-sensing electronic yarns (E-yarns) and skin-mounted thermistors at different workloads: (a) Participant 1, scapula; (b) Participant 1, scapula repeat; (c) Participant 5, bicep; (d) Participant 5, scapula.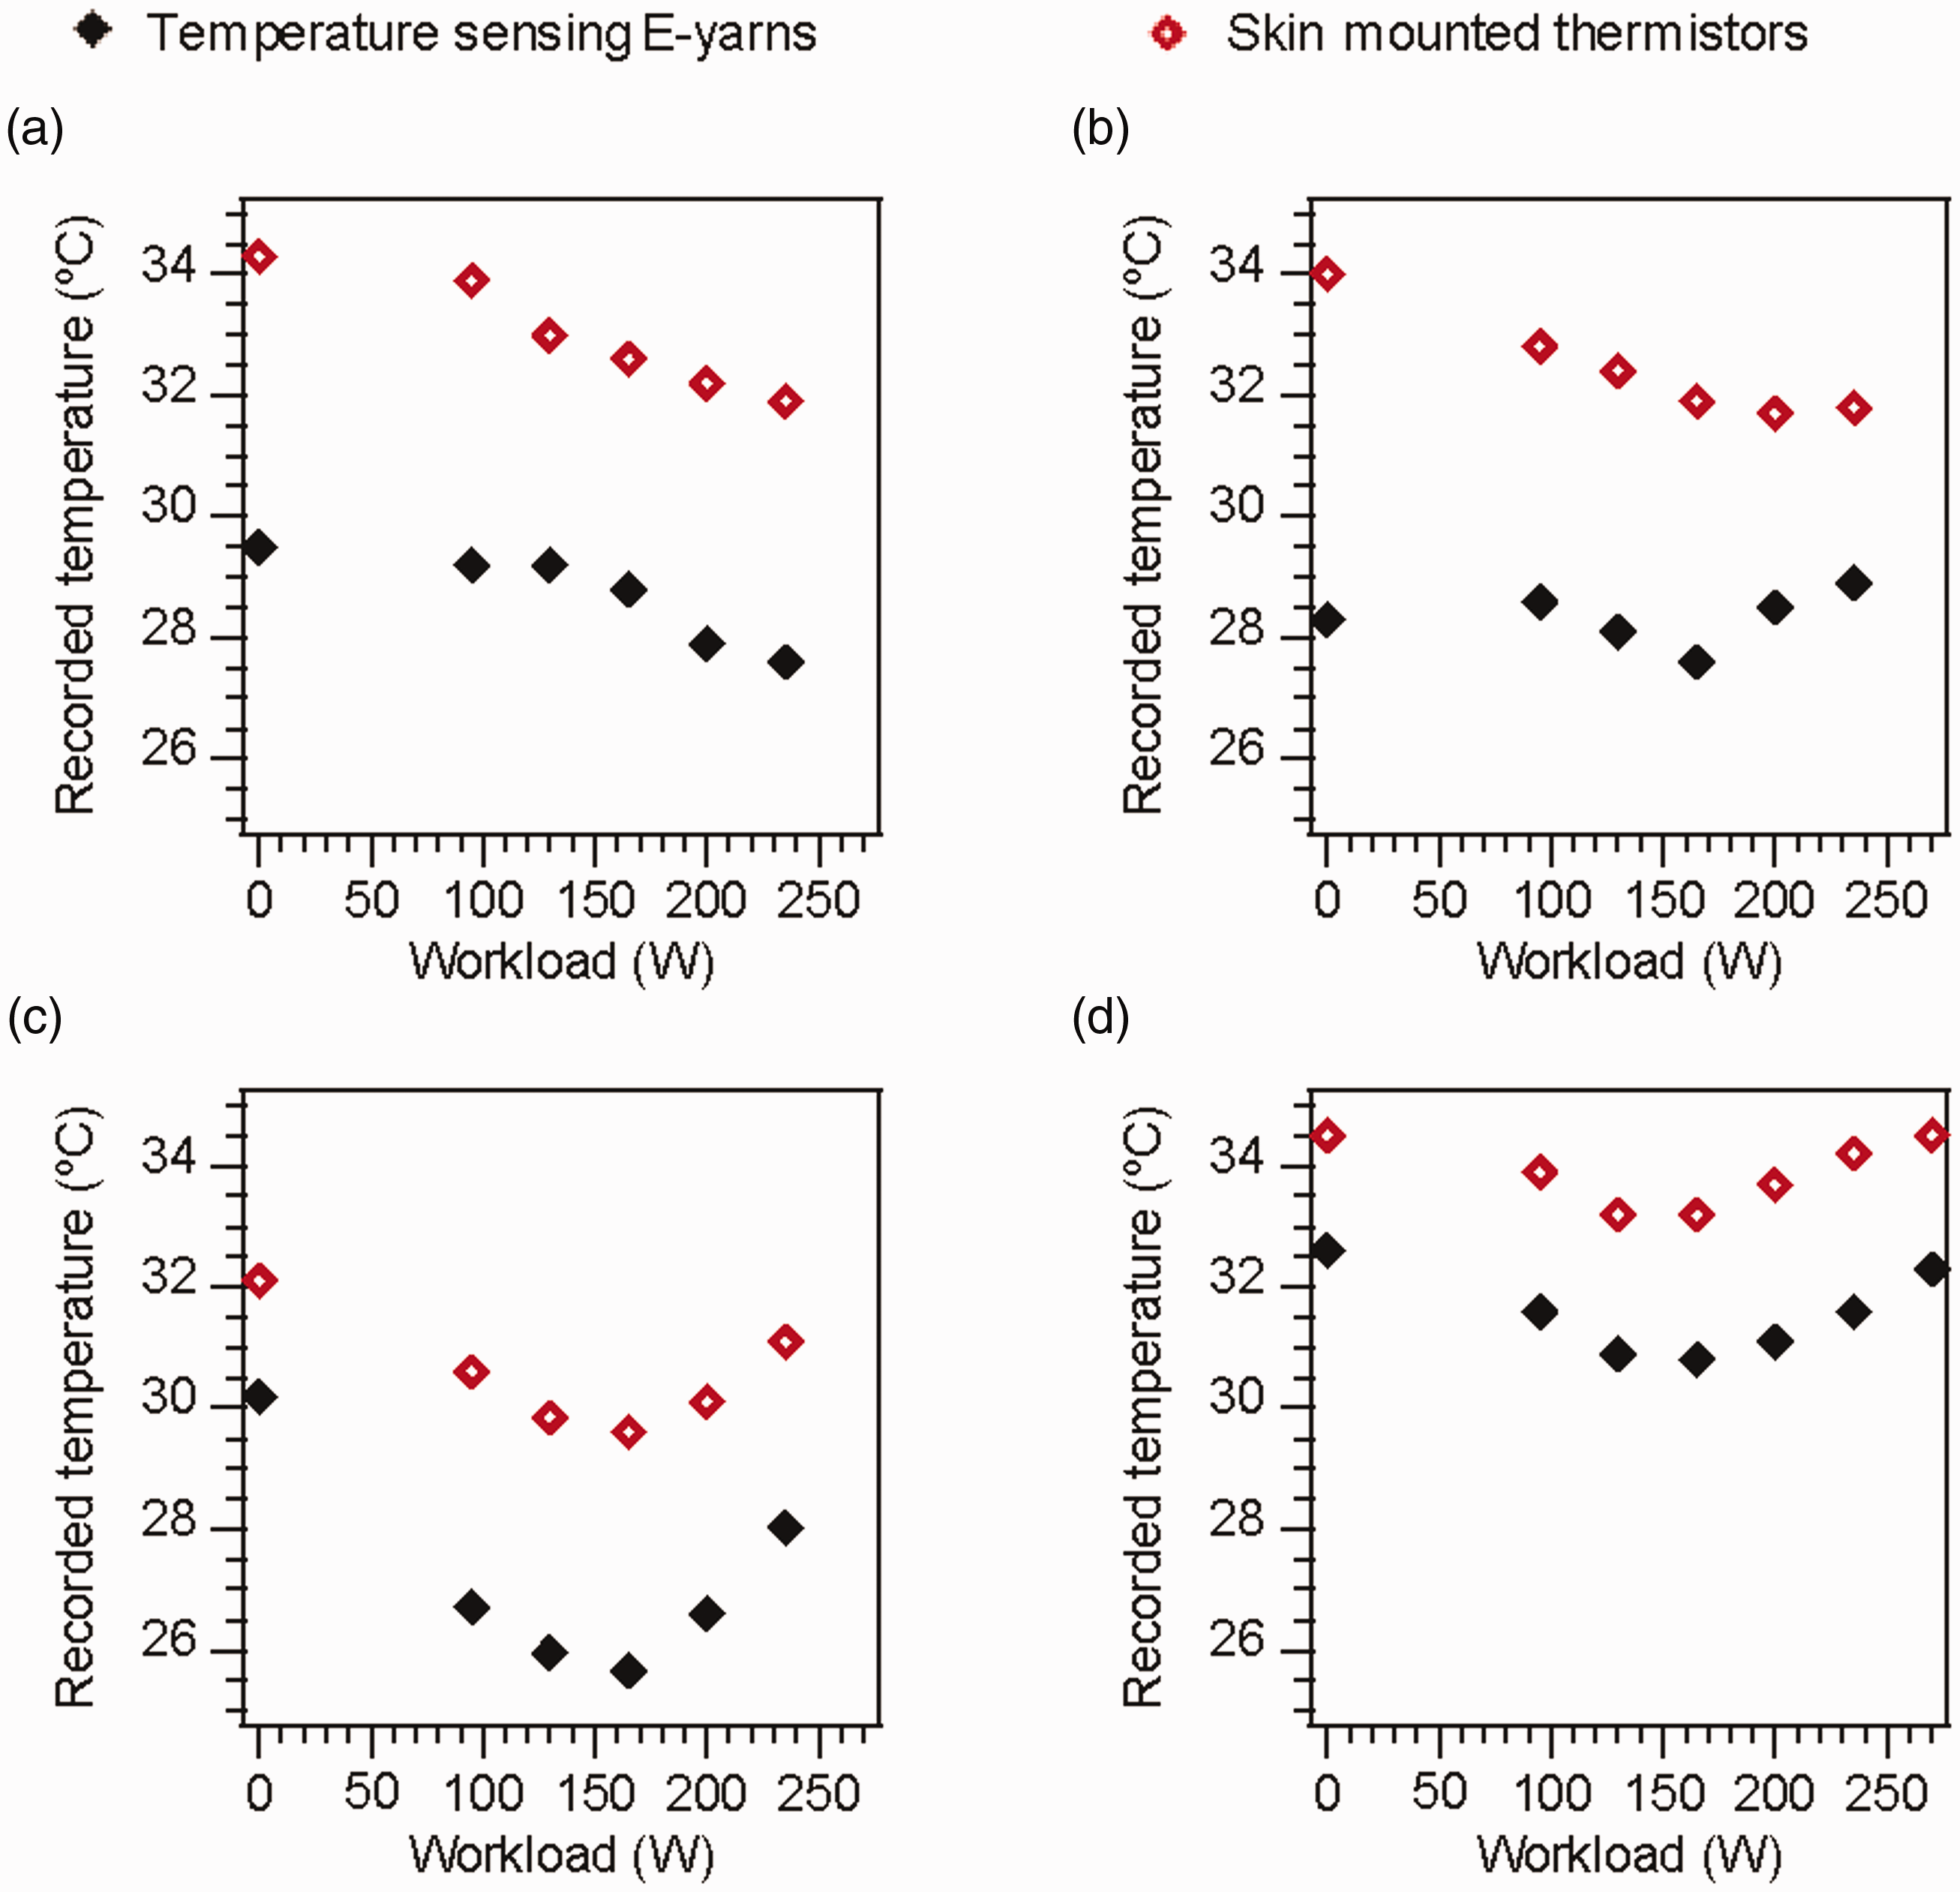
Of the three identified sources of error, some datasets showed a combination of these effects, as shown in Figure 14.
Comparison of the temperature responses of the temperature-sensing electronic yarns (E-yarns) and skin-mounted thermistors at different workloads: (a) Participant 1, forearm; (b) Participant 1, forearm repeat; (c) Participant 2, lower back; (d) Participant 5, scapula repeat measurement.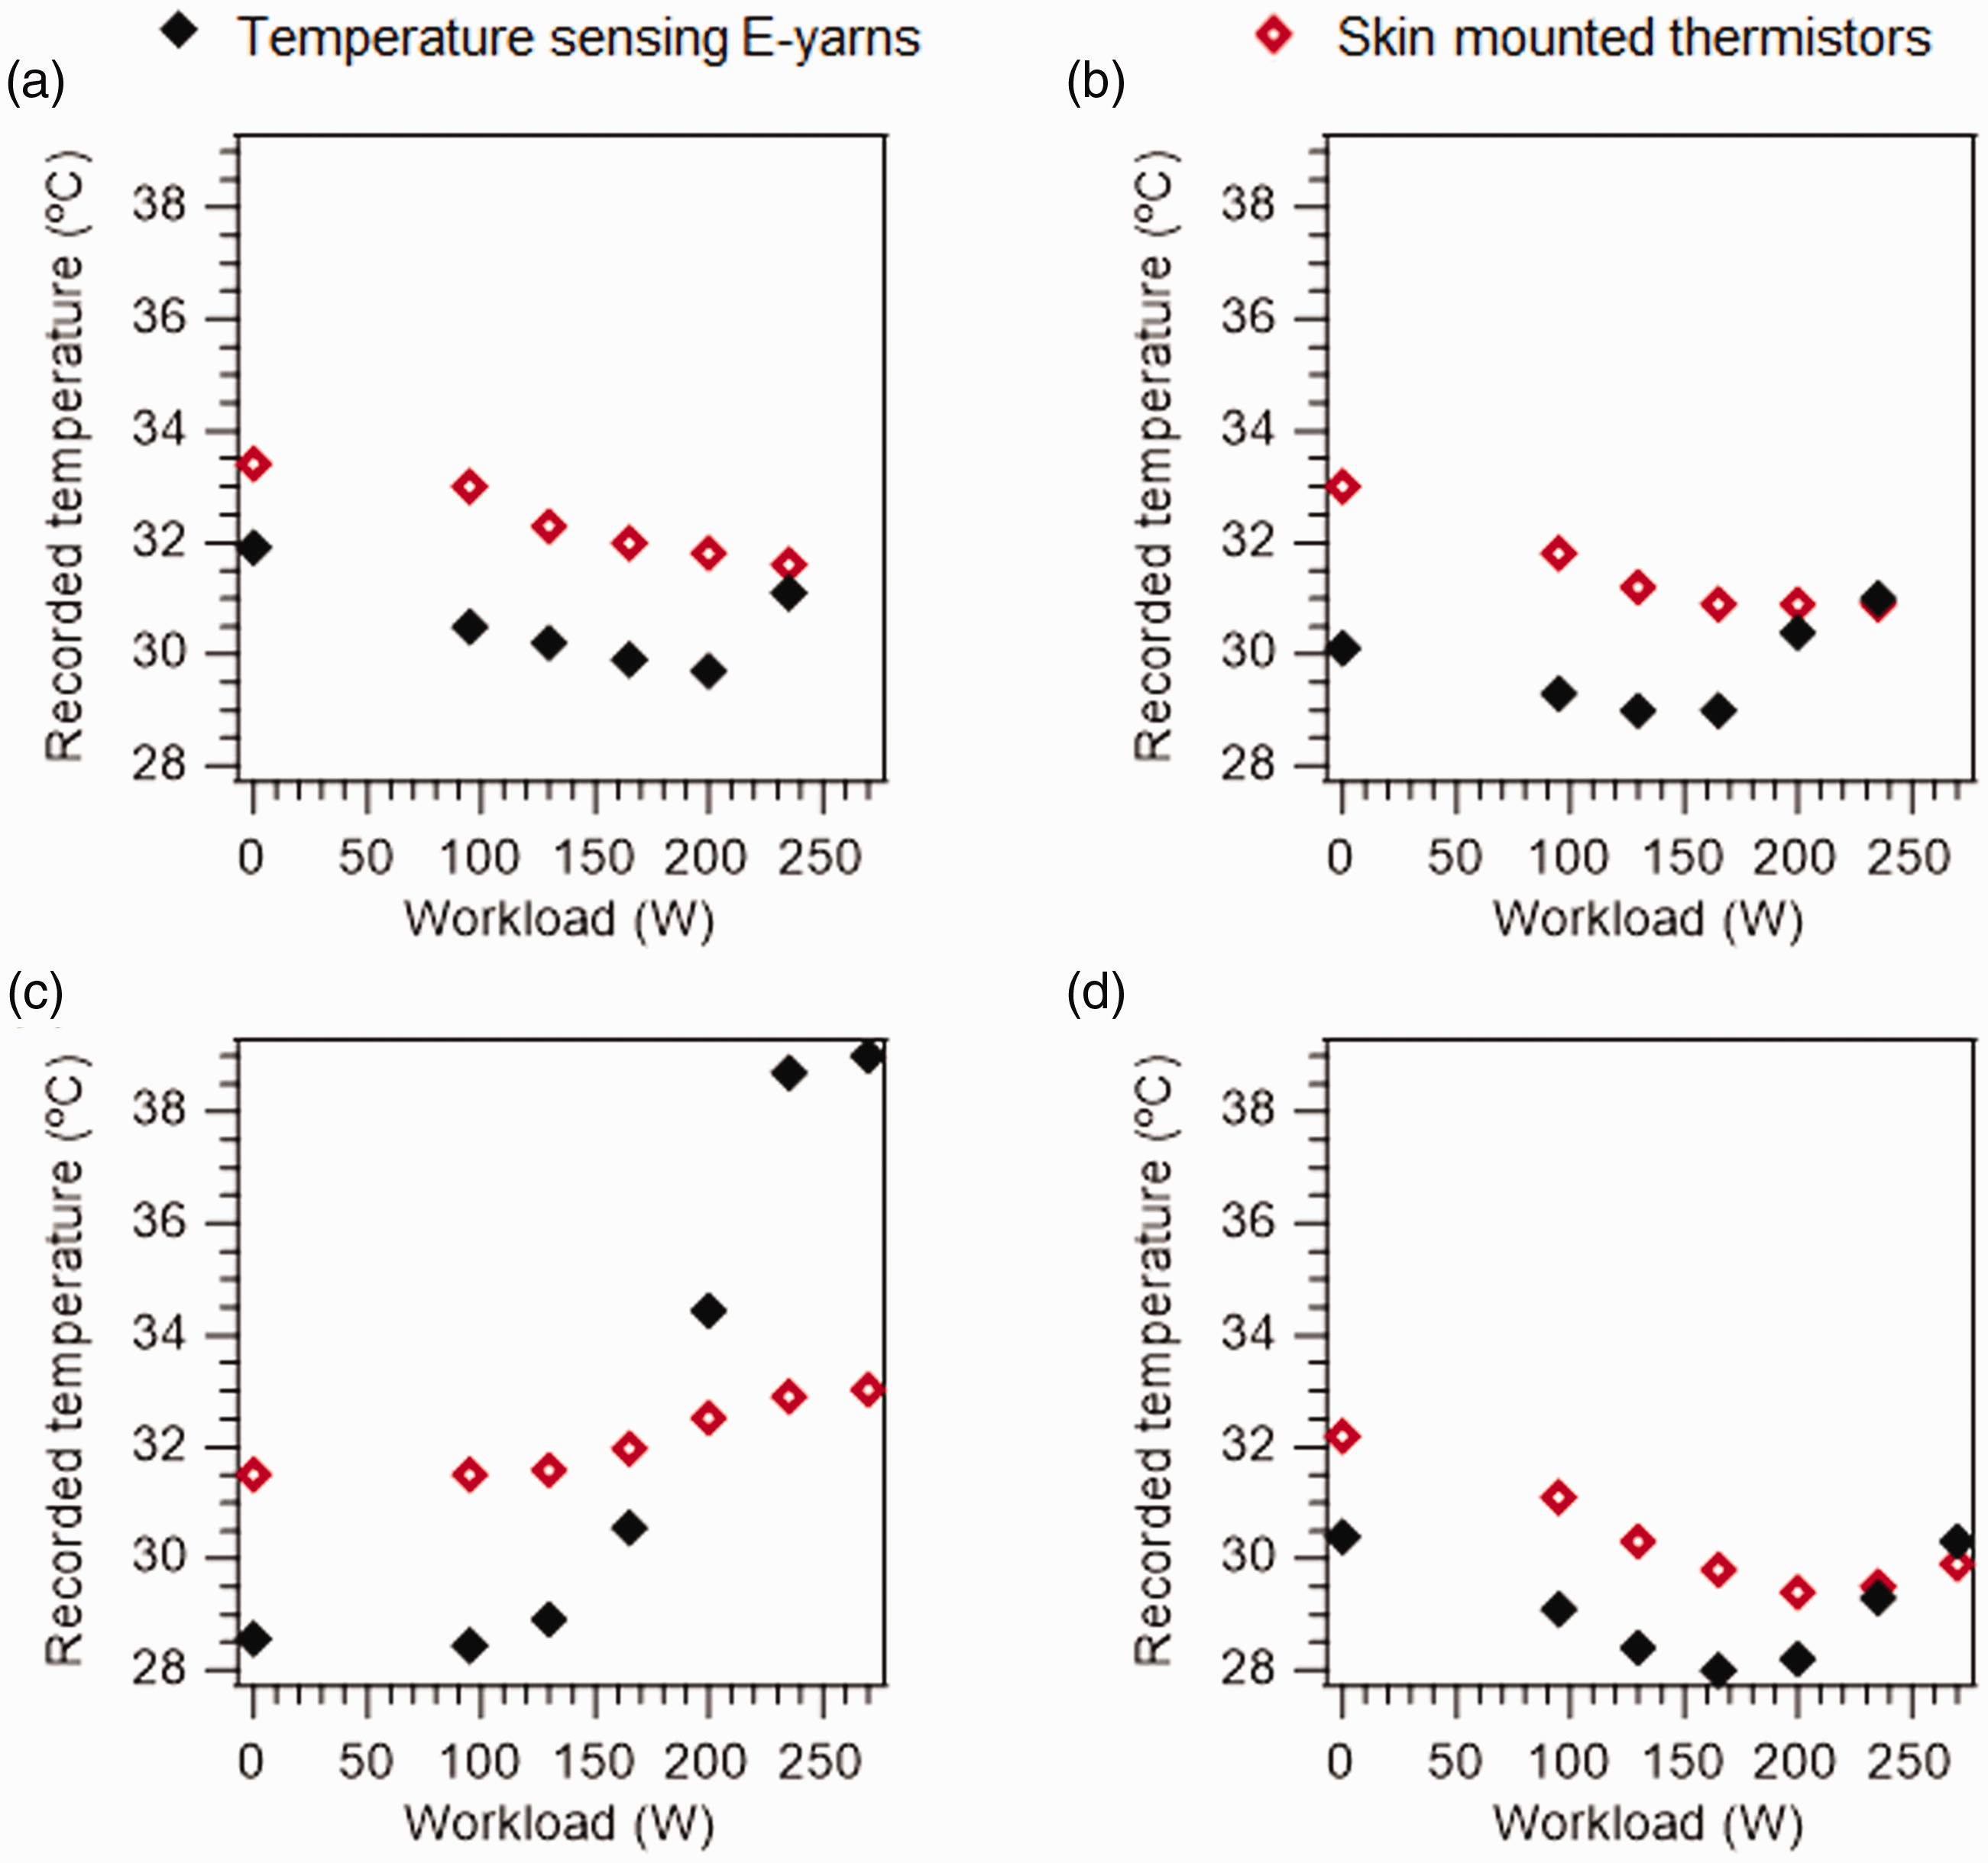
Figure 14 shows datasets with a clear offset at low workloads, likely due to poor contact between the temperature-sensing E-yarns and the skin. At higher workloads the temperature-sensing E-yarn Tsk readings are seen to increase, likely due to a build-up of sweat due to inhibited evaporation, or saturation of the E-yarn fabric. These examples show lower maximum recorded temperatures (from the temperature-sensing E-yarns) than those displayed in Figure 12. This is likely due to the poor contact between the E-yarns and skin leading to less sweat building up in the yarns and fabric, resulting in a less pronounced effect.
The remaining six datasets are presented in Figure 15 for completeness.
Comparison of the temperature responses of the temperature-sensing electronic yarns (E-yarns) and skin-mounted thermistors at different workloads: (a) Participant 1, lower back; (b) Participant 2, thigh; (c) Participant 3, scapula; (d) Participant 5, bicep repeat measurement; (e) Participant 5, lower back; (f) Participant 5, lower back repeat measurement.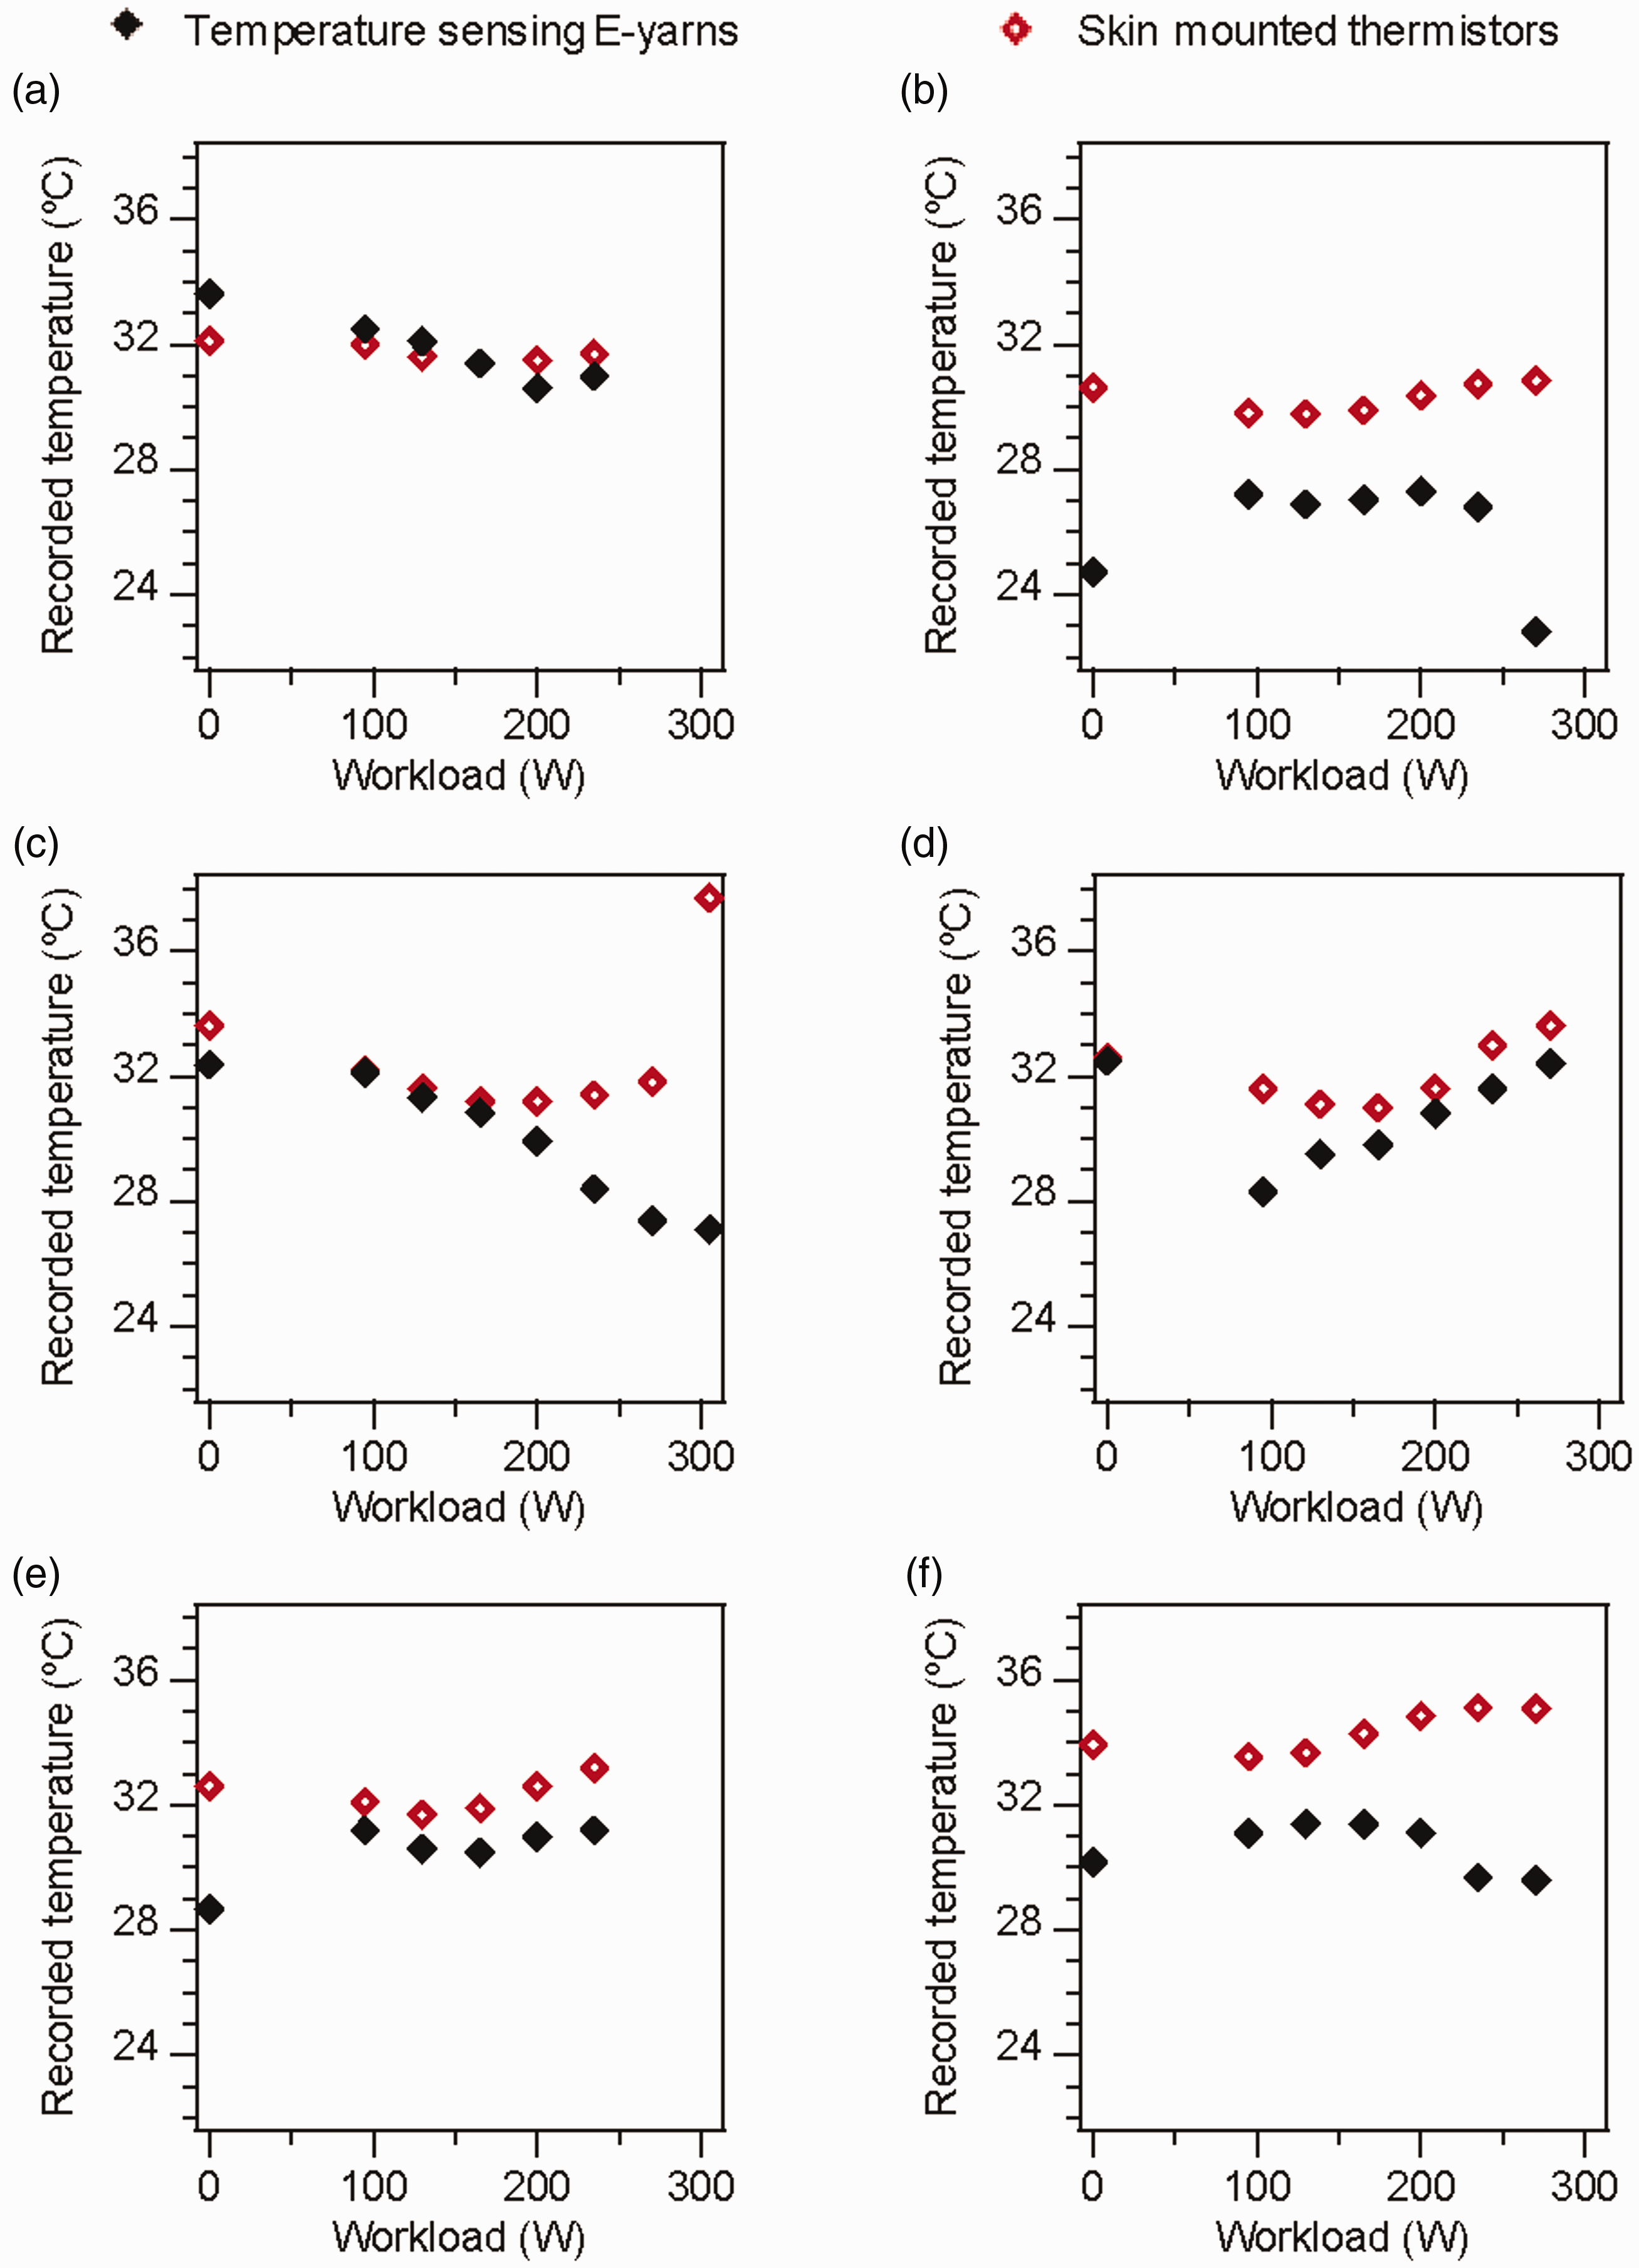
Figure 15(a) shows a very close agreement between the two temperature-sensing modalities. The reason for the difference in the recorded temperatures for Figures 15(b)–(f) was not clear. As the temperature-sensing E-yarn readings did not exceed the expected skin temperature, it was believed that the build-up of sweat did not influence the results in any of these cases.
Testing temperature-sensing E-yarns in saline solution
To better understand the potential effect of sweat on the functionality of the temperature-sensing E-yarns, two sets of four temperature-sensing E-yarns were submerged into a saline bath. The second set of four E-yarns were produced using a different, electrically insulated, wire. Temperatures were recorded for both sets of temperature-sensing E-yarns at different salt concentrations (Figure 16).
Temperature-sensing electronic yarns (E-yarns) measured in salt (NaCl) water solutions with different salt concentrations. The solutions were held at 24℃. (a) Measurements from temperature-sensing E-yarns made using non-insulated (open circles) and insulated (filled squares) copper wire interconnections. (b) The measurement difference between the temperature-sensing E-yarns made with insulated wires and a calibration thermistor (342 mmol/L concentration excluded for clarity). All of the results shown are the average of the readings from four E-yarns, with the error bars showing the standard deviation.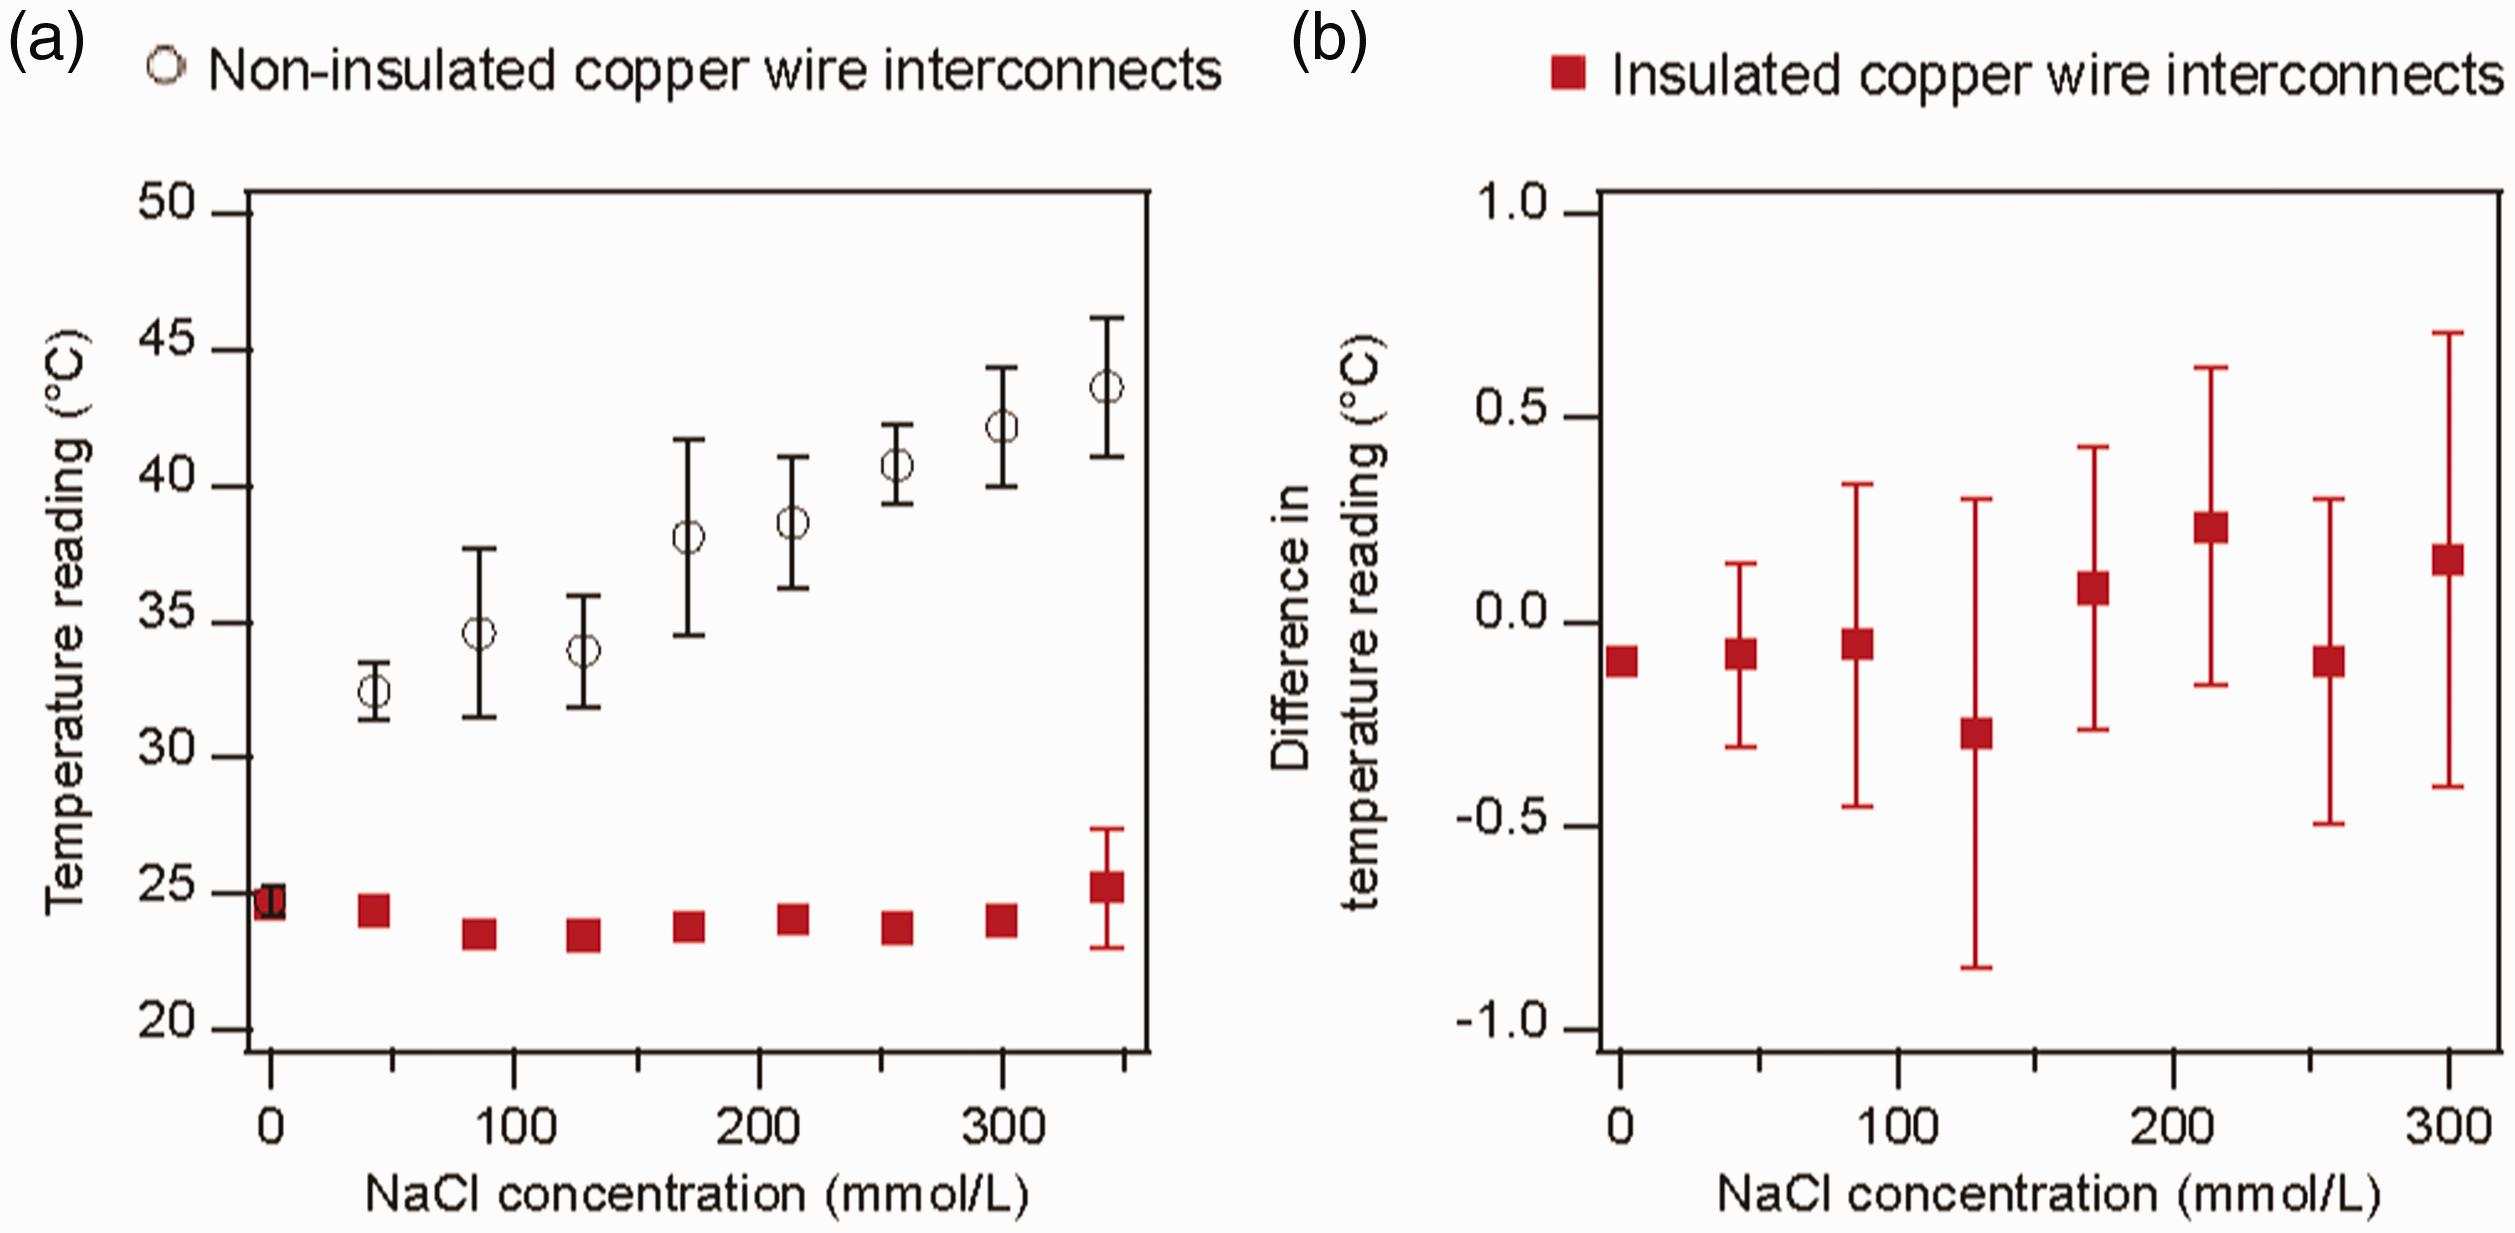
Figure 16(a) demonstrates that the apparent temperature readings increased with sodium concentration for the temperature-sensing E-yarns constructed without insulated copper wire interconnects. Conversely, the temperature-sensing E-yarns constructed using insulated copper wire maintained a stable temperature reading at each of the different concentrations of sodium investigated, with the exception of 342 mmol/L of NaCl. For the 342 mmol/L NaCl solution, a slight increase in the apparent temperature was observed; however, this was only seen for one E-yarn (28.5℃). It was possible that the wire insulation on this E-yarn was slightly damaged, leading to a change in the recorded resistance at the highest NaCl concentration. It should be noted that a NaCl concentration of 342 mmol/L is supraphysiological 31 and is therefore not physiologically relevant.
Figure 16(b) shows the difference between the temperature readings from the temperature-sensing E-yarns made with insulated wires and a calibration thermistor (the 342 mmol/L data point was excluded for clarity due to its relatively large error bars). The readings between the two sensors showed minimal deviation for the different NaCl solutions explored. Ultimately, this proved that a key cause of the difference in the temperature readings between the temperature-sensing E-yarns and the skin-mounted thermistors at high workloads was due to the build-up of sweat (and associated NaCl molecules within the sweat).
Discussion
The purpose of this project was to understand the viability of using temperature-sensing E-yarns to measure skin temperature for sports applications. This extensive study has identified four key considerations for employing E-yarns for this type of on-body measurement: the durability of the E-yarns and associated hardware; the accuracy of the Tsk measurements; the contact between the E-yarns and skin; and the effect of sweat on the E-yarn readings.
Breakages in the E-yarns and the supporting hardware led to a smaller dataset being collected than desired. The connectors used to attach the temperature-sensing E-yarns to the hardware module were the most frequent point-of-failure. The durability of both the E-yarns and connections should be improved for future studies. Despite this, a significant amount of data was still collected, allowing for an analysis of the fidelity of the E-yarns for this application to be conducted.
The accuracy of the temperature-sensing E-yarns for on-body measurements also requires refinement. Over the physiologically relevant range of 30–40℃, the temperature-sensing E-yarns were observed to agree with one another within 0.6℃ when tested in isolation on a hotplate. This already added a limitation to using the E-yarns for this application, as the expected change in the recorded Tsk would be less than 1℃ in some cases. 32 However, it should be noted that the highest temperature change recorded by the skin-mounted thermistors was 6.5℃ in this study, and thus within the reliable range of detection for the E-yarns.
The magnitude of the average difference in the absolute temperature measurements was 2.1℃ for participants at rest, with the difference in the measurements ranging between –3.1℃ and 5.9℃. The intrinsic accuracy of the thermistors at the core of the temperature-sensing E-yarns can only account for some of the observed discrepancy. Further variance is likely due to poor contact between the suit and skin, or sweat on the participants’ skin.
Only 25 sub-maximal cycling trial datasets could be successfully collected (due to breakages, hardware issues, and the tight deadline to complete the trials), but this still provided adequate data to understand the limitations for taking skin temperature measurements using E-yarns. This will also provide a useful reference to others trying to design and implement temperature-sensing E-textiles for this application. The results from Figures 11–15 (the comparison of the temperature responses of the temperature-sensing E-yarns and skin-mounted thermistors at different workloads) are summarized in Figure 17.
Summary of the on-body temperature measurements taken during cycling trials. This summary is based on the results shown in Figures 11–15. The summary highlights the reasons for the disparity seen between the temperature-sensing electronic yarns and skin-mounted thermistors during sub-maximal cycling trials observed in most of the datasets.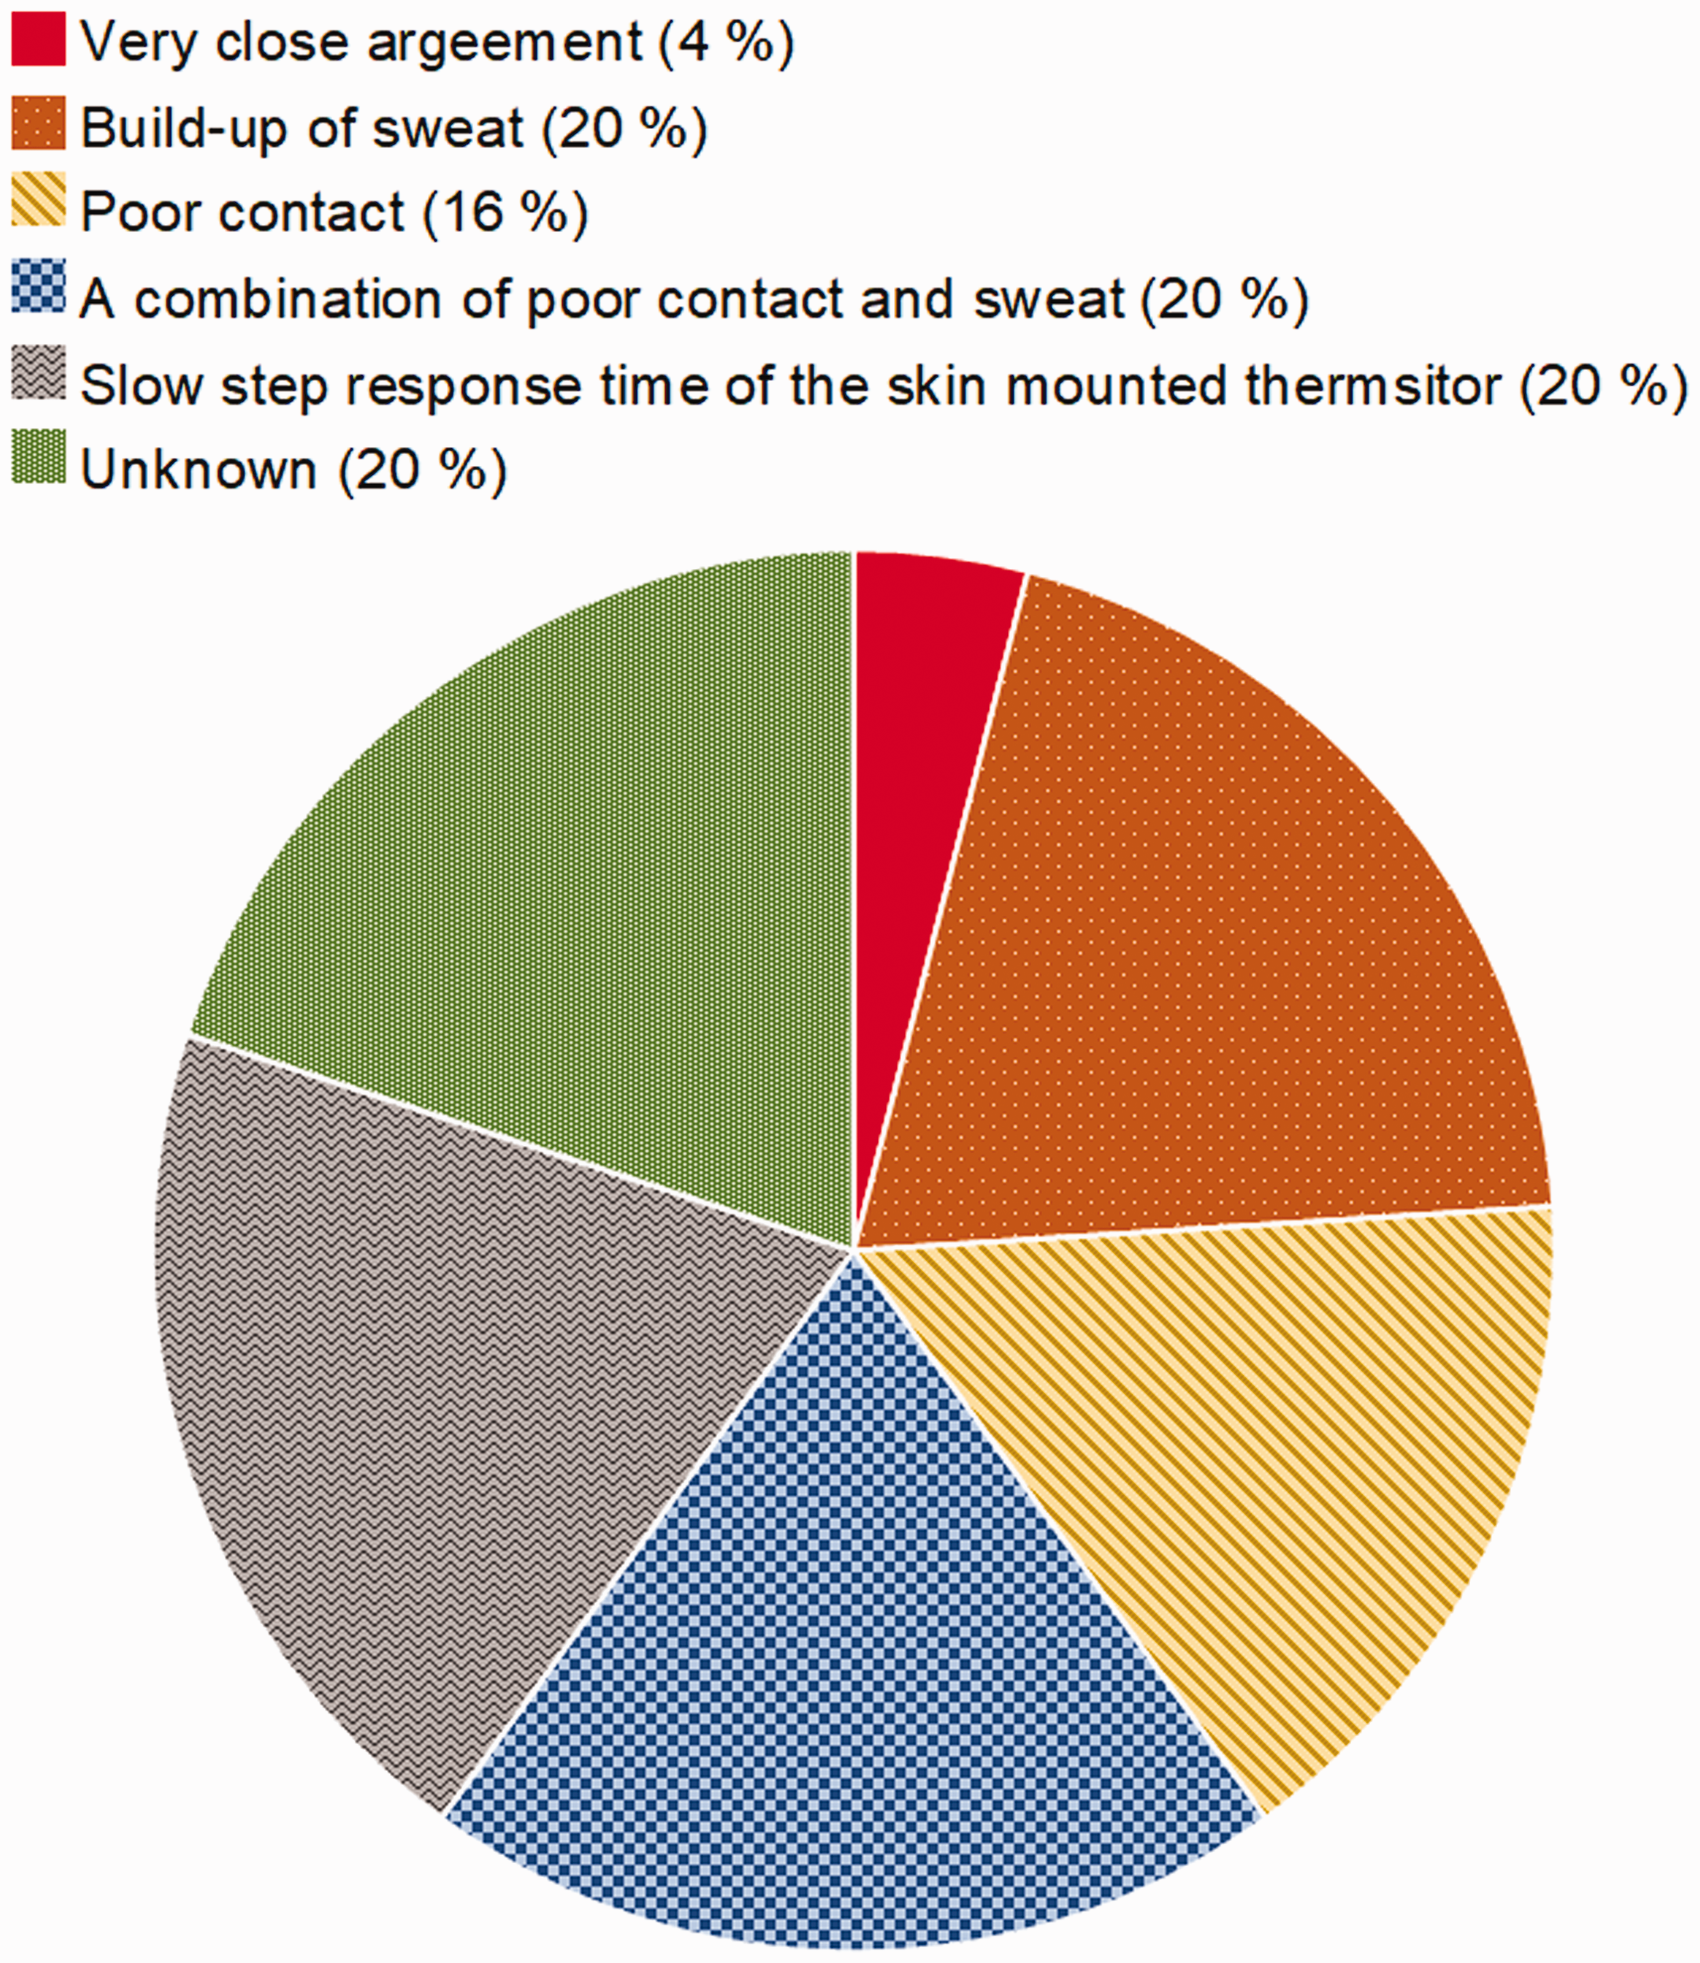
Figure 17 summarizes the on-body temperature measurements during cycling trials presented in Figures 11–15. The summary highlights the key conclusions reached when comparing the two sensing modalities. Percentages were calculated based on the number of datasets where a behavior was identified. For example, only one of the 25 datasets showed a close agreement between the sensors (Figure 15(a)), hence 4%.
The build-up of sweat was identified as the main cause of the difference between measurements for 20% of the datasets. In addition, the build-up of sweat and poor contact between the E-yarns and skin was identified as the reason for the measurement error for another 20% of the datasets. This means that the build-up of sweat played a role in affecting measurements for 40% of the datasets taken. The extremely high temperatures recorded by some of the temperature-sensing E-yarns could only be explained by the resistance in the E-yarns dropping (as NTC thermistors were used) in the presence of sweat during exercise. E-yarns were tested in various saline solutions, showing that the solutions lead to an increase in the recorded temperature, explaining the extremely high Tsk readings observed in some cases (i.e. the 49.4℃ recorded using a temperature-sensing E-yarn in Figure 12(e)).
Poor contact alone caused measurement differences in 16% of the datasets. A combination of a build-up of sweat and poor contact between the E-yarns and skin was identified as leading to measurement differences in an additional 20% of measurements, resulting in at least 36% of the datasets being affected by poor contact between the suit and skin. It is probable that poor or inconsistent contact between the E-yarns and skin may have led to the differences in the measurements reported in Figures 15(b)–(f) (20% of the datasets), but this cannot be stated conclusively.
Finally, 20% of the datasets showed the expected skin temperature behavior (a drop followed by an increase), with the temperature-sensing E-yarns recording a greater drop in Tsk, but otherwise good agreement with the skin-mounted thermistors. This was possibly due to the long step-response time of the skin-mounted thermistors.
Conclusion
Temperature-sensing E-yarns were used to take Tsk measurements of athletes at six discrete sites at rest and during sub-maximal cycling trials. While Tsk could be successfully recorded on the body, these extensive user trials have highlighted some boundary conditions for using the technology, namely durability, accuracy, contact, and susceptibility to sweat.
It has been shown that constructing the temperature-sensing E-yarns with insulated copper interconnections stops saline solutions from affecting the E-yarns. In this study, the E-yarn Tsk readings from 40% of the sub-maximal cycling trial datasets were affected by sweat. Therefore, future garments created with E-yarns for on-body measurements need to be made with insulated copper wire interconnections.
Another cause of measurement error was due to poor contact between the E-yarns and the skin, as the E-yarns can move relative to the body. This affected 36% of the sub-maximal cycling trial datasets. Recording the pressure between the E-yarns and the skin would provide a good indication of the degree of contact throughout the experiments, as no pressure would be recorded if contact between the suit and skin was broken. The contact pressure is also known to have an influence on the temperature-sensing E-yarn measurements (as shown in the literature 23 ). In future work pressure should be recorded at different locations on the body and correlated with temperature readings.
Ultimately this work has highlighted important limitations for using E-textiles to take point measurements of the skin. Future development of the temperature-sensing E-yarns should focus on improving the durability of the electrical components, with particular focus on the conducting elements and associated hardware module.
Footnotes
Acknowledgements
The authors would like to thank Carlos Oliveira, Ioannis Anastasopoulos, Mohamad Nour Nashed, and Dorothy Hardy for fabricating some of the electronic yarns used in this study. The authors would also like to thank Huub Design for supplying the cycling suits used in this study.
Declaration of conflicting interests
The authors received no financial support for the research, authorship, and/or publication of this article.
Funding
The authors disclosed receipt of the following financial support for the research, authorship, and/or publication of this article: This work was supported by the Engineering and Physical Sciences Research Council (Grant no. EP/M015149/1 as a partnership project entitled “The use of advanced textiles for measurement of body temperature changes during exercise”).