
Abstract
Given the mixed evidence on the role of school-level factors in contributing to racial inequality in exclusionary discipline, there is a need to revisit how the demographic composition of schools relates to the prevalence of and disparities in disciplinary outcomes. In this study, we extend the racial threat theoretical framework by illustrating the associations between racial composition and changes in the racial composition of schools and school-level disciplinary outcomes, such as rates of and disparities in office discipline referrals (ODRs) and suspensions, and student-level disciplinary outcomes, such as the likelihood of receiving an ODR and suspensions in New York City Public Schools. Similar to most prior studies, the findings indicate a significant association between the proportion of Black students in a school and overall suspensions and ODRs at both the school and student levels. At the school level, racial change in all other student groups except Black students is not significantly related to disciplinary outcomes. Our findings illustrate that a change in the percentage of Black students at a school is associated with an increased likelihood of receiving an ODR and suspension. Racial threat may be more pronounced in predominantly White schools compared to majority Black schools. The findings suggest that school climate, educator ethno-racial diversity, and principal experience moderate the relationship for school racial composition, with suggestive but inconsistent evidence for racial change. The results provide empirical evidence of anti-blackness in school discipline and support investments in school climate and educator diversity to disrupt discipline disparities.
Keywords
School discipline is a salient issue in education and social policy. Black students, male students, low-income students, and students with disabilities disproportionately experience exclusionary discipline (Rodriguez and Welsh 2022; Welsh 2019, 2022; Welsh and Little 2018b; Welsh and Rodriguez 2024). In 2017–2018, Black students represented 15.1 percent of total K–12 enrollment, yet they represented 38.8 percent of expulsions, 38.2 percent of students who received one or more out-of-school suspensions (OSSs), and 31.4 percent of students who received one or more in-school suspensions (ISSs; U.S. Department of Education Office for Civil Rights 2021). Black students are also more likely to be referred to the office, suspended multiple times during a school year, and receive harsher punishment for similar infractions (Lewis and Diamond 2015; Little and Welsh 2022; Liu, Hayes, and Gershenson 2022; Owens 2022; Owens and McLanahan 2020; Sobti and Welsh 2023; Welsh 2024a). Prior studies have linked suspensions to adverse outcomes, such as worse achievement and involvement in the juvenile justice system, adult incarceration, and health, social, and economic outcomes in adulthood (Bacher-Hicks, Billings, and Deming 2019; Davison et al. 2022; Hemez, Brent, and Mowen 2020; Welsh and Little 2018a). School discipline reforms, such as policy changes prohibiting the use of suspensions or programmatic changes such as implementing positive behavioral interventions and supports (PBIS) or restorative justice (RJ), have had mixed results: Although the overall use of exclusionary discipline has declined in recent years, racial disparities in disciplinary outcomes have persisted across U.S. districts (Cruz, Firestone, and Rodl 2021; U.S. Department of Education Office for Civil Rights 2021; Welsh 2023b; Welsh and Little 2018b; Welsh, Rodriguez, and Joseph 2023).
Studies on the contributors to racial inequality in suspensions highlight the importance of school-level variables (Skiba et al. 2014; Welsh 2023a, 2024a; Welsh et al. 2023, 2024). Researchers have posited that improving school climate is essential to disrupting discipline disparities (Gage et al. 2016; Rodriguez and Welsh 2024; Rodriguez, Welsh, and Daniels 2024; Skiba et al. 2014; U.S. Department of Justice and U.S. Department of Education 2014; Welsh et al. 2023, 2024), and a growing number of studies highlight the importance of teacher diversity (Hughes et al. 2020; Lindsay and Hart 2017; Rodriguez et al. 2024; Shirrell, Bristol, and Britton 2023). Still, further research is needed to examine the school-level mechanisms that may explain racial inequality in school discipline (Edwards 2016).
Scholars and policymakers need a richer understanding of schools’ racial/ethnic composition and disciplinary practices (Martinez, McMahon, and Treger 2016; Roch and Edwards 2017; Welch and Payne 2018). Districts nationwide are undergoing demographic changes (Nguyen et al. 2019; Welsh and Swain 2020), yet little is known about the extent to which minority threat is present in Black, Latinx, Asian, and mixed-race school contexts in urban districts. Prior to COVID-19 (2012–2019), the racial composition of U.S. public schools was changing, with an increasing proportion of Latinx students (rising from 24.3 percent to 27.7 percent), Asian students (4.8 percent to 5.3 percent), and multirace students (2.6 percent to 4.3 percent) and declining proportions of Black (falling from 15.7 percent to 15.0 percent) and White (51.0 percent to 46.4 percent) students (National Center for Education Statistics 2022). In New York City Public Schools (NYCPS)—which are considerably more racially diverse than the national average—the trend was slightly different over the same period, with a substantial decline in the proportion of Black students (28.3 percent in 2012 to 25.5 percent in 2019) and an increase in Latinx (40.2 percent to 40.6 percent), Asian (15.3 percent to 16.2 percent), multirace (1.7 percent to 2.7 percent), and White (14.5 percent to 15.1 percent) students. Prior work suggests that as the proportion of students of color increases, social control via exclusionary discipline practices may also increase (Lee 2023; Welch and Payne 2010, 2018). Research on the association between student racial composition and school discipline has largely been limited to national representative samples and cross-sectional data, focused separately on Black and Latinx students; studies looking at other minoritized students, such as Asian and mixed-race students, are needed (Edwards 2016; Kirk 2009; Martinez et al. 2016; Welch and Payne 2010, 2018). The relationship between the changing demographics of schools (not solely the demographic composition) and exclusionary discipline may be moderated by malleable school factors, such as school climate and the diversity of school personnel. Yet the potential moderating influence of school contextual factors on racial threat as operationalized by demographic change has been largely overlooked.
In this study, we investigate the association between schools’ racial/ethnic composition and school- and student-level disciplinary outcomes in NYCPS using modeling approaches that leverage variation across and within schools over time. We examine how school contextual factors that prior work shows to be associated with school discipline—school achievement (Skiba et al. 2014), school attendance (Skiba et al. 2014; Welsh 2018), school climate (Gage et al. 2016; Welsh et al. 2023, 2024), and the ethno-racial diversity of school personnel (Hughes et al. 2020; Lindsay and Hart 2017; Rodriguez et al. 2024; Shirrell et al. 2023)—moderate the relationship between ethno-racial student makeup in schools and disciplinary outcomes. The study is guided by three sets of research questions.
Research Questions
Demographic Composition
Research Question 1 (RQ1): To what extent is the ethno-racial composition of students within schools associated with (a) the prevalence of and disparities in office discipline referrals (ODRs) and suspensions and (b) the conversion rate of ODRs to suspensions and racial disparities in the conversion rate?
Research Question 2 (RQ2): To what extent is the racial composition of schools associated with the likelihood of receiving ODRs and suspensions, and how does this vary by student race?
Research Question 3 (RQ3): To what extent do school contextual factors, including (a) school-level academic performance, (b) school-level attendance, (c) school climate, and (d) the racial/ethnic composition and experience of teachers and school leaders, moderate how a school’s racial composition shapes the prevalence of and disparities in ODRs and suspensions, and how does this vary by student race?
Demographic Change in Schools
Research Question 4 (RQ4): To what extent is the change in the racial composition of schools associated with (a) prevalence of and disparities in ODRs and suspensions and (b) the conversion rate of ODRs to suspensions and racial disparities in the conversion rate?
Research Question 5 (RQ5): To what extent is the change in racial composition of schools associated with the likelihood of receiving ODRs and suspensions, and how does this vary by student race?
Research Question 6 (RQ6): To what extent do school contextual factors, including (a) school-level academic performance, (b) school-level attendance, (c) school climate, and (d) the racial/ethnic composition and experience of teachers and school leaders, moderate how a change in a school’s racial composition shapes the prevalence of and disparities in ODRs and suspensions, and how does this vary by student race?
Demographic Composition and Change in Predominantly Black, White, and Latinx Schools
Research Question 7 (RQ7): To what extent do these patterns in racial composition and racial change vary across schools that are majority Black, majority Latinx, and majority White?
Our study responds to “the need to further analyze and refine analyses of the relationship between race and school discipline” (Nguyen et al. 2019:1976). As educational stakeholders search for effective ways to reduce racial disparities in exclusionary discipline, we need a more granular understanding of how school environments affect students’ disciplinary outcomes. By using rich longitudinal data from an urban district with attention to the site’s ethno-racial and socioeconomic diversity (Milner 2012; Welsh and Swain 2020), distinguishing between racial change and racial composition, and investigating interrelated disciplinary outcomes at the school and student levels across several student groups, this study makes theoretical and empirical contributions. Theoretically, we add to the conversation on how to use racial threat theory in empirical work and the theoretical understanding of racial threat. The results provide insights on if and how the operationalization of racial threat matters and the importance of careful interpretation of models with fixed effects to disentangle demographic composition at a point in time and increasing diversity in schools. Empirically, the study adds to a richer understanding of how racial and minority threat influences disciplinary practices in urban schools. The findings provide insights on the relationship between school racial composition and social control in schools and whether and how school contextual factors influence the association between a school’s racial composition and students’ disciplinary outcomes.
Racial Threat, Social Control, and Students’ Disciplinary Outcomes
In this study, we use racial threat theory to investigate the relationship between school racial composition and disciplinary outcomes. The framework links the demographic composition of schools to measures of social control (ODRs, suspensions). Minority threat theory (also known as racial threat) posits that a growing proportion of people of color threatens the racial and economic dominance of White people and will be accompanied by higher levels of social control (Lee 2023; Welch and Payne 2010, 2018). Thus, there will be more punitive social control policies and practices, in the form of exclusionary discipline, as the proportion of Black and Latinx students grows in schools (Lee 2023; Lewis and Diamond 2015; Sobti and Welsh 2023). Although minority threat theory is predicated on the expansion of social control in response to the relative size of the minority population and increase in the proportion of students of color over time, it is typically operationalized using the absolute measure of school racial composition (Welch and Payne 2010, 2018). Similar to prior studies, we use the racial composition of schools (percentage Black, percentage Latinx, percentage Asian, percentage other race) to operationalize racial threat. Our analyses also consider the change in racial composition of schools over time. Applying the systems view of school climate (SVSC; Rudasill et al. 2018), we situate the demographic composition of schools as a key component of school context and probe the premise that the prevalence of exclusionary discipline and racial disparities in students’ disciplinary outcomes are the product of social control in schools that is linked to demographic composition.
Cruz and Firestone (2024:5) characterize “schools as sites of surveillance and social control.” Social processes and social ties in schools produce social control (Kirk 2009). Kirk (2009:482) defines social control as “a general process by which youth behavior and behavioral outcomes are regulated, but multiple pathways (i.e., mechanisms) exist by which social control may be achieved across contexts and even within the same context.” Prior work highlights the role of school discipline policies and practices in creating social control (Irby 2014; Welch and Payne 2010, 2018). Irby (2014:516) characterizes school discipline systems as nets of social control, or “a space and web of relationships where the enforcement machinery of school discipline coalesces to give values symbolic and material meaning.” School personnel are key cogs in this enforcement machinery. As such, examining the moderating influence of the diversity of school personnel is critical to a granular understanding of racial threat “because social control is imposed by adults with the authority to do so” (Welch and Payne 2018:93; for additional discussion of the application of racial threat theory to race and punishment in schools, see supplemental material).
School Racial Composition, ODRs, and Suspensions
Consistent with the racial threat hypothesis, studies have found that the proportion of Black students in schools is associated with higher ODR and suspension rates (Anyon et al. 2014; Edwards 2016; Peguero and Shekarkhar 2011; Roch and Edwards 2017; Rocque and Paternoster 2011; Skiba et al. 2014; Welch and Payne 2010). Yet Rocque and Paternoster (2011) found that as the percentage of Black students increased, the ODR rate increased but only up to a certain threshold, after which it began to decline; they attribute this to the “benign neglect” hypothesis, which posits that White authorities disproportionately focus on minorities when the percentage of minorities increases, but after a certain point, the harshness of teachers’ responses to misbehavior declines as minorities begin to victimize each other. Recent studies have found inconsistent and mixed results regarding the contribution of the percentage of Black students to discipline rates and disparities (Gregory et al. 2018; Huang and Cornell 2018; Skiba et al. 2014).
Less attention has been paid to the percentage of Latinx students in schools, and these results are inconsistent and mixed. Some studies find evidence of a positive relationship between the proportion of Latinx students in a school and students’ disciplinary outcomes (Anyon et al. 2014; Welch and Payne 2018), whereas other work finds a negative relationship (Ramey 2015). The mixed results on the disciplinary experiences and outcomes of Latinx students warrant greater attention to how Latinx students are disciplined in schools (Anyon et al. 2014; Ramey 2015; Rodriguez and Welsh 2022; Welch and Payne 2018; Welsh 2022; Welsh and Little 2018b). Similarly, the percentage of Asian students in a school and their disciplinary experiences have also received scant attention (Nguyen et al. 2019; Welch and Payne 2018; for extended discussion of prior studies on school racial composition and school discipline, see the supplemental material).
School Discipline in Predominantly White, Black, and Latinx Schools
A growing number of studies draw attention to the disciplinary experiences of Black students in predominantly White schools versus schools primarily populated by students of color (Edwards 2016; Johnson and Jabbari 2022; Owens 2022; Smith et al. 2023; Wiley 2021). Teachers and school leaders in predominantly Black and Latinx schools may perceive similar behavior and administer discipline differently than in predominantly White schools (Owens 2022; Wiley 2021). Owens (2022) found that teachers perceived Black and Latinx boys as more blameworthy for identical behavior compared to White boys, and teachers saw boys of all races as being more blameworthy for identical misbehavior in schools with large proportions of Black and Latinx students compared to schools with predominantly White students.
Smith et al. (2023) found that students in majority Black schools had the highest rates of suspension, followed by students in majority White schools, with the lowest rates in majority Latinx schools. But Black students in majority White schools had higher risk of suspension than did Black students in majority Black or racially diverse schools, with racial discipline disparities being highest in majority White schools. Johnson and Jabbari (2022) used a longitudinal national data set to investigate the experiences of Black students who were suspended in majority White schools, finding that Black students suspended in schools with low White enrollment had math test scores similar to nonsuspended Black students, but they had lower math scores in schools with more White student enrollment (for extended discussion of school discipline in predominantly White, Black, and Latinx schools, see the supplemental material).
This study tests hypotheses on racial threat in urban school districts via (a) the prevalence and disparities of ODRs and suspension (using school-level metrics) and (b) the likelihood of receiving an ODR or being suspended (using student-level data and outcomes). Most prior studies examining the relationship between school racial composition and school discipline use cross-sectional data, and only one prior study uses longitudinal data (school level, not student level; Roch and Edwards 2017). Longitudinal data enable us to examine how both school racial composition and changes in school racial composition over time shape disciplinary outcomes. In particular, models with racial composition variables allow us to examine differences across schools in the concentration of students of color (RQs 1–3), and we use models that include change in racial composition variables to address questions regarding differences within schools in the concentration of students of color over time (RQs 4–6). In these latter models, we focus on changes in racial threat within the same school environment over time; we thus have greater confidence that the estimated relationships are not based on systematic differences across schools.
Relatively little work has examined the potential school-level moderators of racial threat; prior studies have focused on school crime, school economic disadvantage, and teacher-student ratios (Martinez et al. 2016; Welch and Payne 2010, 2018). We examine four key factors related to the climate and context of schools: (1) school-level academic performance, (2) school-level attendance, (3) school climate, and (4) the racial/ethnic composition and experience of teachers and school leaders. Welch and Payne (2018:103) note that “more nuanced examination of each type of disciplinary response could be useful”; by focusing on both ODRs and suspensions, our study provides insights into how demographic composition may be associated with the various interrelated dimensions of school discipline (Rodriguez and Welsh 2022; Welsh et al. 2023, 2024). We also examine a range of student characteristics and explore intersectionality in racial threat and school discipline. Intersectionality is pivotal to understanding discipline disparities (Haight, Kayama, and Gibson 2016; Legette and Anyon 2023; Welsh 2022, 2024b; Welsh and Sobti 2023), and research needs to capture the racialized and gendered identities that may trigger social control in different ways in a school (Legette and Anyon 2023).
Data and Methods
This study uses three longitudinal data sources provided by the NYCPS system for all public middle and high schools spanning 2011–2012 to 2018–2019: (1) student-level administrative records, (2) school-level administrative records, and (3) student responses to the annually administered NYC School Survey. Table S5 in the supplemental material provides summary descriptives for the analytic sample, which comprises 1,167,306 unique students (3,988,302 student-years) enrolled across 1,832 unique schools (7,685 school-years).
Student-Level Administrative Data
Student-level administrative data capture background and demographic information on all students in NYCPS, including their school assignment, grade level, racial and ethnic background, gender, socioeconomic status (SES), eligibility for special education (SPED) services, English proficiency, and temporary housing status. These data also provide students’ discipline records, including infraction-level information that resulted in an ODR. The severity of infractions range across five levels: Level 1, uncooperative/noncompliant behavior; Level 2, disorderly behavior; Level 3, disruptive behavior; Level 4, aggressive or injurious/harmful behavior; and Level 5, seriously dangerous or nonviolent behavior. Discipline records indicate whether a particular infraction led to a suspension. We report results from the combined total suspensions, with the disaggregated results by level of infraction reported in Table S8 in the supplemental material (for further details on the relationship between suspensions and infractions and the type of suspensions, see the supplemental material). We report results from the combined total suspensions given that the overwhelming majority comprise principal suspensions (73 percent to 81 percent within a given school year), with the disaggregated results reported in Table S9 in the supplemental material.
School-Level Administrative Data
School-level records include disciplinary information aggregated to the school level to capture the prevalence, disproportionality, and disparity in exclusionary discipline for each school in a given year. As a measure of prevalence of discipline, the discipline rate represents the proportion of students within a school year who experienced exclusionary discipline in the form of receiving an ODR or suspension. Disproportionality is represented by the discipline risk index (Girvan, McIntosh, and Smolkowski 2019; Rodriguez and Welsh 2022), which measures the proportion of students from a target racial or ethnic group (e.g., Black, Latinx) who experienced a type of exclusionary disciplinary action (number of students in target group disciplined / number of students in target group). Table S10 in the supplemental material displays the disproportionality results for each racial group. The Absolute Risk Difference (ARD) operationalizes disciplinary disparity in terms of the difference in risk indices of a target group and a reference group, with the reference group here being White students (Rodriguez and Welsh 2022). We also consider the conversion rates (the proportion of ODRs that result in suspensions, that is, the number of suspensions divided by the number of ODRs in a school) and racial disparities (ARDs) in the conversion rates (Rodriguez and Welsh 2022; Welsh and Rodriguez 2024). A description of each dependent variable is shown in Table S6 in the supplemental material.
School administrative records also provide a range of school characteristics, including grade configuration; student enrollment size and student-teacher ratios; the demographic composition of students served—race/ethnicity, SPED status, SES, temporary housing status, and English language proficiency; and measures of school performance—average attendance, graduation rates, percentage proficient in English language arts (ELA), and mathematics exams. For this study, we are especially interested in school racial composition, operationalized as the percentage of students of specific racial/ethnic backgrounds (i.e., Black, Latinx, Asian, or other race) within the school (Figure S1 in the supplemental material shows the change in average school racial composition over the study period). Between 2012 and 2019, there was a slight upward trend in percentage Latinx, percentage Asian, and percentage other race and a clear decline in percentage Black (see Panel A of Figure S1 in the supplemental material). On average, percentage Latinx, percentage Asian, and percentage other race all increased marginally (less than 0.5 percent) in most years, and percentage Black declined marginally (less than 1 percent), as shown in Figure S1, Panel B in the supplemental material. Regarding the absolute change in racial composition in schools over the period (shown in Figure S1, Panel C in the supplemental material), on average, percentage Black and Latinx changed 1.5 percent to 2.5 percent each year, and percentage Asian and other race changed 0.5 percent to 1 percent each year. This suggests that for each school-level racial composition, a 1 percent change in the percentage of each race is typical, and there is considerable change in racial composition in this sample. Finally, human resources records aggregated to the school level provide demographic and background information for employed teachers, principals, and assistant principals within the school (for further details on school personnel, see the supplemental material).
NYC School Survey and School Climate Measures
The NYC School Survey, which is administered annually to all students throughout the public school system, provides the third data source for the study. The overall student survey completion rate in our sample is approximately 73 percent, ranging from 71 percent to 74 percent across the years 2011–2012 to 2018–2019. The survey is designed to help school leaders better understand their community members’ experiences and diagnose areas to improve their schools’ learning environment.
To reduce the dimensionality of the data, we conduct an exploratory factor analysis for student survey items. Based on visual examination of the scree plot and the Kaiser-Guttman stopping criteria, we retained two factors based on student survey items, representing students’ perceptions of risky student behavior within school and the overall school environment. Higher values of these two factors indicate a better school climate (for more details on survey items, see Table S7 in the supplemental material). These measures were aggregated to the school level to measure overall student perceptions of school climate. The two factors were standardized to have a mean of 0 and standard deviation of 1 within the school-level and student-level analytic samples used for the study.
The risky student behavior measure is based on student responses to four questions about the prevalence of other students’ behavior, using a 1 to 4 scale: the occurrence of (1) harassment, bullying, and intimidation; (2) physical fights; (3) alcohol, illegal drug, and prescription drug abuse; and (4) gang activity. The constructed measure of risky student behavior thus encompasses the extent to which students assess their peers’ behavior as positive.
The overall school environment measure is based on student responses to seven questions about the school environment, also using a 1 to 4 scale: whether (1) students with disabilities are included; (2) the variety of programs and classes maintain student interest; (3) students treat each other with respect; (4) students feel safe in class; (5) students feel safe in halls, bathrooms, and so on; (6) students feel safe around the school; and (7) the school space is clean and orderly. The overall school environment construct thus captures students’ perceptions of safety and order, cultural awareness, and inclusivity. The school environment measure bears some similarity to the overall safety construct used in prior studies that test hypotheses related to the authoritative school climate theory (Huang and Anyon 2020; Huang and Cornell 2018); this provides support for the validity of this construct as a measure of school climate.
Rudasill et al. (2018) argue that conceptual clarity is necessary for school climate construct validity, suggesting that constructs should focus on any or all of the three components of school climate: perceptions of social interactions and relationships within the school, shared beliefs and values in the school, and the sense of safety within the school. Our two school climate constructs are consistent with this framework because our peer student behavior construct measures student perceptions of social interactions and relationships between students (e.g., bullying, fights, drug use, gang activity) and our overall school environment construct measures student perceptions of safety and inclusive relationships between school staff and students.
To assess the reliability of our two constructs, we calculate the scale reliability coefficients for each measure. Both factors have a high scale reliability coefficient (0.78 for risky student behavior and 0.82 for overall school environment), indicating internal consistency of the underlying items.
Analytic Strategy
To explore whether student racial/ethnic composition in middle and high schools is associated with discipline outcomes at the school level (RQ1), we estimate the following regression models:

where
We first run Model 1 with and without school fixed effects to address RQ1. The term of interest is represented by the vector term
The next set of analyses examines the relationship between racial threat within a school and the likelihood of individual students experiencing exclusionary discipline, using student-level data (RQ2). We estimate a logistic regression model of the following form:

where the probability that student i in school s is disciplined during year t is modeled as a function of observable student characteristics and time-variant school characteristics, with standard errors adjusted for clustering at the school-year level. We estimate Equation 2 separately for the two forms of exclusionary discipline: whether a student received an ODR and whether a student received a suspension in a given year. Here, the propensity that student i is disciplined is modeled as a function of student-level characteristics
To explore heterogeneity by school-level academic performance, attendance, climate, and staff racial composition (RQ3), we present exploratory moderation analyses that investigate the interactive effects of a school’s racial composition with school contextual factors. We estimate a modified form of Equation 2 that includes the interaction term of interest between the racial threat measure (operationalized as a school’s racial/ethnic composition) with the series of hypothesized moderators (school-level academic performance, school-level attendance, school climate, and the diversity and experience of teachers and school leaders). These results reveal whether the strength and direction of the racial threat effect significantly differs based on values of the moderating variable. We run these models with and without school fixed effects.
To address RQ4 through RQ6, we conduct the previously described analysis but include a set of change variables for each racial composition category (e.g., Black, Latinx), indicating the percentage change in racial composition compared to the prior year (percentage of students at school belonging to racial group in current year – percentage of students at school belonging to racial group in prior year), while controlling for prior-year racial composition. Reestimating Equation 1 with the inclusion of these change variables allows us to investigate if a change in school-level racial composition is associated with an increase in the use of exclusionary discipline at the school level (RQ4). Similarly, reestimating Equation 2 including a change variable for each racial composition variable allows us to investigate if change in school-level racial composition is associated with an increase in the likelihood of students receiving exclusionary discipline (RQ5). We also conduct moderation analyses by interacting the change variables with the school moderators of interest (RQ6). Finally, we rerun all of the aforementioned models separately for majority Black, majority White, and majority Latinx schools to explore if the results change depending on school racial homogeneity (RQ7).
Results
Racial Threat and Demographic Composition of Schools
Racial composition, prevalence, disparities, and the conversion rate of ODRs to suspensions
Table 1 shows the results for overall ODR, suspension, and ODR-suspension conversion rates with and without school fixed effects (for further model details, see the supplemental material). Without school fixed effects, we find that the percentage of Black students is significantly related to the overall rate of ODR and suspension (a 1 percent increase in Black students at a school is associated with a 0.02 percent increase in the rate of ODR and in the rate of suspension). The percentage of Black students is also related to significantly higher conversion rates. The percentage of Latinx students at a school is also related to higher conversion rates (similar to Black students) but not significantly related to overall ODR or suspension rates. The percentage of Asian students is related to significantly lower ODR and suspension rates. The percentage of other race students is related to significantly higher conversion rates. When we include school fixed effects, the percentage of Black students is significantly related to the overall rate of ODR and suspension (a 1 percent increase in Black students at a school is associated with a 0.07 percent increase in the rate of ODR and a 0.03 percent increase in the rate of suspension). The percentage of Black students is not related to a significantly higher ODR-suspension conversion rate. We do not see a statistically significant relationship with discipline rates for the other groups (Latinx, Asian, and other race).
Regression Estimates Predicting School-Level Prevalence of Exclusionary Discipline.
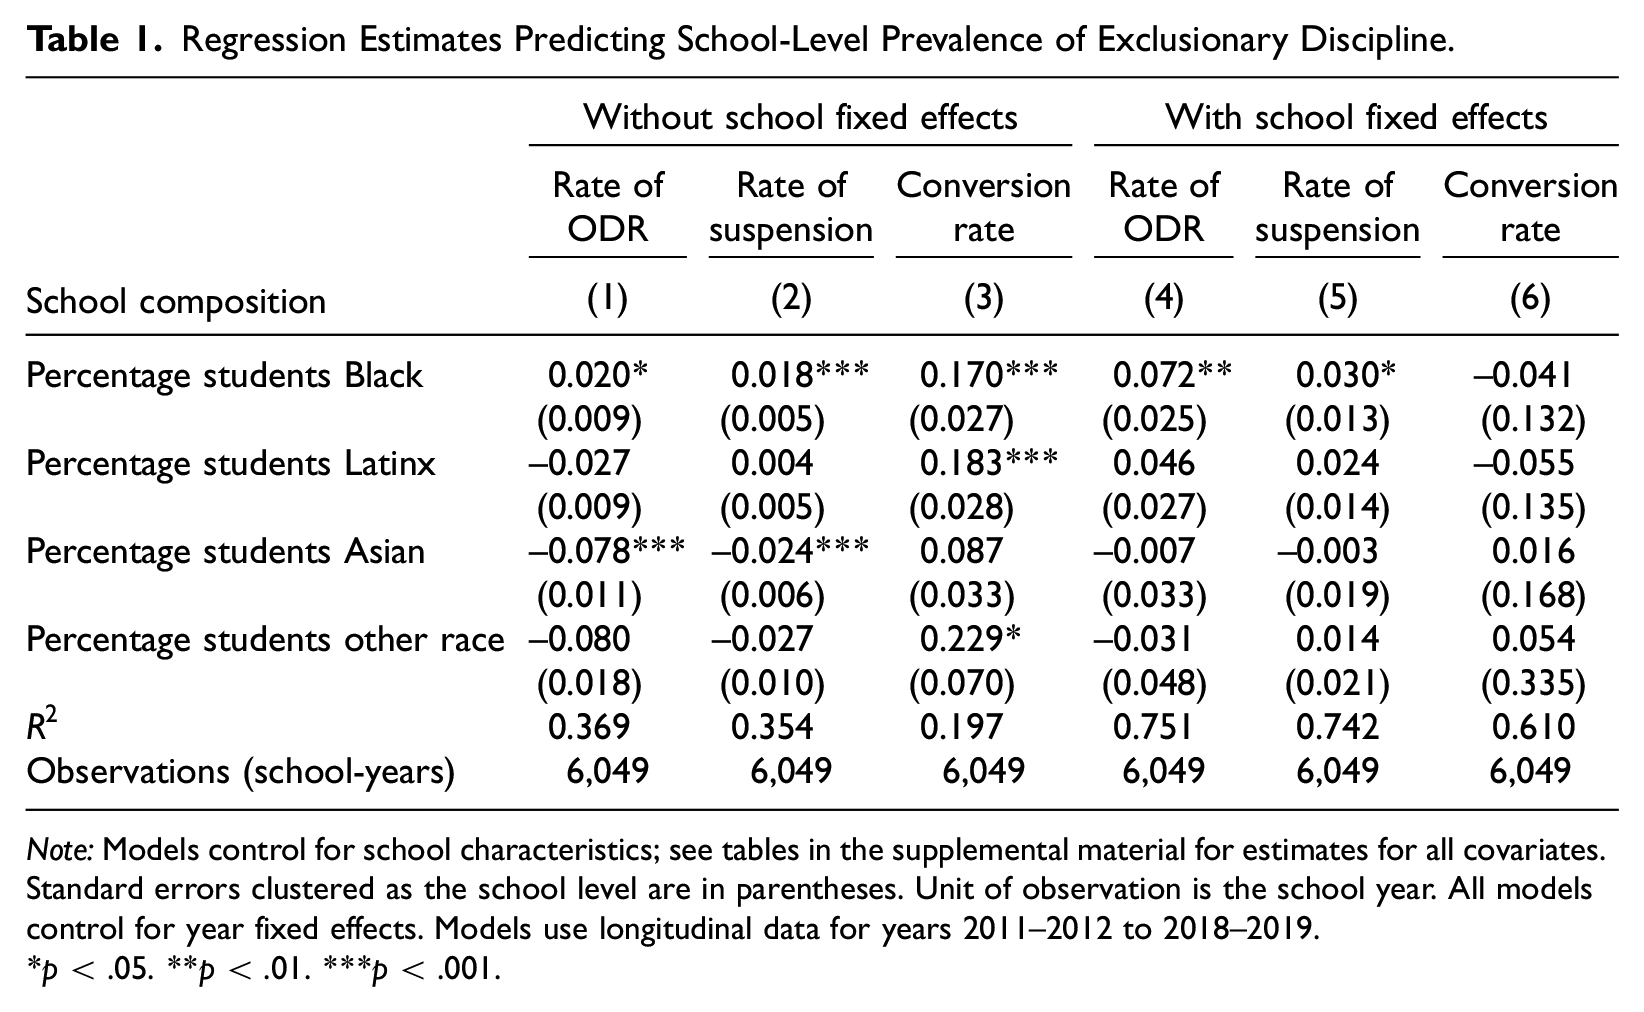
Note: Models control for school characteristics; see tables in the supplemental material for estimates for all covariates. Standard errors clustered as the school level are in parentheses. Unit of observation is the school year. All models control for year fixed effects. Models use longitudinal data for years 2011–2012 to 2018–2019.
p < .05. **p < .01. ***p < .001.
Next, we consider how racial composition relates to Black-White and Latinx-White discipline disparities, shown in Table S11 in the supplemental material. Results for disparities between White and Asian and other race students are shown in Table S12 in the supplemental material. Without school fixed effects, the percentage of Black students in a school is associated with smaller Black-White disparities. A 1 percent increase in Black students is associated with about a 0.08 percent decrease in the ODR ARD and a 0.03 percent decrease in the suspension ARD, but it has no significant relationship with the conversion rate disparity. The percentages of Latinx and other race students are also related to lower Black-White ODR and suspension disparities; however, the percentage of Asian students does not significantly predict Black-White discipline disparities. Notably, although the unstandardized coefficients for the percentage of students of other racial backgrounds are among the largest across all racial groups, the predicted magnitude change is quite small when standardized (standardized coefficients, not shown, are smaller than 0.1). Regarding Latinx-White discipline disparities, we find that the percentage of Latinx students in a school is associated with smaller disparities (a 1 percent increase in Latinx students is associated with about a 0.05 percent decrease in the ODR ARD and a 0.03 percent decrease in the suspension ARD; it has no significant relationship with the conversion rate disparity). The percentages of Black and other race students are also related to smaller Latinx-White ODR and suspension ARDs (but not smaller conversion ARDs). We find a small, significant relationship between the percentage of other race students, Black students, or Latinx students and higher other race-White ODR ARDs (but not higher suspension or conversion ARDs). We find no relationship between school racial composition and Asian-White discipline disparities.
When we rerun our models to include school fixed effects, we find that an increase in the percentage of Black students in a school is associated with smaller Black-White ODR disparities (a 1 percent increase in Black students is associated with about a 0.08 percent decrease in the ODR ARD, but it has no significant relationship with the suspension or conversion rate disparity). An increase in the percentage of Asian students is associated with an increase in the Black-White suspension ARD. The percentage of other race students is also related to lower Black-White ODR disparities. Regarding Latinx-White discipline disparities, we find that the percentage of Latinx students in a school is not associated with disparities. The percentages of Black and other race students are also related to smaller Latinx-White disparities. An increase in Asian students is associated with an increase in the Latinx-White suspension ARD. We find no relationship between the percentage of other race students, Black students, Latinx students, or other race students and other race-White or Asian-White disparities.
Racial composition and the likelihood of receiving ODRs and suspensions
Next, we run logistic regression models at the student level. The results are shown in Table 2 for models with and without school fixed effects in odds ratio format (values above 1 indicate a higher likelihood of receiving ODR or suspension; values below 1 indicate a lower likelihood). Without including school fixed effects, we find that the percentage of students at a school who are Black has a significant positive association with the odds of students receiving an ODR and suspension. A 1 percent increase in students who are Black is associated with a 1.7 percent increase in the odds of ODR and a 2.9 percent increase in the odds of suspension. We see the same significant pattern for the percentage of students at a school who are Latinx (unlike the school-level results where the percentage of Latinx students is insignificant), with a 1 percent increase in students who are Latinx associated with a 0.6 percent and 0.7 percent increase in odds of ODR and suspension, respectively. We do not find any significant relationship at the student level between the percentage of students at a school who are of other racial backgrounds and ODR or suspension. Results show a significant negative relationship between the percentage of Asian students and student likelihood of student ODR (but not suspension), with a 1 percent increase in Asian students within a student’s school associated with 0.6 percent reduced odds of that student receiving an ODR.
Logistic Regression Estimates (Odds Ratios) Predicting Student-Level Likelihood of Receiving Office Discipline Referrals and Suspensions.
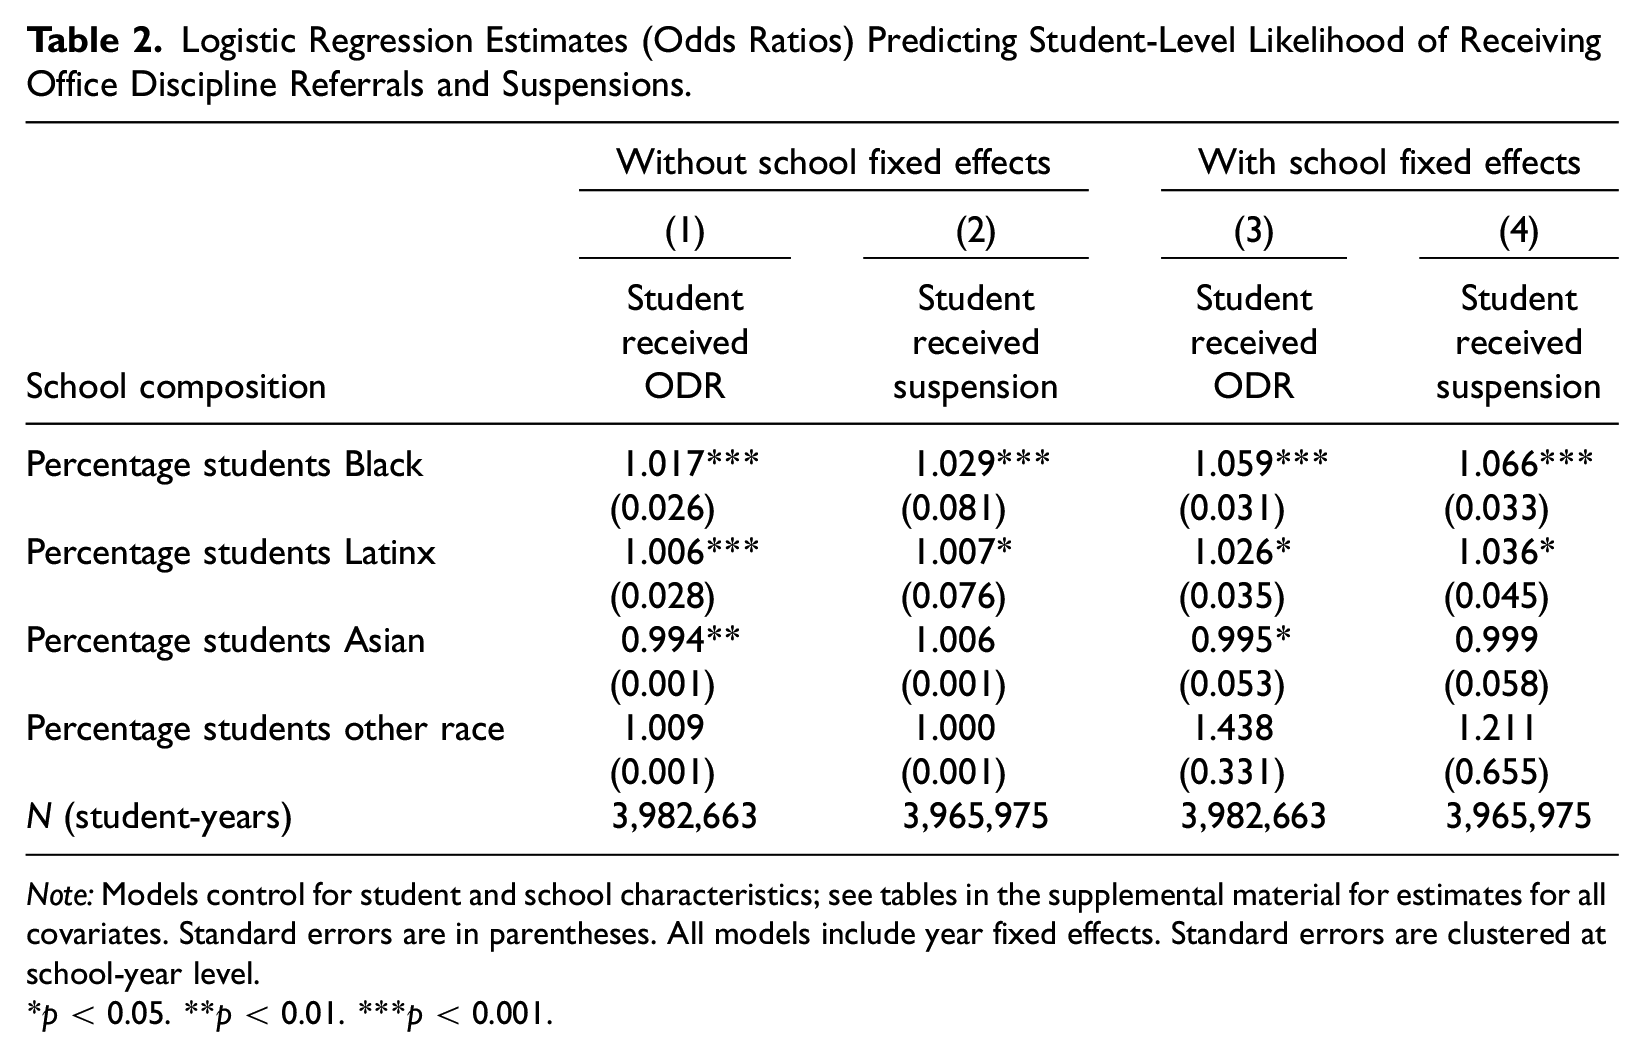
Note: Models control for student and school characteristics; see tables in the supplemental material for estimates for all covariates. Standard errors are in parentheses. All models include year fixed effects. Standard errors are clustered at school-year level.
p < 0.05. **p < 0.01. ***p < 0.001.
With school fixed effects included, the percentage of students at a school who are Black has a larger significant positive association with student risk of ODR and suspension: A 1 percent increase in students who are Black is associated with a 5.9 percent increase in the odds of ODR and a 6.6 percent increase in the odds of suspension. We see a similar pattern for the percentage of students at a school who are Latinx, with a 1 percent increase in Latinx students associated with a 2.6 percent increase in the odds of ODR and a 3.6 percent increase in the odds of suspension. We do not find any significant relationship at the student level between the percentage of students at a school who are of other racial backgrounds and ODR or suspension. Contrary to results for Black and Latinx students, we find a significant negative relationship between the percentage of Asian students and likelihood of ODR (but not suspension), with a 1 percent increase in Asian students associated with a 0.5 percent decrease in the odds of ODR.
Racial composition and school-level moderators
Figure 1 provides evidence that school climate, teacher racial diversity, assistant principal racial diversity, and principal experience moderate how the percentage of Black students in a school shapes the prevalence of and disparities in ODRs and suspensions. We illustrate the models with significant interaction terms and briefly note the moderators that were not statistically significant (we show the regression results with the interactions in Table S13 in the supplemental material).
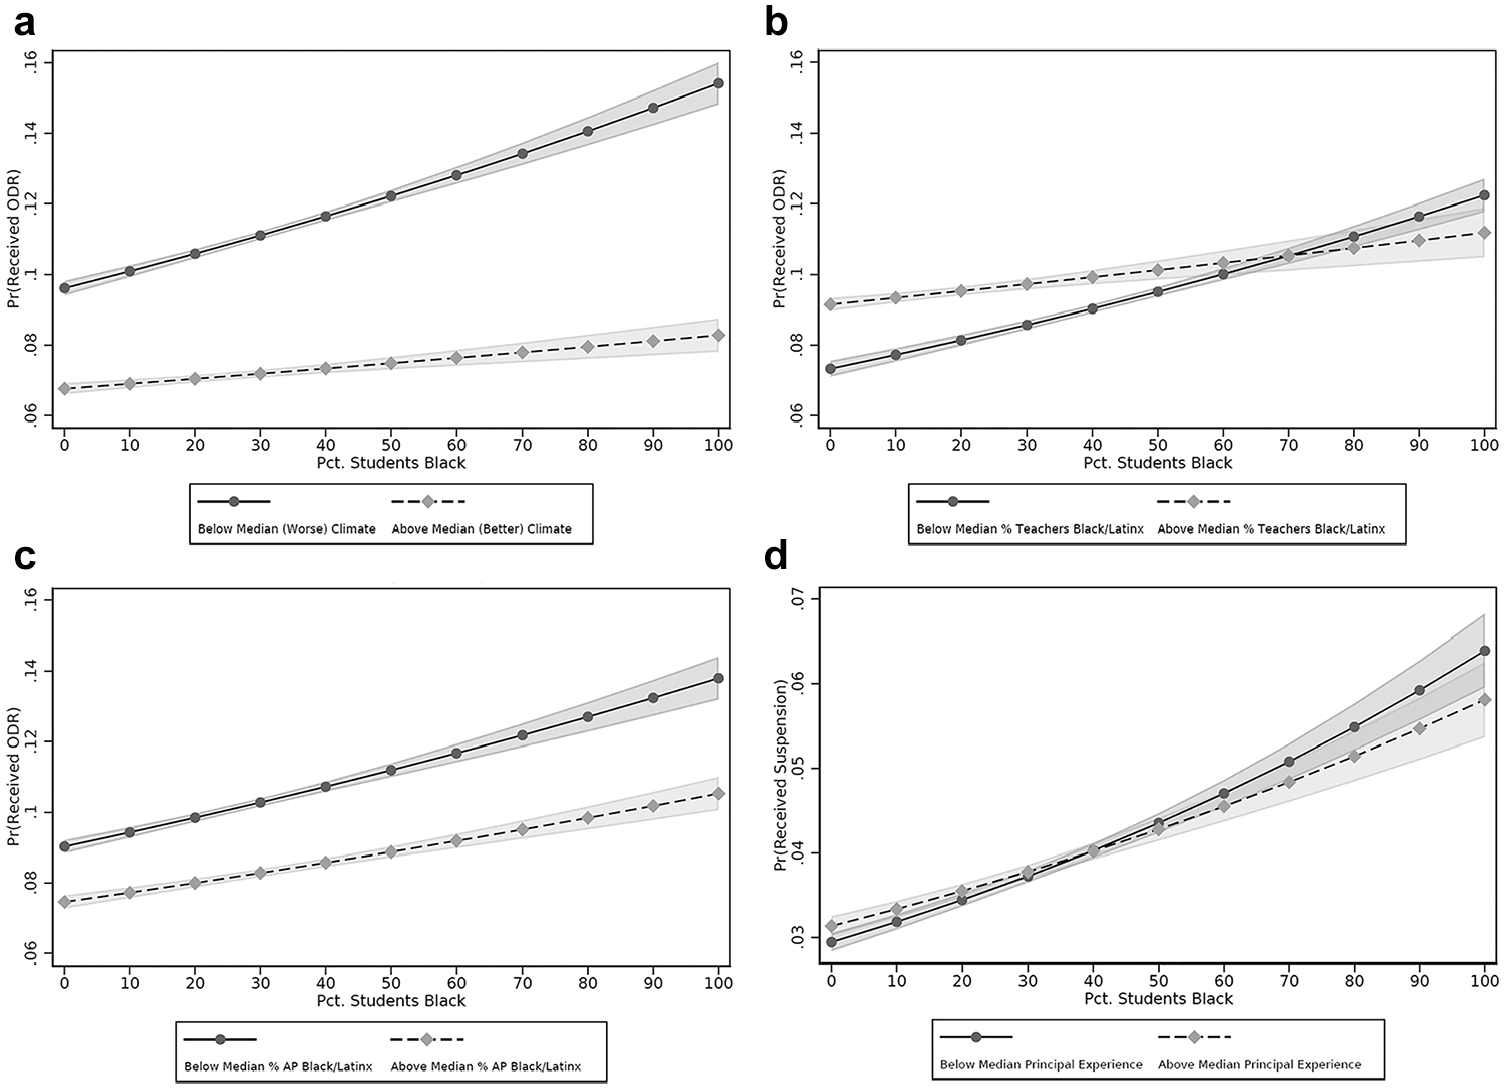
(a) School climate, (b) teacher diversity, (c) assistant principal diversity, and (d) principal experience as moderators of racial threat.
Without the inclusion of school fixed effects, we see a handful of significant interactions between school-level moderators and the percentage of Black students in a school. The relationship between percentage of Black students and ODR/suspension is significantly weaker in schools with better climate (Figure 1a), more teacher diversity (Figure 1b), and more assistant principal diversity (Figure 1c). The relationship between the percentage of Black students and suspension —but not ODR—is significantly weaker in schools with more experienced principals (Figure 1d). Attendance and performance, principal race, teacher and assistant principal experience, and interactions with percentage Latinx students, percentage Asian students, and percentage other race students had insignificant interactions.
When school fixed effects are included in our moderation models, several factors moderate how a school’s racial composition shapes the prevalence of and disparities in ODRs and suspensions. We find a weaker relationship between the percentage of Black students and exclusionary discipline (i.e., less evidence of racial threat) in schools with better climate, more teacher racial diversity, more assistant principal racial diversity, and more experienced principals. For example, the associated increase in risk of ODR for a 1 percent increase in Black students is about half as large in a school with better climate or more teacher racial diversity compared to a school with worse climate or less teacher racial diversity. Unlike the findings in models without school fixed effects, change in teacher racial diversity moderates the relationship between the change in proportion of Latinx students at a school and ODR/suspension in these models.
However, when we adjust for bias using the demeaning method—that is, not using time-varying moderators (Giesselmann and Schmidt-Catran 2022), which provides less biased but less efficient estimates—none of these interactions retain significance. Again, other school-level factors had insignificant interactions (even without the demeaning adjustment for bias), including attendance and performance, principal race, teacher and assistant principal experience, and interactions with percentage Asian students and percentage other race students. All these regression results with the interactions are provided in Table S13 in the supplemental material.
Racial Threat and Demographic Change in Schools
Racial change, prevalence, disparities, and the conversion rate of ODRs to suspensions
Next, we explore the relationship between change in school racial composition and school-level disciplinary outcomes. Table 3 shows the change in the percentage of Black students is significantly related to changes in the overall rate of ODR and suspension (a 1 percent increase in Black students at a school is associated with a 0.08 percent increase in the rate of ODR and a 0.03 percent increase in the rate of suspension). The change in proportion of Black students is not related to a significantly higher ODR-suspension conversion rate or to racial disparities. None of the other change in racial composition variables (Latinx, Asian, other race) are significantly related to school-level disciplinary outcomes.
Regression Estimates Predicting Change in School-Level Prevalence and Racial Disparities.
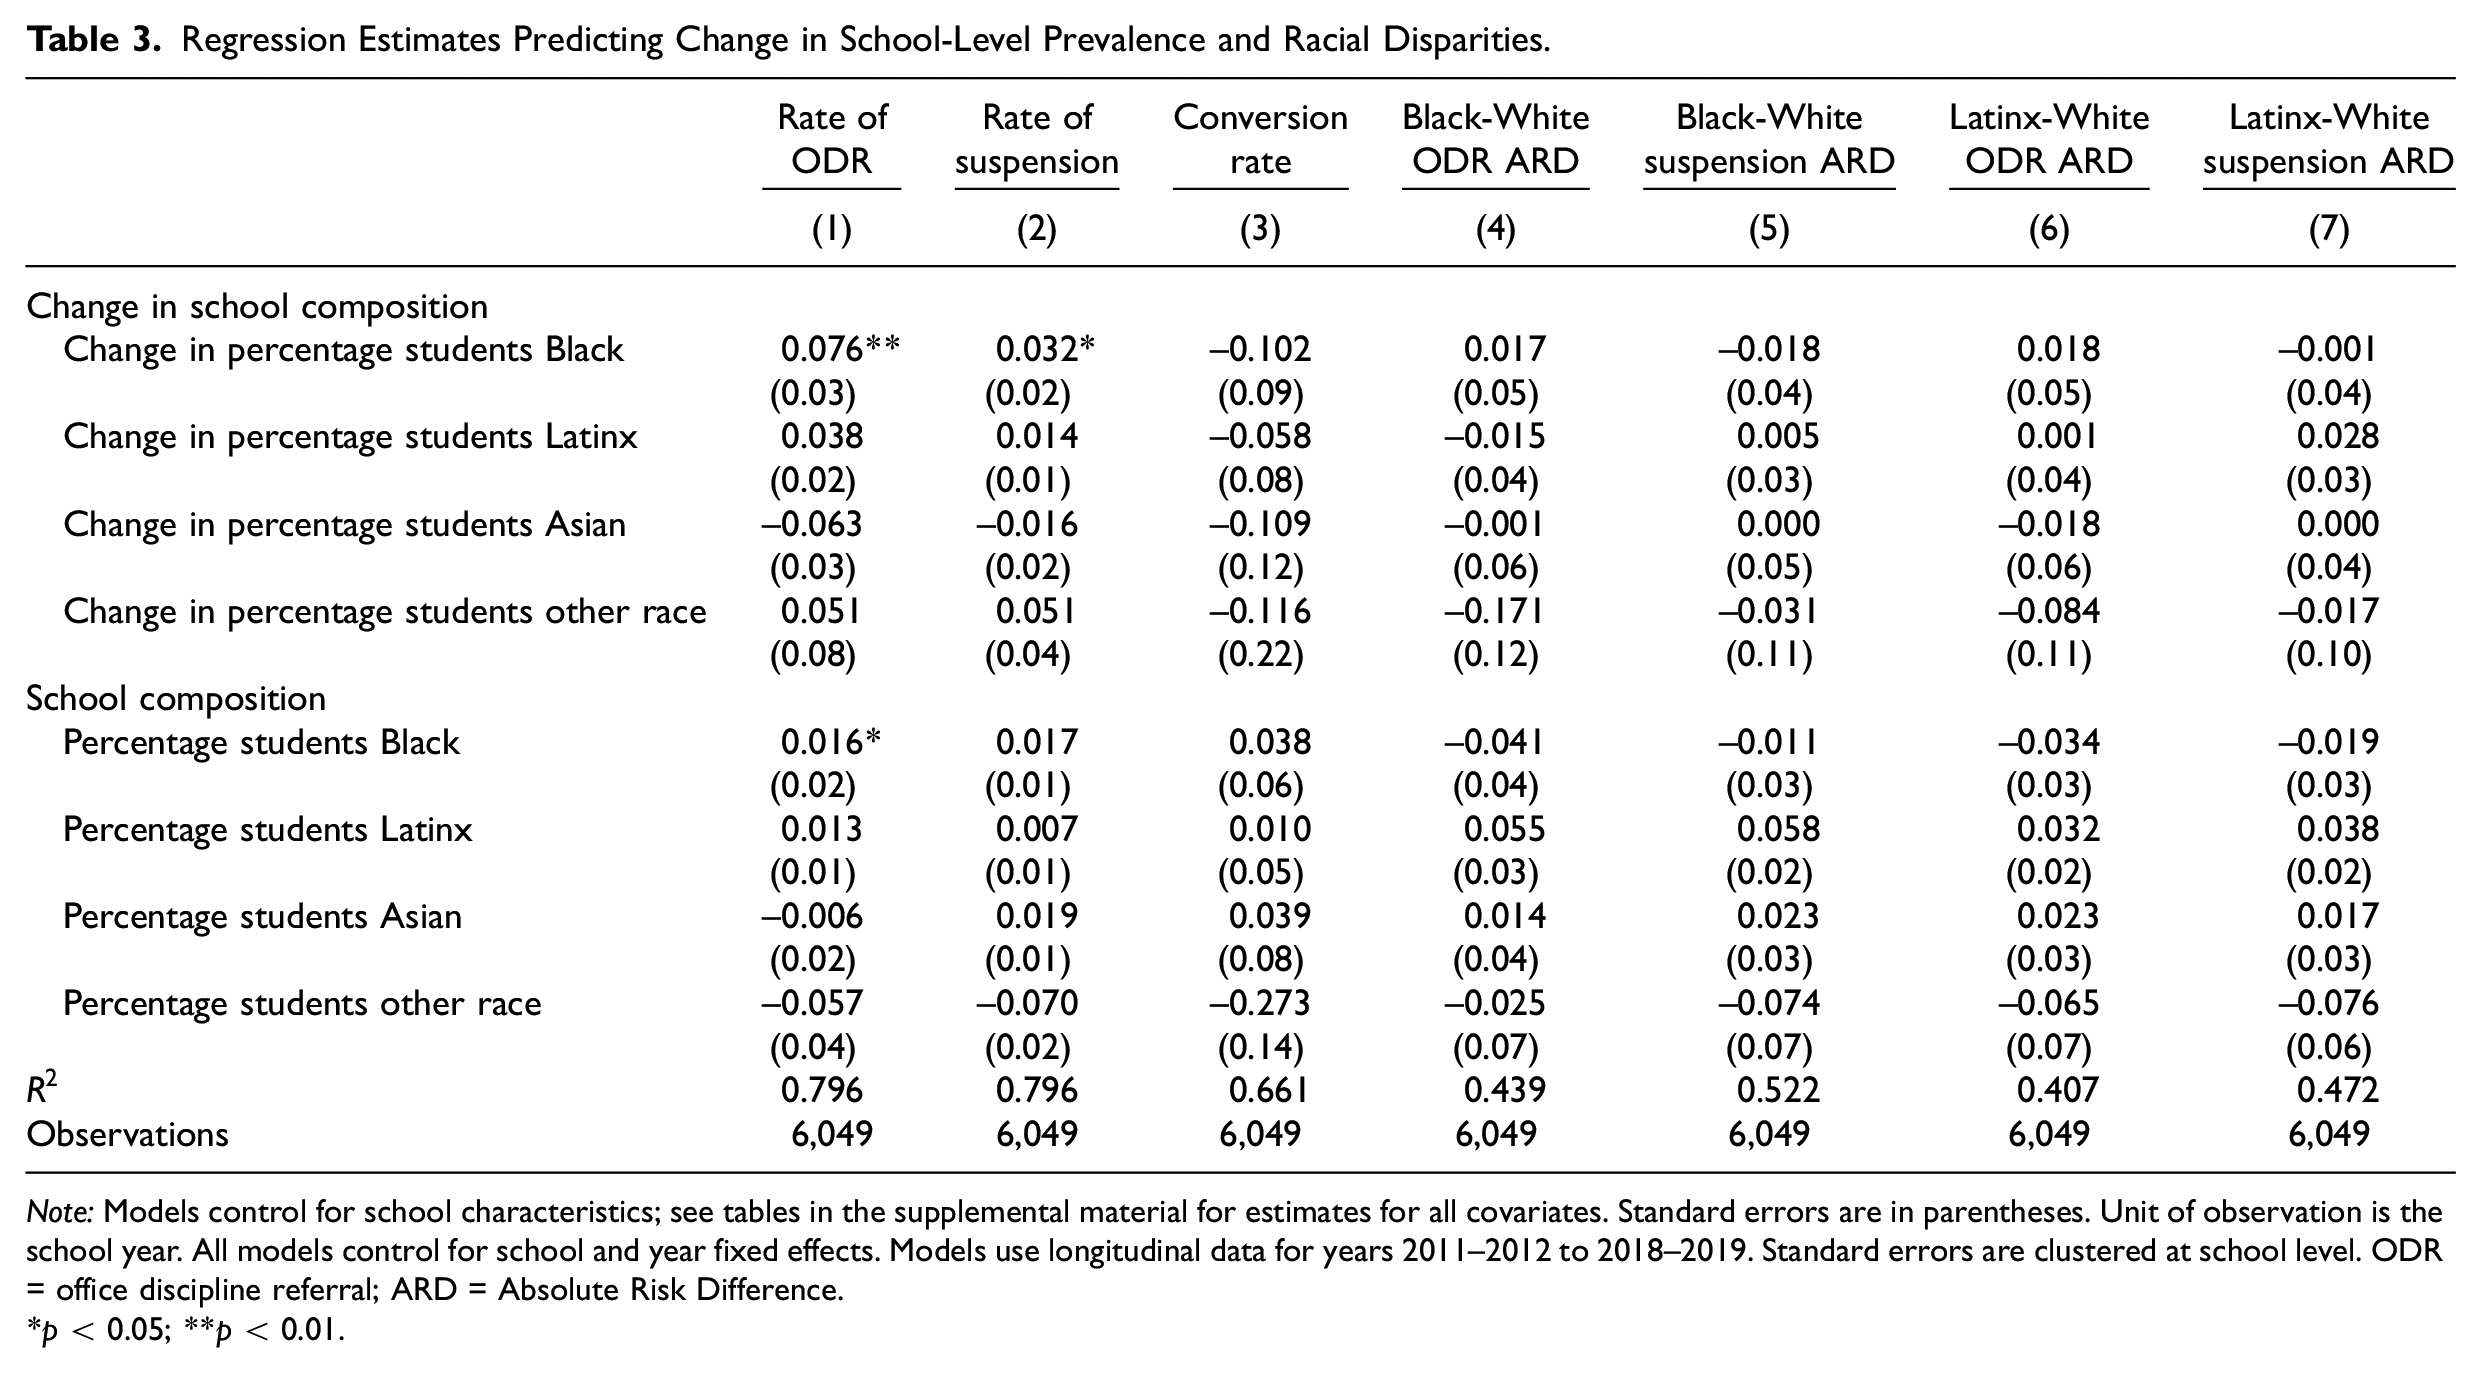
Note: Models control for school characteristics; see tables in the supplemental material for estimates for all covariates. Standard errors are in parentheses. Unit of observation is the school year. All models control for school and year fixed effects. Models use longitudinal data for years 2011–2012 to 2018–2019. Standard errors are clustered at school level. ODR = office discipline referral; ARD = Absolute Risk Difference.
p < 0.05; **p < 0.01.
Racial change and the likelihood of receiving ODRs and suspensions
Next, we run logistic regression models with school fixed effects at the student level to examine change in racial composition (Table 4, Columns 1 and 2). We find that the change in percentage of students at a school who are Black has a significant positive association with student risk of ODR and suspension. A 1 percent increase in Black students is associated with a 1.2 percent increase in the odds of ODR and a 2.4 percent increase in the odds of suspension. None of the other racial change variables (Latinx, Asian, and other race) are significantly related to likelihood of ODR or suspension.
Logistic Regression Estimates (Odds Ratios) Predicting Change in Student-Level Likelihood of Receiving Office Discipline Referrals and Suspensions.
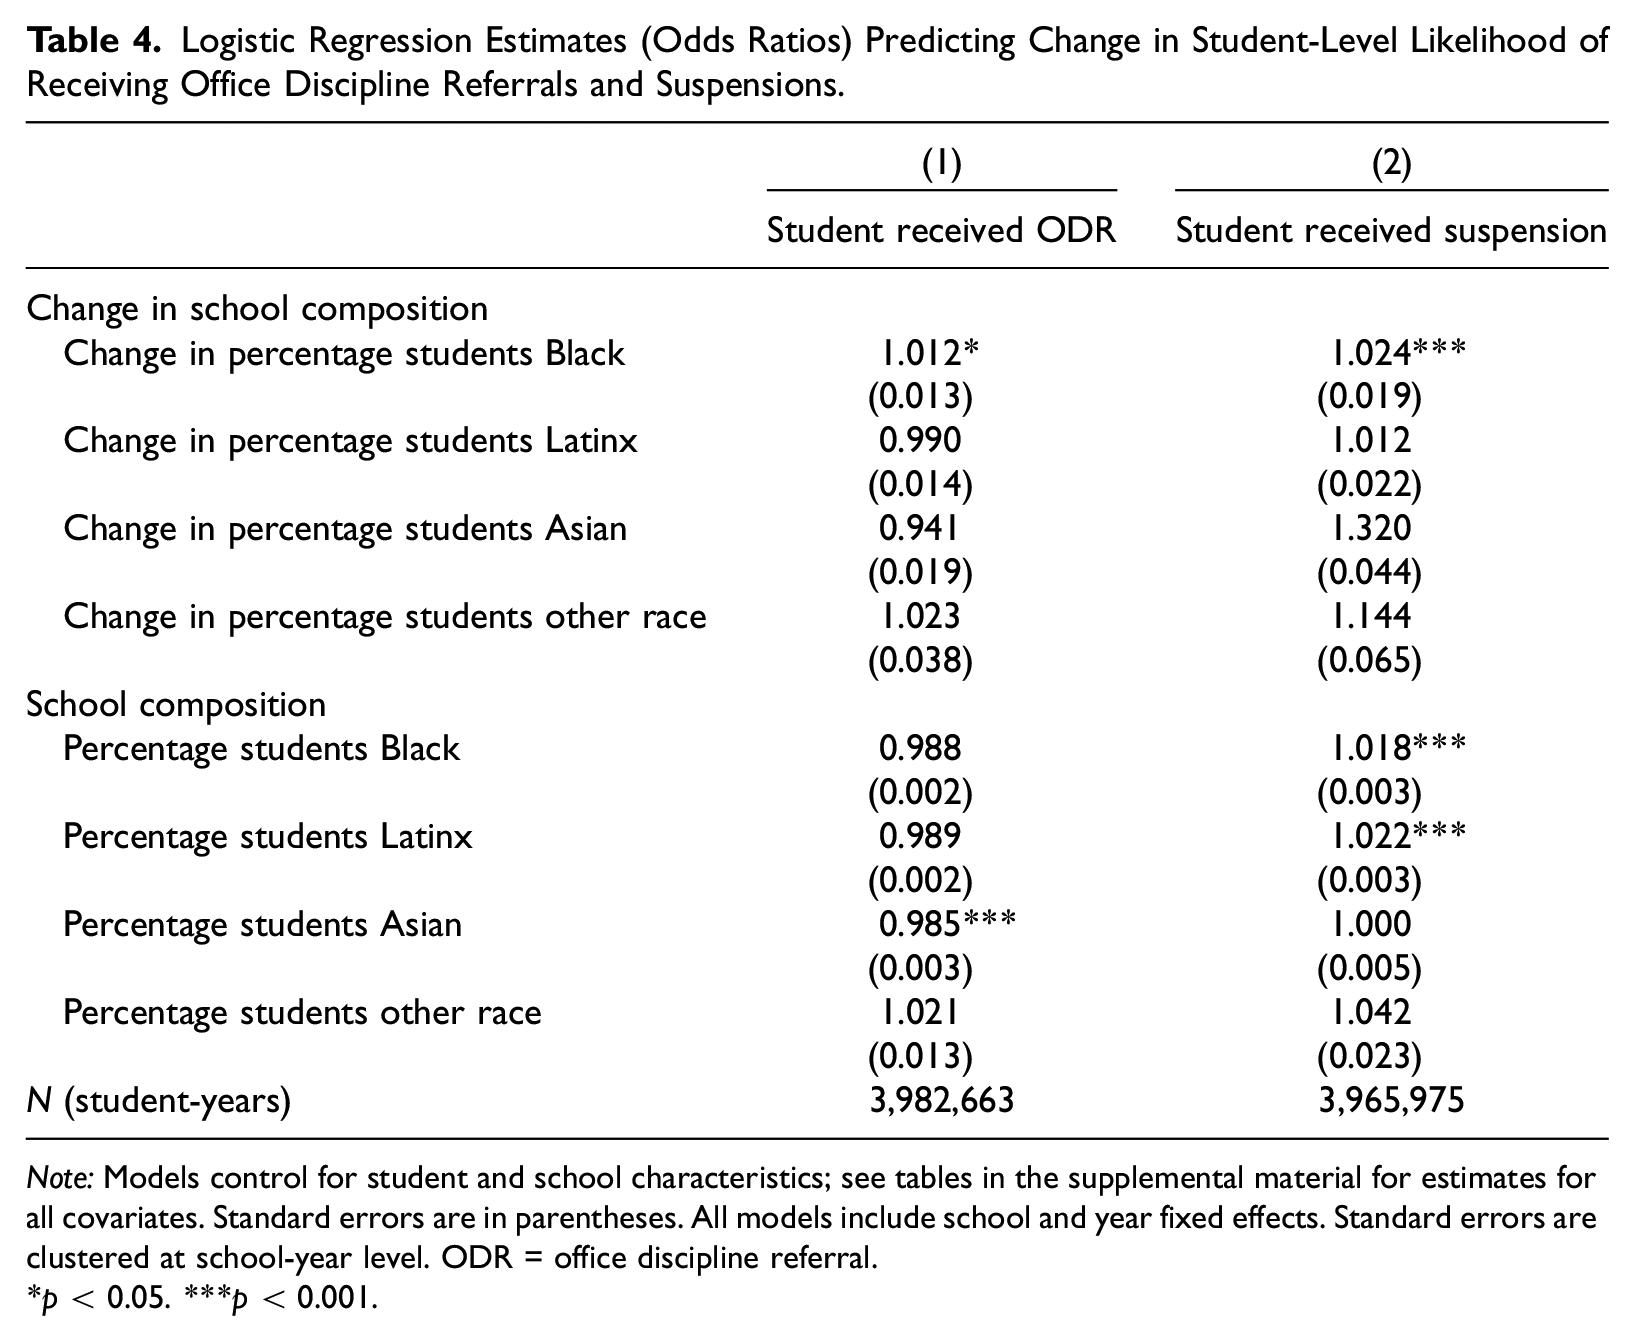
Note: Models control for student and school characteristics; see tables in the supplemental material for estimates for all covariates. Standard errors are in parentheses. All models include school and year fixed effects. Standard errors are clustered at school-year level. ODR = office discipline referral.
p < 0.05. ***p < 0.001.
Racial change and school-level moderators
Unlike our previous moderation analyses exploring the interaction between racial composition and school-level variables, none of our school-level moderators are significant when interacting them with the change in racial composition. All these regression results, with the interactions in separate models, are provided in Table S14 in the supplemental material.
Racial Threat in Majority Black, Majority Latinx, and Majority White schools
First, we display descriptive results showing how the clustering of students of color in racially homogeneous schools may influence racial threat (Edwards 2016). We define racially homogeneous schools as those where over 50 percent of students are from a single race: Black, Latinx, or White. In NYC, approximately 11 percent of schools are predominantly Black, 18 percent are predominantly Latinx, and 2 percent are predominantly White. Less than 1 percent of schools are predominantly Asian, and no schools are predominantly mixed-race, so we limit our analysis of racially homogeneous schools to Black, Latinx, and White majority schools. Table S15 in the supplemental material compares the school discipline outcomes across racially homogeneous schools. The descriptive results show that overall suspension and ODR rates are markedly higher in predominantly Black schools (7.03 percent and 15.83 percent, respectively) relative to predominantly Latinx (5.71 percent and 12.53 percent, respectively) and predominantly White (1.64 percent and 5.94 percent, respectively) schools. Interestingly, the Black suspension and ODR rates are similar in predominantly Black and predominantly Latinx schools. The Latinx suspension and ODR rates are highest in predominantly Black schools compared to predominantly Latinx or White schools. The White and Asian suspension and ODR rates are highest in predominantly Black schools (but only slightly higher than in predominantly Latinx schools) and lowest in predominantly White schools. Both Black-White and Latinx-White discipline disparities are worse in predominantly White schools compared to predominantly Black or Latinx schools. Discipline outcomes for other race students follow a different pattern: The other race suspension and ODR rates are higher in predominantly Black schools compared to other schools, but other race-White discipline disparities are highest in predominantly Black schools and lowest in predominantly White schools, on average.
Next, we rerun our school-level models separately for the three types of racially homogeneous schools. We find a stronger relationship between the percentage of Black students at a school and the school ODR and suspension rates in predominantly White schools than in predominantly Black schools (see Figure 2). For example, a 1 percent increase in Black students at a school is associated with a 0.05 percent increase in the ODR rate in predominantly White schools but only a 0.03 percent increase in predominantly Black schools. The relationship between the percentage of Black students and ODR and suspension rates in predominantly Latinx schools is similar to the relationship in all schools. The percentage of other race students is related to higher ODR and suspension rates in predominantly White and predominantly Black schools (but not in predominantly Latinx schools). The percentage of Asian students is significantly positively related to the ODR rate in majority Black schools (but not the suspension rate) and not significantly related to discipline rates in majority White or majority Latinx schools.
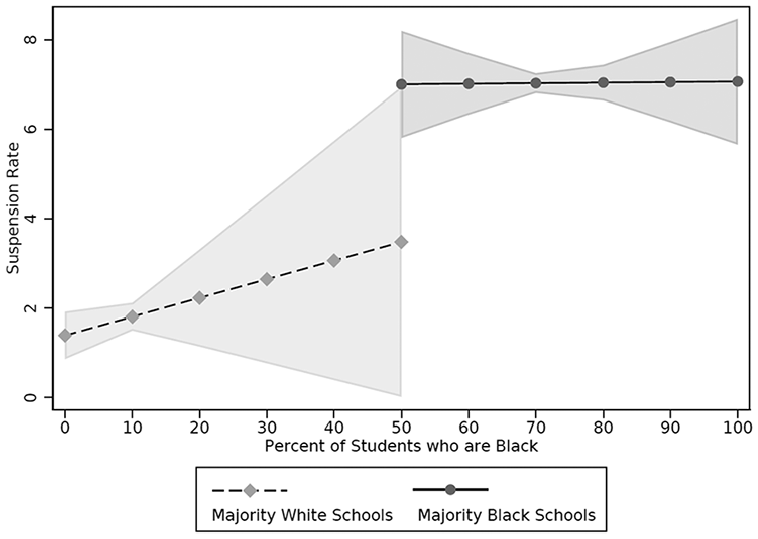
Racial threat in predominantly Black and predominantly White schools.
All these school-level patterns are consistent with our results when we run our student-level models separately by the three types of racially homogeneous schools: There is a consistently stronger relationship between the proportion of Black students at a school and student likelihood of ODR/suspension in predominantly White schools compared to predominantly Black schools. In addition, when we interact student race with the indicators of racially homogeneous schools, we see that Black and Latinx students are less negatively affected by being in predominantly Black schools in terms of discipline outcomes and that other race students are more negatively affected compared to White students.
Specification Checks
We conducted a series of specification checks to investigate the robustness of the results. First, similar to Edwards (2016), we consider how interactions between student race and school racial composition may be related to school discipline outcomes (shown in Table S16 in the supplemental material). We run models including interactions between student race (Black and Latinx) and change in school racial composition (percentage Black, Latinx, Asian, and other race). The only significant interaction is between Black students’ disciplinary outcomes and the percentage of Asian students at a school. The overall likelihood of ODR and suspension are negatively related to the percentage of Asian students, but the likelihood of suspension for Black students slightly increases with higher percentages of Asian students. In other words, it seems that schools with increasing proportions of Asian students have better overall discipline outcomes but not for Black students. At the student level, we find evidence of racial threat in school discipline. Student risk of ODR and suspension are significantly positively related to the percentage of Black and Latinx students at a school. However, we find little evidence of differential associations with risk of exclusionary discipline by student race.
Second, ethnic composition should have greater influence on social control in environments that are not punitive (Keen and Jacobs 2009; Welch and Payne 2018). To test whether racial threat is more evident in less punitive environments, we classify schools as either inclusive-disciplinary (lowest tercile of school suspension rates) or high-disciplinary (Welsh et al. 2023). Welch and Payne (2018:92) highlight that “according to minority threat theory, ethnic composition should have a greater influence on social control in contexts that are not already more punitive, that is, contexts where greater discretionary control by the majority group is possible (Keen and Jacobs 2009)” We find a similar relationship between school racial composition and discipline outcomes regardless of the levels of existing exclusionary discipline. We also use the chronic discipline rate (proportion of students within a school who have been disciplined more than once within the same school year; Rodriguez and Welsh 2022; Welsh and Rodriguez 2024) as an alternative measure of school discipline and racial discipline disparities, but we find no significant relationship between school racial composition and chronic discipline rates. Overall, the results reject the hypothesis of greater racial threat in low-punitive environments (Keen and Jacobs 2009) and underscore the pervasiveness of racial threat in urban districts.
Third, we run the school-level models separately for middle, high, and combined schools. The relationship between school racial composition and discipline outcomes does not seem to vary by schooling level.
Fourth, we examine the susceptibility of our analyses to multicollinearity concerns. The independent variables of interest contain low to moderate levels of multicollinearity (variance inflation factors below 6.5 for the percentage of students who are Black, Latinx, Asian, and other race). Considering that multicollinearity may produce high variance of the estimated coefficients (i.e., larger standard errors resulting in an increased probability of incorrectly failing to reject the null hypothesis) and that many model results do yield statistically significant estimates on the racial/ethnic composition variables, we do not consider multicollinearity an issue of major concern for this study.
Fifth, we explore how the findings may vary if multilevel modeling is used in lieu of our preferred school fixed effects strategy (for the student-level analyses). Again, we find a statistically significant positive relationship between the percentage of Black and Latinx students at a school and student likelihood of ODR and suspension (Table S17 in the supplemental material).
Sixth, we include a nonlinear model specification (i.e., operationalize racial threat using a quadratic variable: the square of the percentage of Black students) to explore if there is a nonlinear relationship between the percentage of Black students at a school and exclusionary discipline (Table S18 in the supplemental material). We find mixed results in the school-level models: There is no significant relationship between the squared percentage of Black students and ODR or suspension rates when using models without school fixed effects, but there is a significant positive relationship when we include school fixed effects. This suggests variation in the percentage of Black students within schools over time may have a nonlinear relationship with exclusionary discipline. At the student level, we find similar results as for the school level, with the squared term being insignificant without school fixed effects but then becoming significant once school fixed effects are included.
Seventh, we explore if the relationship between school racial composition and student suspension changes depending on if we aggregate or separate by principal and superintendent suspension (Table S9 in the supplemental material). We still see a statistically significant relationship between the percentage of Black and Latinx students in a school and student likelihood of suspension across suspension types, but this relationship is stronger for superintendent suspensions than for principal suspensions.
Eighth, we explore if the relationship between school racial composition and student suspension differs depending on the infraction level of the suspension (Table S8 in the supplemental material). We find a statistically significant positive relationship between the percentage of Black students at a school and student likelihood of suspension for all infraction levels for which there are reasonably large samples (Levels 3–5), although the coefficients are largest for the lower level of infraction (Level 3).
Intersectionality
Finally, we explore intersectionality in our examination of racial threat in two main ways: (1) using the percentage of Black students with a focus on intersectional identities (percentage of Black males, percentage of Black low SES students, percentage of Black students receiving SPED services, and percentage of Black male students receiving SPED) and (2) interacting the percentage of Black students with indicators of Black students’ intersectional identities (student is Black and male, student is Black and low SES, student is Black and receiving SPED, and student is Black and male and receiving SPED). Results are reported in Tables S19 and S20 in the supplemental material.
We first compare the variation in ODR and suspension rates across our four categories of Black students (Black male, Black low SES, Black SPED, and Black male SPED). Black male SPED students have the highest ODR rate (29 percent) and suspension rate (14 percent) of all categories, followed by Black SPED students, with an ODR rate of 27 percent and suspension rate of 13 percent, and Black male students, with an ODR rate of 22 percent and suspension rate of 10 percent. Black low SES students had an ODR rate of 21 percent and suspension rate of 10 percent. Black male SPED students also had the highest conversion rate (48 percent) of ODRs to suspensions. Overall, the findings illustrate that gender and SPED status (and to a lesser extent, class) are linked to higher prevalence of exclusionary discipline for Black students.
We next use school-level proportions of each Black student group to examine how intersectionality may shape how change in schools’ racial composition affects disciplinary outcomes. We find evidence of significant intersectionality with gender, socioeconomic background, and disability for Black students. The percentage of Black male students, percentage of Black low SES students, and percentage of Black students receiving SPED services are all significantly positively related to ODR and suspension rates. However, the percentage of Black female students, Black students who are not low SES, and Black students not receiving SPED services are not significantly related to discipline rates. We find the most striking results when we further disaggregate results to examine students who are Black, male, and with disabilities. A 1 percentage increase in Black male students with disabilities is associated with a 0.25 percent increase in the ODR rate and a 0.13 percent increase in the suspension rate; this is about 10 times larger than the associated increase in discipline rates for the percentage of all other Black students (which is still a statistically significant associated increase). These results are similar across the school- and student-level models.
Finally, we explore if there is a differential association between the percentage of Black students at a school for Black students based on their intersectional identities (student is Black and male, student is Black and low SES, student is Black and receiving SPED services, and student is Black and male and receiving SPED services). None of these interactions are statistically significant.
Discussion
Racial Threat and Social Control in Schools
Using longitudinal data from a diverse “urban intensive” district, this study illustrates the associations between the racial composition and changes in racial composition of schools and school-level disciplinary outcomes, such as rates of and disparities in ODRs and suspensions, and student-level disciplinary outcomes, such as the likelihood of receiving an ODR and suspensions. Our findings provide theory-building insights pertaining to the operationalization of minority threat theory as racial change (relative to racial composition) and add to empirical literature by leveraging longitudinal data, using ODRs and suspensions, and considering school contextual factors that may moderate racial threat. Similar to most prior studies (Anyon et al. 2014; Edwards 2016; Peguero and Shekarkhar 2011; Roch and Edwards 2017; Rocque and Paternoster 2011; Skiba et al. 2014; Welch and Payne 2010), we find a significant association between the proportion of Black students in a school and overall suspensions and ODRs at the school and student levels. Our results contrast with those of Huang and Cornell (2018) and Gregory et al. (2018), who found the percentage of Black students in a school was not a significant predictor of suspensions. The difference may be explained by our use of longitudinal rather than cross-sectional data and the studies’ different geographic locations.
At the school level, we find that the percentage of Latinx students is not significantly associated with overall rates of suspensions or ODRs. This result differs from Welch and Payne (2018), who found that schools with larger percentages of Latinx students are more likely to favor punitive discipline responses, and also from Ramey (2015), who found a negative relationship between the proportion of Latinx students and suspension rates. The difference in findings may possibly be explained by the fact that our study utilizes a longitudinal rather than a cross-sectional data set. However, at the student level, we find the percentage of Latinx students is associated with a higher likelihood of receiving an ODR and suspension, consistent with prior studies using student-level samples (Anyon et al. 2014).
In addition to demographic composition, we also find that demographic change shapes the prevalence of school-level disciplinary outcomes, including overall ODR and suspension rates and ODR-suspension conversion rates, but this is only the case for a change in the percentage of Black students (a change in the percentage of Latinx, Asian, or other race students is not associated with a change in discipline prevalence at the school level). Similarly at the student level, we find that a change in the percentage of Black students at a school is associated with an increased likelihood of receiving an ODR or suspension.
Whether using the typical operationalization of the racial composition of schools (Welch and Payne 2010, 2018) or racial change, we find supporting evidence of racial threat in students’ disciplinary outcomes (ODRs and suspensions). Our findings thus provide more support for the application of racial threat theory to school discipline because both the racial composition of schools and increases in the concentration of students of color are associated with an increase in social control in the form of exclusionary discipline. The differences in the results regarding Black and Latinx students underline the importance of conceptualizing racial threat in multiple ways to illustrate pivotal trends in school discipline. Using racial composition, the results for Latinx students are more mixed than the results for Black students. The similarity in student-level results suggests racial composition and changes in percentage of Black students shape the likelihood of receiving exclusionary discipline. We posit that student-level analyses are better able to model individual effects of racial composition changes on discipline patterns experienced by the average student. The findings illustrate the disciplinary implications of the demographic changes in schools in urban districts. Applying SVSC, school context, particularly the demographic composition and changes to the demographic composition of schools, contributes to the levels of social control in schools. This has broad implications for the demographic changes occurring across districts in the United States and underscores the need for researchers and policymakers to pay attention to the manifestation of racial threat in disciplinary outcomes.
School contextual factors, such as school climate and staff diversity, moderate racial composition, with more mixed evidence for racial change. We also find evidence that racial threat is moderated by school climate and staff diversity and experience (although this depends on whether school fixed effects are included or if we use time-fixed moderators to adjust for bias): We see a weaker relationship between the proportion of Black students in a school and ODR/suspension in schools with better climate, more teacher and assistant principal racial diversity, and principal experience. School climate, teacher racial diversity, assistant principal racial diversity, and principal experience do not appear to moderate how a change in a school’s Black and Latinx composition shapes the prevalence of and disparities in ODRs and suspensions.
Anti-Blackness in School Discipline
Our findings reveal empirical evidence of anti-blackness in school discipline (Little and Welsh 2022; Sobti and Welsh 2023) and provide support for Dumas and Ross’s (2016) framing of school discipline as an educational phenomenon ripe for the manifestation of anti-blackness. Evidence of anti-blackness is especially salient and concerning given that “the school discipline system can be regarded as a social and material manifestation of contemporary times” (Irby 2014:522). Similar to prior studies (Edwards 2016; Welch and Payne 2010), we find a significant relationship between the composition of students of color in a school and the prevalence of exclusionary discipline for Black students; the evidence of racial threat for other students of color is inconsistent and weaker relative to Black students. Similar to Welch and Payne (2018:106), our findings suggest “a high percentage of Black students in schools may present a more powerful threat, requiring more exclusionary methods, than that presented by a high enrollment of Latino/a students.”
Importantly, Black students experience increased exclusionary discipline not only based on their proportion in a school but also based on the proportion of non-White students in a school, suggesting the presence of non-White students may translate into perceptions of Black students as threats. Similar to prior studies (Edwards 2016; Smith et al. 2023; Wiley 2021), our findings draw attention to the disciplinary experience of Black students in majority White schools. Our findings are congruent with those of Smith et al. (2023) and Wiley (2021): Predominantly Black schools have the highest overall discipline rates, but predominantly White schools have the highest Black-White discipline disparities. Black students are especially disproportionately disciplined (relative to White students) in predominantly White schools. An increase in the proportion of Black students in a predominantly White school is associated with a larger increase in exclusionary discipline compared to a similar increase in a predominantly Black school. Racial threat appears to be stronger in predominantly White schools compared to predominantly Black schools. This aligns with the interpretation of minority threat theory as an expansion of social control in response to an increase in the concentration of Black students, motivated by racial domination. The findings should compel policymakers and researchers not only to pay attention to the manifestation of racial threat in school discipline in predominantly Black schools but also to consider the larger threat in predominantly White schools or diversifying schools where the proportion of Black students is increasing relative to White students.
Results from the intersectionality analyses draw attention to the disciplinary experience of Black male students, Black SPED students, and Black male SPED students because these students experience the highest prevalence of exclusionary discipline among Black students. In addition, increases in these groups of Black students are associated with much larger increases in exclusionary discipline compared to increases in other Black students. This is congruent with Haight et al.’s (2016) finding that a school did not take the instructive measures outlined in the support plan for a Black student with a disability and instead sent the student home for a minor classroom disruption. This finding highlights the urgency of addressing the disciplinary experiences and outcomes of Black SPED students.
Policy and Scholarly Implications
A few policy and scholarly implications emerge from our findings. The study underscores the need to apply an intersectional approach to research on anti-blackness in school discipline. The existence of racial threat, whether operationalized using racial composition or racial change, supports the rejection of a color-blind approach to school discipline practices and reforms (Carter et al. 2017; Gregory et al. 2021; Sobti and Welsh 2023; Welsh et al. 2019). Our findings can be interpreted as empirical evidence of anti-blackness in public education through school discipline and supports the need for interventions that address anti-Black racism in schools given the disciplinary implications.
The results also support calls for improving school climate to reduce racial inequality in school given that school climate moderates the association between student racial composition in schools and disciplinary outcomes. Policymakers seeking to disrupt discipline disparities should consider investments in diversifying school personnel. Congruent with other recent studies (Hughes et al. 2020; Lindsay and Hart 2017; Rodriguez et al. 2024; Shirrell et al. 2023; Welsh et al. 2024), our study illustrates the importance of minority school personnel (both teachers and school leaders) for the likelihood of students of color being disciplined. Our findings also add to a growing number of studies highlighting the importance of assistant principals in the disciplinary process (Welsh 2023a, 2024b; Welsh and Sobti 2023). As such, our findings buttress calls for diversification of teachers and administrators in schools because bureaucratic representation has benefits for schools’ disciplinary processes.
The study also highlights the need for further research on the relationship between school discipline and Asian students (Nguyen et al. 2019). This is particularly relevant in districts with a large or growing Asian student population with data to examine Asian American and Pacific Islander ethnic groups. Similar to Welch and Payne (2018), at the school level, we find that the proportion of Asian students (although not the change in the proportion of Asian students) is associated with lower ODR and suspension rates. At the student level, we find that an increase in the proportion of Asian students is associated with a decrease in the likelihood of receiving an ODR. There are several plausible interpretations for these results, including support for the model minority myth or the New York City context and its immigration patterns. Future studies should explore the disciplinary experiences of Asian students, especially across schools of varying demographic compositions.
Supplemental Material
sj-docx-1-soe-10.1177_00380407251321387 – Supplemental material for Racial Threat, Schools, and Exclusionary Discipline: Evidence from New York City
Supplemental material, sj-docx-1-soe-10.1177_00380407251321387 for Racial Threat, Schools, and Exclusionary Discipline: Evidence from New York City by Richard O. Welsh, Luis A. Rodriguez and Blaise Joseph in Sociology of Education
Footnotes
Acknowledgements
The authors gratefully acknowledge the Research Alliance for New York City Schools and New York City Public Schools for their cooperation and assistance with providing the necessary data to conduct these analyses. The views expressed herein are those of the authors and should not be attributed to their institutions or data providers. Any and all errors are attributable to the authors.
Research Ethics
The data used in this study are secondary data sources – the researchers did not interview or interact with study participants. The administrative data is managed by the Research Alliance for New York City Schools and was used in accordance with Institutional Review Boards standards and guidelines. The authors of this study at no point throughout the course of the research had access to any identifying information on study participants.
Supplemental Material
Supplemental material for this article is available online.
Author Biographies
References
Supplementary Material
Please find the following supplemental material available below.
For Open Access articles published under a Creative Commons License, all supplemental material carries the same license as the article it is associated with.
For non-Open Access articles published, all supplemental material carries a non-exclusive license, and permission requests for re-use of supplemental material or any part of supplemental material shall be sent directly to the copyright owner as specified in the copyright notice associated with the article.