
Abstract
This article presents the first longitudinal analysis of social and geographic mobility into Britain’s higher managerial and professional occupations. Using linked census records from the Office for National Statistics Longitudinal Study, we find that those from advantaged social origins are substantially more likely to make long-distance residential moves, implying that geographic mobility is a correlate of advantaged social origins rather than a determinant of an advantaged adult class position. Among higher managers and professionals, those with advantaged backgrounds lived in more affluent areas as children than those from disadvantaged backgrounds. This ‘area gap’ persists during adulthood: when the upwardly mobile move, they are unable to close the gap to their peers with privileged backgrounds in terms of the affluence of the areas they live in: they face a moving target. Geographic advantage, and disadvantage, thus lingers with individuals, even if they move.
Introduction
In a context of rising economic inequality (Alvaredo et al., 2018; Piketty, 2014), social mobility has become a key concern for citizens, policy makers and researchers as it is seen as enabling meritocratic ideals of equality of opportunity (McCall, 2013). While there is a debate about whether social mobility in the UK and the USA has declined in the later 20th century (Blanden et al., 2004; Buscha and Sturgis, 2018; Chetty et al., 2014a), the stakes are higher now because income inequality has risen. Specifically, as resources have become increasingly concentrated at the top of the social hierarchy (Piketty, 2014), access to the most advantaged occupations becomes particularly relevant. Pioneering research in this area has found that class origin shapes access to and earnings within higher managerial and professional employment (Friedman and Laurison, 2019; Laurison and Friedman, 2016), but has not yet considered the role of geographic mobility.
We investigate this ‘missing link’ between social and geographic mobility (Savage, 1988), because a separate line of thinking suggests that people need to be geographically mobile to achieve upward mobility. Indeed, research has highlighted that rates of social mobility vary by geography (Bell et al., 2019; Buscha et al., 2021; Chetty et al., 2014b; Connor and Storper, 2020; Friedman and Macmillan, 2017) and that geographic mobility to more affluent areas positively affects upward social mobility (Buscha et al., 2021; Chetty and Hendren, 2018; Connor and Storper, 2020). Therefore, we know that where people live shapes their chances of climbing the social ladder. However, we know little about the role class background plays in shaping patterns of geographic mobility, and the consequences of that mobility for the kinds of areas that people live in. We address these questions by drawing on Friedman and Laurison’s (2016) approach to analysing social mobility into Britain’s higher managerial and professional occupations. While much previous research on social mobility and geography focused on relative mobility and the mobility chances of disadvantaged children, our study focuses on geographic mobility and access to advantaged social class positions.
We address two key research questions. First, we analyse the social origins of people with higher managerial and professional occupations to see whether geographic mobility is more common for the upwardly socially mobile or those from intergenerationally stable backgrounds (i.e. those whose parents were already employed in advantaged occupations). Second, we investigate the kind of areas that higher managers and professionals with different social origins move to. Do the upwardly socially mobile manage to ‘catch up’ with the intergenerationally stable, moving to areas of equal affluence? If not, can we explain this by differences in educational qualifications, demographic background or regional context between the two groups? Our analysis draws on data from the UK Office for National Statistics (ONS) Longitudinal Study (LS), a 1% sample of the England and Wales population that links individuals’ census records and life events data across the five decennial censuses between 1971 and 2011.
Our findings suggest that geographic mobility plays an important role in reproducing social class advantage. We find that upwardly socially mobile higher managers and professionals are less likely to have been geographically mobile than the intergenerationally stable. This finding is in line with the insight that the advantaged are more likely to move, long established by geographers (Champion et al., 2014), scholars of migration (Smith and Sage, 2014) and sociologists who study spatial issues in social mobility (Savage, 1988). So, social class is not only associated with place, but also with the ability to change places. This is important because there are individual and familial benefits to moving. For instance, internal migration may offer employment and wage gain opportunities (Greenwood, 1997), wealthier districts on average offer better educational outcomes (Gingrich and Ansell, 2014) and children who grow up in lower-poverty neighbourhoods have better life chances (Chetty and Hendren, 2018), highlighting that class-based differences in geographic mobility matter.
Among the higher managers and professionals we study, the intergenerationally stable (those with higher managerial and professional backgrounds) lived in more affluent areas as children than the upwardly socially mobile (who hail from routine and semi-routine backgrounds). This ‘area gap’ persists during adulthood. Regardless of social background, when those with higher managerial and professional occupations move long-distance, they move to more affluent areas. However, our second, and main, empirical finding is that even when upwardly mobile higher managers and professionals do move area, they are unable to close the gap to their intergenerationally stable peers in terms of the affluence of the areas they live in as adults: they face a ‘moving target’. Therefore, place-based differences related to disadvantaged social origins are not wiped clean by geographic mobility. Geographic advantage, and disadvantage, thus lingers with individuals, even if they move.
Social Mobility, Geography and Geographic Mobility
A growing literature has shown that social mobility rates vary by geography. Studies on intergenerational income mobility have provided evidence that there are substantial place differences in social mobility in the USA (Chetty et al., 2014b), Canada (Corak, 2019), Italy (Acciari et al., 2019) and Sweden (Heidrich, 2017) among others. Research on occupational social mobility in the UK has also found regional differences in mobility rates (Bell et al., 2019; Buscha et al., 2021; Friedman and Macmillan, 2017). Therefore, there are significant differences in social mobility chances depending on where children grow up.
Given these place-based differences in mobility rates, much recent research has considered the consequences of migration for upward social mobility. Buscha et al. (2021) found that in England and Wales, people who moved out of their region of origin had higher rates of upward occupational mobility. For the USA, Chetty and Hendren (2018) found that geographic mobility has a substantial impact on intergenerational income mobility. Children whose parents move to affluent areas see improved adult incomes relative to those who remain in disadvantaged areas.
However, this literature on intergenerational income mobility has little to say about the ways in which social origins shape patterns of geographic mobility and focuses on the upward mobility chances of the relatively disadvantaged. This approach of studying ‘who moves up?’ provides insights about the determinants of upward mobility from disadvantaged positions. However, to understand social inequality, we also need to study ‘who makes it to the top?’, focusing on geographic mobility and social mobility into the most advantaged occupations. If the advantaged are disproportionately more likely to be able to move and take up prestigious jobs elsewhere, the disadvantaged will be ‘left behind’. Further, investigating the relationship between geographic mobility and access to advantaged social class positions allows us to study whether social class advantage may be reproduced by geographic mobility.
Geographic Mobility and the Reproduction of Social Class Advantage
Geographers have long established that the advantaged – in terms of their socio-economic and ethnic/racial backgrounds – are more likely to be geographically mobile (Champion et al., 2014; Gamsu and Donnelly, 2020; Horowitz and Entwisle, 2020) as are the young and educated (Greenwood, 1997; Young, 2017). As a result, we question interpretations of the relationship between geographic and social mobility that only suggest geographic mobility as a cause for social mobility. Instead of focusing solely on the consequences of migration for upward mobility, we also need to consider how social origins shape patterns of geographic mobility.
Research on elite mobility offers hints that geographic mobility is relevant for the reproduction of social advantage at the top of the distribution. Place matters for the rich. Private boarding schools, a popular education venue for the rich (Khan, 2011), require geographic mobility in early life, and teach children ‘ease’ in new environments long before entering the labour market. Further, students from advantaged backgrounds tend to attend universities away from their home while their working-class peers are more likely to attend local universities (Gamsu and Donnelly, 2020; Smith and Sage, 2014). Geography affects the potential partners people meet, with implications for social class-based assortative mating (Henz and Mills, 2018), a factor likely to reproduce social class advantage. Though hypermobility among the rich and millionaire tax flight is a myth, it is younger, college-educated individuals who are more likely to move (Young, 2017). They then settle in a place in mid-life. Therefore, we need to take seriously the relationship between advantaged social backgrounds and geographic mobility.
The Class Pay Gap
We address the question of how social origins shape geographic mobility by building on the approach pioneered in Friedman and Laurison’s recent work on the ‘class ceiling’ (Friedman and Laurison, 2017, 2019; Laurison and Friedman, 2016). In this research they use British data to establish the existence of a ‘class-origin pay gap’, whereby those from working-class backgrounds who gain access to prestigious occupations end up earning substantially less than those from privileged backgrounds (Laurison and Friedman, 2016). One of the predictors of the class pay gap is whether people work in London or not; the class pay gap is larger in the capital, because there are larger firms that have higher inequalities in pay (Friedman and Laurison, 2017). This difference in the class pay gap in London compared with everywhere else suggests that geography is important. However, this work has not yet investigated the relationship between geographic mobility and the social origins of people in advantaged occupations.
Data and Methods
We use data from the Office for National Statistics (ONS) Longitudinal Study (LS), a 1% sample of linked census records of the population of England and Wales, which links individuals across the five decennial censuses between 1971 and 2011. 1 The LS also includes linked life events data (i.e. births, deaths and cancer registrations). The very large sample size and long duration make the LS an excellent resource for studying social and geographic mobility, especially given that long-distance mobility is a relatively rare event in most people’s lives.
Cohorts
Our analysis focuses on LS members employed in higher managerial and professional occupations. We link these individuals and the places where they live as adults to the places they lived in while growing up and their parents’ social class. Following the approach of Buscha and Sturgis (2018) we observe children at ages 10–16 while living with their parents. These individuals are followed up 20 years later when they are 30–36. By this age their occupational status has stabilised sufficiently for us to reliably measure their adult social class. 2 There are two cohorts in the LS data whom we can follow (Table 1). The 1965–1971 cohort are first observed as children in 1981 aged 10–16 at which time parental social class was measured. These individuals’ own social class was measured in 2001 (when they were aged 30–36). We also include the 1975–1981 cohorts in our analysis, measuring parents’ social class in 1991 and own social class in 2011 (boldface in Table 1). These two cohorts are the focus of our analysis. 3 We have a total sample size of 9824 individuals employed in higher managerial and professional occupations in these birth cohorts. Of these, we have information on distance of residential moves for 8118 people.
ONS LS cohorts used.
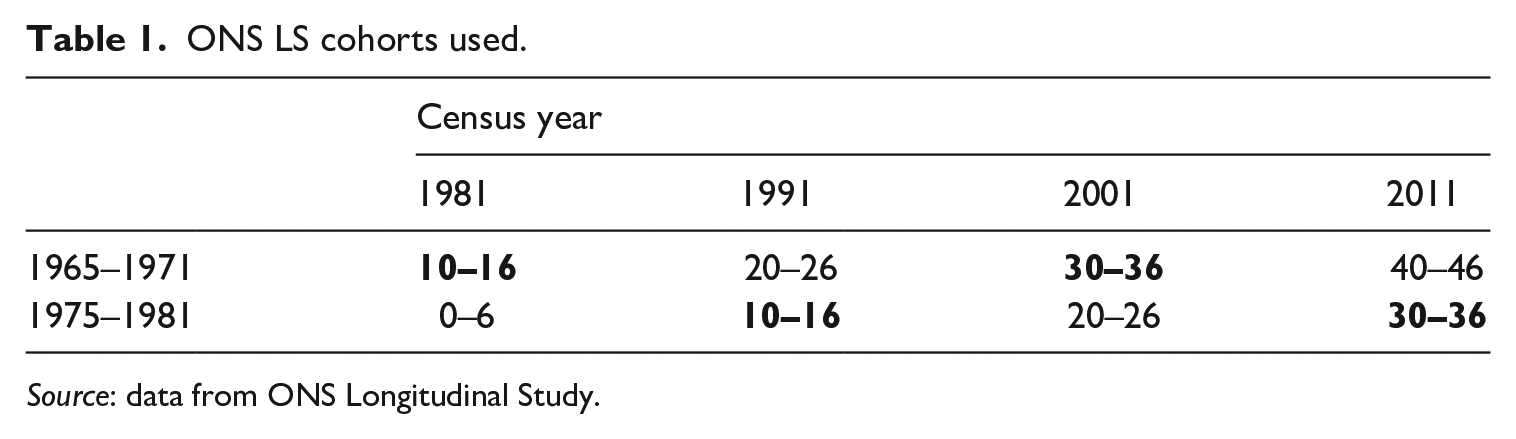
Source: data from ONS Longitudinal Study.
Social Mobility
We measure occupational class position using the National Statistics Socio-Economic Classification (NS-SEC) (Rose et al., 2005), derived from detailed occupation codes in the LS. 4 The NS-SEC’s underlying conceptualisation of class is that social class position is based on employment relations (of which occupations are indicators). NS-SEC classes are based on stable patterns of employment relations, making them well suited for long-term comparisons of occupational mobility even in cases of substantial labour market and occupational change (Bukodi et al., 2015; Buscha et al., 2021). We focus on LS members in higher managerial, administrative and professional occupations (Class 1). They include large employers and employees who exercise high levels of delegated authority, and deploy specialised knowledge or expertise in return for high levels of job security, earnings potential and fringe benefits (Goldthorpe and McKnight, 2004; Rose et al., 2005). We abbreviate these to ‘higher managerial and professional occupations’ in the remainder of the text. Information on their parents’ occupations when the LS member was aged 10–16 is used to measure social origin. 5 The measure of parental social class in the LS is particularly strong because it is based on parents’ actual occupation as recorded in the census, rather than people’s recollection of their parents’ occupation later in life.
We distinguish four possible social origins:
LS members whose parents also held higher managerial and professional occupations (NS-SEC 1) and are hence intergenerationally stable;
those whose parents held lower managerial and professional occupations (NS-SEC 2) – the short-range mobile;
those whose parents were in intermediate and clerical occupations, were self-employed or own account workers, or employed in lower supervisory and technical occupations (NS-SEC 3–5) – the mid-range mobile;
those whose parents were employed in semi-routine and routine occupations (NS-SEC 6–7) and were long-range mobile.
This specific breakdown is drawn from research on the ‘class pay gap’ (Laurison and Friedman, 2016) and maximises the comparability of our research with this literature. It also reflects our substantive interest in the top of the class distribution, by distinguishing higher and lower managerial and professional occupations, while combining classes at the middle as well as lower end of the class structure to reduce the risk of small sample sizes in some analyses. We focus our discussion on the stable, whom we describe as having ‘advantaged social class backgrounds’ (as their parents already held advantaged class positions), and the long-range mobile, whom we describe as having ‘disadvantaged social class backgrounds’.
Geographic Mobility and Area Affluence
Alongside their social mobility experiences, we are interested in the characteristics of the areas in which LS members grew up in and live in as adults. At each census wave we locate individuals in the Local Authority District (LAD) in which they live. LADs are the main unit of local government in the UK and have an average population of around 150,000 in 2011. They have been used in previous research on social and geographic mobility in the UK, and are an appropriate choice for several reasons (Buscha et al., 2021). There is substantial variation in class mobility rates and general area affluence between LADs that is not captured by broader regions (Buscha et al., 2021; see also Figure 1 and online Figure A2). Using more granular areas would lead to prohibitively small sample sizes when calculating area-level characteristics. 6 Finally, while LAD responsibilities vary over time and type of area they can have powers over aspects of housing, planning, the built environment, social services and education, all of which can shape the quality of local institutions and life outcomes for residents. To ensure comparability across time we combine some areas to adjust for changing boundaries between censuses, leaving us with 341 LADs.
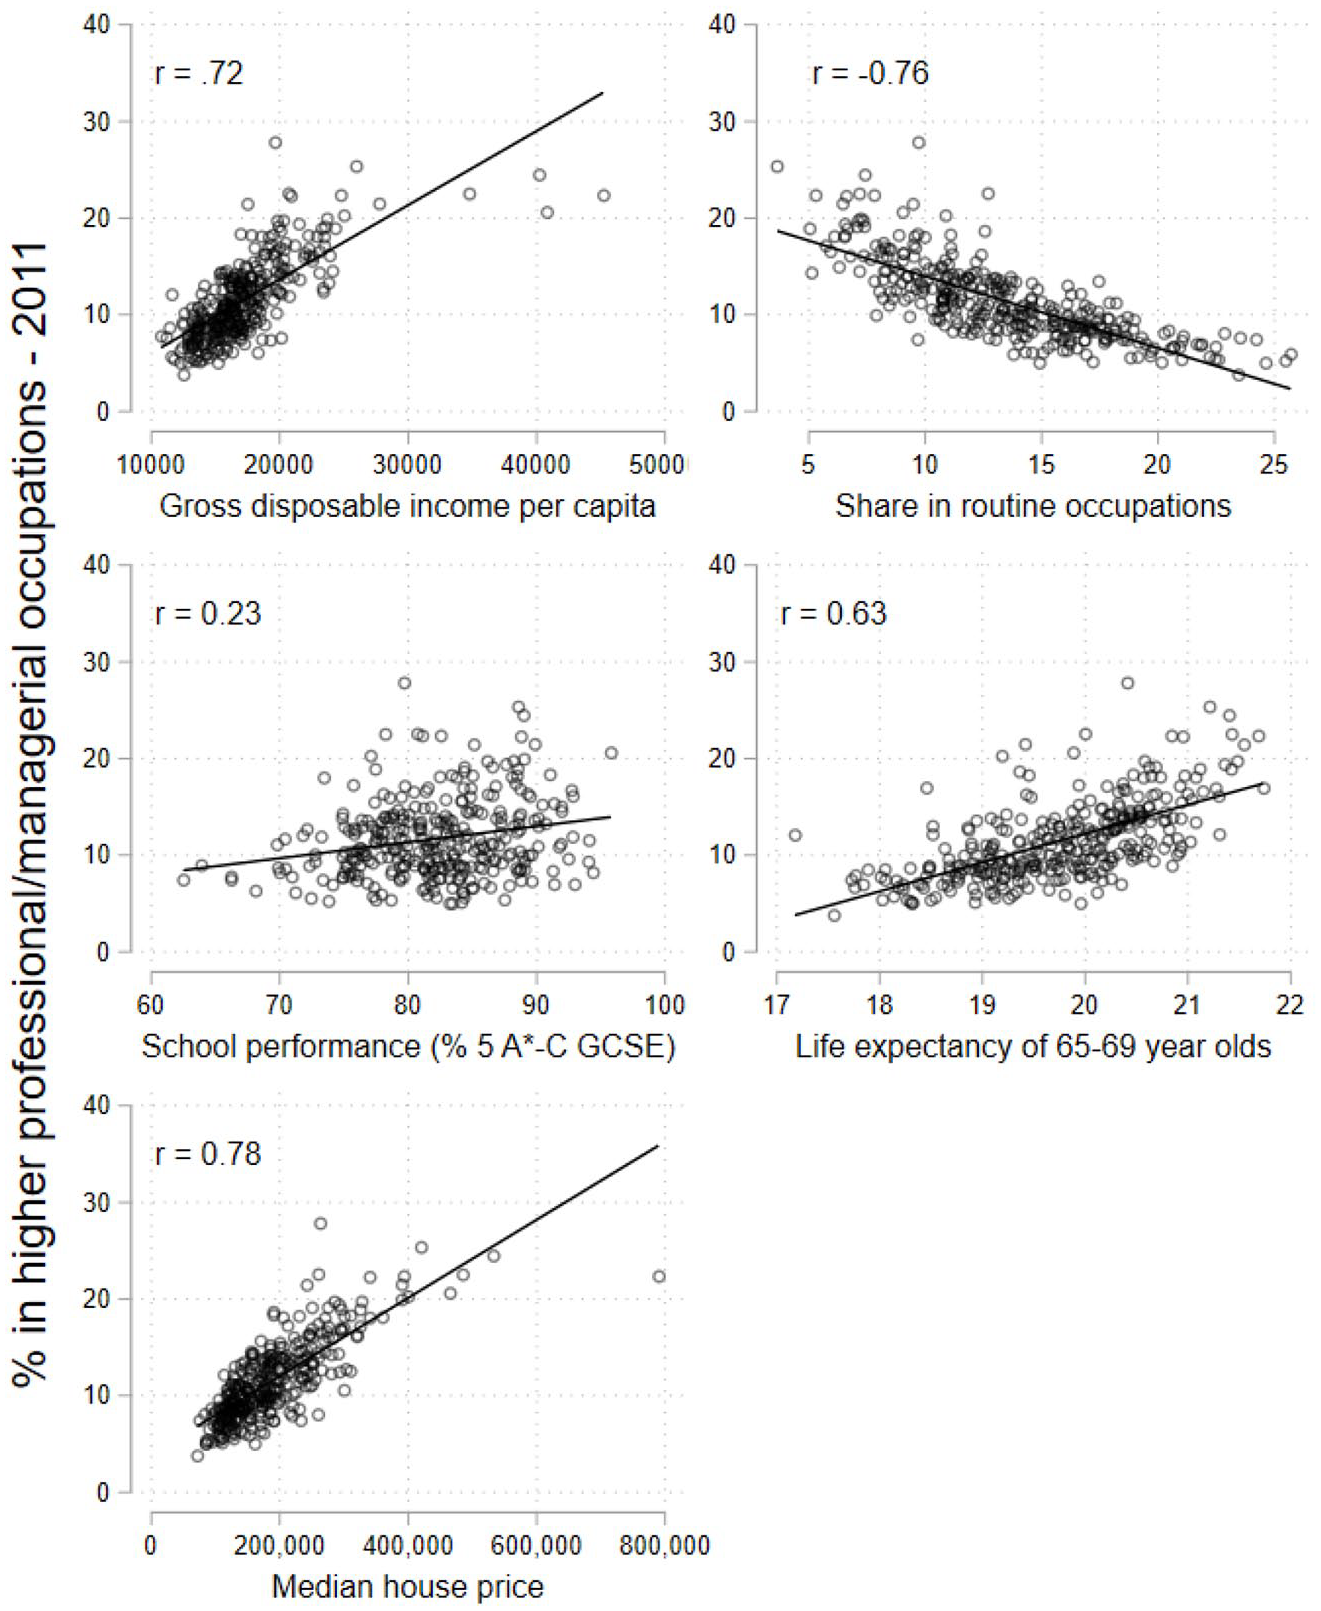
Associations between measures of area affluence. Percent of adults employed in higher managerial and professional and routine occupations from ONS LS; GDI per capita, life expectancy, median house price from ONS; school performance (England only) from Department for Education.
To measure the affluence level of the area that LS members live in we use the percentage of the adult population employed in higher managerial and professional occupations. 7 This is a measure of the extent to which our sample were surrounded by adults who hold advantaged occupations (when they were children) and by others in advantaged occupations (when they were adults). Figure 1 demonstrates that the percentage employed in higher managerial and professional occupations is highly correlated with a variety of other measures of affluence and advantage. Areas with many people employed in higher managerial and professional occupations in 2011 are more affluent (higher gross disposable income per capita: r = 0.72), have fewer people employed in routine occupations (r = −0.76), have greater housing wealth (median house price: r = 0.78), better health (life expectancy aged 65–69: r = 0.63) and schools that achieve better exam results (England only – 5 A*–C at GCSE: r = 0.23). As a result, the percentage employed in higher managerial and professional occupations is a good proxy for area affluence, and privilege in general.
Table 2 presents the distribution of people in higher managerial and professional occupations across LADs and years, alongside illustrative areas. There is a good deal of variation in all years, with areas at the 95th percentile having between three to four times greater percentages of people in managerial and professional occupations than areas at the fifth percentile. In some analyses we rank areas by their within-year percentage employed in higher managerial and professional occupations to adjust for structural changes in the size of this class.
Distribution of % of adult population in higher managerial and professional occupations.
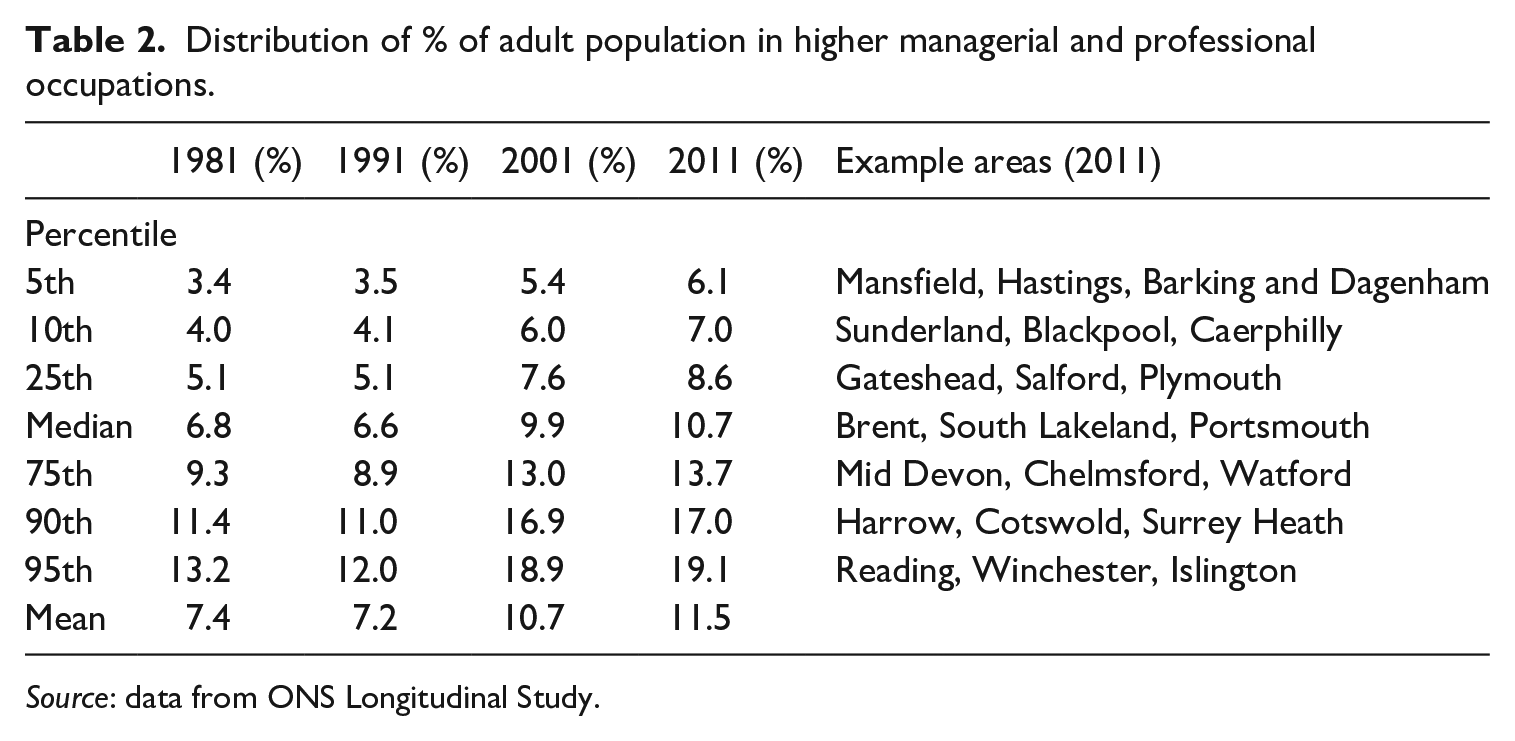
Source: data from ONS Longitudinal Study.
To investigate whether upward social mobility is linked to geographic mobility, we analyse how far individuals moved between successive censuses. From 1991 onwards, the LS measured the distance between an individuals’ residential address in the current census and their address in the previous census. Given our theoretical interest in geographic mobility between places with distinct sets of opportunities we focus on long-distance geographic mobility. We conceptualise this as moves over a longer distance than people typically commute, that are hence likely to require a job change, or at least expose individuals to a very different set of labour markets options.
In practice we treat long-distance moves as those further than 28 kilometres (17.4 miles) between pairs of censuses – the top quartile of distance moved. This specific cutoff was chosen partly for pragmatic reasons, to ensure an adequate sample size of movers. However, there is good evidence that moves above this distance typically represent a substantial change in labour market opportunities. A distance of 28 km (17.4 miles) is well above the average commuting distance (approx. 22.5 km or 14 miles) for the top quintile of earners in the UK (Department of Transport), and 77% of those employed in higher managerial and professional occupations commuted 20 km or less, and 88% 40 km or less (according to our analysis of 2011 Census microdata). We examine the sensitivity of our results to alternate distance cutoffs by rerunning our analyses using cutoffs ranging from a minimum of 5 km to a maximum of 150 km.
Covariates
In some analyses we control for variables that are likely to be associated with the affluence of the area an individual lives in, as well as their prospects for occupational and geographic mobility. At an individual level these include cohort (born between 1965–1971 vs 1975–1981), country of birth (born in UK vs born outside UK), ethnicity (White, Black, Asian and Mixed/other), education (no qualifications, lower secondary education, upper secondary/post-secondary non-tertiary, tertiary), parental housing tenure aged 10–16 (owner occupier, social renter, private renter) and number of long-distance moves over 28 km (0, 1 or 2).
At the area level we focus on very simple predictors. The first is the region the LS member lived in at age 10–16 and the second the region they lived in at age 30–36. Region at age 10–16 measures macro-level differences in the areas that the upwardly mobile come from relative to the intergenerationally stable, while region at age 30–36 adjusts for differences in patterns of macro-level geographic sorting. We operationalise this using 10 government office regions (East of England, East Midlands, London, North-East, North-West, South-East, South-West, Wales, West Midlands, Yorkshire and The Humber). The third area-level predictor directly measures the context of the area an individual lives in during childhood using the percentage employed in higher managerial and professional occupations in the local authority they lived in at age 10–16. Summary statistics for all variables can be found in Table A1 in the online Appendix.
Results
Social and Geographic Mobility
The social origins of higher managers and professionals are strongly associated with patterns of long-distance geographic mobility. Figure 2 plots the percentage of LS members in higher managerial and professional occupations who had moved more than 28 km between consecutive censuses by birth cohort and social origins. Of those with higher managerial and professional parents around 60% made at least one long-distance move, as did at least half of those from lower managerial and professional backgrounds. This contrasts starkly with those whose parents had semi-routine or routine occupations, where almost 70% did not move long-distance between any two censuses. Approximately half of those whose parents had intermediate occupations also did not move long-distance. These patterns are broadly stable across birth cohorts. Figure 3 shows that the association between social origin and the likelihood of moving holds over distance cutoffs ranging from 5 km to 150 km, for both cohorts. The probability of moving strongly declines with increased distance thresholds, but higher managers and professionals with advantaged social class backgrounds are most likely to move at all choices of distance cutoff.
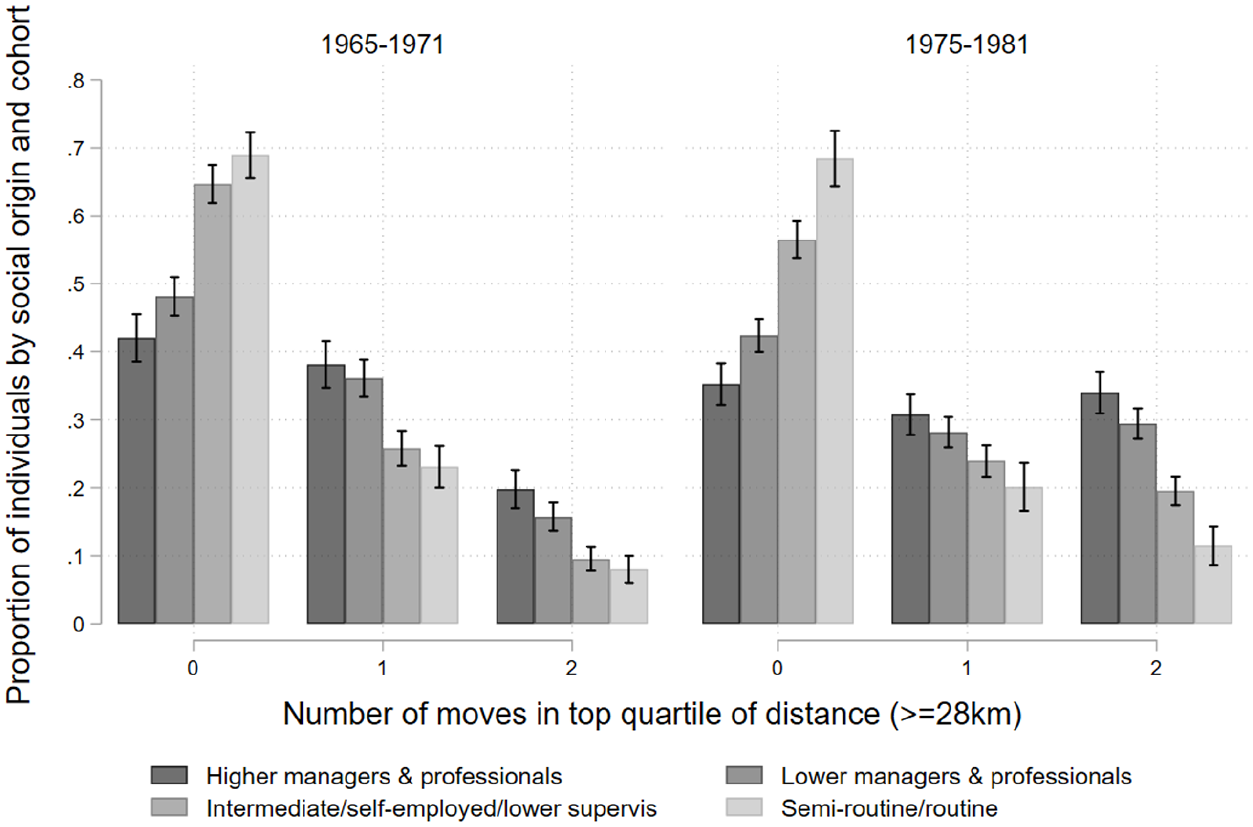
Long-distance moves and social origins of adults (age 30–36) with higher managerial and professional occupations. Data from ONS Longitudinal Study. Error bars are 95% confidence intervals. N = 8118.
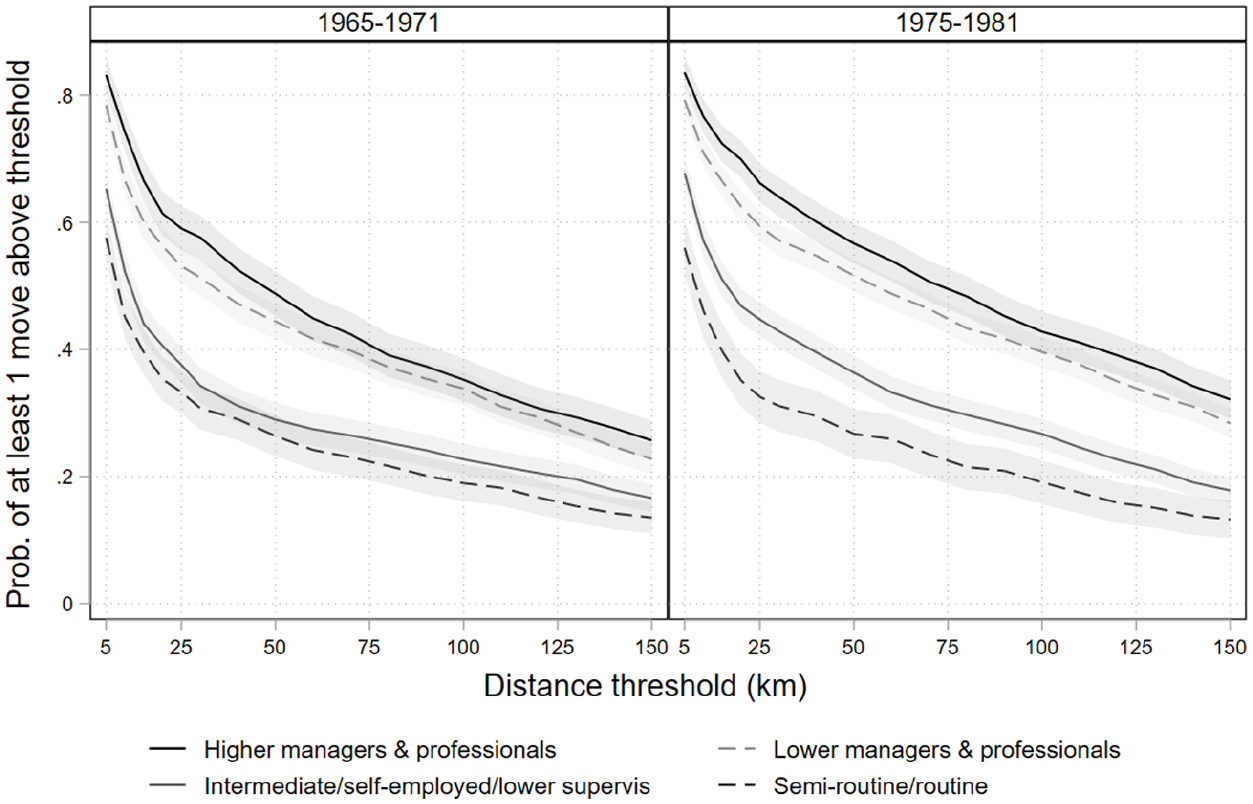
Association between social origin and probability of making a least one residential move greater than specified distance threshold. Data from ONS Longitudinal Study. Shaded areas are 95% confidence intervals.
The finding that there are large social background differences in the likelihood of making long-distance moves shows that geographic mobility should be seen as a correlate of an advantaged social background rather than just a predictor of upward social mobility. Further, these results show that geographic mobility is not required for upward social mobility – indeed the majority of higher managers and professionals from disadvantaged backgrounds are observed living in the same local authority aged 30–36 as the one in which they were observed aged 10–16.
Introducing the ‘Area Gap’ and ‘Moving Target’
So far, we have demonstrated a strong association between social origins and long-distance geographic mobility. In the next part of our analysis, we examine what happens when higher managers and professionals from less advantaged social origins do move long-distance. Do they end up in equally affluent areas as the intergenerationally stable?
Figure 4 plots the ranked percentile of higher managerial and professional share in areas that our sample lived in at ages 10–16 and 30–36 by their social origin and birth cohort. At age 10–16 those with parents in more advantaged occupational classes lived in more affluent areas. Specifically, those whose parents were themselves employed in higher managerial and professional occupations lived in areas at on average the 60th percentile, while those whose parents were employed in semi-routine and routine occupations grew up in areas at the 40th percentile. As we would expect, children with parents in higher social class occupations grow up in areas that are a good deal more affluent. Interestingly, this difference in area affluence between those with higher managerial and professional backgrounds and those with semi-routine/routine backgrounds persists essentially unchanged at age 30–36, even though the latter group have experienced substantial upward social mobility.
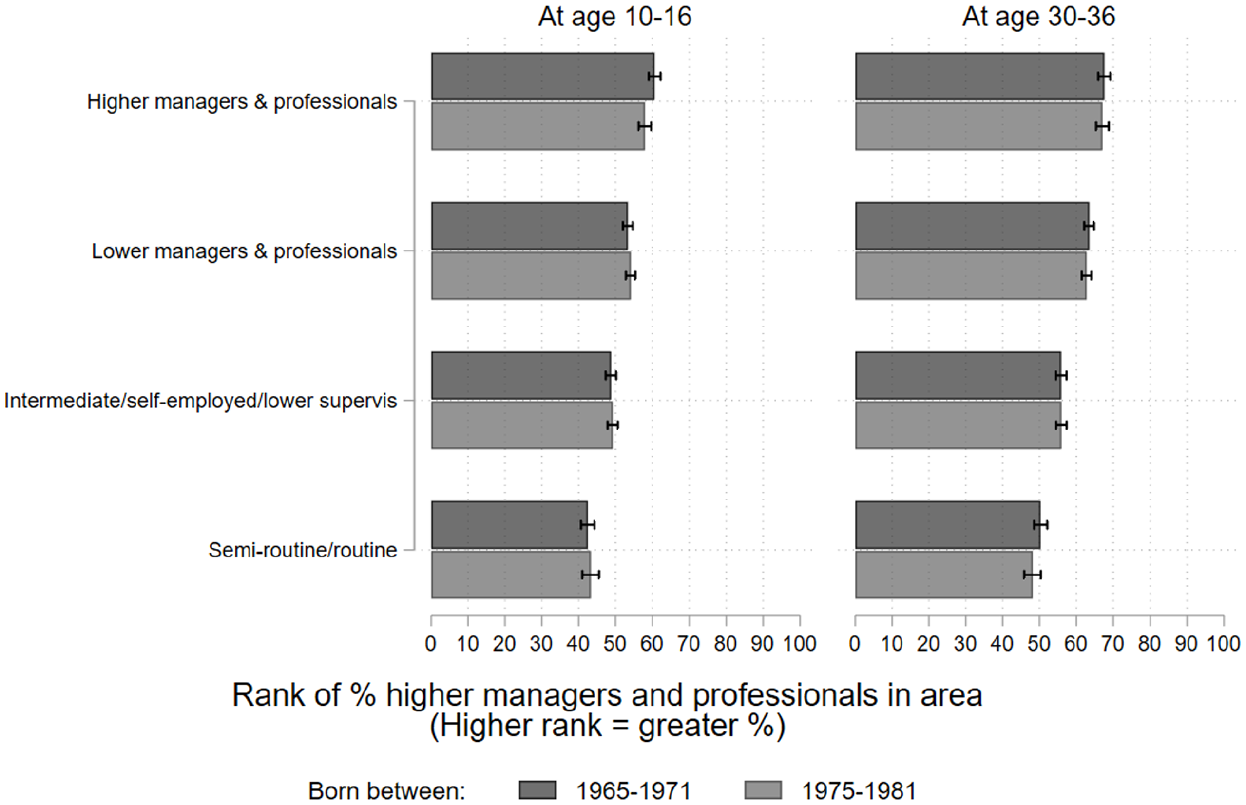
Area affluence at age 10–16 and 30–36 by social origin and birth cohort among those in higher managerial and professional occupations. Data from ONS Longitudinal Study. Error bars are 95% confidence intervals. N = 9824.
To what extent is this gap in area affluence at age 30–36 explained by the low rates of geographic mobility among the upwardly mobile, and to what extent is it explained by the kinds of areas that those who are upwardly mobile move to compared with the intergenerationally stable? We address this question by estimating the within-person change in the affluence of the areas that individuals lived in between ages 10–16 and 30–36. This change is disaggregated by social origin and number of long-distance residential moves. Estimates are presented in Figure 5.
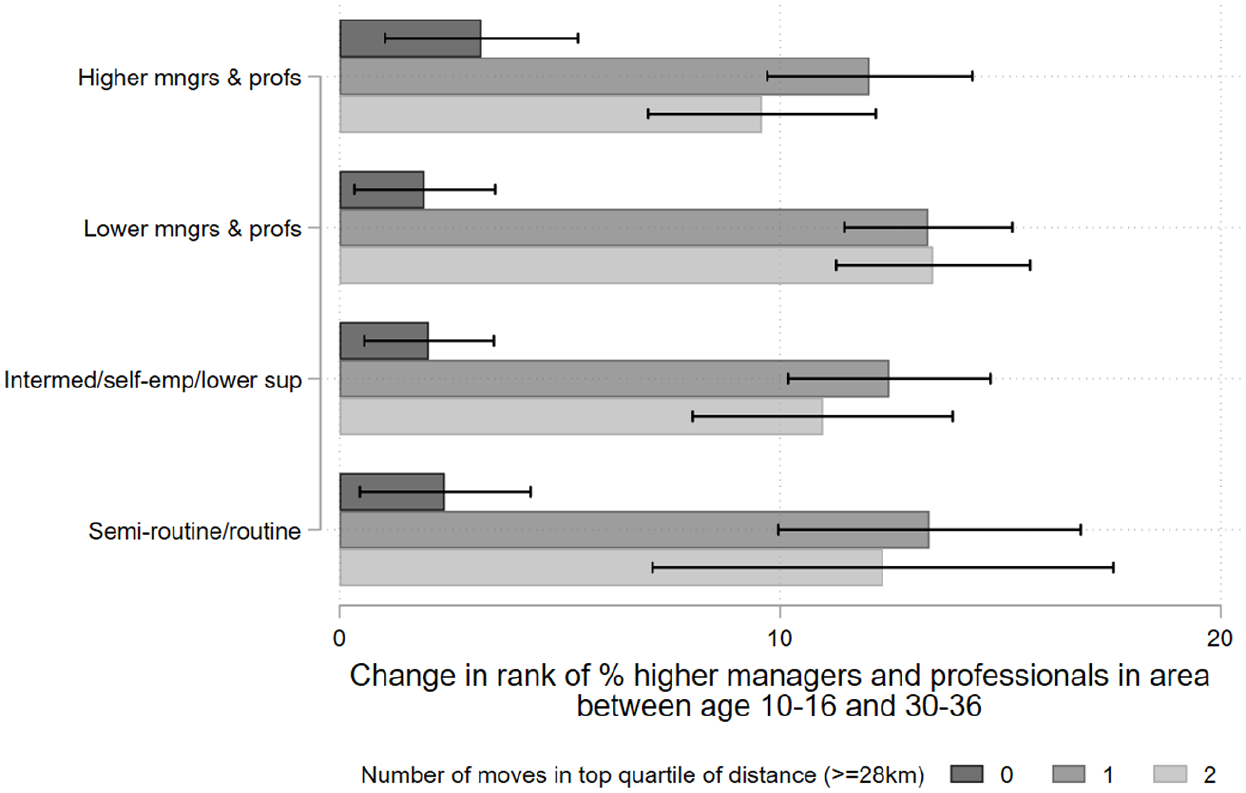
Change in percentile rank of higher managerial and professional % in area by number of long-distance moves and social origins. Data from ONS Longitudinal Study. Error bars are 95% confidence intervals. N = 8118.
Higher managers and professionals who have moved long-distance at least once end up in areas 10–13 percentile ranks more affluent than the areas they started in. Therefore, those who undertake at least one long-distance move generally upgrade in terms of the area they live in as adults (aged 30–36) compared with those they lived in during their childhood (aged 10–16). These patterns are essentially constant across individuals from different social backgrounds. When higher managers and professionals from less advantaged origins move areas, they (on average) end up in more affluent local authorities, but the same is true of those with advantaged origins. The implication is that despite their experience of social mobility, when the upwardly mobile move long-distance they are unable to ‘catch up’ with their peers from advantaged social backgrounds and remain in less affluent areas. In online Appendix 2 we show that this finding is robust to a wide range of alternate distance cutoffs.
We propose that the gap in area affluence between areas where upwardly mobile higher managers and professionals live and areas where the intergenerationally stable live, can be conceptualised as an ‘area gap’ analogous to the ‘class pay gap’ (Friedman and Laurison, 2019; Laurison and Friedman, 2016). We see those from relatively disadvantaged backgrounds aiming at a ‘moving target’ when they move long-distance to improve the affluence of their area relative to their peers from advantaged backgrounds.
Exploring Social Origin Differences in Area Affluence
Methods
Thus far we have established that upwardly mobile higher managers and professionals live in less affluent areas than their intergenerationally stable peers. However, there are of course likely to be a variety of other systematic differences between the intergenerationally stable and upwardly mobile in addition to social background. In this section we therefore present an exploratory analysis investigating the extent to which the ‘area gap’ can be accounted for by a range of individual and area-level socio-demographic variables.
To do so we estimate a series of linear regression models with affluence of the area an individual lived in at age 30–36, measured by the percentage of individuals with higher managerial and professional jobs in the area, as the response variable, and a categorical measure of social origin as the main explanatory variable. Because social mobility processes may be gendered (Breen et al., 2010) we estimate separate models for women and men. All models include fixed effects for cohort and cluster standard errors by local authority at age 10–16. All missing values are deleted listwise giving a sample size in all models of 5028 for men and 3090 for women. Since our outcome variable is a percentage and is thus bounded between 0 and 100, we re-estimate our regression models using two models designed for bounded outcomes: a fractional regression with a probit link, and a beta regression (with the response variable rescaled to run from 0 to 1). Predicted probabilities from these models can be found in online Appendix 3, with very similar substantive conclusions. We report results from linear regression models here for ease of interpretation.
Results: Predicting Area Affluence
Results for socio-demographic predictors can be found in Table 3. Models (1) and (3) establish a baseline for women and men respectively, and additional predictors are added in models (2) and (4).
Association between area affluence at age 30–36 and mobility trajectory conditional on socio-demographic covariates.
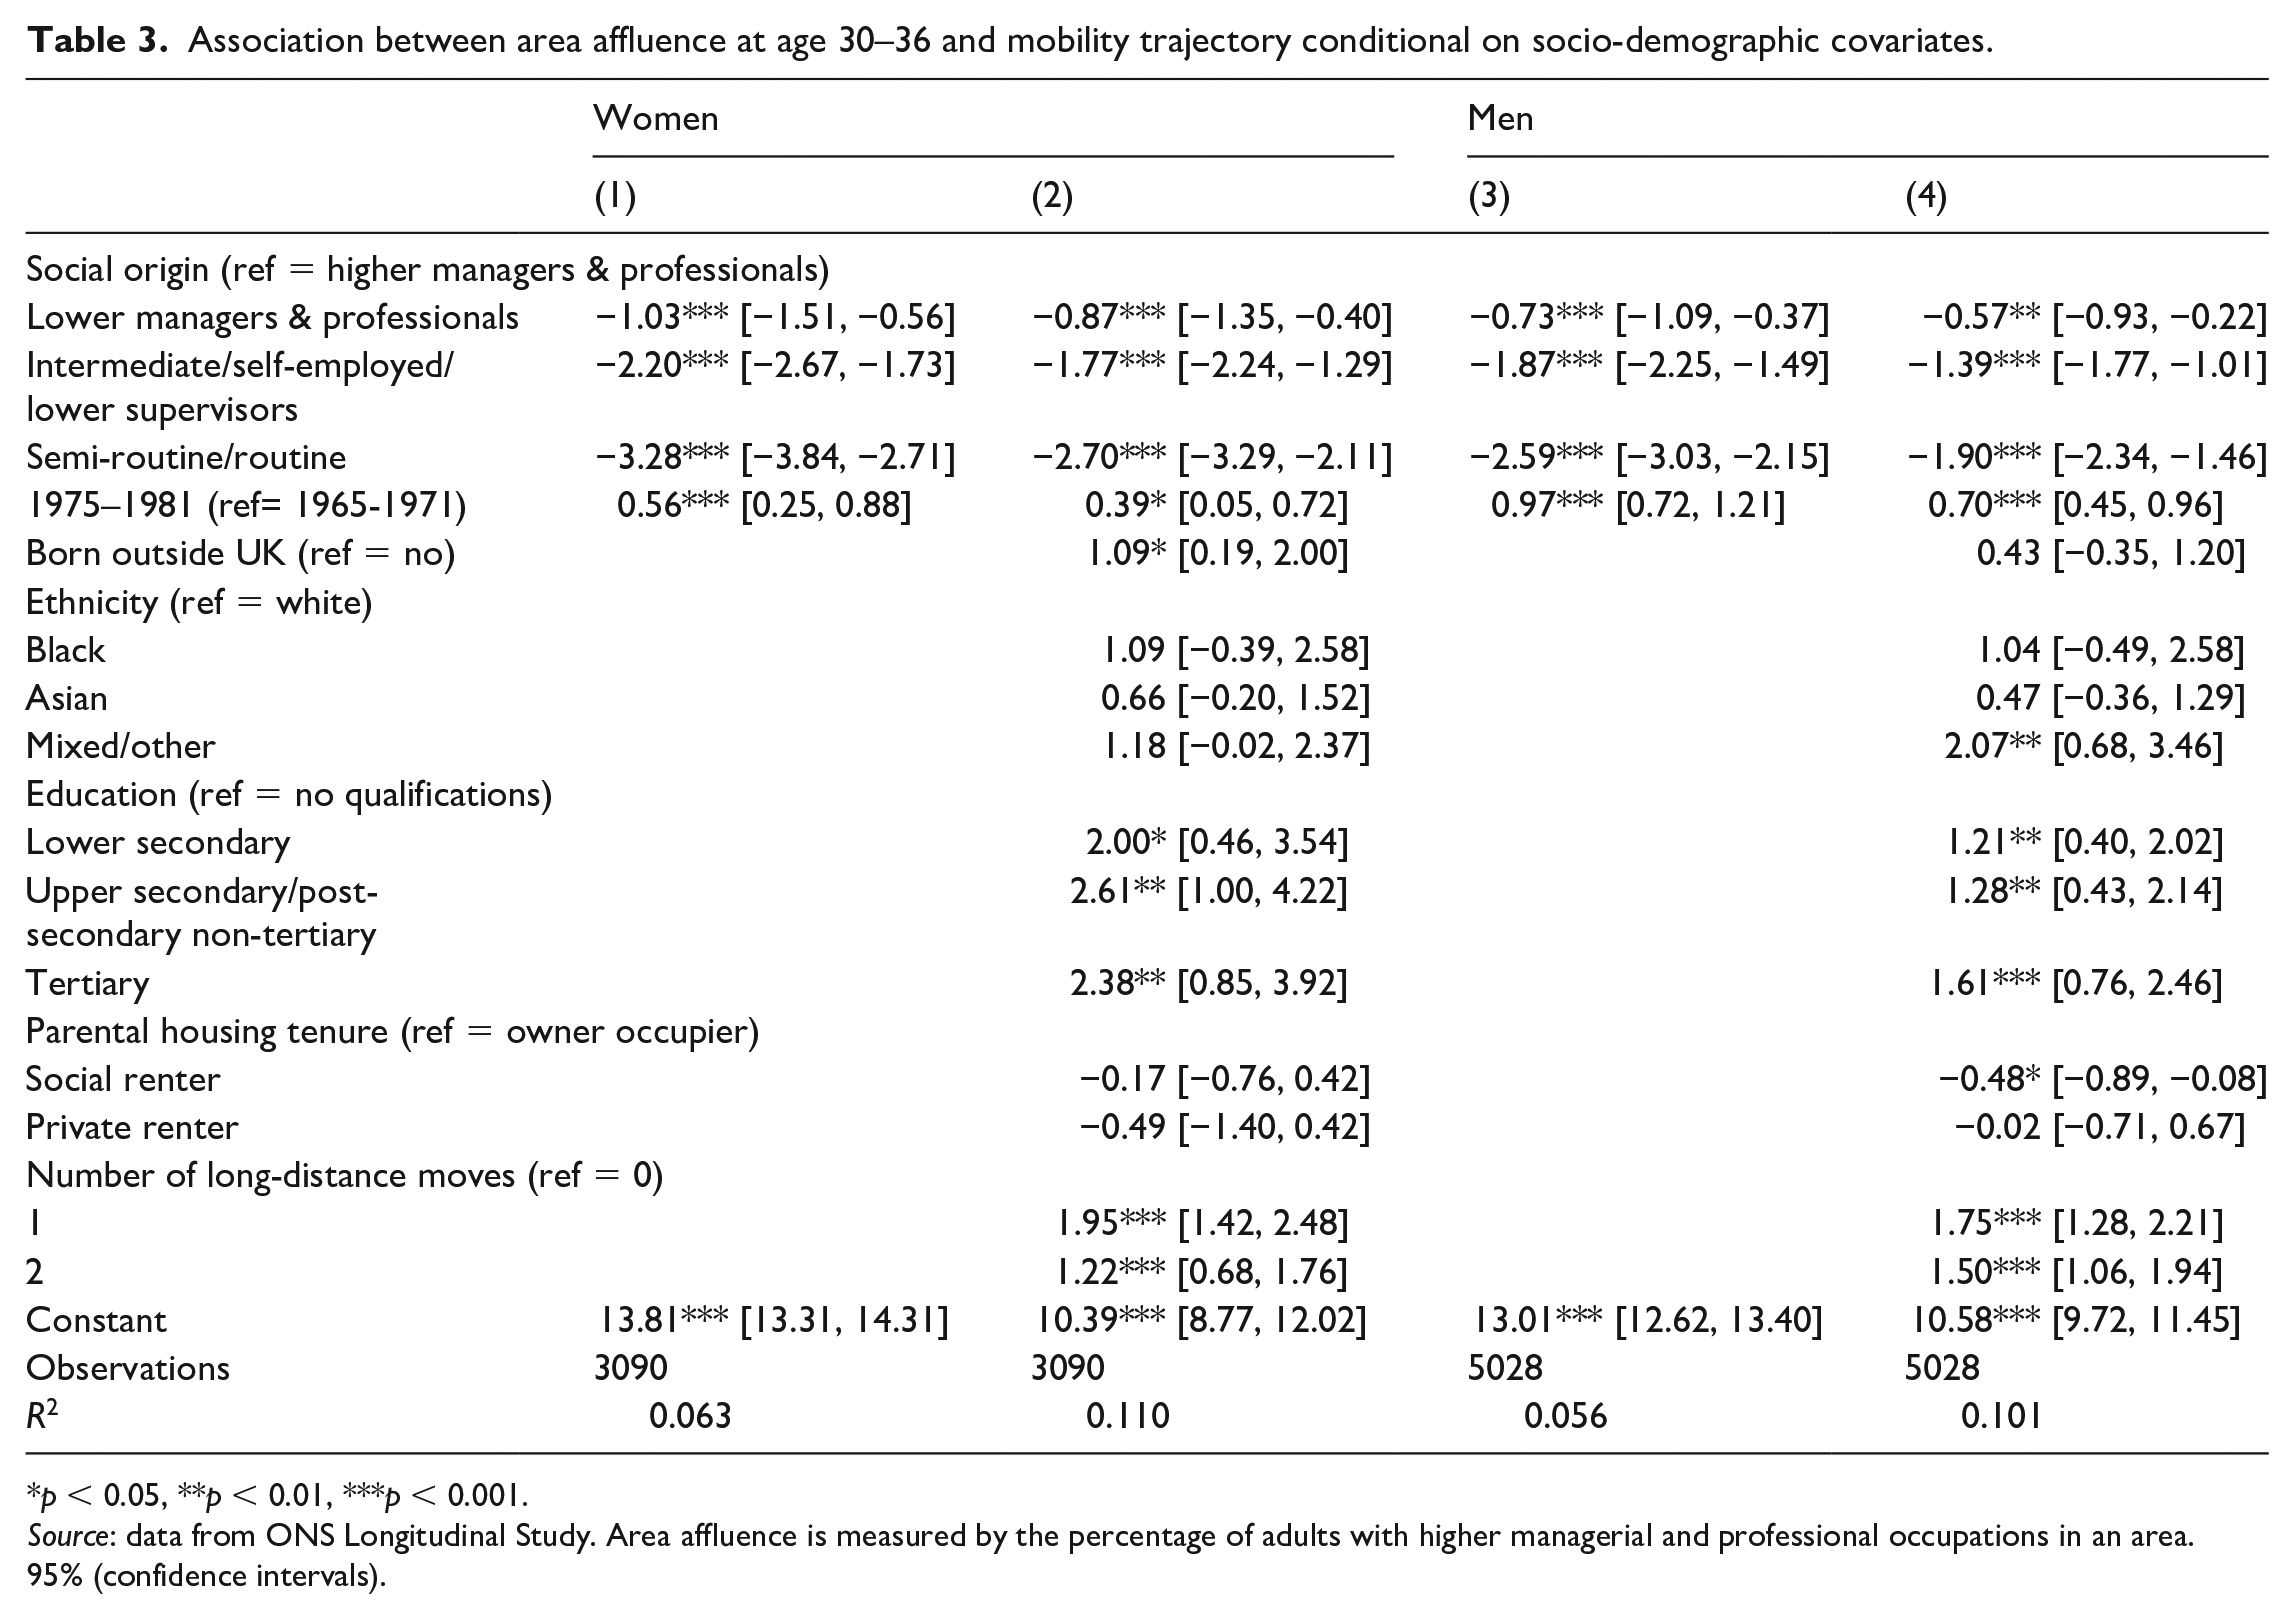
p < 0.05, **p < 0.01, ***p < 0.001.
Source: data from ONS Longitudinal Study. Area affluence is measured by the percentage of adults with higher managerial and professional occupations in an area. 95% (confidence intervals).
The baseline models provide further evidence for the existence of an area gap. On average, men whose parents had semi-routine or routine occupations live in areas with 2.6 percentage points lower higher managers and professionals compared with those whose parents held higher managerial and professional occupations. The corresponding coefficients for women are even larger, with the children of parents employed in semi-routine/routine or intermediate occupations living in areas with 3.3 and 2.2 percentage points lower higher managers and professionals, respectively. These differences in area affluence between upwardly mobile and stable higher managers and professionals are substantively meaningful. They equate to the difference between living in an area with a median percentage higher managers and professionals (in 2011) and living in an area at the 80th percentile for women or the 70th percentile for men. To exemplify, for women, having been long-range socially mobile compared with having been intergenerationally stable, corresponds to the difference between living in economically mixed areas on the South Coast (such as Portsmouth) and living in affluent areas of the London commuter belt (such as Brentwood).
In general, the socio-demographic variables available in the LS have only a limited ability to explain the association between social origins and area affluence. When socio-demographic covariates are included, there is a 2.7 percentage point difference in percentage higher managers and professionals between the long-range mobile and the intergenerationally stable for women (model 2), and a 1.9 percentage point difference for men (model 4). Examining the coefficients on other socio-demographic predictors reveals that, among our sample social background is one of the strongest predictors of area affluence. Indeed, the size of the coefficients on semi-routine/routine origins is comparable to that of tertiary education relative to no qualifications – and education is a powerful predictor of geographical sorting (Champion and Shuttleworth, 2017).
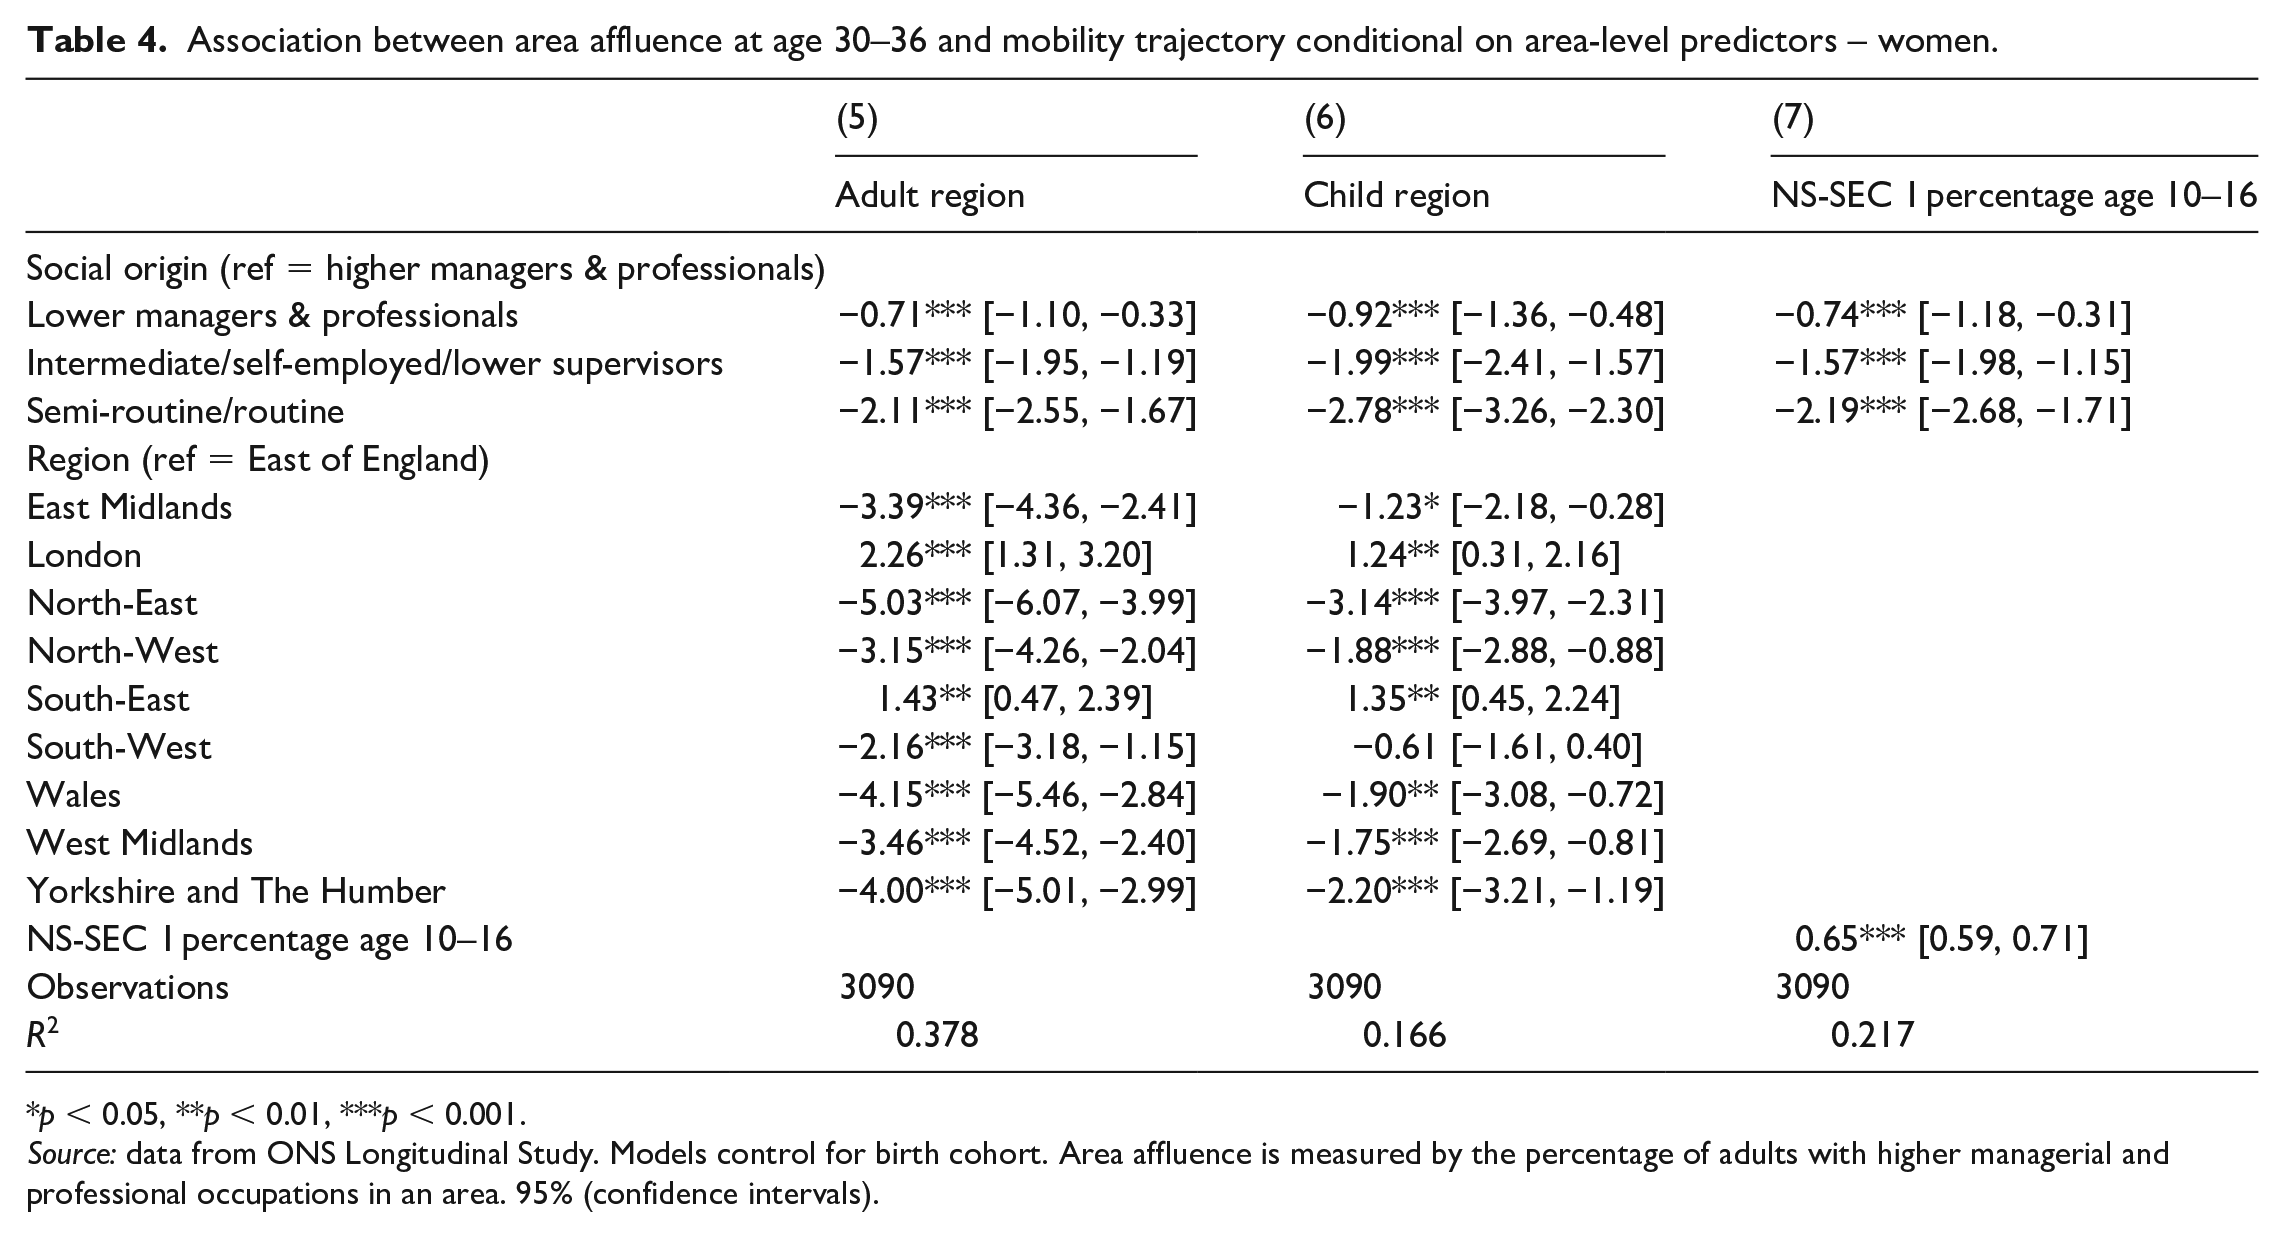
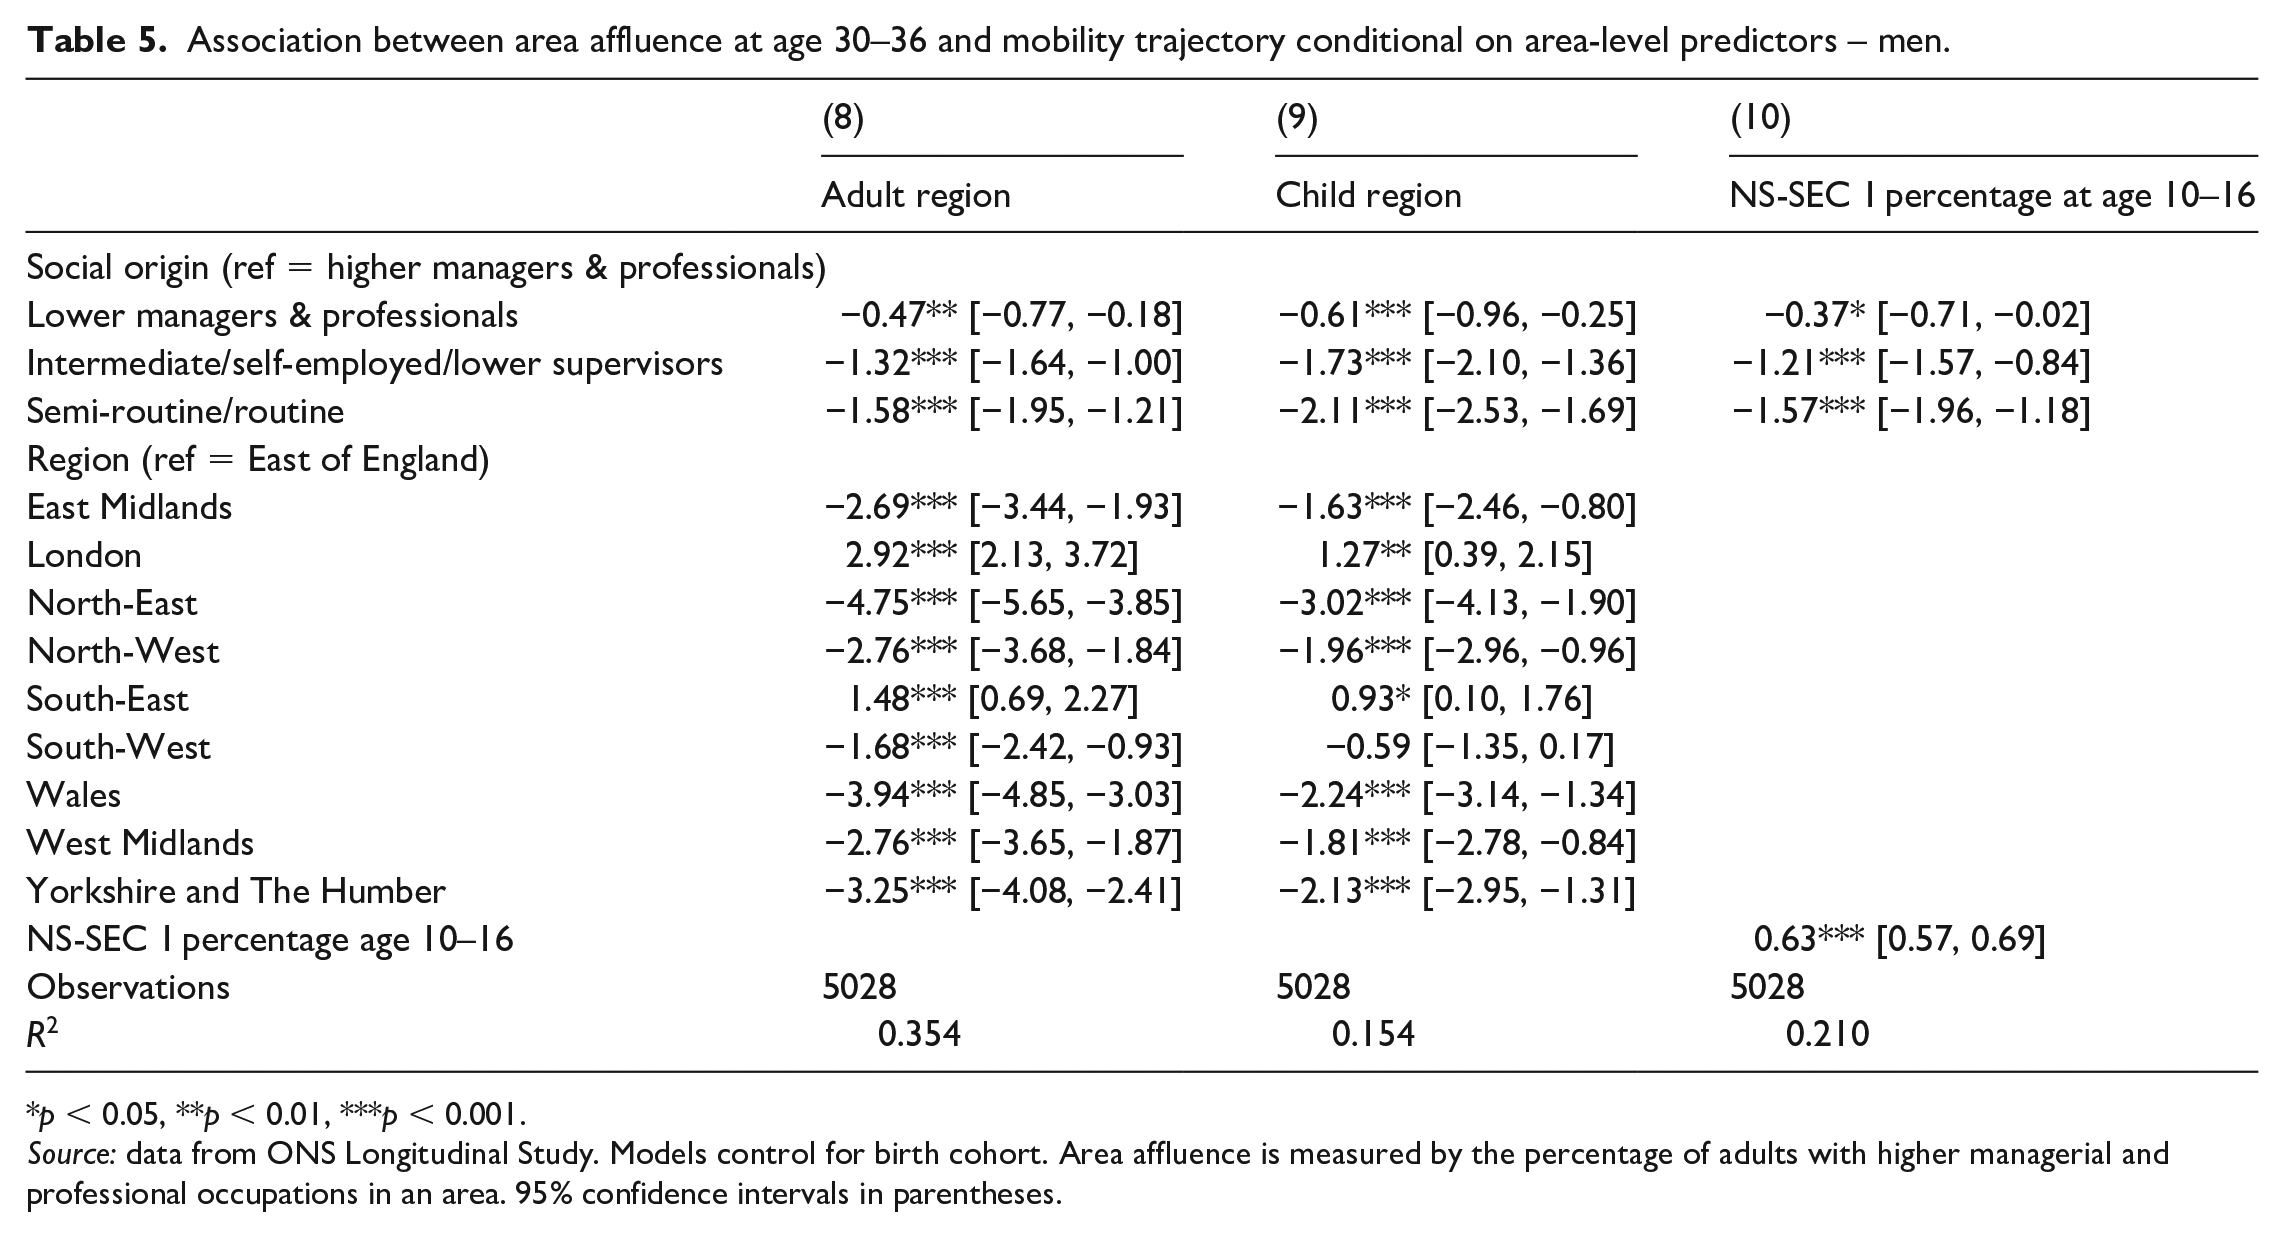
Estimates of the association between social origins and area affluence adjusted for regional-level variables can be found in Table 4 for women and Table 5 for men. Controlling for region at age 30–36 (models 5 and 8), region at age 10–16 (models 6 and 9) or area affluence at age 10–16 (models 7 and 10) reduces the strength of the association between social background and affluence of area lived in as an adult to a similar or slightly greater extent (relative to baseline models 1 and 3) as adjusting for socio-demographic variables.
Association between area affluence at age 30–36 and mobility trajectory conditional on area-level predictors – women.
p < 0.05, **p < 0.01, ***p < 0.001.
Source: data from ONS Longitudinal Study. Models control for birth cohort. Area affluence is measured by the percentage of adults with higher managerial and professional occupations in an area. 95% (confidence intervals).
Association between area affluence at age 30–36 and mobility trajectory conditional on area-level predictors – men.
p < 0.05, **p < 0.01, ***p < 0.001.
Source: data from ONS Longitudinal Study. Models control for birth cohort. Area affluence is measured by the percentage of adults with higher managerial and professional occupations in an area. 95% confidence intervals in parentheses.
The implication is that part but not all of the association between higher managers and professionals’ social class origins and area affluence at age 30–36 can be explained by macro-regional differences in the distribution of higher managers and professionals from different social backgrounds. Similarly, the results suggest that, in addition to social background, both the macro-regions and the local authorities where people with higher managerial and professional occupations grew up in shape the affluence of the areas they live in as adults.
Discussion and Conclusions
This article presents the first longitudinal analysis of social and geographic mobility into Britain’s higher managerial and professional occupations. We build on research examining how social background continues to shape the fortunes of those who are upwardly mobile into higher managerial and professional occupations (Friedman and Laurison, 2019; Laurison and Friedman, 2016). We combine this with a focus on geography, drawing on research that examines geographic differences in mobility rates and the effect of place on mobility chances (Buscha et al., 2021; Chetty et al., 2014b; Connor and Storper, 2020). While residential mobility may provide an important avenue for upward mobility for those born in impoverished neighbourhoods (Chetty and Hendren, 2018), we find that among those with advantaged occupations it plays an important role in the intergenerational reproduction of advantage.
Our novel contribution is twofold. First, while much existing literature has investigated the consequences of geography for social mobility, we reverse the analytic lens to ask how social origins shape patterns of long-distance geographic mobility. We find that higher managers and professionals from advantaged social origins are substantially more likely to make long-distance residential moves than those who were socially mobile, consistent with existing literature on residential mobility and migration (Champion et al., 2014; Gamsu and Donnelly, 2020; Horowitz and Entwisle, 2020). The implication is that geographic mobility is a correlate of advantaged social origins rather than a determinant of an advantaged adult class position. Indeed, geographic mobility is not required for upward social mobility – the majority of the long-range upwardly mobile are observed living in the same local authority aged 30–36 as the one in which they were observed aged 10–16. Thus, we suggest that the ability to change places is an important part of advantaged class origins.
Our second, and main, contribution is to investigate how social origin shapes the kinds of places that higher managers and professionals move to when they are residentially mobile. On average, higher managers and professionals from advantaged backgrounds grew up in more affluent areas than those from less advantaged backgrounds. This ‘area gap’ persists during adulthood. This is because, regardless of social background, when higher managers and professionals have moved long-distance, they tend to move to more affluent areas. As a result, even when the upwardly socially mobile (who grew up in less advantaged places and are less likely to move long-distance) do move area, they are unable to close the gap to their intergenerationally stable peers who started out in more affluent areas. The socially mobile hence face a ‘moving target’. Thus, geographic mobility does not eliminate the place-based legacy of a disadvantaged upbringing. Geographic disadvantage thus remains with upwardly mobile individuals, even if they move area.
Our findings have broader significance for the reproduction of inequalities because social background inequalities in access to affluent areas can produce long-term cumulative advantage through a geographic ‘Matthew effect’ (Merton, 1968). Geography shapes access to opportunities to accumulate wealth including the highest paying jobs, higher house prices and opportunities for entrepreneurship. The persistent gap in area affluence between long-distance moving higher managers and professionals who were upwardly socially mobile and those who were intergenerationally stable, suggests that those with the greatest initial resources from their family background are differentially able to access areas with the greatest opportunities for future returns. As a result, class origin differences in access to advantaged areas are likely to have consequences for the advantages individuals transmit to their children, reinforcing the intergenerational reproduction of class inequalities (Chan and Boliver, 2013; Pfeffer and Killewald, 2018).
Future research should aim to integrate the class area gap with existing research on the class pay gap, to provide a more comprehensive picture of the barriers facing those who are upwardly mobile. Our analysis is descriptive in intent, and we have had little to say about the mechanisms underlying the class area gap, or its link to pay differences, in part because of the relatively limited set of variables available in the LS. One especially important mechanism that future research should pay attention to is the intergenerational transmission of wealth (Toft and Friedman, 2021).
Parental wealth plays an important role in determining transitions to homeownership, and the children of higher managers and professionals are likely to have wealthier parents and hence receive larger transfers of wealth (either as inheritance or inter-vivos gifts) (Pfeffer and Killewald, 2018). They will be able to afford houses in more expensive areas, net of income, than their counterparts from less advantaged backgrounds. As a result, wealth is likely to play an important role in explaining why those from advantaged backgrounds move to more affluent areas than the upwardly mobile. The effect of intergenerational transfers of wealth on residential location may be exacerbated if stable higher managers or professionals have more opportunities to meet and choose partners with similarly privileged backgrounds (Henz and Mills, 2018). Further, the greater ability of individuals with advantaged backgrounds (and their partners) to access housing in expensive areas may play an important role in shaping the class pay gap, which has a strong regional component related to the preponderance of highly paid jobs in London (Friedman and Laurison, 2017).
The financial resources available to the children of higher managerial and professional parents may be especially relevant at critical junctures in the transition to adulthood. Parents with substantial assets to draw on may give their children opportunities to make long-distance residential moves in order to attend higher-status universities, with implications for attaining prestigious graduate employment (Holdsworth, 2009). Similarly, affluent parents will be better able to facilitate post-education moves to high cost but opportunity-rich areas such as London or the South-East. London is especially relevant because its labour market provides risky and initially low-paid opportunities such as internships (especially in industries such as law, media and creative industries) that may later lead to opportunities for high-status and highly paid employment (Leonard et al., 2016).
The decadal frequency of our data makes it difficult to identify these higher frequency patterns of residential moves. Future research could use panel studies with more frequent data collection to understand the roles that geographic mobility and social origins play in the evolution of professional-managerial careers, from formative area context, to the process of leaving home and completing education (Horowitz and Entwisle, 2020), to later career progression (Champion et al., 2014).
In a context of high top-income inequality, social mobility is often seen as an important check on entrenched multigenerational privilege. However, recent work has cast doubt on this role of social mobility, by showing that social origins exert a long-term influence, disadvantaging even those who have been long-range upwardly mobile. We hope that this article will inspire further work to understand the role that geography and residential mobility play in transmitting privilege across generations.
Supplemental Material
sj-docx-1-soc-10.1177_00380385221113669 – Supplemental material for Moving on up? How Social Origins Shape Geographic Mobility within Britain’s Higher Managerial and Professional Occupations
Supplemental material, sj-docx-1-soc-10.1177_00380385221113669 for Moving on up? How Social Origins Shape Geographic Mobility within Britain’s Higher Managerial and Professional Occupations by Katharina Hecht and Daniel McArthur in Sociology
Footnotes
Acknowledgements
We are grateful to two anonymous reviewers for their helpful and constructive comments, and to the teams at CeLSIUS and the ONS for their support. We thank Annette Lareau, Ashleigh Cartwright, Carl Cullinane, Sherelle Ferguson, Peter Francis Harvey, Blair Sackett, Doron Shiffer-Sebba and Alison Sizer for their thoughtful feedback on previous versions of this article. We thank participants at the Cluster of Excellence ‘The Politics of Inequality’ colloquium at the University of Konstanz, the ASA Annual Meeting and the BSA Annual Conference in 2021 for their comments. For guidance and support, we gratefully acknowledge Mike Savage and Sam Friedman, research directors of the Sutton Trust project.
The permission of the Office for National Statistics to use the Longitudinal Study is gratefully acknowledged, as is the help provided by staff of the Centre for Longitudinal Study Information & User Support (CeLSIUS). CeLSIUS is supported by the ESRC Census of Population Programme (Award Ref: ES/V003488/1). The authors alone are responsible for the interpretation of the data. The work contains statistical data from ONS that is Crown Copyright. The use of the ONS statistical data in this work does not imply the endorsement of the ONS in relation to the interpretation or analysis of the statistical data. This work uses research datasets that may not exactly reproduce National Statistics aggregates.
Funding
The authors disclosed receipt of the following financial support for the research, authorship and/or publication of this article: this research was funded by the Sutton Trust. Further, Katharina Hecht also received funding from the Deutsche Forschungsgemeinschaft (DFG – German Research Foundation) under Germany’s Excellence Strategy – EXC-2035/1 – 390681379 and a postdoctoral fellowship at the Andrea Mitchell Centre for the Study of Democracy at the University of Pennsylvania.
Supplemental material
Supplemental material for this article is available online.
Notes
References
Supplementary Material
Please find the following supplemental material available below.
For Open Access articles published under a Creative Commons License, all supplemental material carries the same license as the article it is associated with.
For non-Open Access articles published, all supplemental material carries a non-exclusive license, and permission requests for re-use of supplemental material or any part of supplemental material shall be sent directly to the copyright owner as specified in the copyright notice associated with the article.