
Abstract
According to class theory, social class boundaries are akin to social mobility patterns. This study explores these patterns by looking at co-occurring occupations among siblings. The author uses data from Norway's population-wide registers to analyze occupational co-occurrences among siblings across 98 occupations. The association is analyzed in relative terms: how often occupations are held by both siblings compared to what would be expected if there was no statistical association between siblings’ occupations. The Mobility Network Clustering Algorithm (MONECA) identifies groups of occupations that are strongly connected. The analysis shows that siblings tend to have the same occupation. Furthermore, non-manual and manual occupations are identified as two separate groups of strongly connected occupations. The analysis also shows a more differentiated structure in occupations, with increased tendencies for siblings to be in more narrow subgroups of the occupational structure. In the non-manual group, occupations in management, finance, business, and sales form a separate cluster from administrative workers, the professions, and cultural-artistic occupations. Beyond this, the occupational structure is differentiated into smaller subgroups.
Keywords
Introduction
There has been a recent trend in mobility research to study social reproduction within more fine-grained categories of occupation (Jonsson et al., 2009; Ruggera and Barone, 2017) and education (Van de Werfhorst and Luijkx, 2010; Andrade and Thomsen, 2017; Helland and Wiborg, 2019). However, the connection between different disaggregated occupations and educational fields has remained understudied. In this article, new light is shed on which occupations are likely to co-occur in families. I use a novel approach, where the occupational destinations of siblings across 98 occupational categories are analyzed using a network cluster algorithm. This analysis identifies groups of strongly connected occupations.
The design builds on sibling data, which has been favored because it is difficult to measure all the relevant aspects of family background (Sieben and De Graaf, 2003). While a few studies on siblings’ occupations exist (e.g. Hauser and Mossel, 1985; Sieben, 2001; Conley and Glauber, 2005; Sweetser, 1973; Sweetser, 1975), there is still little known about which occupations are more likely to appear together in sibling groups.
To analyze occupational co-occurrences among siblings, I use the Mobility Network Clustering Algorithm (MONECA) developed by Toubøl and Larsen (2017). MONECA is built on a network analytical approach and provides a new inductive method to systematically analyze occupational mobility tables. In the current study, the occupations of sibling pairs are treated as ties between the respective occupations in a mobility matrix. This matrix forms the basis for analyzing the relative probabilities of occupations to co-occur in sibling pairs. The clustering is based on a principle of connectedness or linkage between occupations and identifies groups of occupations tightly connected in social reproduction.
Using the outlined approach on population-wide Norwegian register data, I analyze the occupational destinations of siblings across 98 occupational categories. I address two main questions: Which occupations have a high relative probability of co-occurring in sibling pairs? What are the wider patterns in which occupations co-occurs? To answer these questions, I first look at whether siblings often have the same occupation. Next, I analyze occupations that tend to co-occur among siblings. For this purpose, I turn to the clustering algorithm that clusters the most intensely tied occupations. This inductive analysis reveals both important divisions and nuanced differentiation in the occupations in which siblings tend to end up, without presupposing where the connections are strongest. These patterns are relevant in understanding underlying tendencies toward increased social interconnection between occupational positions in contemporary Norway.
I start by discussing inductive approaches to social mobility before discussing occupations and their interconnections and outlining the literature on sibling associations.
An inductive approach to social mobility
Inductive approaches to social mobility use procedures to identify aggregate structures in mobility without presupposing which categories are grouped at an aggregate level. Most studies of social mobility have been deductive, investigating assumptions about the aggregate structure of occupational mobility, usually by testing which parsimonious model best fits the data through log-linear modeling (e.g. Erikson and Goldthorpe, 1992). This research has focused on identifying universal trends and models of social mobility and has paid less attention to patterns “highly specific to time and place” (Erikson et al., 2012: 222). Inductive approaches identify structures in the data and, thus, patterns specific to time and place are given a central role. This represents both a limitation and a strength; however, if national differences matter regarding individuals’ possibilities in the social structure (e.g. Barone, 2019), specifics of time and place are important.
Inductive studies are good at identifying structure in data and have been used to aggregate categories in the mobility table (Goodman, 1981). Breiger (1981) proposed that intergenerational mobility patterns could be used to analyze social class by Weber's (1978) definition of social classes as class positions where mobility is easy and typical. Thus, inductive approaches can show where socio-cultural commonalities are likely to occur in the occupational structure. Snipp (1985) conducted an analysis similar to that of Breiger on intragenerational mobility. A pair of newer, inductive studies on occupational career mobility have analyzed a much higher number of occupational categories through a network analytical approach, where the mobility matrix is treated as a weighted network, thus finding a much larger number of labor market segments (Toubøl and Larsen, 2017; Cheng and Park, 2020). The idea of using a network approach to study social mobility dates back to Beshers and Laumann (1967) but has lately become more common (Melamed, 2015; Schmutte, 2014; Lambert and Griffiths, 2018).
In the current study, I investigate occupational co-occurrences among siblings by applying Toubøl and Larsen's (2017) algorithm to study social mobility. Like their study, the theoretical rationale for the current study follows Weber's (1978) and Giddens’ (1973) theories on social classes. Following Weber (1978), we can view patterns in social mobility to be akin to social class boundaries. A more specified interpretation is that the patterns in occupational co-occurrences capture the outcome of what Giddens (1973) thinks of as structuration of social classes: they show underlying tendencies toward increased social interconnection between certain market positions (captured here as occupations).
Connections between disaggregated occupations
In recent decades, microclass theorists have argued that big “aggregate” classes should be disaggregated to focus on processes at an occupational level (Grusky and Sørensen, 1998; Grusky and Weeden, 2001; Grusky and Weeden, 2002; Weeden and Grusky, 2005). They claim that occupational organizations are central in securing economic resources for their members and that closure most often occurs at an occupational level. Furthermore, people identify with occupations and express their career aspirations in occupational terms (Grusky and Weeden, 2001; Weeden and Grusky, 2005). Accordingly, the transference of opportunities across generations cannot be properly understood unless we focus on more specific occupations. Microclass theorists have thus questioned whether big-class schemes misrepresent the structure of social mobility (Grusky and Sørensen, 1998). Following this, studies have documented immobility at the micro-level, both in occupations and in educational fields. A good share of macro-class immobility takes the form of occupational reproduction (Jonsson et al., 2009). Children often inherit their parents’ profession, and within the service class, occupational mobility occurs disproportionately within the professions (Ruggera and Barone, 2017). Individuals’ field of education is influenced by the domain of their fathers’ occupations (Van de Werfhorst and Luijkx, 2010) and children tend to enter the same (or similar) educational field as their parents, especially when the parents have high-level degrees (Andrade and Thomsen, 2017; Helland and Wiborg, 2019). Thus, aggregate categories fail to capture the limited range of social mobility of many individuals.
While microclass theorists focus on unit occupations, they consider both reproduction- and homogeneity-inducing mechanisms to extend beyond occupational boundaries. Unequally distributed resources that drive social reproduction, such as human and cultural capital, social networks, and economic resources, can all have payoffs across occupations, thus creating complex patterns of mobility between occupations, without necessarily taking a big-class form (Jonsson et al., 2009). Although mechanisms such as selection and socialization most extensively work at an occupational level (Grusky and Weeden, 2002), processes creating cultural and social homogeneity can extend beyond occupational units. They can, for example, take on a weakened class-like form in post-secondary schools (Weeden and Grusky, 2005).
What else creates connections between certain occupations? First, work-life mobility across occupations is substantial and it is possible to identify groups of occupations intensely connected through career mobility (Toubøl and Larsen, 2017; Toubøl et al., 2013; Cheng and Park, 2020). If siblings tend to enter the same occupation, occupations strongly connected in career mobility could also tend to co-occur. Second, cross-occupational connections could follow educational reproduction (Andrade and Thomsen, 2017) if multiple occupational paths follow the same occupations. Third, many are likely to find employment within their local labor market (Leicht, 2020). Different labor markets comprise different industries (e.g. Fitjar and Timmermans, 2017). Statistical associations between occupations can thus arise as siblings participate in the same local labor market and the occupations they enter are recurringly located together across such local labor markets.
Disaggregate cross-occupational mobility patterns are understudied, but increased mobility has been reported between “similar microclasses” in seafaring occupations, the health sector, the financial sector, and literary occupations (Jonsson et al., 2009: 1012). This has been analyzed as “the long-forgotten concept of ‘situs’” (Erikson et al., 2012: 222), that is, a horizontal differentiation in the occupational structure built on the societal function of occupations (Morris and Murphy, 1959); however, this has only minimally improved standard class models (Erikson et al., 2012). The current analysis builds on a novel approach; it is uncertain as to what extent the overarching patterns will mimic standard class schemes (Erikson and Goldthorpe, 1992) or other configurations of the stratification of contemporary societies on the grounds of different skills, resources, work logics, or forms of capital (Murphy, 1988; Savage et al., 1992; Oesch, 2006; Bourdieu, 1984). A general view is that individuals tend to avoid intergenerational degradation of social positions (Boudon, 1974). This is not only a matter of class but also one of status. The status dimension of stratification is usually conceptualized as hierarchical—as a single scale (Chan, 2010)—or as a white-collar/blue-collar divide (Erikson and Goldthorpe, 1992)—while possible horizontal status differentiations have been relatively undertheorized.
The more recent empirical research on social class in Norway has taken a Bourdieu-inspired approach. This research has documented prevailing horizontal differences in achievement, attainment, lifestyle, and political views within the middle class. An early study found educational choices, occupational success, and marriage patterns to differ between those originating in the cultural sector and the economic sector (Hansen, 1995). To differentiate the middle class according to the volume and composition of cultural and economic capital, the Oslo Register Data Class Scheme (ORDC) was created. Whereas the working class in the ORDC scheme comprises unskilled, semi-skilled, and skilled workers, the elite and the upper and lower middle class are horizontally partitioned into a cultural, balanced/professional, and economic fraction (Hansen et al., 2009). This classification has been used to highlight differences in educational achievements of children from different middle- and upper-class fractions (Andersen and Hansen, 2012). More recently, Flemmen et al. (2017) have argued that credentialism and private property are separate modes of closure structuring social mobility according to forms of capital. Other Bourdieu-inspired studies have found differences in political position-taking (Flemmen and Haakestad, 2018) and socio-cultural lifestyle distinctions across the capital dimensions (e.g. Flemmen et al., 2018). In all, the horizontal differentiation of the middle class is non-negligible and appears to have consequences for social mobility. This horizontal differentiation should also be apparent at the level of occupations, given that different occupations are placed differently on the capital composition dimension.
Siblings and family background
Increasingly, sibling data have been used to measure social reproduction. Siblings have been documented to be more alike than non-siblings from the same social background (Björklund and Jäntti, 2020). Over time, a sibling approach has been favored because it is generally difficult to access and assess all relevant sides of families (Sieben and De Graaf, 2003), as social background variables do not capture all the aspects of family background (Hauser and Mossel, 1985). Studies on intergenerational reproduction have increasingly favored sibling correlations, a measure of the importance of family background that encompasses all that siblings share: shared environment within the family, neighborhood, and school, as well as shared genes (Solon et al., 1991; Björklund and Salvanes, 2011).
Research on sibling similarities has investigated unidimensional measures of income, earnings, years of schooling, and occupational prestige, although this vein of research has focused mostly on education and income. Sibling correlation in educational attainment is between 40% and 60% in most societies (Björklund and Salvanes, 2011). In Norway, the correlation in education has fallen somewhat over time, while the weaker correlation in income and wealth has increased over time (Wiborg and Hansen, 2018).
Early work by Sweetser (1973; 1975) demonstrated a strong family component in the social mobility of brothers beyond the influence of fathers’ status in Norway and three other Western countries. Studies using structural equation models have later reported a little more than two-thirds of a variation in occupational status within families in Wisconsin (Hauser and Mossel, 1985), in the United States (US), and in five European countries (Sieben, 2001). The sibling correlation in occupational prestige is around 0.4 in the US and appears to be working largely through education (Conley and Glauber, 2005).
Previous studies reveal little on which occupations tend to appear together in sibling groups. The current study focuses on co-occurring occupations among siblings. Occupational destinations are explored at a disaggregate and categorical level, instead of by estimating correlations in occupational status. The basis of this endeavor is a mobility matrix where the parent is substituted with a sibling and the relative chances for occupations to co-occur are analyzed. Studying siblings has several advantages over studying the association between parents and offspring. First, as described above, measures of social background fail to capture all the relevant aspects of family background. Second, structural changes make it unclear how to interpret occupational (im)mobility because occupations can change their relative standing across generations. For the current study, analyzing siblings has practical advantages, as occupational information for the parental generation is restricted in the register data and occupational categorization has changed over time.
The occupational structure is gender-segregated, with women often being employed in a few large “occupational ghettos” (Charles and Grusky, 2004), while men are overrepresented in higher positions (Toft and Flemmen, 2018). Women are more likely to be intergenerationally immobile at the top and bottom of the class hierarchy and less immobile in the intermediate classes (Bukodi and Paskov, 2020). They are also less likely to end up in the same occupation as either their father or mother (Jonsson et al., 2009; Erikson et al., 2012). In the current study, sibling pairs are included regardless of gender. The different allocation of men and women implies that the full extent of families’ movement in the occupational structure is only visible when both genders are considered. That men on average acquire higher positions than women could potentially downplay the hierarchical differences between families but highlight other patterns. Male and female offspring might end up in different occupations that are similar in other ways than their hierarchical placement. In the future, research should aim to disentangle the gender dynamics in occupational reproduction. Other research strategies will be better for this, as possibilities for separate, comparable, disaggregate analyses of male and female siblings are restricted, as described below.
Data and methods
Data and operationalization
The data on the occupations of siblings are extracted from high-quality administrative register data of the entire population in Norway. The analysis is restricted to individuals born between 1969 and 1985. Individuals are paired with their maternal sibling closest in age, including twin siblings. In this procedure, only siblings with an identifiable occupation are considered. One pair of siblings is randomly chosen when multiple pairs of siblings are identified per mother. This procedure resulted in 254,299 pairs of siblings: 65,841 male and 61,271 female same-sex pairs of siblings and 127,187 cross-sex pairs of siblings.
Occupation. Occupation is coded into 98 occupational categories. 1 The categories are based on the three-digit level of the International Standard Classification of Occupations 2008 (ISCO-08), but with some alterations. Rearrangements are mostly restricted to ISCO-08 categories at the four-digit level and, in many cases, are based on the microclass scheme used by Jonsson et al. (2009) and shared through the Cambridge Social Interaction and Stratification (CAMSIS) webpage. 2 This scheme builds on Weeden and Grusky's (2005) seminal work. This previously used microclass scheme does not always correspond to the occupational structure in Norway (e.g. Norwegian politicians should not be coded as jurists). It also includes many specific occupations (e.g. butchers) that are too small for cross-occupational analyses in a mobility matrix. Generally, the size of the occupational categories was an important concern when fitting the scheme. Many occupational categories are either kept together or merged, even when splitting them would have been theoretically appropriate. This is to increase the number of observations in the cells of the mobility table. The categorization has been further adapted to the Norwegian occupational structure by dividing up female-dominated occupations in the health and the education sectors when educational boundaries exist Some groups, for example, managers, have been rearranged and divided so that positions are kept together where career mobility is common and kept apart where mobility is unlikely.
Occupational data from 2003 until 2015 are used. Annual information on the main occupation in terms of income is recorded in the tax registers from 2003. Occupation is not reported for the self-employed, so self-employed individuals are only included if they were registered with an occupation during this period. In the private sector, occupations are coded as STYRK (the Norwegian classification of occupations, which corresponds to the four-digit level ISCO-08 categories). In the earliest included years, the public sector and the maritime sector used different classifications. Over time, this was phased out in favor of STYRK. In the 2015 data, only STYRK was used. In the public sector, it was not possible to allocate an occupational category to many codes/titles, as they did not indicate a specific occupation (for example, “worker” or “assistant”). In such cases, occupational information from other years was used. Using this procedure, in every included birth cohort, less than 1% of individuals with a listed occupational code were not allocated to an occupation.
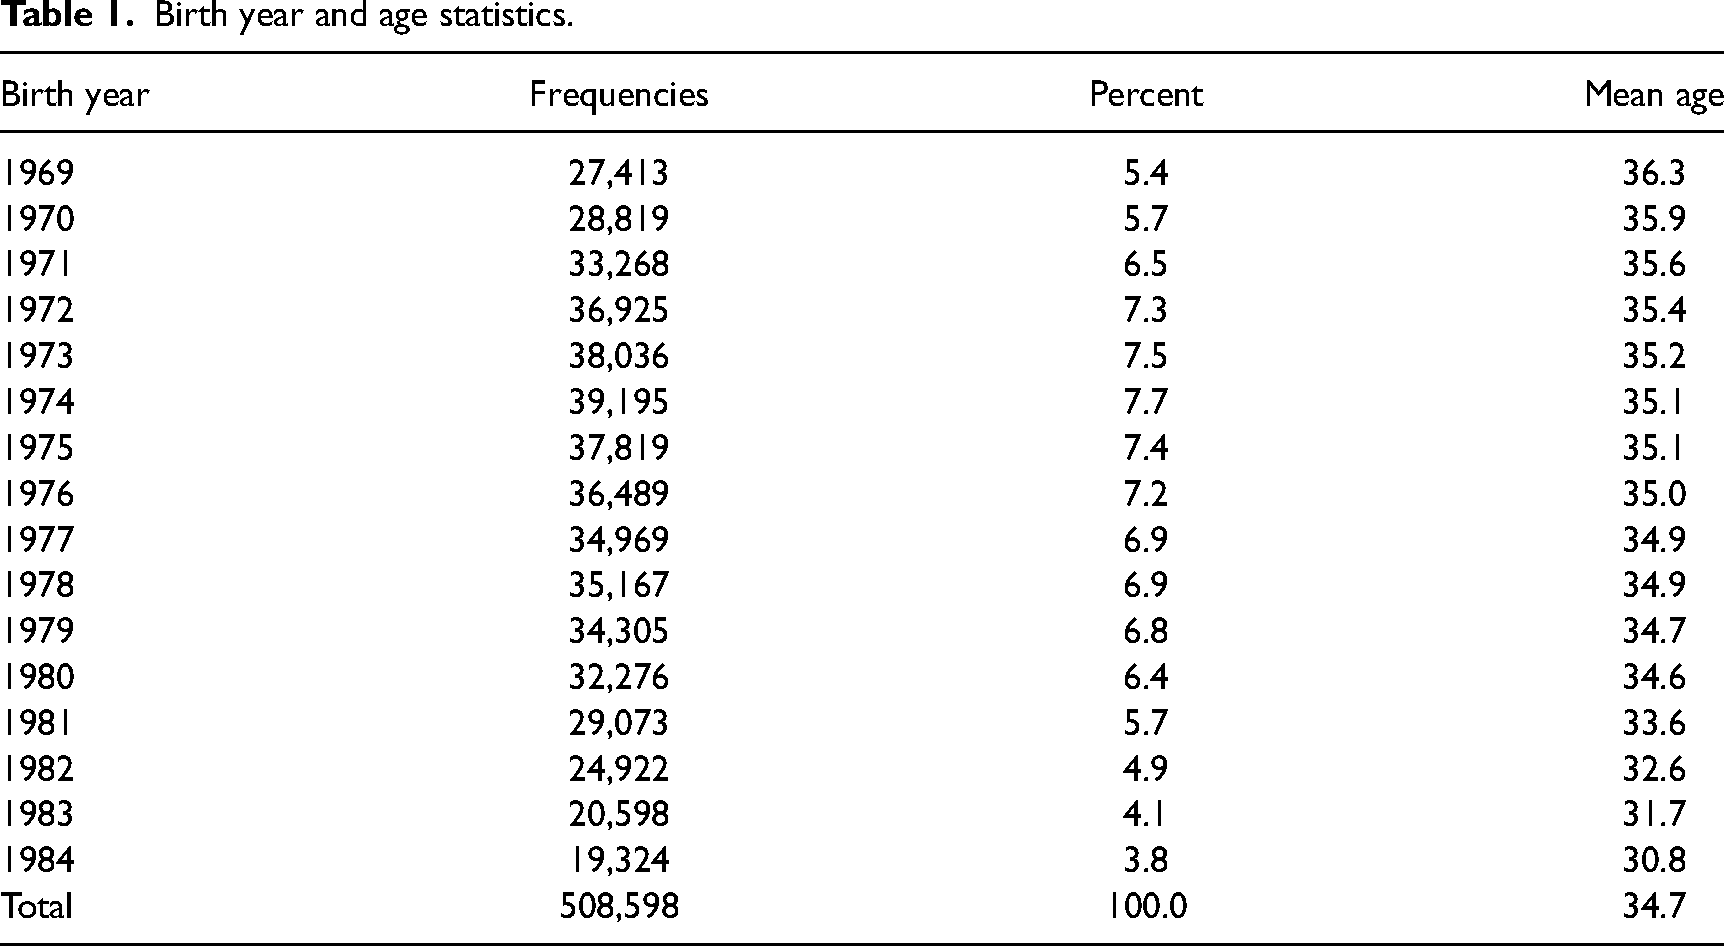
The standard procedure in mobility research is to measure occupation at “occupational maturity,” that is, the age when positions become more stable (Goldthorpe, 1980: 51‒52). However, the age at measurement had to be fitted to restrictions in the data. Occupation is extracted the year individuals turned 35 or, when not available, the year they turned 36, 34, 37, or 33, etc. Occupation is measured up until 2015 for all cohorts, to better utilize the occupational data for the public sector from the most recent years. Older birth cohorts were not used because of skewed attrition from work. Age 27, when most people have finished their education, served as the lower limit. A few people in the oldest cohort are 46 years old. However, over 95% of the final sample are aged 31‒40 years old. Table 1 shows the distribution of individuals across birth cohorts and the mean age of measurement.
Birth year and age statistics.
Education. A measure of the share of individuals with completed higher education in each occupation is included to analyze the linkage between education and occupation. The education of individuals is measured the same year as the individual's occupation. Tertiary education, levels six to eight of the Norwegian classification of education (NUS), is coded as completed higher education, while the other levels are coded as no higher education. The NUS levels six to eight correspond to levels five to six of the International Standard Classification of Education (ISCED 1997).
Methods
The structure of occupational co-occurrence in sibling pairs is analyzed by applying MONECA (Toubøl and Larsen, 2017; Toubøl et al., 2013). This analysis is based on a mobility table with Relative Risk ratios (RRs) equal to a weighted network. The matrix is a 98 × 98 matrix, showing ties between the occupation of sibling A and sibling B. Each sibling is entered twice but with changed positions in the second count. This procedure removes randomness in the allocation of individuals to the rows or columns. By doing this, the upper triangle of the matrix becomes the mirror image of the lower triangle of the matrix and only the lower triangle needs to be analyzed. The mobility matrix with frequencies is available from the author by request 3
Each RR is calculated as follows: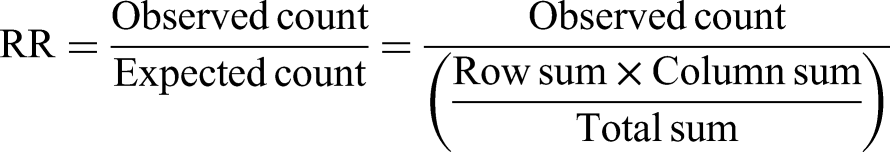
The clustering algorithm identifies discrete clusters by finding which occupations are most closely connected in a clique. The algorithm is agglomerative and starts by clustering the most intensely connected single pair of nodes. First, it clusters the pair of occupations with the highest RR in the matrix; then, it clusters the one with the second-highest RR, and so on. However, to include an occupation in an already defined cluster, the occupations must all form a clique by having an RR above a set threshold for every occupation in the cluster. After clustering, the procedure can be repeated on the clusters from the first round. This can be repeated a limited number of times because co-occurrences will be seen increasingly within clusters, leaving fewer co-occurrences between clusters. A detailed explanation of the clustering algorithm can be found in Appendix A in Toubøl and Larsen (2017).
Toubøl and Larsen argue for the cut point to be set at RR = 1, which equals a higher observed count than what would be expected if there was no correlation between occupations in the matrix (Toubøl and Larsen, 2017; Toubøl et al., 2013). This is also theoretically appropriate for an analysis of occupational co-occurrences among siblings, so all the analyses have been conducted with RR = 1.01 and above. Robustness checks show a decreasing correlation with higher cut points compared to an RR = 1.01 analysis (online Appendix A1). Larger occupational clusters tend to form when the cut point is set lower; a higher cut point leads to an increased number of (smaller) clusters. While the overall correlation decreases with a higher cut point, some patterns are markedly stable across analyses. The results have been checked for robustness by running several analyses and comparing the results, in addition to a close inspection of the RR. Based on this, it is possible to determine the most important and robust structures in how occupations are strongly connected. I present the results of two analyses using an RR = 1.01 cut point and subsequently, an RR = 1.5 cut point. The first analysis gives a good overview of the aggregate structure of occupational co-occurrences, while the second analysis shows occupations that are intensely connected. The clustering was repeated the maximum number of possible times, which is limited because co-occurrences will increasingly be seen within clusters. In the first analysis, occupations were clustered three times; in the second analysis, two times.
False connections between occupations, due to measurement errors or randomness, could be a problem; therefore, Toubøl and Larsen reduced cells with observed counts under 5 to 0 (2017). However, this could be problematic because the expected value between the smaller occupations is below 5. Thus, only cells with values of 2 or less were reduced to 0. This choice was made while considering results from robustness tests (see online Appendix A2).
Results
Same family, same occupation?
The main diagonal of the occupational matrix contains cases when siblings have the same occupations. These values are often high. Almost every occupation has the highest relative probability of co-occurring with itself. Many of the occupations with the highest values are low-skilled manual occupations, while several professions rank just below. The medical profession has the highest percentage of siblings in total and is almost 10 times more likely to be held by both siblings, compared to if there was no correlation between siblings’ occupations. In almost two-thirds of the occupations, both siblings have the same occupation over three times more often than expected. At the top of the list (Table 2) are crafts workers, creative artists, seafarers, religious workers, and operators.
Occupations with the highest relative probability of being held by both siblings.
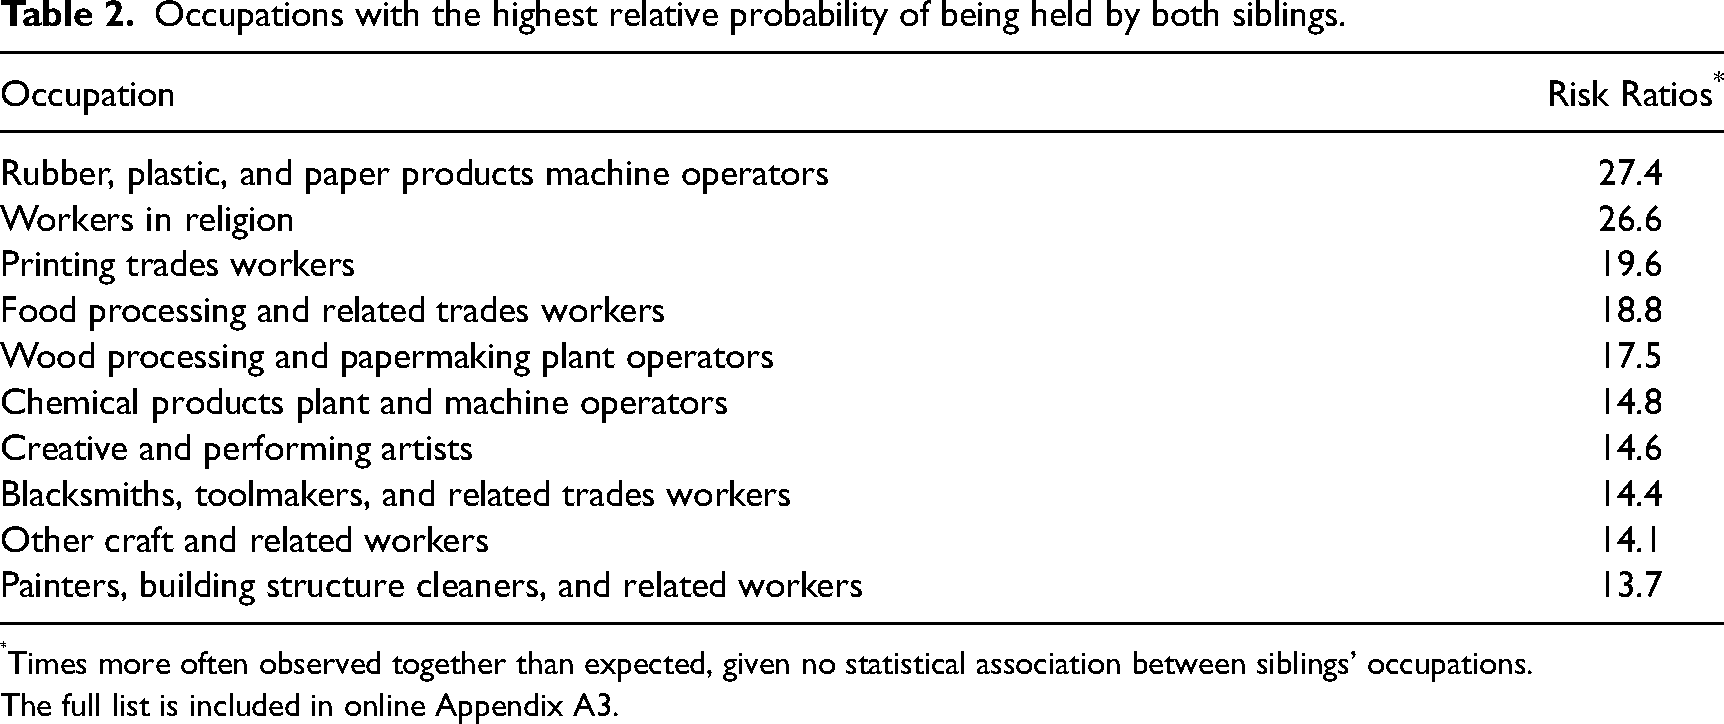
Times more often observed together than expected, given no statistical association between siblings’ occupations.
The full list is included in online Appendix A3.
Though the overrepresentation in the same occupation is substantial, only approximately 5.5% of siblings have the same occupation. The figures are approximately 3% for siblings of the opposite sex and approximately 8% for both male and female same-sex siblings. These figures are lower than the 10%–23% of men Jonsson et al. (2009) found to have intergenerational microclass immobility across four countries. The figures are, however, not directly comparable because i) siblings can have the same occupation while having a different occupation than any of their parents and ii) microclass reproduction could be relatively uncommon for multiple individuals in the sibling group.
The percentage of individuals with their sibling in the same occupation varies among occupations and some larger occupations appear to have high percentages primarily because of the size of the category. Table 3 shows that the highest percentage of siblings is found among medical doctors. Among male-only siblings, the highest percentage is found among ship officers, ships’ deck crews, and related workers (20.7%). This corresponds to findings of Jonsson et al. (2009), who reported a strong association within seafaring occupations. Very few women (n = 59) have this occupation; however, among those who do, 15.3% have a brother in the same occupation. While few women enter male-dominated occupations, they might disproportionally do so in occupations held by male members of their family (see online Appendix A4).
Percentage in each occupation having their sibling in the same occupation (top 10).
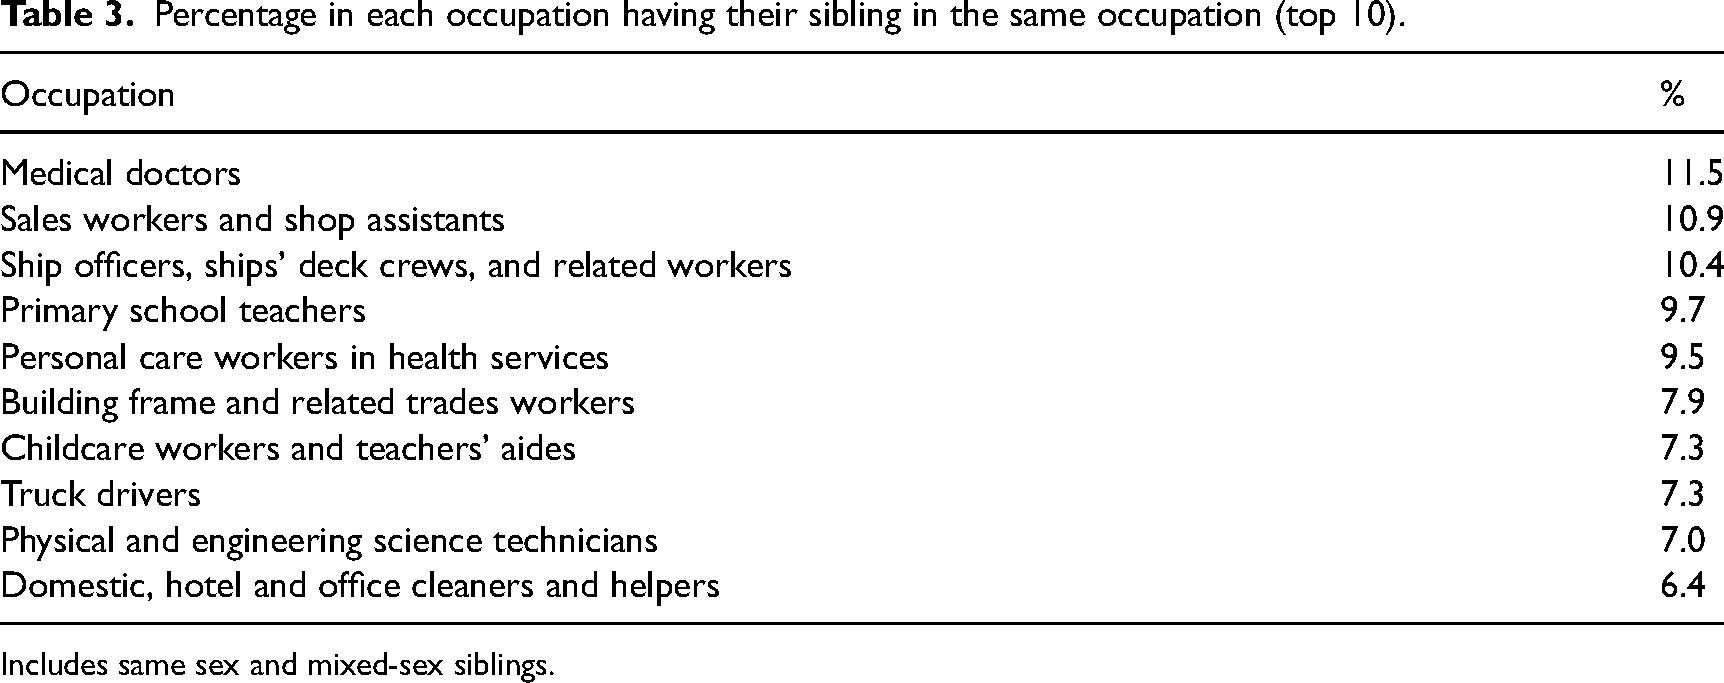
Includes same sex and mixed-sex siblings.
Both same-sex and cross-sex sibling pairs are included in the succeeding cluster analysis of connections between occupations. It would be favorable to run separable analyses on same-sex male and female sibling pairs, but to do this, occupations would have to be merged. Many occupations are extremely gender-segregated, especially the male-dominated manual occupations. Amongst the siblings, one in five men is employed in occupations where less than 4% are women.
Co-occurring occupations
How are occupations overall connected through their relative tendency to co-occur in a sibling pair? To answer this, we turn to the analysis where the most strongly connected occupations in sibling pairs, in relative terms, are clustered. The result from the first analysis is shown in Figure 1. Each occupation is represented by a node and the size of the node indicates how many hold this occupation in the data. The color of the nodes indicates the percentage with higher education in the occupation. The grey circles around the nodes show the clustering from the three rounds, with the inner circles representing the first round of clustering, and so on. The straight lines show occupations in different clusters that co-occur over twice as often as if there was no statistical association between siblings’ occupations.
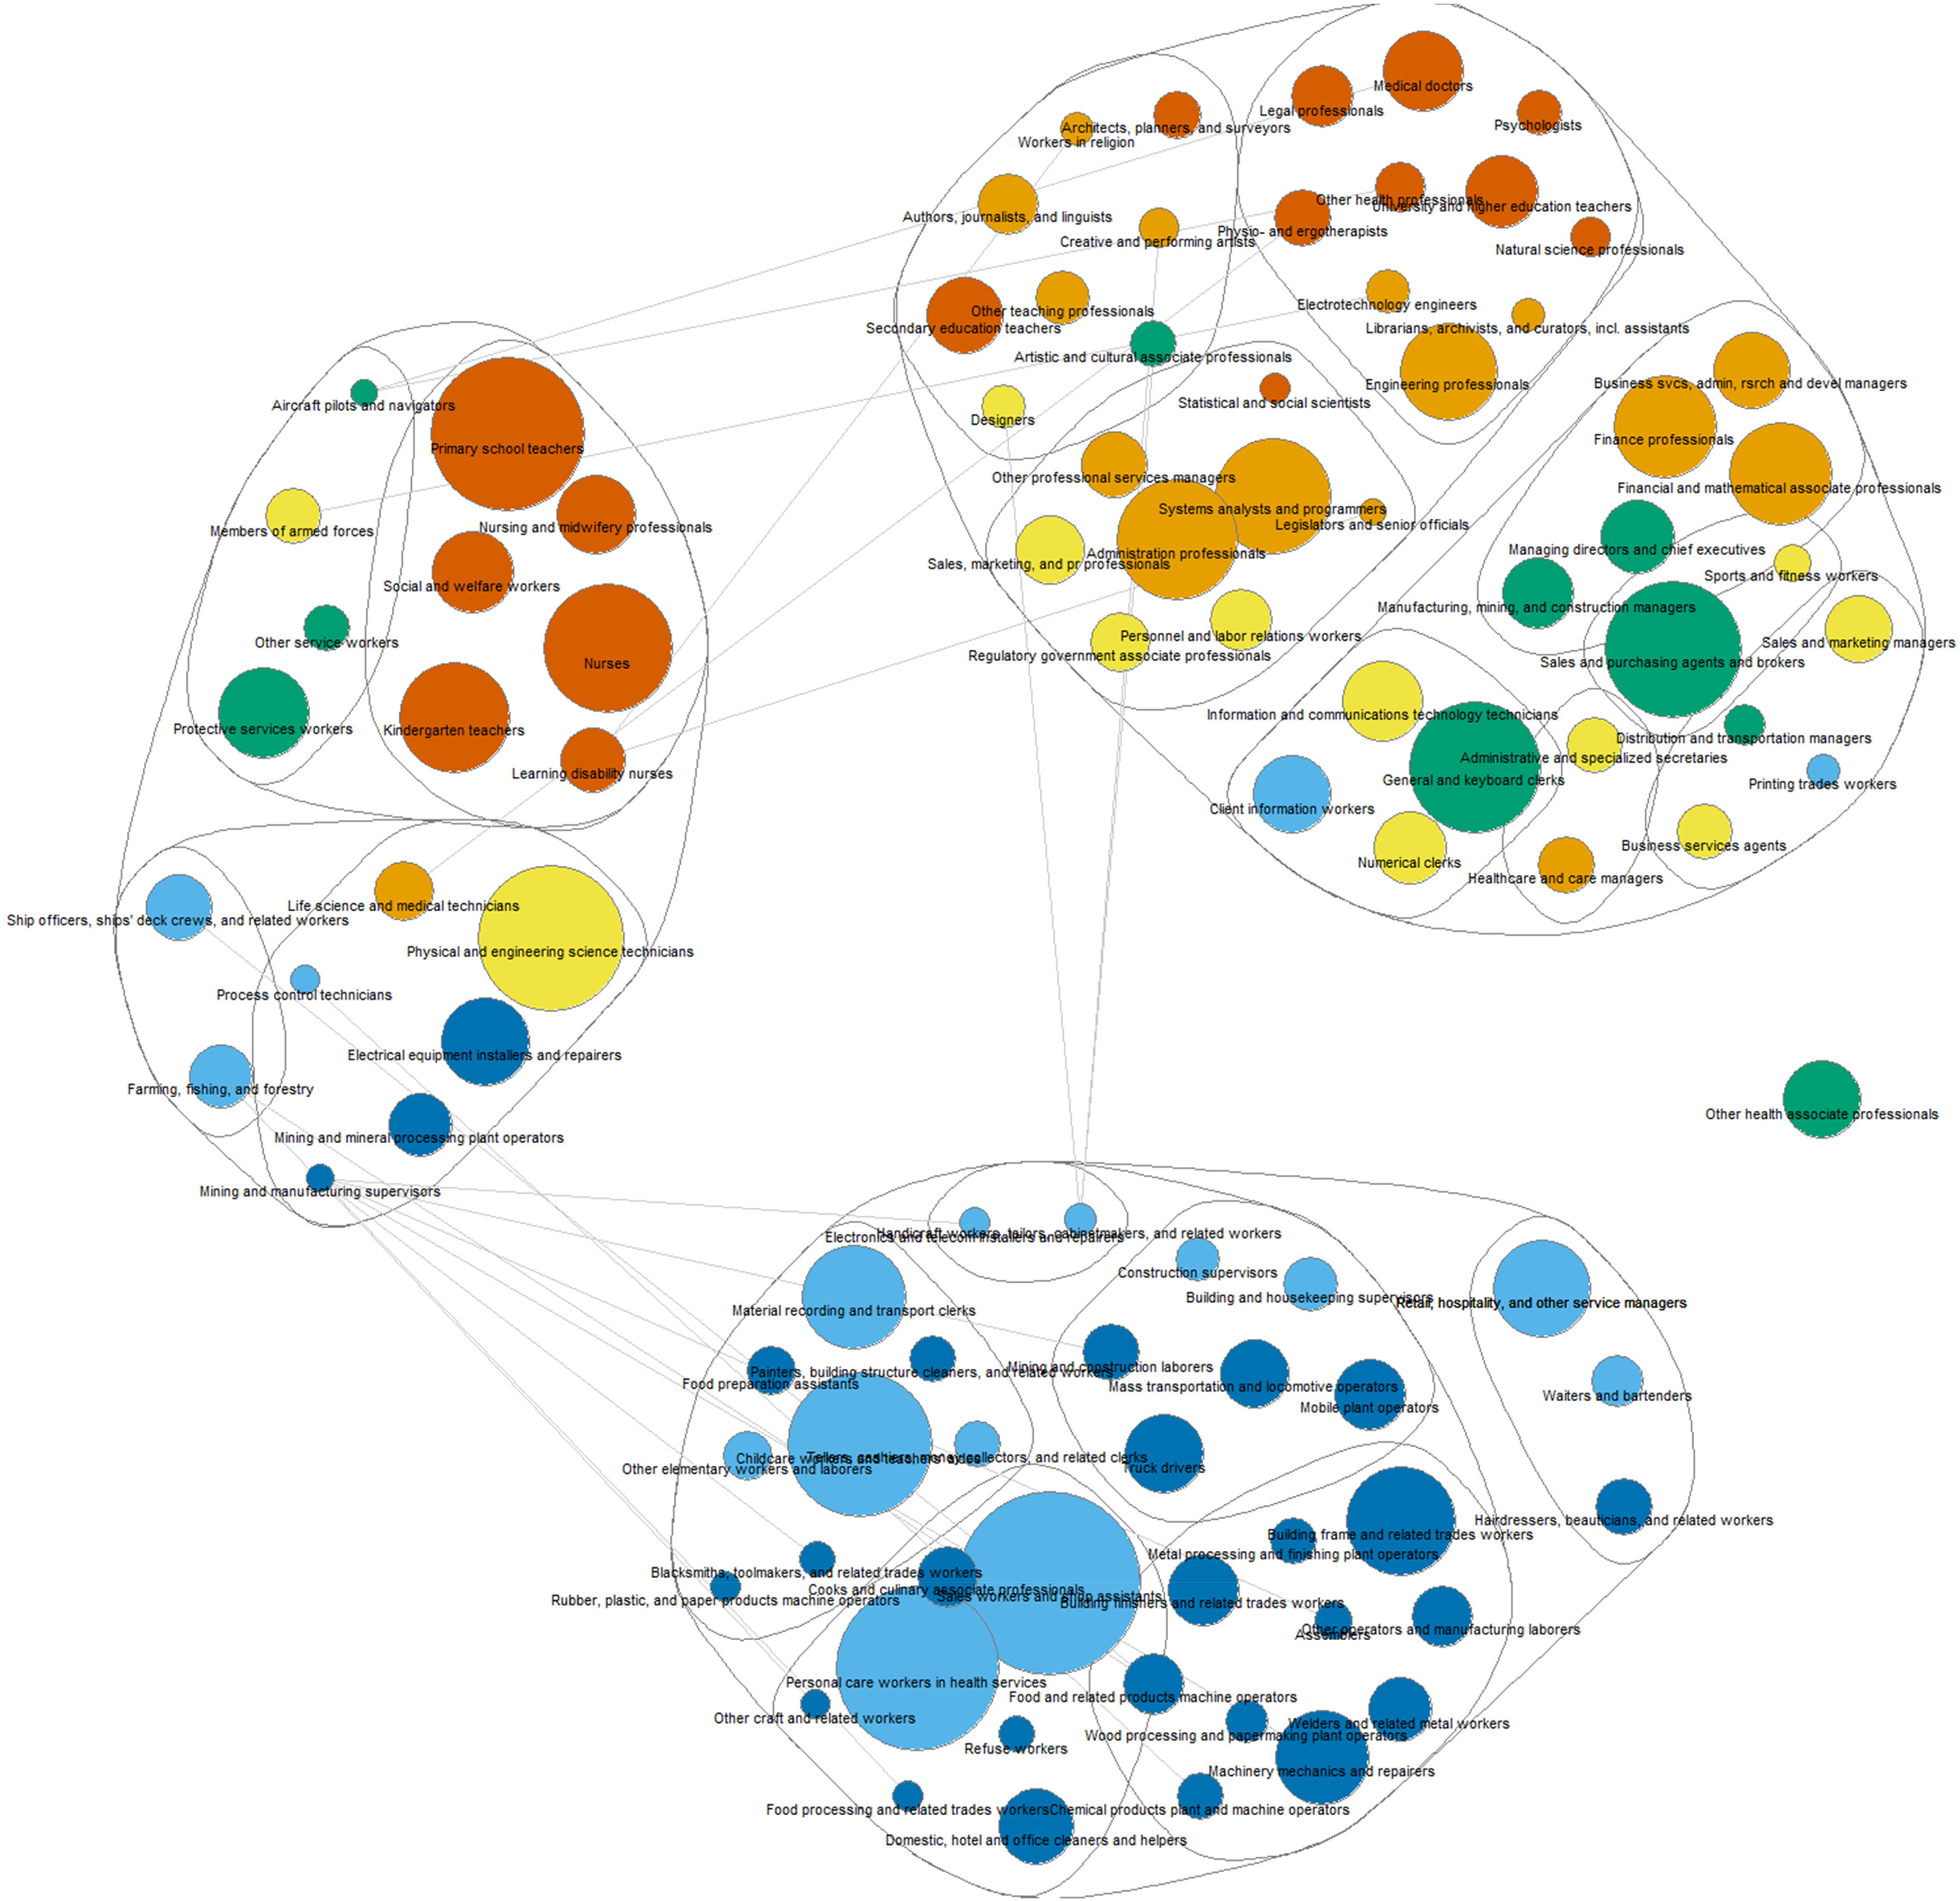
Clusters of strongly tied occupations among siblings (cut point of RR = 1.01). Colors indicate the percentage with higher education in each occupation: Red 90–100%; orange 70–89%; yellow 50–69%; green 30–49%; light blue 10–29%; dark blue 0–10%. Straight lines show ties of RR>2 across clusters.
When setting the cut point close to RR = 1, the same aggregate structure of occupations appears across analyses. This aggregate partition is illustrated by the outer grey circles in Figure 1. Most occupations are clustered in two large groups: i) skilled and unskilled, manual occupations, located at the bottom of Figure 1 and ii) non-manual occupations, located at the top of Figure 1. The structure echoes recurrent findings in research conducted on social mobility, where a large portion of social (im)mobility is structured by the manual/non-manual division (Lipset and Bendix, 1959; Jonsson et al., 2009; Erikson and Goldthorpe, 1992). The third large cluster, in the middle-left part of Figure 1, contains occupations with an intermediate position in the occupational hierarchy. This includes more prestigious manual occupations, supervisors of manual work, lower technicians, protective service workers, pilots, 4 and female-dominated semiprofessions. The straight lines, indicating strong cross-cluster ties, show that one mid-level cluster is connected to non-manual occupations and the other to manual occupations, increasing the impression of a dual structure. 5
A good measure to assess the connectivity of occupations within a cluster is the density, which is the observed ties between occupations within a cluster over the maximum potential ties within that cluster. A tie is defined as the statistical association between two occupations being above the cut point. The density is about 0.7 in the non-manual cluster and 0.79 in the manual cluster. The placement of clerks in the non-manual cluster lowers the overall density of this cluster. Although the density is high, it shows that many occupations within the manual and non-manual groups are not strongly connected. In the intermediate cluster, the density is 0.64; however, within the two subgroups in this cluster, it is 0.89 and 0.93, respectively. An overview of the clusters, including the measure of density, is found in online Appendix A5.
Turning to the clusters from the last round to the first, in the non-manual cluster, we find separate clusters for creative occupations, the professions, workers in administration, human resources and marketing, finance and management, business and sales occupations, clerks, and information workers. In the manual cluster, occupations in industry, elementary workers, service workers, building and construction workers, and transportation workers are clustered, but the groups are less stable across the analyses.
What is especially rigid is that throughout the analyses, the elite professions (medical doctors, legal professionals, psychologists, and engineers) exhibit strong connectivity; this resonates with the previous finding that reproduction is more likely to be within professions than within the service class at large (Ruggera and Barone, 2017). More generally, lower-level clusters are not clustered according to typical class categories, for example, skilled manual and managerial occupations; however, these two groups did sometimes cluster in results not reported here. They often do not cluster because same-class occupations are not all intensely connected and there are connections between occupations across class boundaries. Furthermore, while many occupations show connections to more narrow sectors or industries, managerial categories are defined by positions of authority within an organization and are often connected to many sectors. Managerial categories, thus, can connect otherwise less connected parts of the occupational structure.
Two groups are separated in the mid-level clusters within the non-manual cluster. On the top-right of Figure 1 are occupations in business, management, finance, sales, and clerks (density of 0.76); on the top-left are the professions and workers in administrative, educational, and cultural occupations (density of 0.86). When these groups are adjoined, the density moderately decreases to 0.7 and the “economic cluster” is most fragmented; finance professionals and several managerial categories are more strongly connected to the other non-manual cluster than less prestigious occupations in the economic cluster. The position of clerks is most ambiguous, as they are at times clustered with the manual occupations or outside the two main clusters. The bonds within the clusters of professions and the creative occupations are very strong. Both clusters appear across the results because of their strong internal ties. Although there are strong connections between, for example, some managerial occupations and creative and performing artist occupations, they are much lower than the connections among the cultural-artistic occupations. Overall, the pattern in the non-manual occupations cluster bears a similarity to Bourdieusian ORDC class schemes (Hansen et al., 2009), where economic, cultural, and balanced-professional fractions are identified in the middle class based on the composition of capital. A strong driver of this is the large internal overrepresentation of siblings across professional and cultural-artistic occupations.
The colors of the nodes in Figure 1 show the share of highly educated individuals in each occupation. The structure of co-occurring occupations is strongly associated with educational attainment. This is in accordance with strong sibling correlations in educational attainment (Björklund and Salvanes, 2011; Wiborg and Hansen, 2018) and previous findings that sibling correlations in occupational prestige are largely explained by education (Conley and Glauber, 2005). The manual cluster homogenously consists of occupations where few have higher education. The intermediate occupations consist of some occupations where few workers have higher education, while in other occupations nearly all have it (albeit in the form of shorter degrees from universities of applied sciences that recruit more from the lower classes than university and elite profession programs (Hansen, 2005)). In the non-manual cluster, the variation goes from occupations where virtually everyone has completed higher education to occupations where less than half have such qualifications. Overall, education stratifies not only occupational co-occurrences between a manual and a non-manual group, but also occupational co-occurrences within the non-manual occupations. The lower-level clusters tend to group occupations with similar educational profiles, although, for example, the creative occupations are clustered even if their educational profiles vary.
The occupations are also clustered according to institutional divisions in the educational system. The university of applied sciences semiprofessions and the university professions are grouped in separate clusters. The structure in occupational co-occurrences thus overlaps with divisions in post-secondary schools, which, as Weeden and Grusky (2005) mention, are institutions that facilitate cultural and social homogeneity across occupations. An additional detail here is that the semiprofessions exhibit strong ties to the socio-cultural and health professions, but the professions are much more intensely connected to other professions and prestigious occupations.
The last step of the analysis is a cluster analysis with a higher cut point of RR = 1.5, where clusters encompass occupations that are overall more intensely connected. The results are shown in Figure 2. An overview of the clusters, including the measure of density, is found in online Appendix A6.
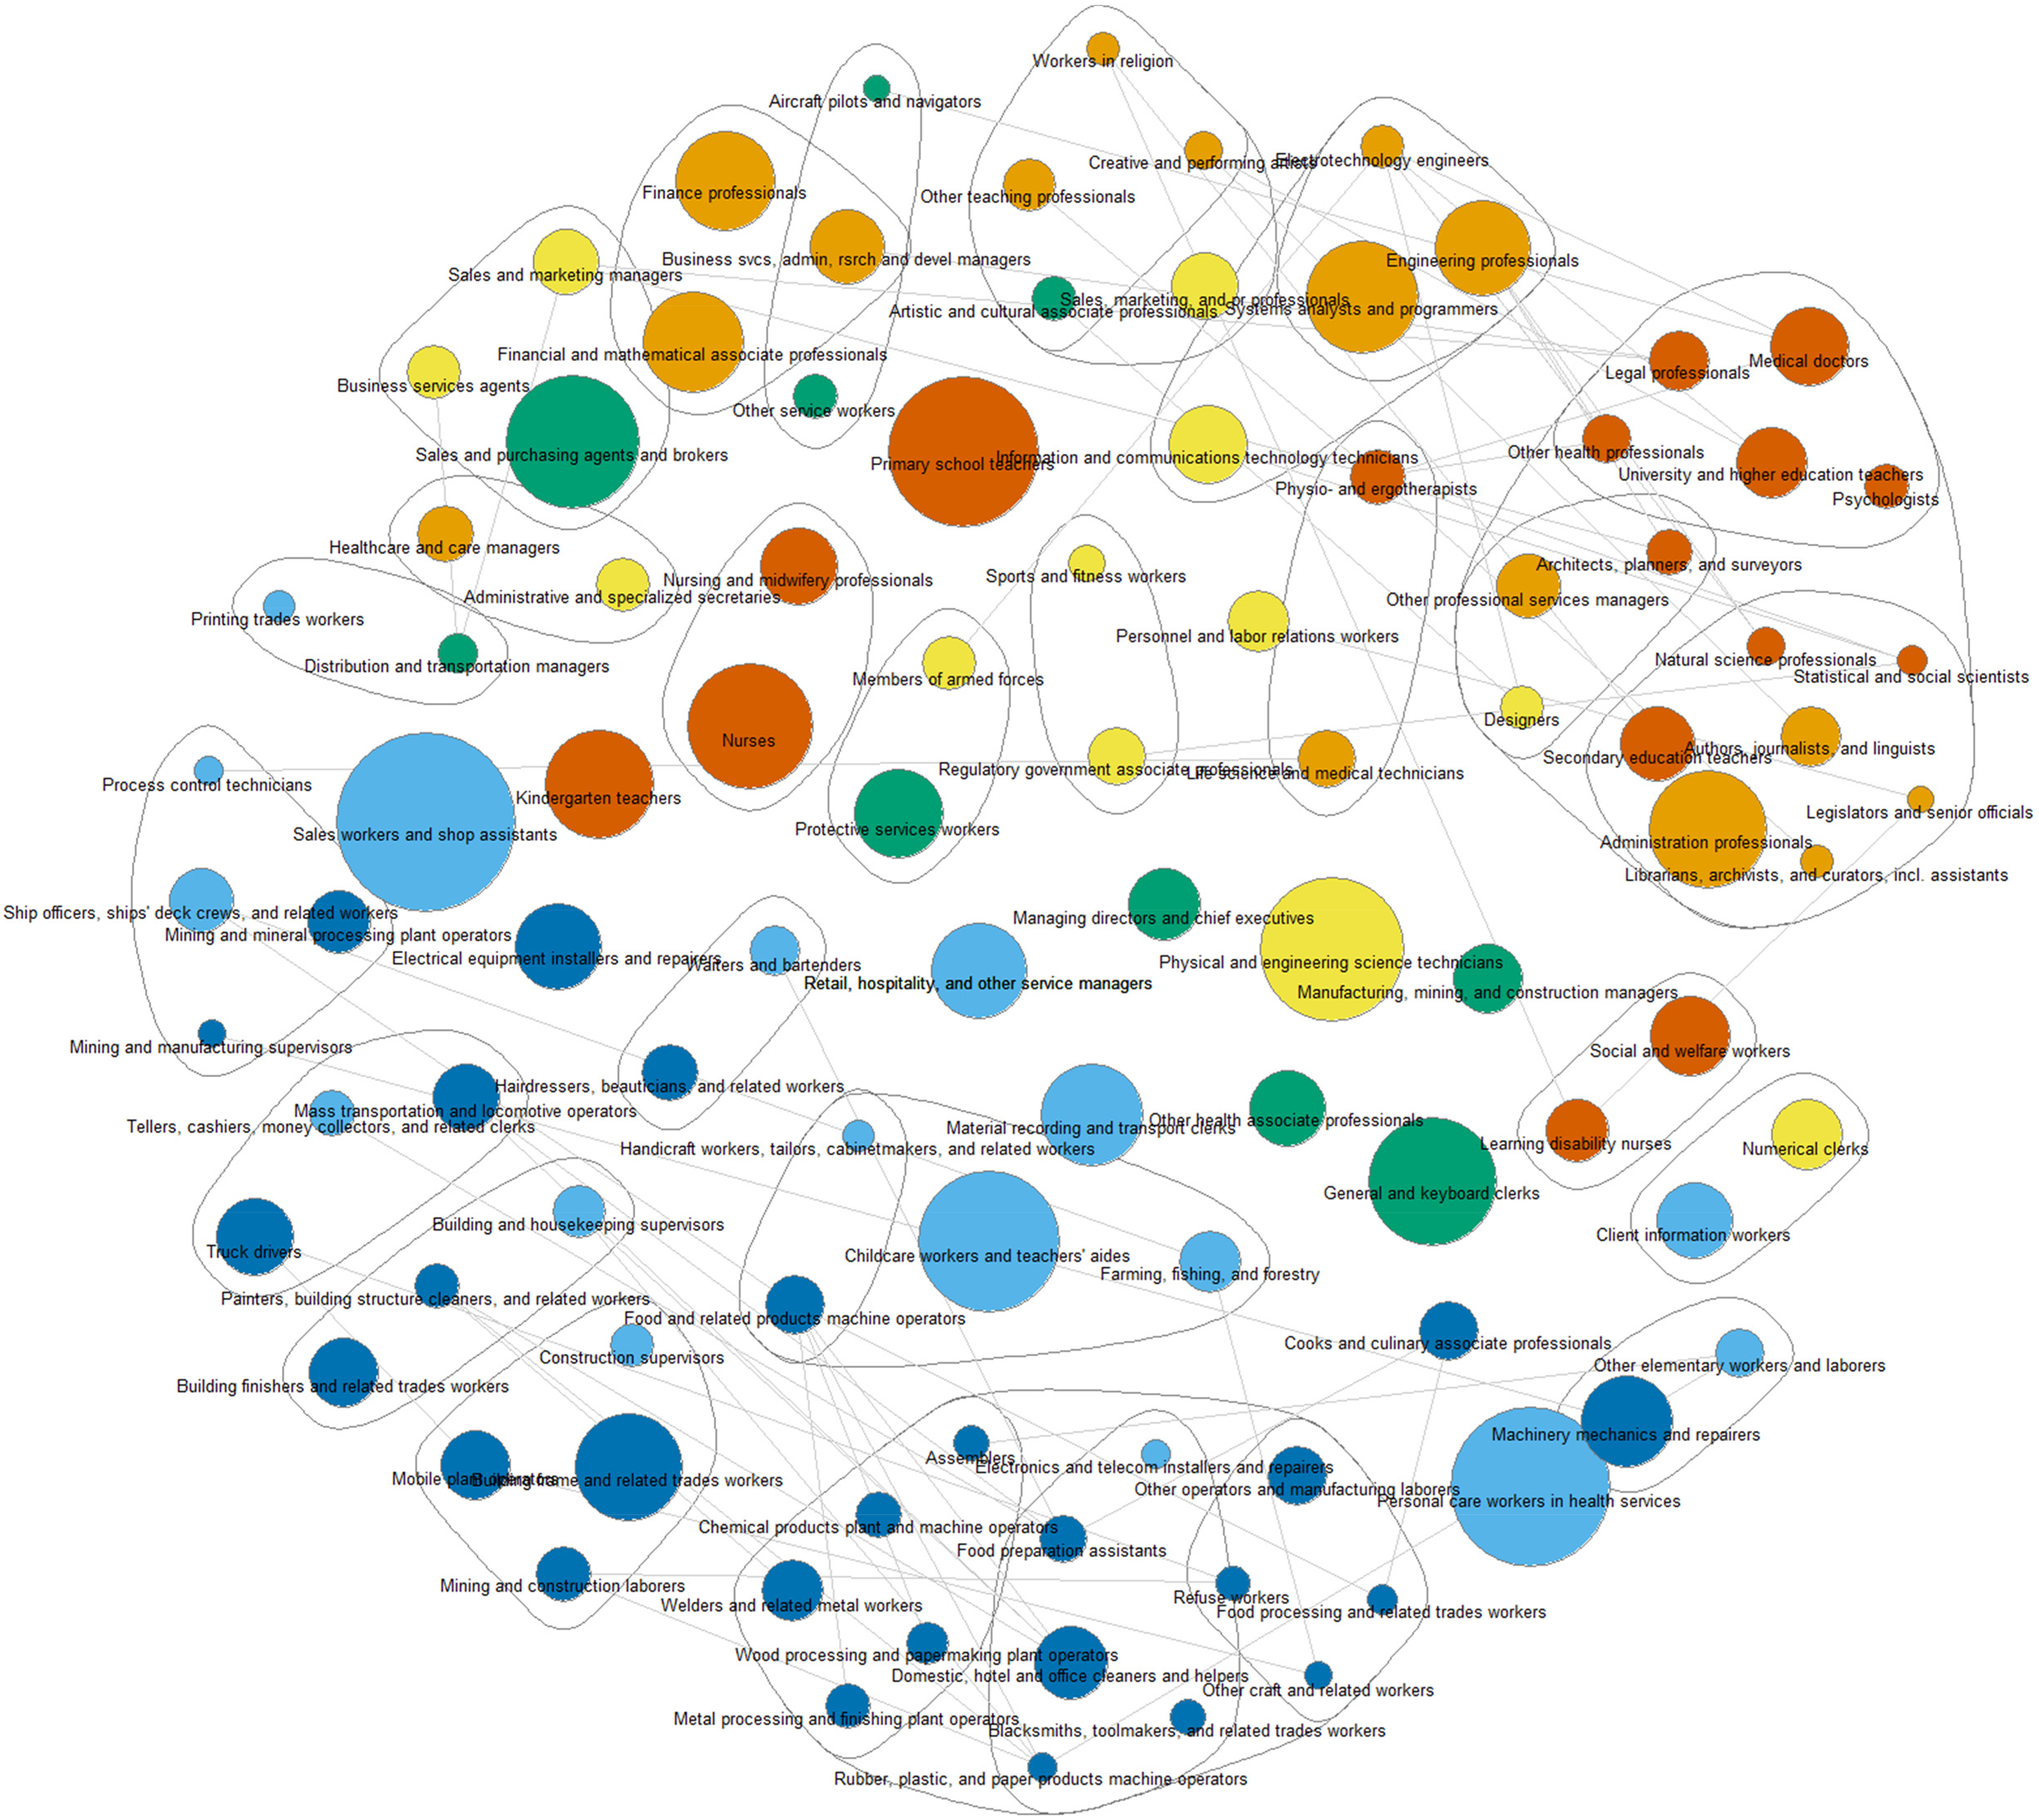
Clusters of intensely tied occupations among siblings (cut point of RR = 1.5). Colors indicate the percentage with higher education in each occupation: Red 90–100%; orange 70–89%; yellow 50–69%; green 30–49%; light blue 10–29%; dark blue: 0–10%. Straight lines show ties of RR>2 across clusters.
The overarching pattern remains the same, although the result is substantially more differentiated. The separation of manual and non-manual occupations is still evident. Occupations in the middle of the occupational hierarchy have broken away from the manual and non-manual clusters; subsequently, smaller clusters have formed and more occupations have become stand-alone. Many of the smaller clusters consist of only two occupations, for example, nursing occupations, social workers, and protective workers. The clustered occupations in the previous analysis did co-occur more often than expected, however, increasing the cut point reveals that occupations in the same cluster were often only strongly connected indirectly through other occupations in that cluster.
The non-manual cluster at the right of Figure 2 consists of a core of elite professions, some highly educated occupations, administration workers, designers, and architects. At the top of the figure are separate smaller clusters of i) cultural-artistic occupations (including sales, marketing, and PR professionals), ii) business and sales, iii) finance, and iv) engineers. The straight lines show strongly connected occupations that are in different clusters. In the upper echelons of the occupational structure, professions are most strongly connected to each other, while each profession has strong connections to different parts of the occupational structure.
At the left of Figure 2, there is a cluster of occupations connected to seafaring and oil. This recurs in analyses, although sometimes in a larger cluster, as strong ties exist between seafarers and farming, forestry, and fishing, and between seafarers and workers in the food industry, where fish is the most common product. The oil sector and fishing sector are connected through the seafaring occupation, but these two sectors appear to be overall connected. The other manual occupations are located at the bottom of Figure 2. The largest cluster consists of industrial workers, cleaners, and other elementary workers. Other analyses clustered occupations in the heavy industries in a separate cluster. Overall, these occupations exhibit many ties between them, underlining the overall connectedness and unclear partitioning of these low-skilled occupations. The surrounding clusters include building and construction workers, building finishers, and transportation workers.
Overall, occupations appear to be, at first glance, often grouped with occupations that previous studies have found to be connected through career mobility (e.g. Toubøl and Larsen, 2017; Cheng and Park, 2020). This similarity can partly be explained by many occupations not having clear boundaries in terms of practical tasks. There is a strong tie between, for example, truck drivers and refuse workers, where one in four refuse workers have a job that explicitly includes driving vehicles. At other times, affiliation to more specific status groups could structure occupational mobility. For example, the strongest tie between occupations is between workers in religion and creative and performing artists, where the latter category includes several church musicians.
Conclusion
In this article, I studied co-occurring occupations among siblings. Siblings disproportionately often have the same occupation. In almost every occupation, the relative probability for this is higher than any other pairwise combination of occupations. To study co-occurring occupations in sibling pairs, I used a novel approach with an inductive network analytical clustering algorithm. At the most aggregate level, the results were a largely dichotomous division between non-manual and manual occupations, which corresponded with a long line of studies in social mobility (Erikson and Goldthorpe, 1992; Lipset and Bendix, 1959; Jonsson et al., 2009). However, some occupations fell outside these two clusters, highlighting that the occupational structure is not simply a dual division.
The analysis revealed subdivisions among the non-manual occupations, which are associated with educational levels. Occupations in management, finance, business, and sales formed a separate subgroup from administrative workers, the professions, and cultural-artistic occupations. These subdivisions resemble the horizontal division in the Bourdieu-inspired social class model (Hansen et al., 2009), where professionals and bureaucrats are considered to have a mixed composition of cultural and economic capital, those in education, research, and culture have more cultural capital, and those in business, sales, and management have more economic capital. The results are not a validity test of this or any other social class scheme, but support the need to address, explain and theorize non-vertical subdivisions within the non-manual occupations or classes. Future research could employ similar criteria as used in this study to systematically test theoretically held horizontal divisions within classes. One example might be to focus on the number of occupations in different groups that appear together less often than expected given no statistical association between occupations.
Breiger (1981), Snipp (1985), and Toubøl and Larsen (2017) used inductive approaches to analyze social classes in the Weberian sense, namely, as class positions where mobility is easy and typical (Weber, 1978). Based on this definition, social class boundaries should be akin to patterns of social mobility. We can also view the patterns as the pattern of social class structuration (Giddens, 1973); underlying tendencies toward increased social interconnection between class positions. The social interconnectedness is stronger between occupations with similar educational levels. Thus, education plays an important role in social class boundaries, also within non-manual occupations. Along with previous research (Jonsson et al., 2009), the results from the present study show that occupations are important units for the social embeddedness of families within more restricted parts of the labor market. The role of occupations stressed by microclass theory (Grusky and Weeden, 2001) can be integrated into our understanding of social class if occupations are placed in their broader context. The results suggested complex structuration in more narrow parts of the occupational structure.
Previously, increased mobility between “similar microclasses” in seafaring occupations, the health sector, the financial sector, and literary occupations have been reported (Jonsson et al., 2009: 1012). Furthermore, recent studies have documented that reproduction within educational fields is common (Andrade and Thomsen, 2017; Helland and Wiborg, 2019). The results suggest that siblings operate within the same “occupational field”, as in arts. While much of this is likely mediated through siblings choosing the same educational fields, there is no apparent theoretical explanation that limits orientation toward “fields” to education. While these “fields” now are empirically established, the relations between these narrower “fields” remain more uncertain.
To account for the occupational co-occurrences in families is to capture the heterogeneity of processes and mechanisms driving and resulting from the social class structure. There are two interrelated questions behind the co-occurrences: What attributes of occupations make them co-occur in families and what shared (or intergenerationally transmitted) attributes of family members cause them to have “similar” occupations? In the extension of this, future research could aim to uncover how the occupational positions of men and women of the same families are similar even if they have different occupations following occupational gender segregation.
Footnotes
Acknowledgements
The author would like to thank Jonas Toubøl and Anton Grau Larsen for their help with MONECA, and Anton Grau Larsen, Johs. Hjellbrekke, Maren Toft, and the anonymous reviewers for their comments on earlier drafts.
Declaration of Conflicting Interests
The author(s) declared no potential conflicts of interest with respect to the research, authorship, and/or publication of this article.
Funding
The author(s) disclosed receipt of the following financial support for the research, authorship, and/or publication of this article: This research is part of a PhD project funded by the University of Bergen.