
Abstract
Artificial Intelligence (AI) is currently hailed as a ‘solution’ to perceived problems in education. Though few sociologists of education would agree with its deterministic claims, this AI solutionist thinking is gaining significant currency. In this article, using a relatively novel method for sociology – a knowledge graph – together with Bourdieusean theory, we critically examine how and why different stakeholders in education, educational technology and policy are valorising AI, the main concepts, such as personalisation, they collectively endorse and their incentives for doing so. Drawing on this analysis, we argue that AI is currently being mobilised in education in problematic ways and advocate for more systematic sociological thinking and research to re-orientate the field to account for society’s structural conditions.
Introduction
For decades, policy makers have often looked to technology to remedy a variety of challenges that societies face. Education policy has never been immune from such ‘technological solutionism’ (Morozov, 2013). Across the globe, policies are developed to make national education systems more responsive to societal problems through the deployment of technology. The problems are varied, and relate to many demands: for example, ensuring schools meet the needs of the economy, provide a cost-effective education and, simultaneously, address social and educational inequalities (Robins and Webster, 1989; Selwyn, 2013). Many of educational technology’s sponsors, producers and vendors both influence and answer to these policy agendas. The latest form of technological solutionism is focused on AI. For example, as the UK’s University of Buckingham’s Vice Chancellor, in his forward to Nesta’s report ‘Educ-AI-tion rebooted?’, argues: We desperately need new solutions to tackle the mounting pressures on our school system – from excessive teacher workload to lack of social mobility – and many of the [AI] tools described in this report have the potential to dramatically improve our school system. (Nesta, 2019: 4)
This discourse is familiar to scholars who observe how technologies are typically positioned within educational landscapes (Selwyn, 2013). Yet, despite robust arguments that education should not obligingly respond to such calls to accelerate the uptake of new technology (Biesta, 2013), such statements have, for a while, characterised educational policy in many different countries around the world.
Using a novel combination of theory and method we interrogate this mobilisation of AI. Our approach allows us to move beyond questions about ‘what works’ that focus on individual interventions and problematise individuals who are not adopting the technology appropriately, and instead use a combination of theory and method to take a more macro view of what is happening to edtech. The purpose of this article is to make a sociological intervention to help explain how and why it appears that, yet again, technology, this time using AI, will ‘fix’ education (Robins and Webster, 1989).
To date, there has been a rich, but relatively small body of work that has taken such a macro approach to understanding the ways that edtech is conceptualised and practised within education systems. It has drawn attention to the expansion of commercial interests in the creation and implementation of edtech policy and education reform (e.g. Ball, 2012; Robins and Webster, 1989; Schiller, 1999; Selwyn, 2016; Watters, 2014). These scholars have used an array of theoretical resources to display the political and economic dynamics at work in education. They have looked across educational systems (e.g. Selwyn and Facer, 2013); focused on the role of one or two commercial actors (e.g. Williamson, 2017); or analysed a specific edtech phenomenon such as Massive Open Online Courses (MOOCs) (e.g. Hall, 2015).
By examining the emergence of AI in education, we aim to contribute both methodologically and theoretically to this growing body of work with a relatively innovative approach in sociology; the creation of a knowledge graph. Using this, together with Bourdieusean theory, we critically explore the field’s logics and incentives, examine how different stakeholders in AI and edtech position themselves, identify the main concepts these entities collectively promote and propose their incentives for doing so.
Conceptual and Methodological Framing: A ‘Symphonic Social Science’
The majority of studies in sociology that have centred upon similar aims have been qualitative in nature, with a strong concentration on discourse analysis of appropriate texts that is often accompanied by some form of systematic analysis of the relationships between the different actors involved. A small proportion of these studies has utilised data from the web to visualise the connections or networks between different people and organisations. For example, Ball’s (2012) work on the identification, visualisation and analysis of global education policy networks and Mustain’s (2018) social network analysis of the ‘P-TECH’ network. By creating a knowledge graph and applying social theory to its structure, our novel approach aims to contribute to existing literature and wider debates in the development of digital sociology (Fussey and Roth, 2020). We provide the methodological and conceptual framing below.
Introducing a Knowledge Graph
A knowledge graph enables us to the capture and visualise the field that exists at the intersection of edtech and AI, represent its relevant stakeholders and their relationships and the concepts they discuss within their communities. Data that could be used in a knowledge graph can be collected in a variety of ways: here we synthesise two sources of data: interviews with stakeholders and searches of the web from two different search engines.
A knowledge graph has similarities to a network map, but it allows more information to be included and analysed. Like a network map we can quantify, for example, which entities are the most important to the network’s structure, based on their connections to other entities in the graph. Yet, while network maps are typically defined by one type of relationship between entities (such as users who follow or mention each other on Twitter) a knowledge graph can represent within the same visualisation many more different types of relationship, such as which companies invest in certain technologies or which companies and academics collaborate when developing specific technologies.
A knowledge graph also provides transparency by provisioning hyperlinks on the connecting lines (or ‘edges’) as evidence of the relationship between two entities. To further augment the knowledge graph, more attributes can be added to the graph’s entities (or ‘vertices’), for example, an individual’s biography or a company’s financial records. Knowledge graphs therefore convey a greater depth and breadth of information and thus have much more descriptive and analytical power than network graphs.
Applying such an approach makes it possible to identify the salient actors who are converging edtech and AI, highlight the different connections between these actors, demonstrate the core concepts that they promote and around which they coalesce, and explain how and why AI is being introduced in schools, colleges and the workplace. We are able to show how a variety of actors, such as charities and technology corporations, with ostensibly different incentives and values nevertheless agree on the same solutions to problems in education. However, to be able to achieve this, we need not only to apply quantitative measures typically used in network analysis but also to propose how the graph can be understood theoretically. Quantifying the properties of the graph alone lacks explanatory power: it can show how the field of edtech is emerging by allowing us to show who or what is ‘important’ in terms of the graph’s structure, but it does not explain why the entity has this measurable value in the field. To understand the graph’s properties, we need to connect this novel methodology to a theoretical frame. In essence, we view the knowledge graph as a snapshot of dynamic processes that have emergent properties. As more edtech companies adopt AI, our graph represents a temporary stabilisation of a rapidly developing field. One of the affordances of graph databases, particularly graphs that use linked data, is that the data can be automatically updated to include new actors as they enter the field. To understand the dynamics of the knowledge graph we have captured, we conceptualise it not only as a network of actors, concepts and institutions as it first appears to be, but, following Herzig (2016), as also a representation of a Bourdieusean field.
Conceptualising the Graph as a Bourdieusean Field
A field is a relatively semi-autonomous structured domain or space, which has been socially instituted, thus having a definite but contingent history of development (Bourdieu, 1990). Fields are domains of contestation, involving struggles or tensions within which human actors attach value to particular commodities or assets, including skills or resources, and orientate their behaviour accordingly (Bourdieu and Wacquant, 1992). These assets or ‘capitals’ are translated into advantages with fields.
A capital is any resource effective in a given social arena that enables the field’s agents to appropriate the specific rewards arising out of participation and contest in the field. Capitals can be economic (material and financial assets), cultural (scarce symbolic goods, skills and titles), and social (assets drawn from membership of a group). For example, social capital can be nepotistic business contacts; cultural capital can be academic reputation; and economic capital can be access to financial investment. Capitals can be exchanged or shared. Therefore, there is inequality as capitals are unevenly distributed but also mutual dependency as capitals are pooled within fields (Hodkinson et al., 2007). A fourth species, symbolic capital, that will feature in our analysis, is ‘any form of capital whether physical, economic, cultural or social’ (Bourdieu, 1998: 47) which is perceived by a social agent endowed with the categories of perception and appreciation permitting them to perceive, know, and recognize it, becomes symbolically efficient, like a veritable magical power; a property which, because it responds to socially constituted collective expectations. (1998: 102)
These capitals are not immutable assets that spontaneously translate to power and influence in any context: their utility and potential is dependent on the properties of the field within which they are deployed (Bourdieu, 1984). Fields can therefore incentivise and allow capitals to be converted and accumulated. For example, social capital is more useful in fields of economic activity within which business contracts are facilitated by networks of patronage as well as commercial performance. The properties of field are simultaneously objective – such as commercial performance – or subjective including norms and values actors articulate, respond to or try to influence as they operate within the field. These objective and subjective properties can intersect. In the art market, for example, subjective sentiment about an artist’s backstory can increase a painting’s objective value. These norms and values form the field’s ‘logic of practice’. The actors with most sources of capital in the field, including combinations of capital, are more likely to influence this logic of practice while less well-resourced actors are more likely to follow or negotiate with its demands. We propose that Bourdieu’s analytical lens will help to explain how agents operating with this field of AI and edtech, that are captured in the graph, have responded to the field’s logic of practice to survive and thrive.
The use of a knowledge graph and visualisations combined with social theory in this way aims to operationalise what Halford and Savage (2017) call ‘symphonic social science’, which ‘combines a rich theoretical awareness with data carefully chosen to address social questions’ and ‘deploys visualisation as a deliberate analytical strategy rather than a technocratic method of data presentation, as is the case in big data analytics’ (2017: 1139). The knowledge graph then offers a legible visual representation of the field, quantitative analysis of the graph reveals the significant features of the field such as which concepts are discussed the most often by the most entities and Bourdieu’s theory explains the shape and structure of the graph and why certain concepts are discussed more often.
In summary, the purpose of this article is to use a novel combination of theory and method to explain how and why it appears that, yet again, technology, this time using AI, will ‘fix’ education (Robins and Webster, 1989). We focus on three research questions:
Which entities in the field of AI and edtech are most prominent?
What are the main concepts these entities collectively promote?
What likely incentives do these entities have for promoting these concepts?
Given that the use of knowledge graphs is an unusual approach in sociology, we next offer a relatively detailed description of its implementation.
Methodology
Capturing the Data
To capture the field of AI and edtech to represent it digitally, we used a graph database system called Neo4j. Its ‘Community’ version (neo4j.com) is free to use. We began by setting up a host server for the database. We then modelled the data we would need to represent the mobilisation of AI in education. To define the entities that would go into the graph and all the possible relations between these entities, we drew on 20 expert interviews with stakeholders, policy actors, business leaders and academics in the field of AI and education, that took place as part of a larger project taking a critical approach to the relationships between lifelong learning and AI. Participants were purposively sampled due to their expertise and position with academia, the commercial sector and government. Over half the participants were based in the UK, with policy makers primarily from the UK or based in relevant international organisations such as the Organisation for Economic Co-operation and Development (OECD), and the remainder primarily from the USA. This international focus is intentional, as while there are likely to be country-specific influences, the edtech landscape (with AI as a subset) has a strong global network that all stakeholders are aware of and embedded within (Ball, 2012). Interviews took place face to face or via a videoconference and were recorded and transcribed for analysis. The remit of the interviews was relatively broad, and covered topics including: the current landscape of learning throughout all life stages as it is being remodelled by AI technologies, likely future developments, opportunities and challenges, connections between different stakeholders and specific discussions of projects, policies or tools with which the interviewee was involved. We asked for example chief executive officers CEOs of edtech companies in Silicon Valley, who are developing AI for edtech. We also asked members of the academy which companies they were working with, and so on.
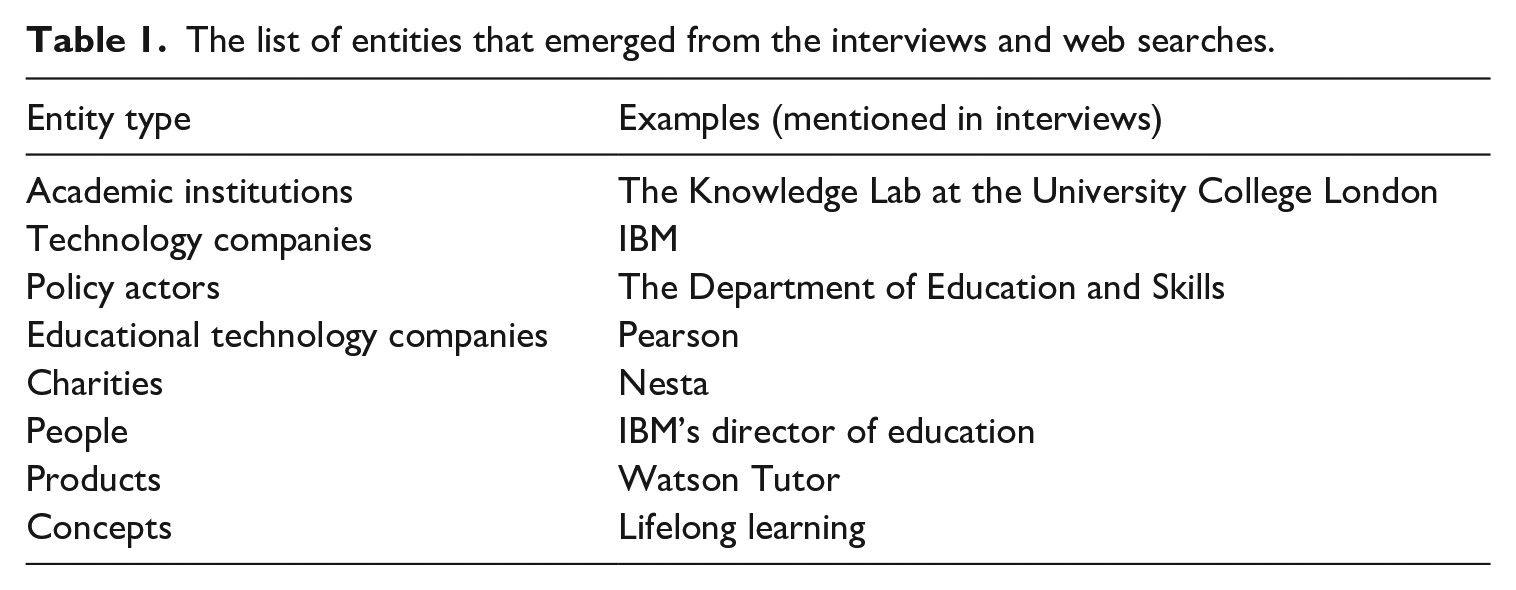
To reflect all the actors produced by our interviews who are researching, investing in, selling, developing and mobilising the concept of AI in education, we compiled a list of entities that all the stakeholders mentioned during the interviews (see Table 1). To describe AI and the technologies and ideas associated with its recruitment, and to capture the various forms of education described by interviewees, we included a category called ‘concepts’.
The list of entities that emerged from the interviews and web searches.
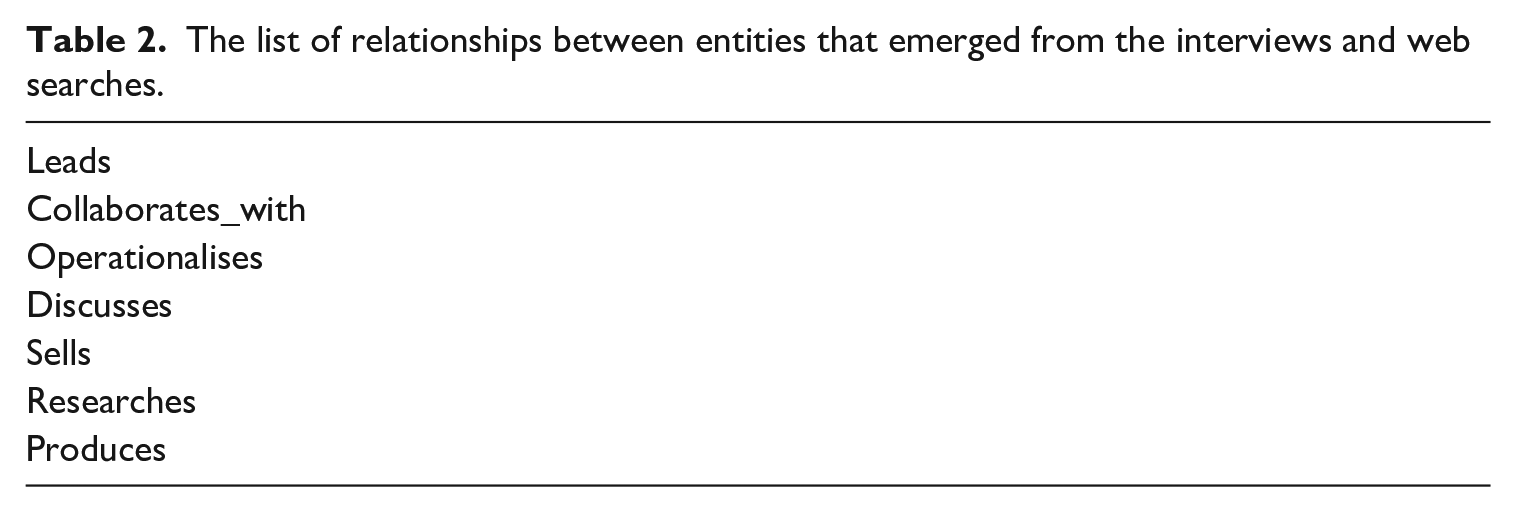
To map the relations between entities, we again turned to the interviews and characterised the relations that stakeholders reported to us (see Table 2). These were not necessarily direct quotes from the interviews, but generalised relationship types generated from across all the interviews.
The list of relationships between entities that emerged from the interviews and web searches.
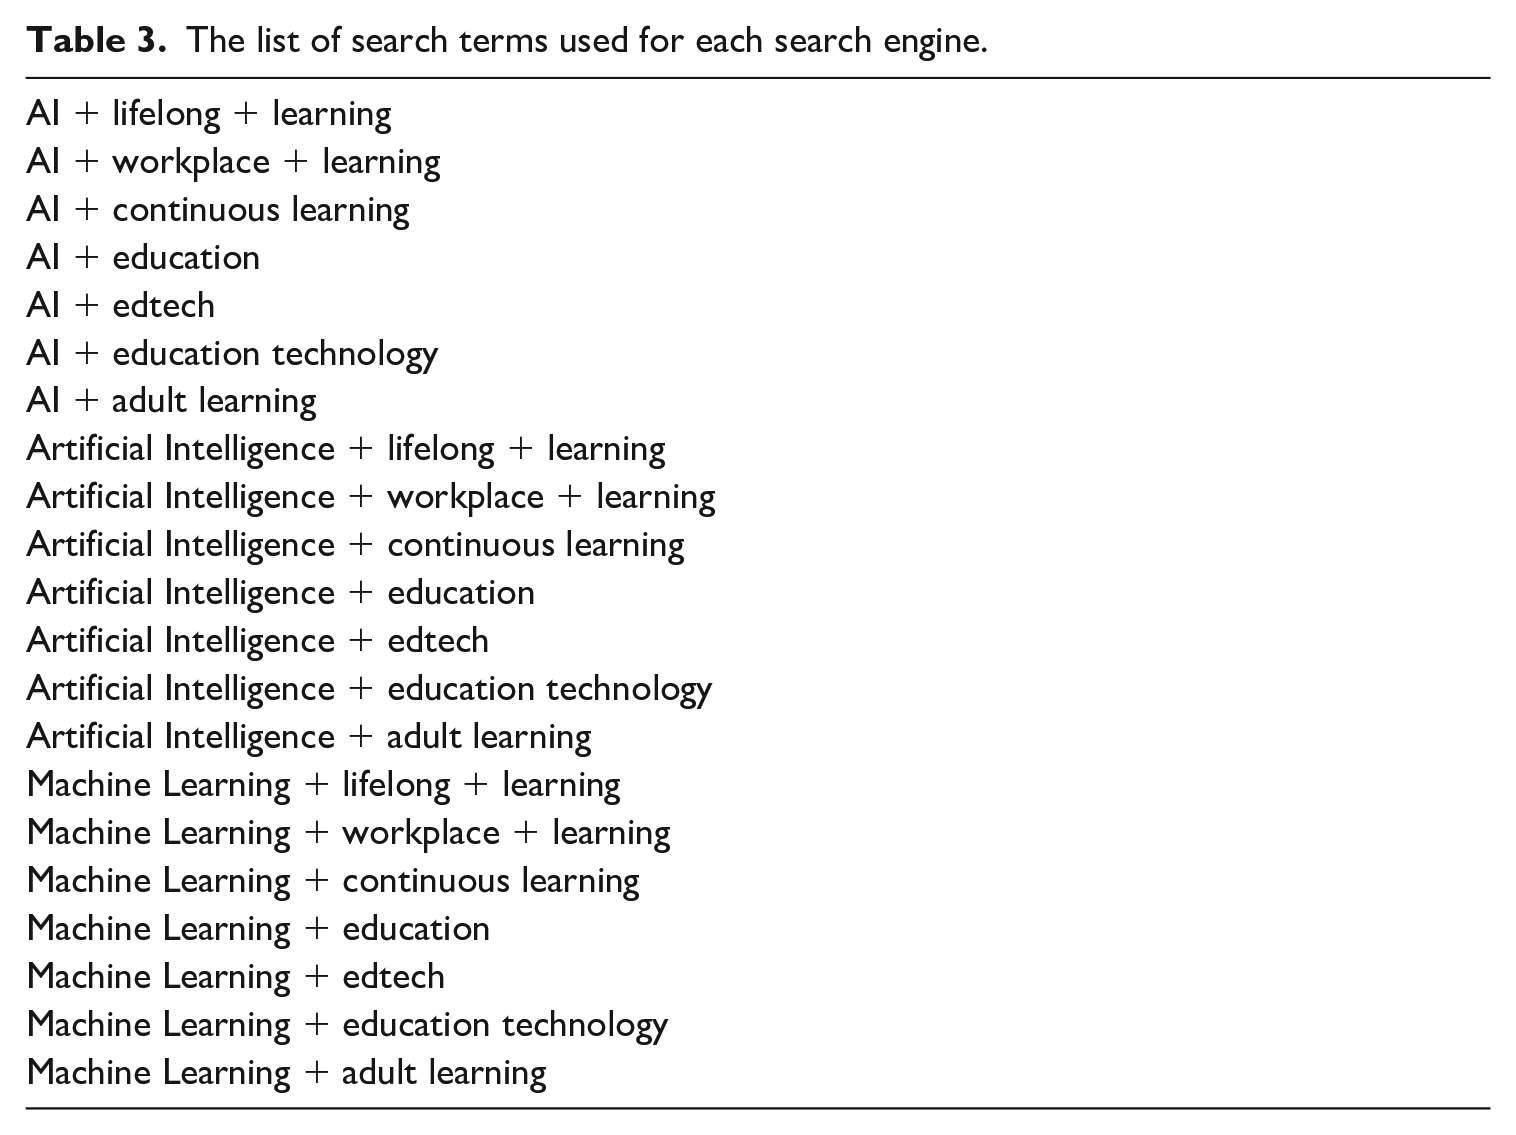
We also compiled a list of concepts mentioned by stakeholders to use for our searches (see Table 3). To capture the whole field of education, our searches included terms mentioned in our interviews that referred to learning contexts beyond formal school and college for teenagers, including continuous, lifelong, adulthood and workplace learning.
The list of search terms used for each search engine.
Constructing the Knowledge Graph
Thus, in the first stage we had used the interviews to model the entities, relations and concepts we used to construct the knowledge graph, and to begin to collate information for the graph. In the second stage we then searched for actors operating at the intersection of AI and edtech by mining the knowledge available on the web and the databases it hosts. To mitigate algorithmic search engine bias (Halavais, 2017) we used two search engines; Google and DuckDuckGo. These two search engines use different algorithms to probe the web (Halavais, 2017) so we would expect to see some subtle differences in results that would increase potential coverage of the domain. We developed a Python script for automating the search process using the terms in Table 3 and a Python script to scan web pages for the entities and relations in Tables 1 and 2. These searches were conducted in the UK: the implications of this will be discussed further in the analysis and discussion below.
It is, however, beyond the capability of such a script to tell the semantic difference between, for example, a ‘technology company’ and an ‘edtech company’ and between ‘operationalises’ and ‘sells’ as we use them in the graph. Consequently, we adopted an iterative, human-in-the-middle approach to developing data capture, processing, modelling and analysis, within which the human expert makes a judgement that is beyond the machine’s ‘intelligence’. After identifying the entities and their relations we added them to the flat file database in a spreadsheet ready to be transferred to Neo4j.
Inclusion Criteria
Many of the search engine results pages were dominated by nondescript speculative commentary and the discourse of ‘business intelligence’ including ‘click bait’ headlines such as ‘7 ways AI will transform education’. These would rarely mention an entity we could identify. Their authors would often refer to ‘research’ but never cite it. So, while interesting for the content of their discourses, these web pages were useless for our study. When we found entities, we asked: is this an entity that fits one of our categories? And, is it an entity that is part of the database already or do we need to create a new category to include it? Also, does the entity have a relation to another entity either within this search data, any of the websites yielded by the searches, or with an entity that already exists within our database?
After all the searches in Table 3 were performed in Google and DuckDuckGo and the entities they produced were evaluated against the criteria above, they were added to the entities and relations identified in the interviews. As a result of this process we were left with a final list of entities and relations. There was significant overlap between the information gathered by the two approaches, with the web search data providing a more complete view of the field. Collating the data from both methods in this way was important to capture different perspectives and representations of the field. The flat file database and an explanation of its purpose, structure and contents is available via this article’s online appendix.
Next, we transferred the entities to Neo4j using its query language – ‘Cypher’. When transferred from the flat file to the graph, the entities become ‘vertices’ in the graph. As explained above, in knowledge graphs, vertices can hold any number of attributes called ‘properties’. This Cypher statement, for example, creates a new node of type ‘Company’ and adds a property called ‘name’, then attributes the value ‘Apple’ to the ‘name’: CREATE (c:Company {name: ‘Apple’})
We therefore have an entity or node in the graph that represents the Apple company. To add more knowledge to the graph, we added other attributes to the node, including its company website address. There is no limit to how many attributes we can add to enhance the graph, including, for example, the location for Apple’s headquarters, data about its supply chains, its current valuation and so on. However, in this, the graph’s first stage, we confined the attributes to type of entity, visual appearance, URL and relationships with other entities in the graph.
Next, we established the relationships between vertices in the graph. Again, we used Cypher statements. For example, the statement below creates a relationship described as ‘Sells’ between the ‘Company’ node named ‘IBM’ and the ‘Product’ node named ‘Watson Tutor’. The arrow after ‘Sells’ indicates this is a directed relationship from IBM towards Watson Tutor: CREATE (c:Company {name: ‘IBM’})-[:Sells]→(t:Product {name: ‘Watson Tutor’})
Although they are stored in a specific direction, relationships can always be navigated efficiently in either direction and two vertices can share any number or type of relationships. As with entities, to give them more contextual data, it is also possible to add attributes to relationships. In this graph, we have included the URL that we found in our searches that provides evidence of the relationship that we establish between vertices in the graph. We included these URLs in our spreadsheet. To save time, we wrote a Python script to automate this transfer of data between the spreadsheet and Neo4j. We next present and discuss the resultant graph.
The Knowledge Graph
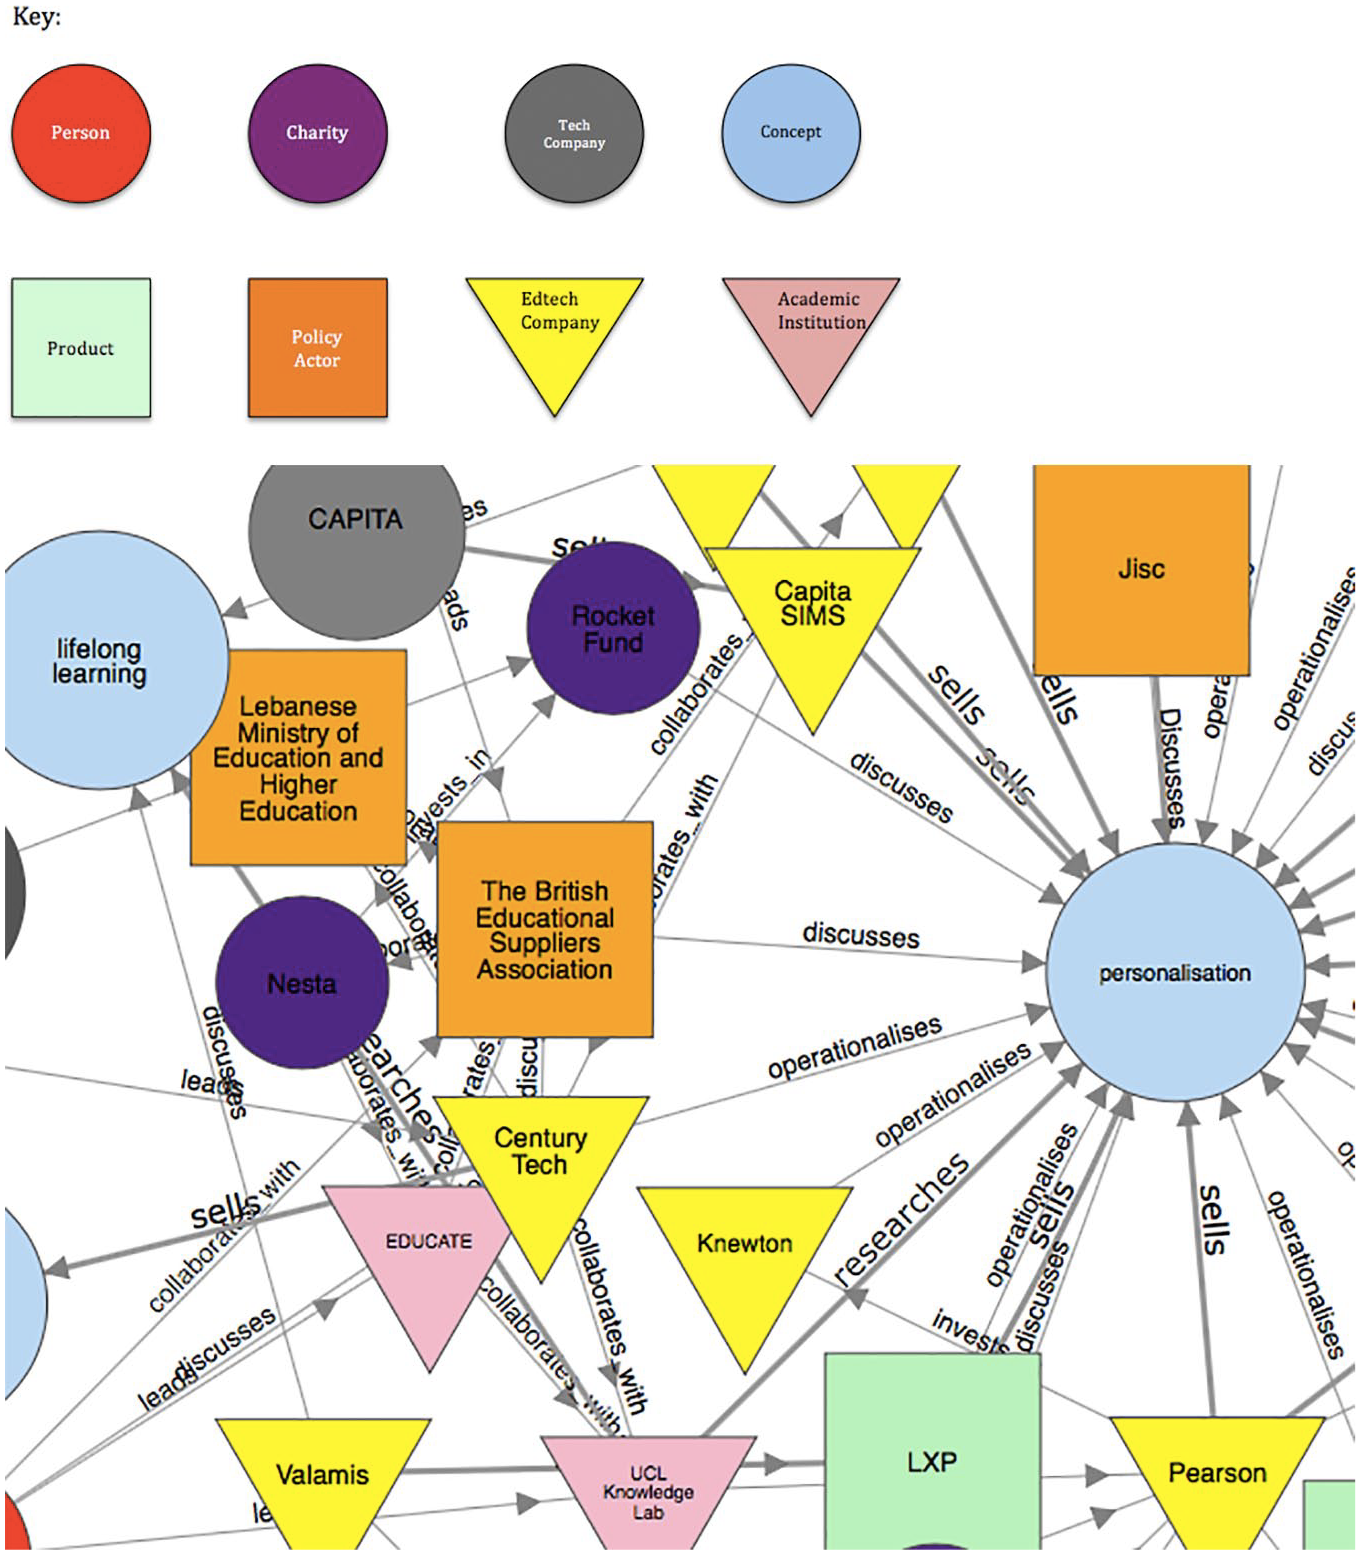
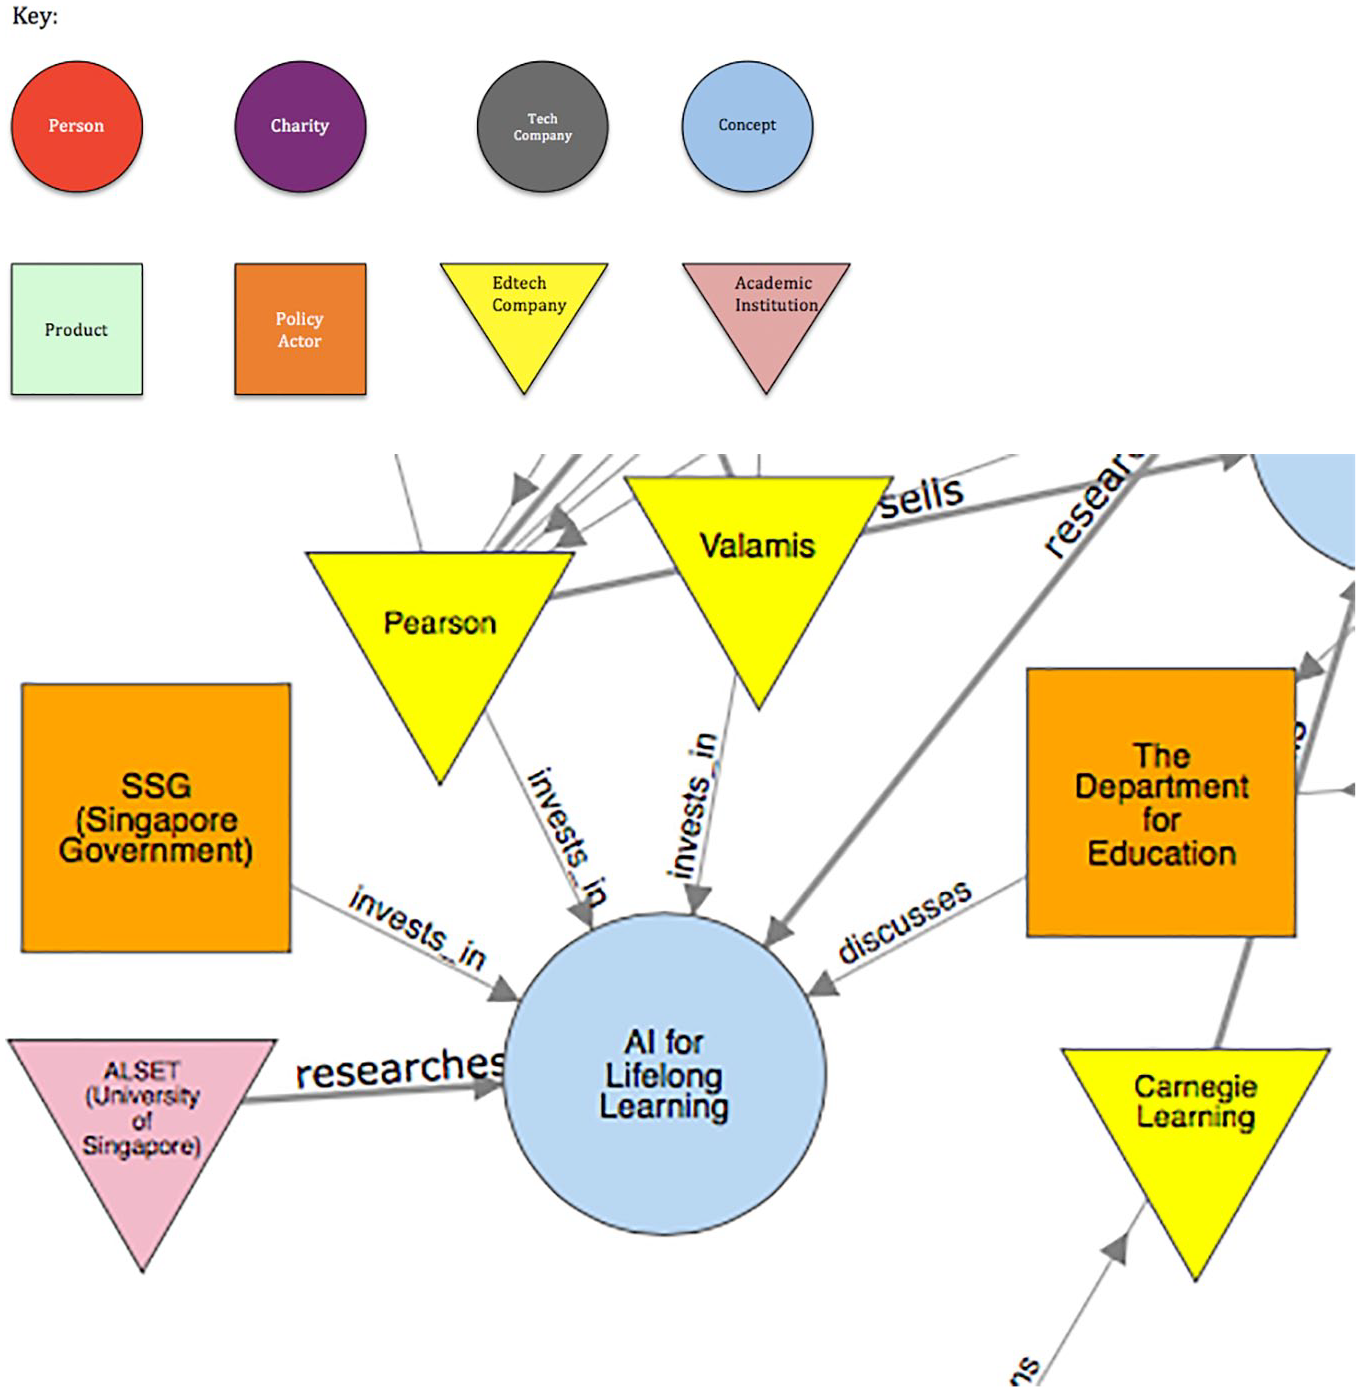
The total knowledge graph can be seen in Figure 1. It is important to note that this graph is one representation of the edtech field as it mobilises AI. It is, like all empirical research, a partial representation of the reality it is intended to measure. It only captures one moment in time in the field as it emerges. It crosses geographical boundaries, as is characteristic of the edtech sector as a whole, but it is also shaped by our searches in English and our location in the world. It represents the complexities of understanding these entities and the relationships between them in a digitally mediated world: some entities meet in person; others only collaborate digitally. This methodology provides a novel but necessarily partial view of this field.
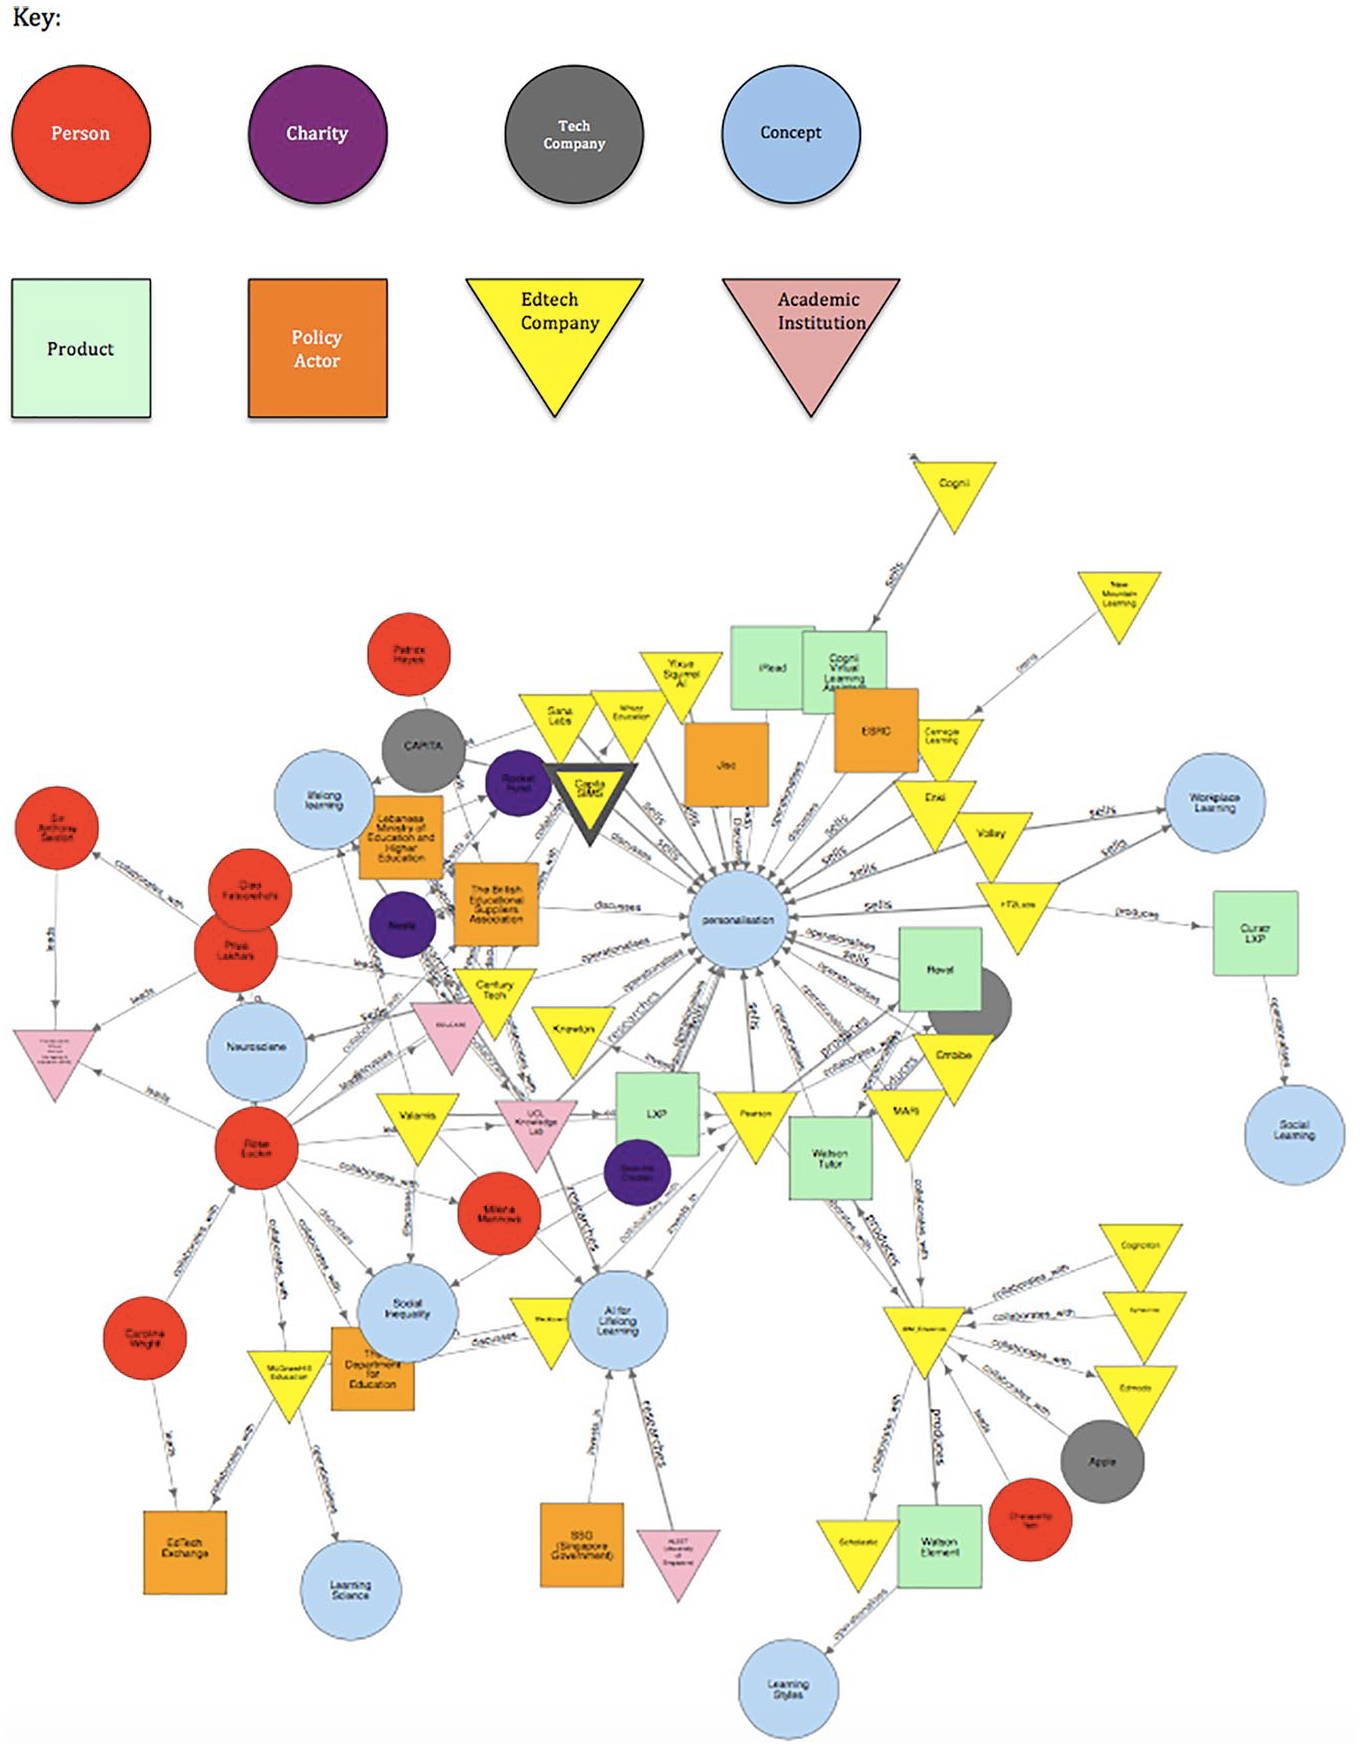
A representation of the whole graph.
Within the network, we identify the nature of the relationship between entities and provide a URL to provide evidence of its existence. The eight shapes and colours (see keys with each figure) are utilised to characterise the different entities including technology companies, edtech companies, academic institutions, individuals, charities and policy actors. We also include concepts in our network referred to by entities in their discourses, which we also evidence in the URLs. This helps illustrate the power of concepts to mobilise actors in the network through a shared understanding of solutions to problems in education. Its implications are explored in the sections below.
Analysis
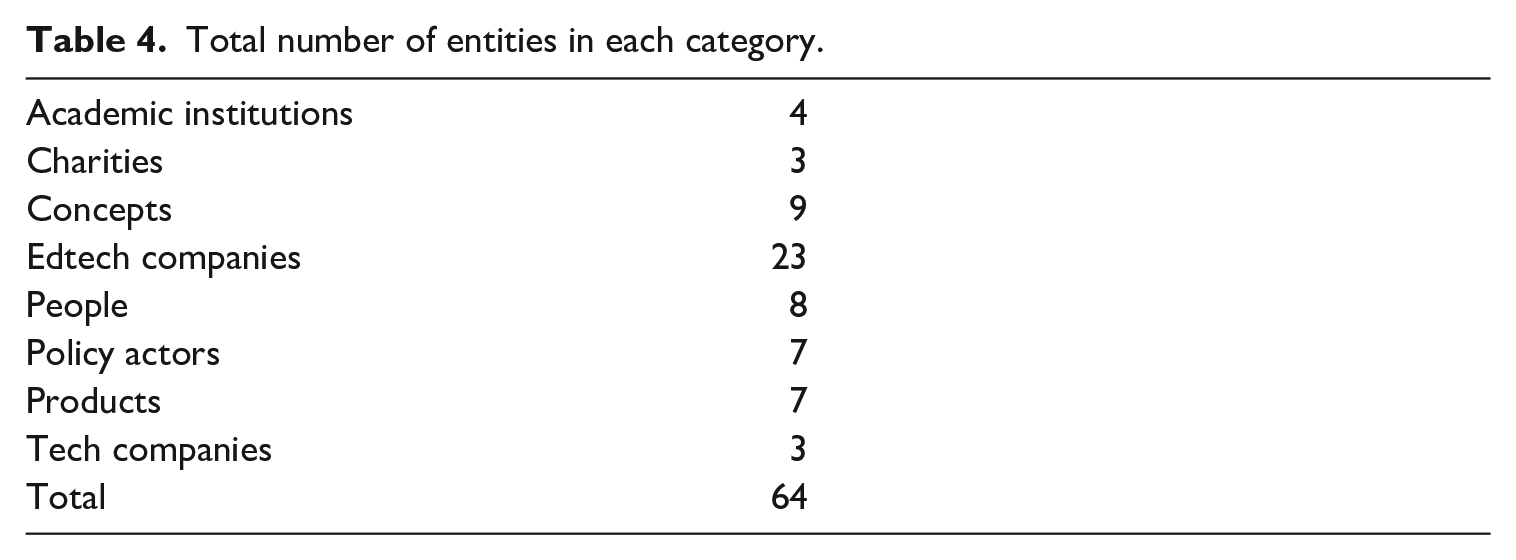
Through looking at the total knowledge graph, and the related key, it is possible to see, for example, the strong commercial influence within this sphere that has been highlighted by other work in this domain (e.g. Ball, 2012). This is supported numerically by the number of entities in each category in Table 4. It is also possible to see how some actors seem particularly well connected or have an important role in linking together different kinds of entities, and we similarly see that some concepts seem to have a central significance.
Total number of entities in each category.
As noted above, there are many ways to quantitively measure the properties of networks that would help to interpret these qualitative judgements. However, this does not explain why these entities are important. Therefore, despite carrying more information than a network diagram, this knowledge graph combined with a quantitative analysis, in isolation, still lacks explanatory power. As Halford and Savage (2017) state in their discussion about ‘symphonic social science’ it is important to use social theory alongside this quantitative representation. Here, to address this concern, we view the knowledge graph as a snapshot of dynamic processes with emergent properties that represent a Bourdieusean field (Herzig, 2016).
From quantitative measurements of the graph (such as which entities have many incoming or outgoing connections) we can infer which entities have significance in edtech. Conceptualising the knowledge graph as a Bourdieusean field enables us to augment this analysis by illustrating how agents in the field of edtech are positioning themselves, making associations and operationalising AI-solutionism in response to the field’s tacit structure; its constraints, incentives and demands.
In the sections below we analyse two primary findings that emerge from this approach: the significance of personalisation and the absence of certain actors from the graph.
Explaining the Power of Personalisation
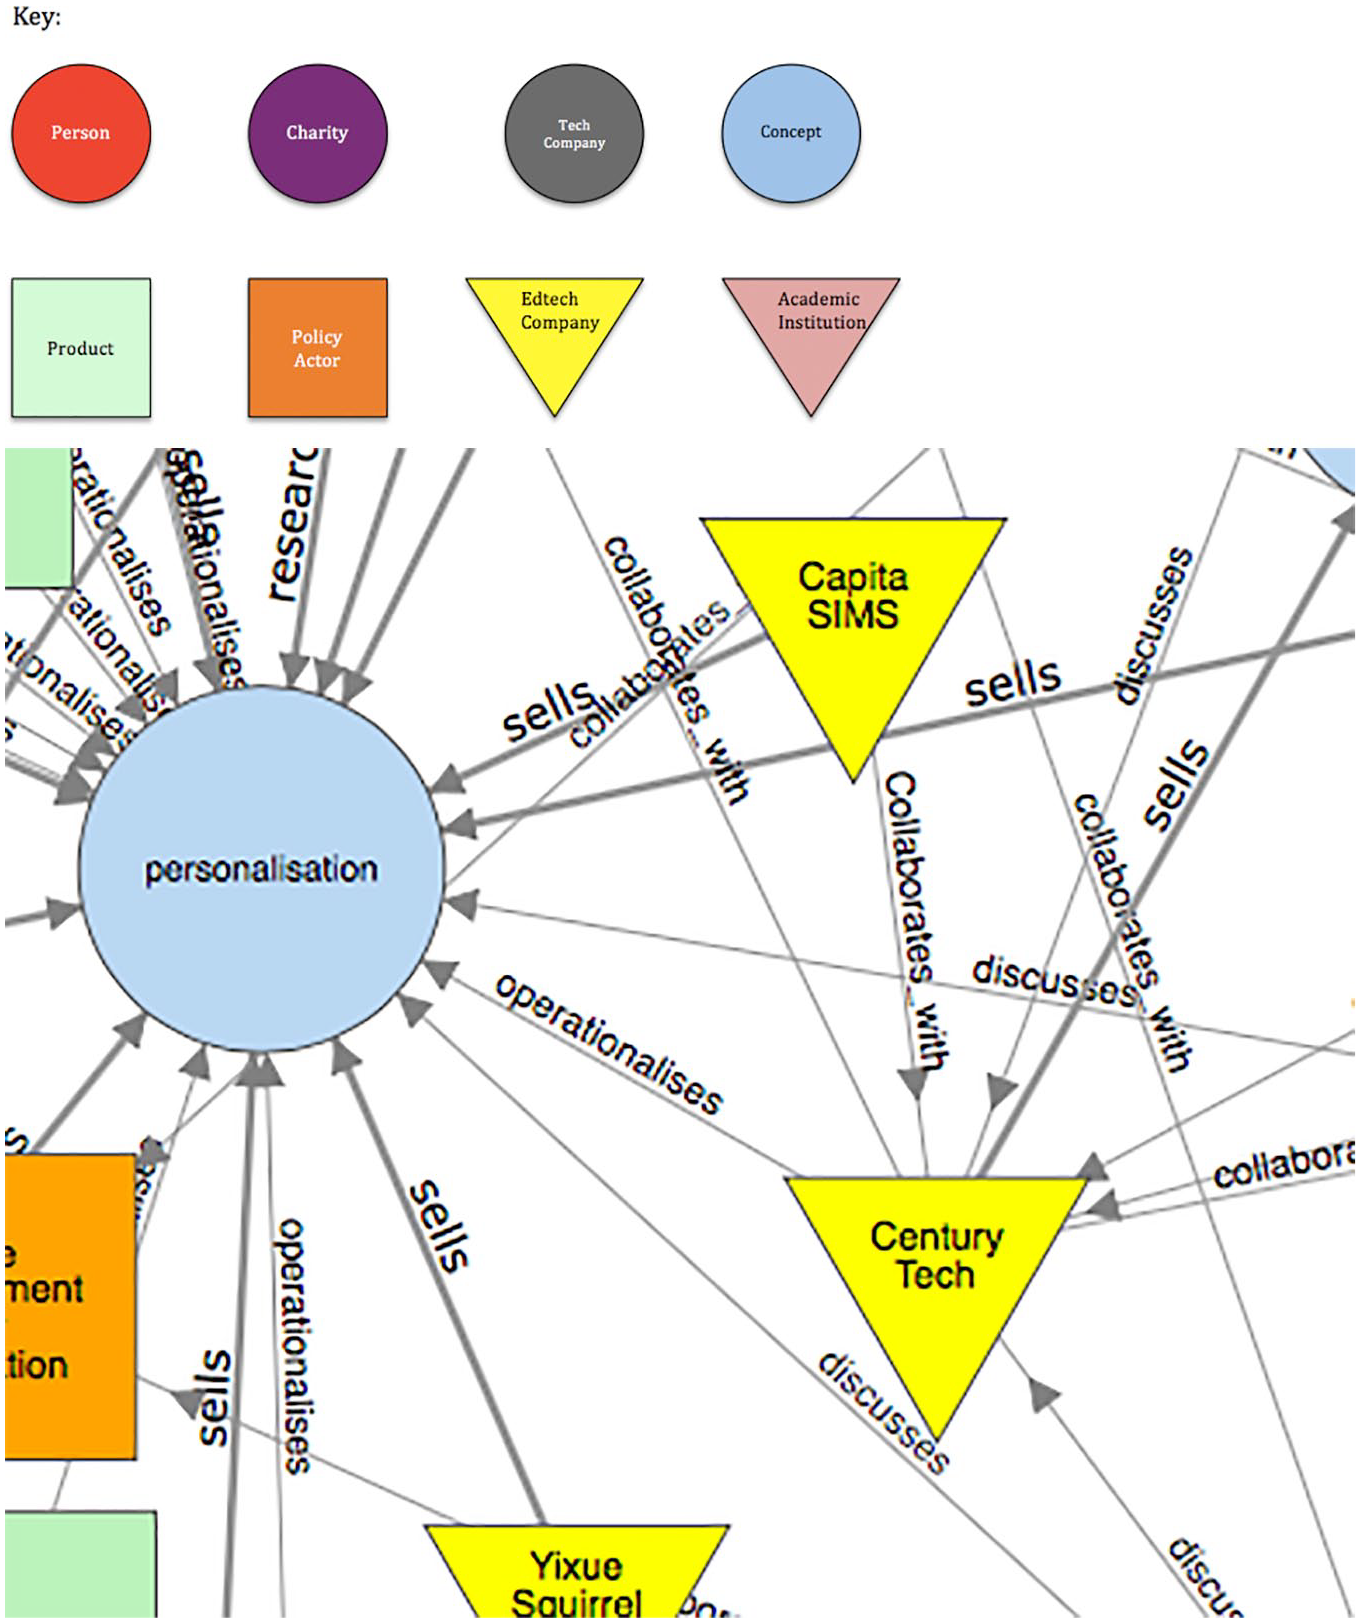
With its 26 incoming connections, in the lexicon of graph theory personalisation has the highest ‘in-degree’ (26) of any entity on the graph (see Figure 2, the connections are highlighted in blue).
A zoom-in on the concept of personalisation and its connections.
A key question is why is personalisation so prominent? Is it because AI-enabled personalisation is succeeding as its advocates claim it can? Technology vendors such as Century Tech (2020) claim their form of personalisation is supported by ‘the latest research in neuroscience and learning science’. Although customers often report successes with the technology, products such as this are yet to have their claims independently tested. A recent meta-review of the evidence concluded that ‘computer-assisted learning’, which can include AI, ‘due to its ability to personalize instruction, potentially, can be quite effective in helping students learn, particularly with math’ (J-PAL Evidence Review, 2019: 20). However, ‘more research is needed to understand which components of computer-assisted learning most contribute to effective programs, how best to offer them, and which types of learning activities are best suited for software-based instruction’ (J-PAL Evidence Review, 2019: 20). Indeed, apart from the general principle of educational content, which through a combination of algorithms, training models and user data, is adapted for a learner’s individual needs, there are no ‘established standards for describing or evaluating the extent to which a learning experience is personalized’ (Bulger, 2016: 4). Given this lack of peer reviewed evidence and available benchmarks, we have to look elsewhere for an explanation of AI-enabled personalisation’s particular influence in education.
A possible reason for personalisation’s popularity is its interpretive flexibility (Bijker and Pinch, 1992). Because personalisation is semantically ambiguous it can mean different things to different communities. Hartley (2007) traces personalisation in education back not, as we might expect, to any philosophy of education or learning but to marketing theories of customisation and tailoring of services and co-production of value that are now being operationalised by adtech, the marketing industry and media and entertainment industry giants such as Netflix (Roberts-Mahoney et al., 2016).
This interpretive flexibility allows personalisation’s potential power to eclipse its current value. We are told if personalisation powered by AI is embraced then this leads to a more effective, efficient and transformed education system. For example, a recent UNESCO report stated that, ‘AI has the potential to accelerate the process of achieving the global education goals through reducing barriers to access learning [. . .] and help identify new forms of personalized learning that can support teachers and tackle education challenges’ (UNESCO, 2019: n.p., emphasis added). Jisc (the body that advises UK universities on digital policy) claims ‘personalised adaptive learning – an individualised approach that takes learner diversity, performance and behaviour into account’ will fix the ‘factory system’ of education (TES, 2018: n.p.). Nesta (2019: 17) tells us, ‘students from advantaged backgrounds are currently disproportionately more likely to access a private tutor’. Parents who can afford private tutors use them to help their children pass grammar school entrance exams, GCSEs and A levels (Kirby, 2016). Nesta claims personalised AI could help equalise the life chances of students whose parents cannot afford such support by offering them ‘an alternative’ to private tutors (Nesta, 2019: 17).
Within this field, AI-enabled personalisation is valued as transformative and emancipatory; able to remedy obsolete and dysfunctional education systems that are limiting people’s potential. According to the field’s logic of practice, therefore, a subscription to the power of personalisation signals a commitment to such progressive aims, such as more social mobility, rather than other, less quixotic, goals such as profit. The field’s logic of practice has created a ‘convergence of the social conditions’ (Bourdieu, 1991: 72) within which endorsing personalisation becomes an ‘act of institution’ (1991: 72) that fast tracks access to the field and the rewards it offers.
This does not mean that all the actors in the graph have the same ideology or do not have some reservations about how AI could be used in education. Personalisation’s symbolic capital mobilises ‘a diverse set of participants with a variety of interests, commitments, purposes and influence’ that ‘are held together by subscription to a discursive ensemble’ (Ball, 2012: 11). Within this ‘discursive ensemble’ (2012: 11) personalisation ‘circulates and is legitimated by these network relations’ (2012: 11) becoming a social adhesive that binds its actors together into ‘alliances, mobilizing their connections across public, private and civil society sectors’ to ‘translate disparate activities around agendas into major policy concerns’ (Williamson, 2016: 40).
However, personalisation’s value is not derived from its progressive credentials alone. AI-enabled personalisation also represents a form of symbolic capital that can be converted to economic capital within the field. As illustrated in the knowledge graph, the logic of practice in this field incentivises mutually beneficial partnerships, usually between different private companies or private companies and public institutions. For example, academics rely on funding from research councils, philanthropic foundations or commercial sponsors. The requirements universities have to meet to gain funding are made explicit in calls, but they are also codified in the discourses of funding institutions. To illustrate, the UK’s Economic and Social Research Council (ESRC), another institution in the graph, reproduces the discourses on personalisation. This is an extract from its blog: ‘In education, artificial intelligence and machine learning can provide customised e-learning solutions that are tailored to an individual’s needs and preferred mode of learning’ (Corfe, 2018: n.p.).
This shows the ‘upcoming future’ for academics in the field of edtech (their funding landscape) that is ‘contained in the present’ (Bourdieu, 1990: 66). The ‘sensible practice’ (1990: 66) is to embrace the orthodoxy of personalisation and its commodification to secure funding. From the outside looking in, this appears to be ‘consensual validation’ (1990: 66) of personalisation of everyone in the network. Meanwhile, commitment to the discourse on personalisation enables academics to access the economic capital of the prestigious and relatively wealthy funding bodies such as the ESRC, in this case; that incentivise and reward commercial partnerships via specific funding schemes such as supporting Knowledge Transfer Partnerships (KTPs) that enables research organisations to apply their research knowledge to important business problems.
The relationships are bidirectional. There are also incentives and gains for companies to access the forms of cultural capital academic institutions possess. When they do so, a university’s prestige and reputation for rigour and impartiality are conferred on the company and its products. Many of the collaborations in the graph, therefore, involve academic institutions giving prizes to companies developing AI-enabled personalisation (for example, EDUCATE, run by University College London (UCL), awarded Century Tech a prize in its ‘EdWards’). Such awards are a source of symbolic capital for edtech companies that captures an educational institution’s prestige in a commodifiable form by using academic endorsements in their marketing.
Strategic partnerships between young companies started with philanthropic venture capital and well-established corporations offer access to economies of scale. For example, Century Tech has partnered with CAPITA the private corporation that has sold its management information system (SIMS) to over 21,000 schools, including over 700 independent and international schools in 49 countries (see https://www.capita-sims.co.uk). This relationship is evidenced by this link: https://www.capita-sims.co.uk/products-and-services/century on the connection or ‘edge’ between SIMS and Century Tech in the graph. The link also shows SIMS and Century Tech have a shared commitment to the concept of personalisation (see Figure 3).
Century Tech and Capita SIMS’s shared commitment to the concept of personalisation.
The graph also shows the British Educational Suppliers Association, in partnership with UK government, brokering deals between the Lebanese government’s education department and British edtech companies, including Century Tech that are selling personalised learning (see Figure 4).
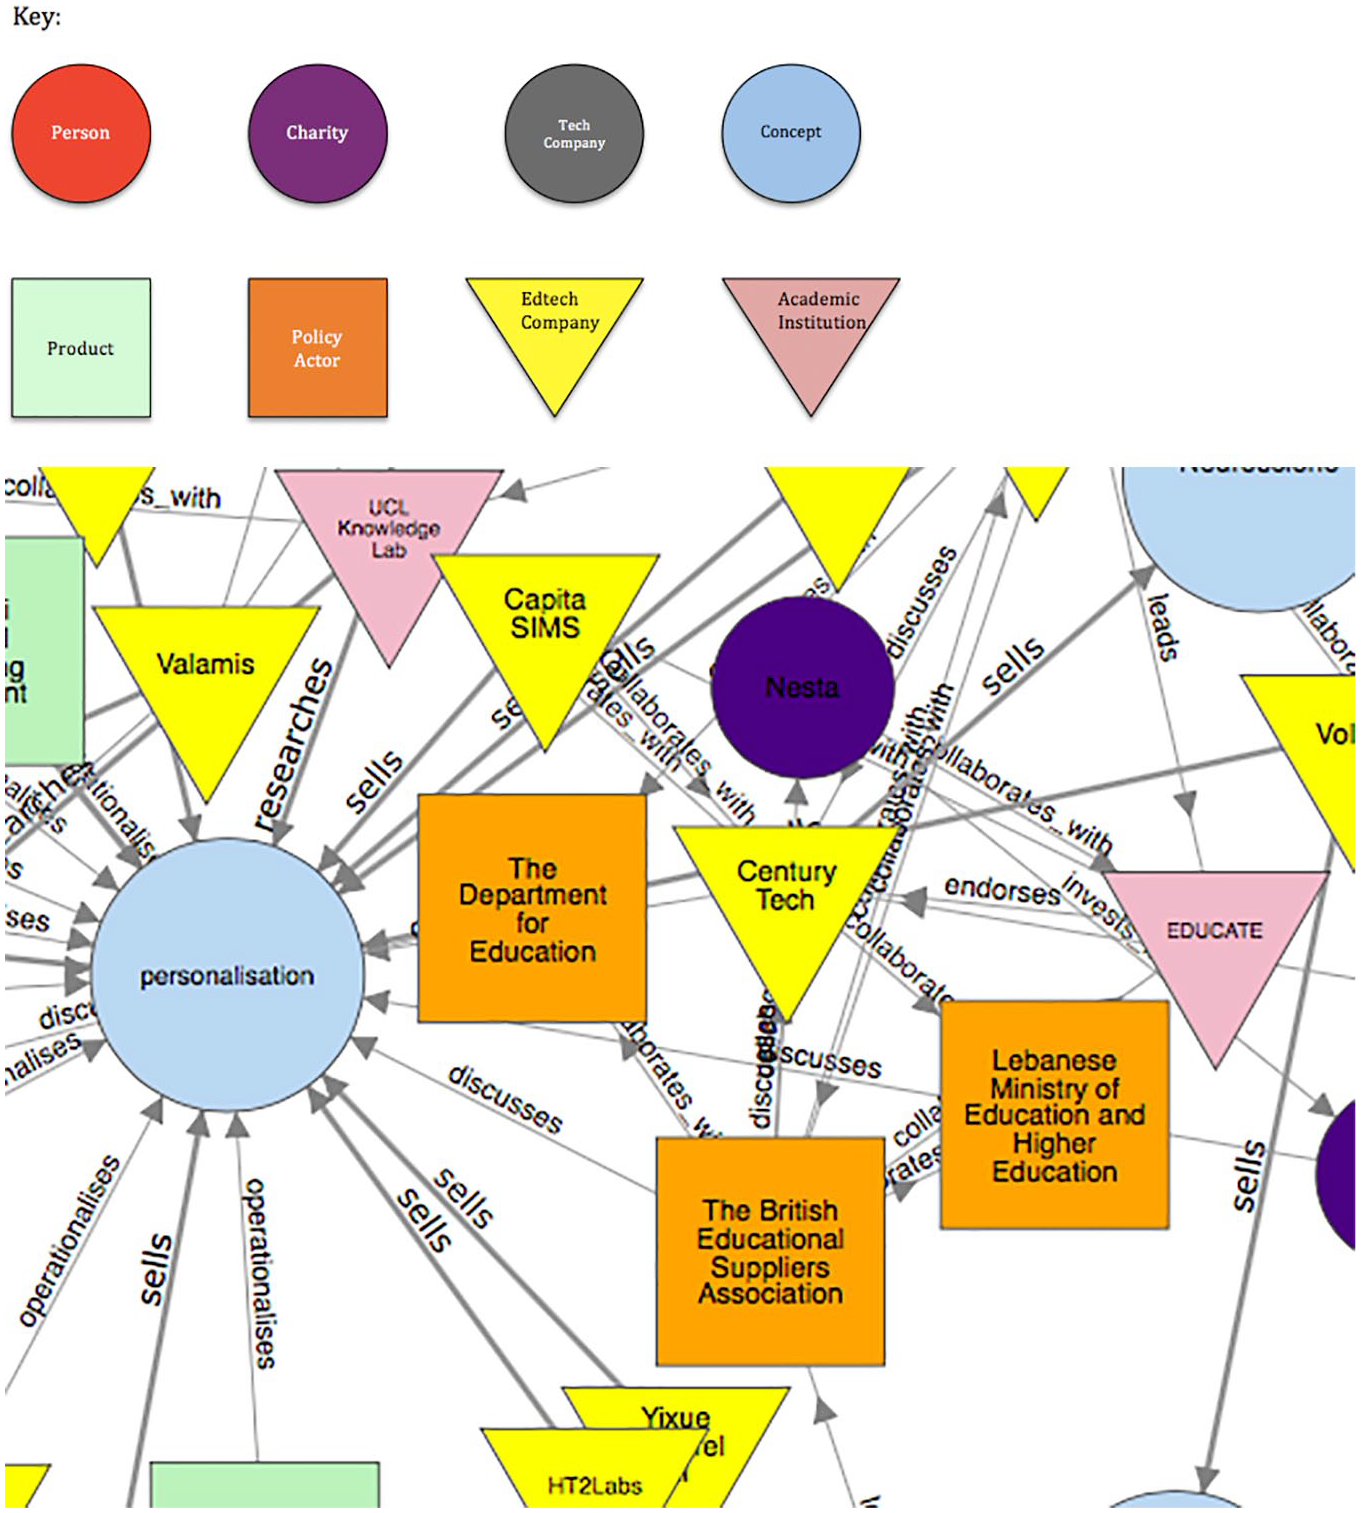
The relationship between the British Educational Suppliers Association, the UK government, the Lebanese government and Century Tech.
We can therefore observe philanthropic investors, entrepreneurs, academics, government departments, professional trade bodies and charities working together to produce educational futures through the field’s logic of practice with a commitment to AI-solutionism through personalisation at its heart.
The economic capital-wielding entities in the graph are private corporations such as Capita, Pearson and IBM. To operate effectively in this field, academic institutions have to accomplish access to the forms of capital these commercial entities have at their disposal. These partnerships are possible because personalisation has symbolic capital for the private sector commercial entities selling its promises and public sector institutions such as universities and funding bodies seeking to improve edtech’s evidence base.
Compare, for example, personalisation’s value in the field of edtech to the significance of lifelong learning. The rhetoric around the need to ‘fix’ educational systems to address current societal problems is applied to all levels and sectors of education. However, the graph shows significant differences in the development of products for different educational markets that target learners at different stages in their lives. The relatively weak presence of lifelong learning in the graph (it has only five incoming edges compared to personalisation’s 26) (see Figure 5) shows it possesses few capital enhancing properties in the field.
Lifelong learning’s relatively weak presence in the graph.
Lifelong learning is mentioned as a reason for investing in AI, but unlike schools, colleges and universities, few companies are pursuing lifelong learners with their products. The concept of lifelong learning is insufficiently integrated into the field’s logic of practice. This may be because lifelong learning is less profitable than AI: when there are so many ‘free’ learning resources available to lifelong learners such as YouTube, it is difficult for specialised lifelong platforms, even through advertising revenue, to break into the market. This is reinforced by a political preference for individualised fixes to social problems like social inequality that fit the most ‘deserving’ in society; of which young people form an important group. While states see themselves as responsible for young people, adults are more responsible for their own education and accessing the many resources available to them.
Meanwhile, for those with the expedient sources and combinations of capital available to them, personalisation is a totemic principle that enables a shared platform for the public and private sector to collaborate.
The Importance of a Sociological Response
Conversely, however, an important subset of academics is absent from this graph. During our scans and analysis of all the websites and documents produced by our searches, we found none of the most cited academics on the sociology of education relative to technologies (such as Selwyn). This may be in part due to other methodology: we did not actively search for ‘sociology’ as a keyword, but regardless we originally anticipated that their academic work would have emerged as part of the field in some form whether this may be a research group, an academic, a report or article. We did not search, for example, for NESTA or Jisc or for personalisation but they all are part of the field. So what other alternative explanations are there?
An important reason may be because sociologists tend not to subscribe to the logic of practice of the field, particularly its endorsement of AI-enabled personalisation. This is clear, for example, in the focus on personalisation as a way to promote ‘social mobility’. For its policy advocates in our graph personalisation within AI and education is a method of investing in human capital and enabling people to be more economically and civically active (see, for example, Nesta, 2019). Yet, sociologists argue that such a narrow and instrumentalised philosophy of education that conceives of learners as sources of human capital that can transcend structural inequalities through tech-enabled learning is problematic (Pykett, 2009; Roberts-Mahoney et al., 2016; Selwyn, 2016). They show that technological interventions built following such logics have failed in the past across many sectors of society including education (Payne, 2012; White and Selwyn, 2012). Indeed, many studies have shown that despite having significant personal and democratic value, education, whether it is technologically enhanced or otherwise, is not a golden escalator to a higher social class or wealth (e.g. Atkins, 2010; Goldthorpe, 2016).
This absence of sociological thinking within the field matters because there are other, external and structural pressures on education systems that could make AI-led interventions backfire. If for example, AI-enabled personalised learning is introduced into a sector of the education sector that is chronically under-resourced and suffering from a shortage of specialised qualified teachers, there is a danger the technology will be exploited to, for example, increase class sizes for existing teachers. AI’s advocates argue that its benefits are self-reinforcing: if it reduces teachers’ workload then this will boost teacher recruitment. There are, however, pressures on teacher recruitment that AI is unable to affect such as house prices around popular schools (Gingrich and Ansell, 2014).
Equally, if there are unequivocal benefits to personalisation augmented through AI, only schools with the infrastructure and financial resources to buy the technology, support its implementation and upkeep, renew licences, train staff and use it to complement specialised qualified teachers will be able to reap its rewards: rather than the significantly under-resourced or poorly managed schools in most need of positive interventions. Moreover, as Friedman and Laurison (2019) and Markovits (2019) show, the use of personal tutors is one of many strategies that parents who are rich in social, cultural and economic capital use to ensure their children succeed in education. Therefore, while it may raise achievement levels in some subjects, AI is unlikely to level the playing field in any meaningful way: particularly if it mainly benefits already privileged learners.
The sociology of education also tells us this field of AI and edtech is emerging from a wider political economy within which the whole purpose of education is being contested. Public education is being transformed into something that can be quantified, graded, compared, audited, translated into league tables and made accountable to managerial decisions (Ball, 2017). There is a danger that personalisation via AI becomes the ‘latest phase in the marketization of education’ (Hartley, 2007: 630) that individuates us; segments us off, and severs us from our collective bonds to make us more alienated and receptive to targeted strategies to sell us solutions to our desires and problems (Hartley, 2012).
This threat exists because, with its definitive and quantifiable outcomes, AI is attuned to this economic logic of practice, which increasingly is about providing a productive workforce that has been ‘upskilled’ in science, technology, engineering and mathematics (STEM) subjects to meet the calculated and urgent needs of the economy: ‘a pipeline to prosperity’ (Davies and Eynon, 2018). Unless AI-led educational interventions are more sociologically informed, they could end up, ironically, just reinventing for the 21st century the factory model of education we are being told AI will transform; and ultimately reinforce existing inequalities. A sociological approach to education policy would help ensure the utilisation of AI is articulated with a wider strategy to facilitate a more equal society that better defines AI’s boundaries; and address how technology is mobilised in particular communities coping with external, structural pressures that are beyond their control.
This should begin by improving the evidence base for the mobilisation of AI with ‘studies that are interdisciplinary, nondeterministic, locally situated, and designed to examine the recursive relationship between human action and the wider organizational and system contexts’ (Greenhalgh et al., 2017: n.p.) that includes the field of edtech and the structural, societal, conditions that influence it. If this research was then operationalised through strategic coordination that had learned from previous mistakes, and future policy was built on what we know from scholarship about the relationship between educational technologies and educational inequalities, then future knowledge graphs about AI and edtech would look very different.
Conclusion
We have mapped and conceptualised the field of AI and education, and highlighted how AI in the guise of personalisation is a core concept within the field that is promoted as a way to fix education through, for example, making learning more efficient and effective and addressing social inequalities. We limited the size of the graph to the insights of 20 experts and what was found on the web via a specific search strategy, and then conceptualised what we discovered as a Bourdieusean field. Future work could expand the graph by adding more sources of data to examine in more depth what we mean by external, structural, pressures or what Bourdieu (1977) called ‘structuring structures’ that defeat or enable educational outcomes; and link them to the broader political economy, and be more explicit about the forms of capital in circulation through, for example, examining Capita’s financial structures. These fields, too, are always evolving. A more sophisticated graph, utilising semantically linked data (Halford et al., 2013), could adapt to this development by, for example, adding entities as websites are updated in real-time. Indeed, the use of graphs in studies of society and technology within the field of education has enormous potential. Nevertheless, in this analysis we have demonstrated how and why the incentives, rewards and constraints of the field of edtech are influencing the translation of AI into educational interventions and why some strategic sociological thinking is needed to guide them.
Supplemental Material
sj-xltx-1-soc-10.1177_0038038520967888 – Supplemental material for The Mobilisation of AI in Education: A Bourdieusean Field Analysis
Supplemental material, sj-xltx-1-soc-10.1177_0038038520967888 for The Mobilisation of AI in Education: A Bourdieusean Field Analysis by Huw C Davies, Rebecca Eynon and Cory Salveson in Sociology
Footnotes
Acknowledgements
The authors would like to thank the three anonymous reviewers for their helpful comments on the article and Dr Erin Young for her contribution to the research project.
Funding
Supplemental material
Supplemental material for this article is available online.
References
Supplementary Material
Please find the following supplemental material available below.
For Open Access articles published under a Creative Commons License, all supplemental material carries the same license as the article it is associated with.
For non-Open Access articles published, all supplemental material carries a non-exclusive license, and permission requests for re-use of supplemental material or any part of supplemental material shall be sent directly to the copyright owner as specified in the copyright notice associated with the article.