
Abstract
This study uses data from consecutive England and Wales censuses to examine the intragenerational economic mobility of individuals with different ethnicities, religions and genders between 1971 and 2011, over time and across cohorts. The findings suggest more downward and less upward mobility among Black Caribbean, Indian Sikh and Muslim people with Bangladeshi, Indian and Pakistani ethnicities, relative to white British groups, and more positive relative progress among Indian Hindu people, but also some variation in the experiences of social mobility between individuals even in the same ethnic groups. For some groups, those becoming adults or migrating to the UK since 1971 occupy an improved position compared with older or longer resident people, but this is not universal. Findings suggest that these persistent inequalities will only be effectively addressed with attention to the structural factors which disadvantage particular ethnic and religious groups, and the specific ways in which these affect women.
Introduction
The evidence for the socioeconomic disadvantage experienced by most, although not all, people with ethnic minority backgrounds in England and Wales compared with the ethnic majority is indisputable. Research shows persistent disadvantage among Bangladeshi, Black African, Black Caribbean and Pakistani people (Heath and Smith, 2003; Kapadia et al., 2015; McGregor Smith, 2017; Platt, 2005; Weekes-Bernard, 2017), despite educational improvements and even some positive selection particularly among Black African men (Li and Heath, 2016; Platt, 2005; Zuccotti, 2015). While there is evidence for improvements over time, such as group-level falls in unemployment (Kapadia et al., 2015) and some intergenerational upward mobility, this appears inconsistent.
This article adds to this existing evidence through an examination of the relative employment experiences of the largest ethnic groups in the UK, including how these have changed between 1971 and 2011, for particular individuals and between particular cohorts. The research uses an approach which makes it possible to assess the extent to which any shifts might be explained by individual social mobility, or changes to the composition of particular groups – whereby younger people and more-recent migrants occupy different economic positions compared with older or longer-resident people – and makes a significant contribution to existing research which focuses on population averages or intergenerational studies.
It has been argued that the inconsistency identified in existing research is explained by approaches which attempt to use ethnicity to explain what is largely a religious, specifically Islamic, effect (Heath and Martin, 2013; Johnson et al., 2010; Khattab, 2009, 2016; Khattab and Johnson, 2015; Longhi et al., 2013; Platt, 2005). Existing research also draws attention to the need to examine more effectively gender variations in economic experiences both within and between ethnicities (Clark and Drinkwater, 2007; Kapadia et al., 2015), including the ‘particularly strong religious penalty’ affecting Muslim women (Cheung, 2014: 140; Heath and Martin, 2013; Longhi and Platt, 2008; Platt, 2005; Shaw et al., 2016; Stevenson et al., 2017). We add to work examining the intersectional nature of these patterns, by examining variations in the position of people considered to have similar ethnicities but different genders and religions.
The specific research questions considered are:
To what extent do ethnic inequalities in the labour market persist over time?
If there are changes in the level of inequality, how does this vary across ethnic and religious groups?
To what extent are changes experienced similarly across different generations/cohorts?
Are the patterns for men and women similar, or do ethnic minority women, and in particular ethnic minority Muslim women, face additional inequalities compared with those in other groups?
Methods
The Office for National Statistics (ONS) Longitudinal Study (LS) currently links data from the 1971, 1981, 1991, 2001 and 2011 censuses with data on vital events for a 1 per cent sample of the population of England and Wales. The sample includes those who were observed at the 2001 and at least one other census.
Information on ethnicity collected in the 2001 census is used to allocate people to ethnic categories, supplemented by information collected in 1991 where this is unavailable. Sample categories and sizes for these analyses are:
White British: 404,903
Irish: 5375
Black Caribbean: 6987
Black African: 4719
Pakistani: 8260
Bangladeshi: 3224
Indian Muslim: 1467
Indian Hindu: 5416
Indian Sikh: 4364
Chinese: 1202.
Those with mixed ethnicities have been combined with those in the minority ethnic category, following research indicating the greater significance of minority affiliations for those with mixed identities (Phoenix and Tizard, 1993). Information on religion was first collected in 2001. Due to its voluntary nature, this question had higher levels of non-response than others, with almost 8 per cent of the population not providing information on this. However, this non-response was lower (5%) among the Indian group, on which the comparison of within-group religious effects is focused. Other groups had insufficient religious heterogeneity for religious comparison.
We use these data to explore how the socioeconomic position of people in different ethnic/religious groups has changed over time in several ways. First, logistic regression models examine how the occupational class position and economic activity of people with ethnic minority backgrounds has changed relative to white British people between 1971 and 2011. Specifically, we report on the odds of being in a manual rather than non-manual occupation and of being unemployed or sick, rather than employed, among those with ethnic minority backgrounds compared with white British people, and how this has changed over time. While these analyses are limited to those available in the England and Wales census, they provide an investigation of mobility in relation to two key dimensions of social position: occupational class and economic activity. This focus on economic activity is a particularly innovative development for research in this field which has tended to focus on variations in occupational class.
Restricting this analysis to individuals who were present at both censuses gives an indication of period effects. Adding a comparison with data from all those present at the 2011 census, which includes those who were not resident in England or Wales or were aged under 18 and unable to complete the census in 1971, gives an indication of the impact of differences in the composition of the 1971 and 2011 cohorts. Examining relative rather than absolute change is valuable as this is less affected by changes in the classification of occupations and other structural changes in the class distribution, which have led to a reduction in the number of manual jobs generally, and an artificial picture of relative upward economic mobility, particularly for those groups who are concentrated in manual occupations such as those with ethnic minority backgrounds (Platt, 2005).
Second, we examine the mobility of individuals present for at least two sequential censuses (1971–1981, 1981–1991, 1991–2001, 2001–2011), due to a lack of sample power to consider individual changes over longer periods. We used multinomial logit modelling to explore ethnic/religious differences in the likelihood of changing occupational class position (moving into or out of manual occupations) or employment status (classified as employed or unemployed, including due to sickness) over time relative to white British people. White British people and those who had not changed occupational class/employment position between the censuses form the comparison categories, with risks set at 1.00.
The starting location of any individual will influence their mobility, as those in the highest categories are unable to move further up and those in the lowest, to move down. This is a particular concern for any analysis of variations between groups who exhibit concentration in certain socioeconomic positions, as this may produce more upward mobility in group X on average simply because a larger proportion of group X is in the lowest category at the starting point (and vice versa). To examine these ‘floor’ and ‘ceiling’ effects, we separately examine upward and downward mobility focusing on upward mobility among those individuals in the lowest and downward mobility among those in the highest socioeconomic categories, in each ethnic/religious group.
The findings from these analyses are presented as odds and relative risk ratios. Both these measures provide a relative measure of effect which examines the likelihood of people in one group on average having a particular outcome/experience, for example, lower economic position or greater likelihood of mobility, relative to people in another. The statistically significant nature of each variation is established using the 95 per cent confidence interval, presented in brackets after each odds ratio, which allows for the sampling effects operating on the analysis. In a normally distributed sample, we can assume that 95 per cent of the population would have odds within the range provided by the confidence interval. A statistically significant variation is one where the upper and lower limits of the confidence interval do not incorporate 1.00 (and therefore do not include the odds of the comparison category).
Students, retired people and those who said they were ‘looking after the home’ are excluded from these analyses, which are also restricted to those aged between 16 and 74 as social class codes are unavailable for those at younger and older ages. The classification of occupation class position uses a measure based on the Registrar General’s (1913) Classification of Occupation as this is the only occupational class measure available at all five censuses. For these analyses, those in ‘professional’, ‘managerial and technical’ and ‘skilled (non-manual)’ occupations are combined to form a ‘non-manual’ category; with those in ‘skilled (manual)’, ‘partly skilled’ and ‘unskilled’ occupations forming a ‘manual’ group.
All analyses are age-adjusted, using continuous and quadratic measures of age, and are conducted for men and women separately.
Results
Table 1 examines ethnic differences in the occupational class position of men and women in 1971 and 2011. The first column shows the position of men and women aged 16–74 in 1971, the second shows the position in 2011 of those who were observed in 1971 (‘the 1971 cohort’), while the third shows the position for all of those present and aged 16–74 at the 2011 census, which includes both those in the 1971 cohort and those who have joined the LS since this time (‘the 2011 cohort’). This analysis enables us to explore whether any trends identified are driven by period changes affecting those people in both cohorts (and identified by differences between columns one and two and similarity between columns one and three) or changes in the composition of the 2011 cohort (indicated by variation between columns two and three). To allow comparisons for the ethnic minority groups relative to white British men/women, the table shows both the distribution and odds ratios relative to the white British group, adjusted for age differences between the groups.
Ethnic differences in the Registrar General’s occupational class position a (1971 and 2011).
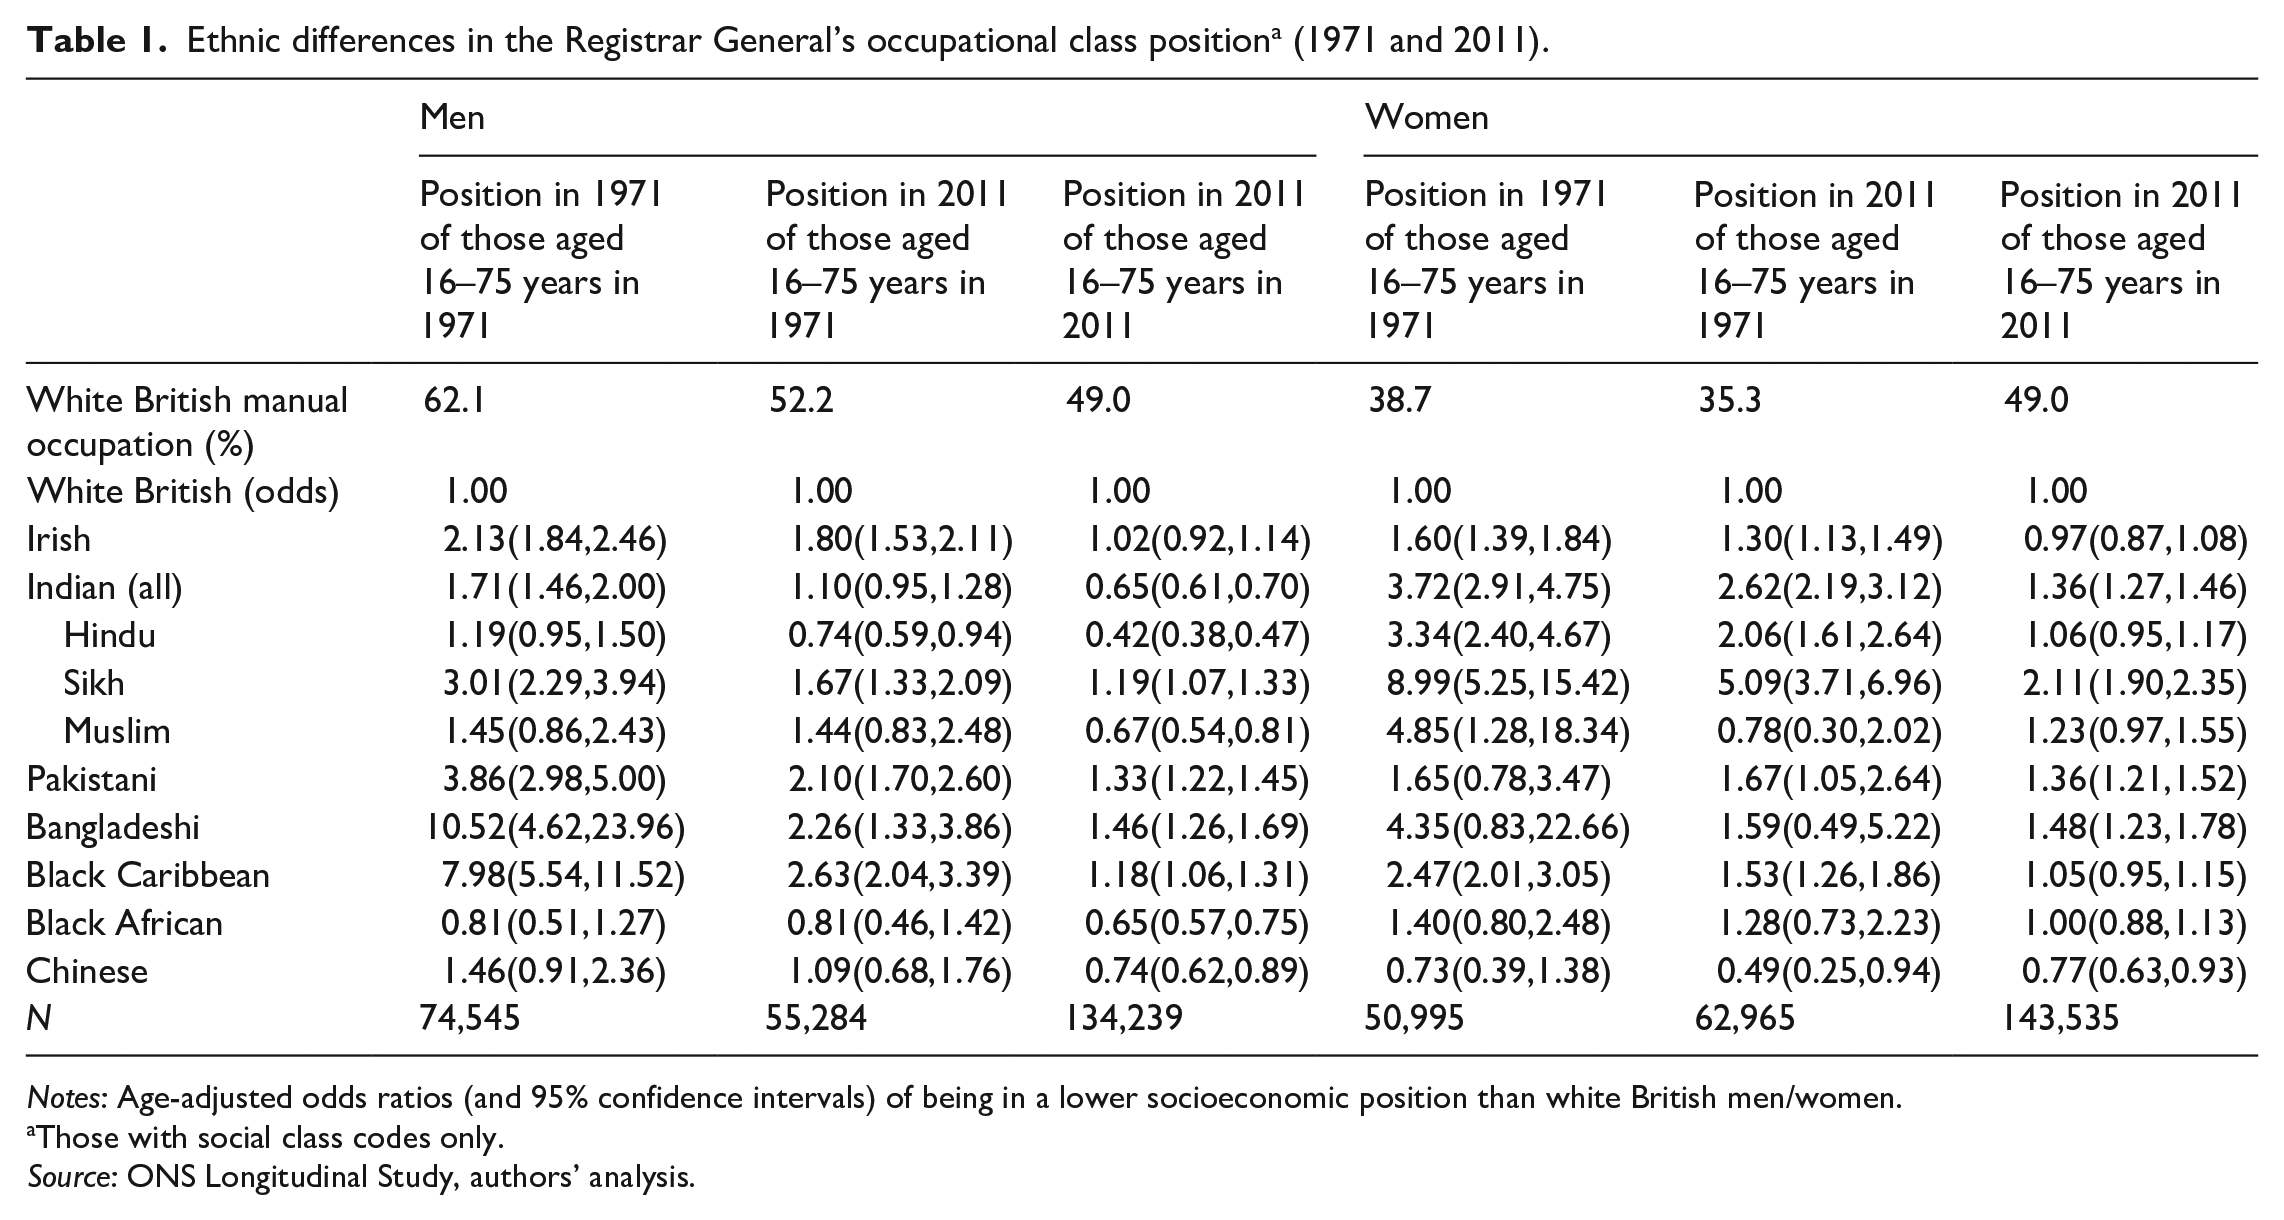
Notes: Age-adjusted odds ratios (and 95% confidence intervals) of being in a lower socioeconomic position than white British men/women.
Those with social class codes only.
Source: ONS Longitudinal Study, authors’ analysis.
Over three-fifths (62%) of white British men were in manual occupations in 1971. By 2011 this had fallen to around half for men in the 1971 cohort, with a similar figure for men in the 2011 cohort, suggesting a large period effect alongside a possible small cohort effect. In 1971, men in several ethnic minority groups were considerably more likely to be in manual occupations than white British men, though the extent of this varied by group. Irish and Indian men were around twice as likely, Pakistani men were almost four times, Black Caribbean men were eight times and Bangladeshi men were over 10 times as likely to be in manual occupations as white British men. The combined odds of Indian men disguises considerable variation by religion, however: with Indian Sikh men three times as likely but Indian Hindu and Indian Muslim men no more likely to be in manual occupations than white British men during this period. There were large reductions in the scale of these ethnic (and religious) variations for some groups in the 1971 cohort by 2011. For example, the higher odds of being in a manual occupation among Pakistani and Indian Sikh, compared with white British men were almost halved; that for Black Caribbean men fell by over two-thirds and that for Bangladeshi men by almost four-fifths. However, for most groups these variations remained statistically significant. An exception was observed for Indian Hindu men enumerated in 1971, who were significantly less likely than white British men to be in manual occupations in 2011.
While the significantly higher rates of manual occupation among Indian Sikh, Pakistani, Bangladeshi and Black Caribbean men, compared with white British men, were also apparent in the 2011 cohort, the associations for men in several other ethnic minority groups were attenuated. Indian Muslim, Black African and Chinese men exhibited a lower likelihood of being in manual occupations than white British men in the 2011 cohort, with no significant variation between Irish and white British men. These findings would suggest that ethnic variations in occupational class position have been affected by both period and cohort changes occurring over the period. So, those enumerated in both 1971 and 2011 occupy a somewhat improved position in 2011 relative to their position in 1971, and in 2011 those who (typically) migrated or became adults after 1971 occupy a positive occupational class position relative to these older/longer-resident ethnic/religious peers.
Almost two-fifths (39%) of white British women were in manual occupations in 1971 (Table 1), and this proportion was relatively unchanged among this cohort by 2011 (35%). However, almost half (49%) of white British women in the 2011 cohort were in manual occupations, reflecting shifts in the composition of the female workforce over time. In 1971, Irish women were significantly more, Black Caribbean women were over twice as likely and Indian women almost four times as likely to be in manual, rather than non-manual, occupations as white British women. Bangladeshi women were over four times as likely to be in manual, rather than non-manual, occupations as white British women but this variation was not statistically significant, probably due to small numbers in this category. Again, the combined Indian category hides important variations by religion: with Hindu women over three times, Muslim women almost five times and Sikh women nine times as likely to be in manual occupations as white British women in 1971. As with men, there was some reduction in the scale of these variations among this 1971 cohort by 2011, particularly for women in the Indian Hindu, Indian Sikh, Indian Muslim, Bangladeshi, Black Caribbean and Chinese groups, although with the exception of that for Indian Muslim women these variations all maintained statistical significance. Chinese women in both cohorts were significantly less likely to be in manual occupations than white British women in 2011. Pakistani women in the 1971 cohort were significantly more likely to be in manual occupations than white British women in 2011, despite not being so in 1971, although there was little change in the associated odds (possibly indicating a lack of sample power in the 1971 sample). Indian Sikh, Pakistani and Bangladeshi women in the 2011 cohort were significantly more likely to be in manual occupations than white British women. However, the variation between white British and Irish, Indian Hindu and Black Caribbean women apparent in the 1971 cohort (in 2011) was not identified among the 2011 cohort. These findings would suggest the influence of both period and cohort effects on these employment patterns, with improvements for some of those enumerated in 1971 over time but also disadvantages which continue to affect those joining the cohort. Disentangling these trends is made more complicated by the disadvantages affecting white British women joining the workforce since 1971.
Table 2 presents findings of a similar analysis to Table 1, examining age-adjusted ethnic, religious and gender variations in the employment status of people of working age in 1971 and 2011. Only 4 per cent of white British men were recorded as ‘currently unemployed or sick’ in 1971. This had risen to 13 per cent of this cohort by 2011 and was 11 per cent among white British men in the 2011 cohort. Pakistani men were more likely to be unemployed than white British men in 1971 but this difference is not statistically significant, perhaps due to a lack of sample power. Irish and Black Caribbean men were over twice and Black African men were almost three times as likely to be unemployed or sick (rather than employed) as white British men in 1971. These differences had been attenuated by 2011, although those for other groups had increased: Pakistani men in the 1971 cohort were three times and Bangladeshi and Indian Muslim men around four times more likely to be unemployed or sick than white British men by 2011. There were some similarities and some differences in the employment patterns of men in the 2011 and 1971 cohorts. While Pakistani and Bangladeshi men remained disadvantaged (albeit slightly less so), the relative disadvantage experienced by Black Caribbean, Black African and Irish men identified in 1971 re-emerged in the 2011 cohort, although the findings for Irish men are not statistically significant. Indian Sikh men in the 2011 cohort were also significantly more likely to be disadvantaged. Chinese men were significantly less likely to be unemployed or sick than white British men. However, the age-adjusted variation in risks of unemployment and sickness experienced in 2011 by those in the 1971 cohort are generally larger than those for the 2011 cohort (with the exception of Irish, Indian Sikh and Black Caribbean men). The findings suggest that ethnic variations in economic activity have been negatively impacted by period effects and positively impacted by cohort changes. However, Black Caribbean men are an exception to this, with the 2011 cohort having similar relative risk of unemployment as the 1971 cohort in 1971, despite the relative risk for the 1971 cohort having reduced by 2011.
Ethnic differences in employment status a (1971 and 2011).
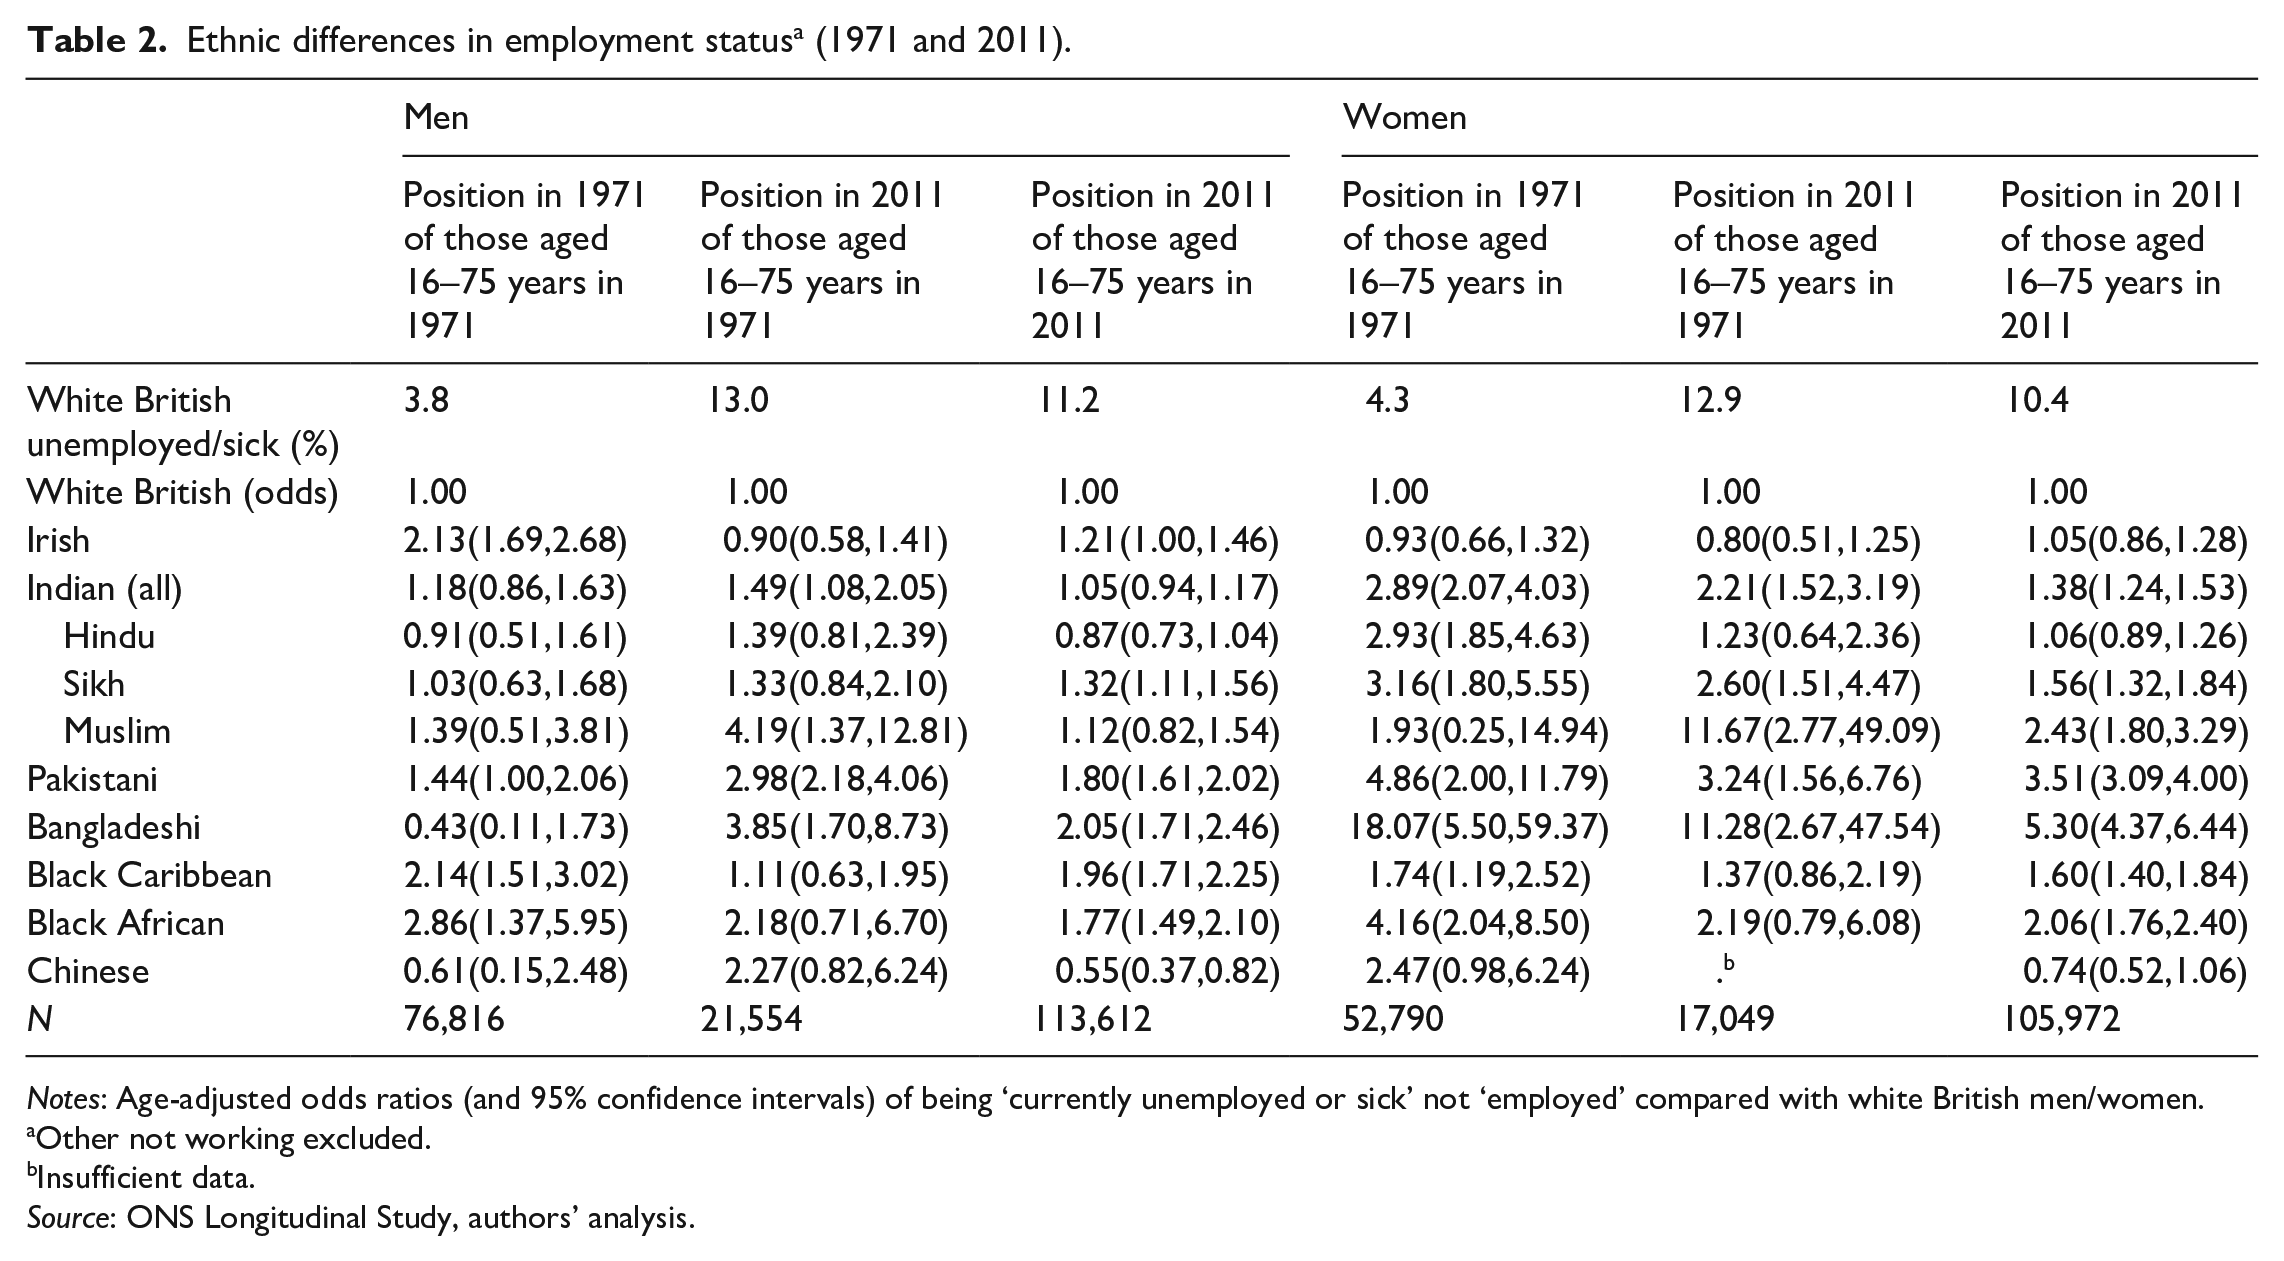
Notes: Age-adjusted odds ratios (and 95% confidence intervals) of being ‘currently unemployed or sick’ not ‘employed’ compared with white British men/women.
Other not working excluded.
Insufficient data.
Source: ONS Longitudinal Study, authors’ analysis.
In contrast to the figures for occupational class, the proportion of white British women who were classified as unemployed or sick was similar to that for white British men in each of the time periods/cohorts (Table 2). However, the pattern of disadvantage experienced by those with ethnic (and religious) minority backgrounds was more consistent for women than for men. Indian Hindu (3x), Indian Sikh (3x), Pakistani (5x), Bangladeshi (18x), Black Caribbean (2x) and Black African (4x) women were all significantly more likely to be classified as unemployed or sick (and not employed) than white British women in 1971. By 2011, there had been some reduction in this disparity for some groups, but Indian Sikh women remained over two-and-a-half times, Pakistani women over three times and Bangladeshi women over 11 times more likely to be unemployed or sick than their white British peers. Indian Muslim women in the 1971 cohort were also over 11 times more likely to be unemployed or sick than white British women in 2011, although the confidence intervals for this group, and for Bangladeshi women, are large at both time points. These differences remained significant among the 2011 cohort and the significant variation for Black Caribbean and Black African women identified in 1971 again re-emerged, as it had for men. Indian Muslim, Pakistani and Bangladeshi women in the 2011 cohort were between two-and-a-half and five-and-a-half times more likely to be unemployed or sick compared with their white British counterparts. This would suggest a disadvantage affecting women with minority ethnicities/religions which persists over time and affects those joining the LS since 1971.
Table 3 shows in more detail the changing occupational class position of those with different ethnicities (and religions) over time. Age-adjusted risk ratios are used to estimate the likelihood of moving into or out of non-manual/manual occupations between each pair of census observations for those enumerated in both censuses of the pair and separately for men and women. These analyses show the relative likelihood of moving to the destination category compared with the White British group and adjust for potential ceiling and floor effects in these models by restricting them to those who have the potential to move. As such, the first column shows the relative likelihood of ethnic minority men and women in manual occupations in 1971 moving into non-manual occupations by 1981, compared with the likelihood of moving for white British men and women (whose risk is set at one). The second column shows the likelihood of men and women with minority ethnicities in non-manual occupations in 1971 experiencing downward mobility – into manual occupations – by 1981, compared with their white British peers. The remaining columns show the same analysis for the 1981 and 1991, 1991 and 2001 and 2001 and 2011 periods. To ease interpretation, shaded cells are those containing findings which suggest a statistically significant ethnic variation in occupational mobility over the period: darker shading indicating higher and lighter shading indicating lower likelihood of mobility in the specified direction.
Ethnic differences in changes in the Registrar General’s occupational class position a between 1971 and 2011: adjusted for ceiling and floor effects.
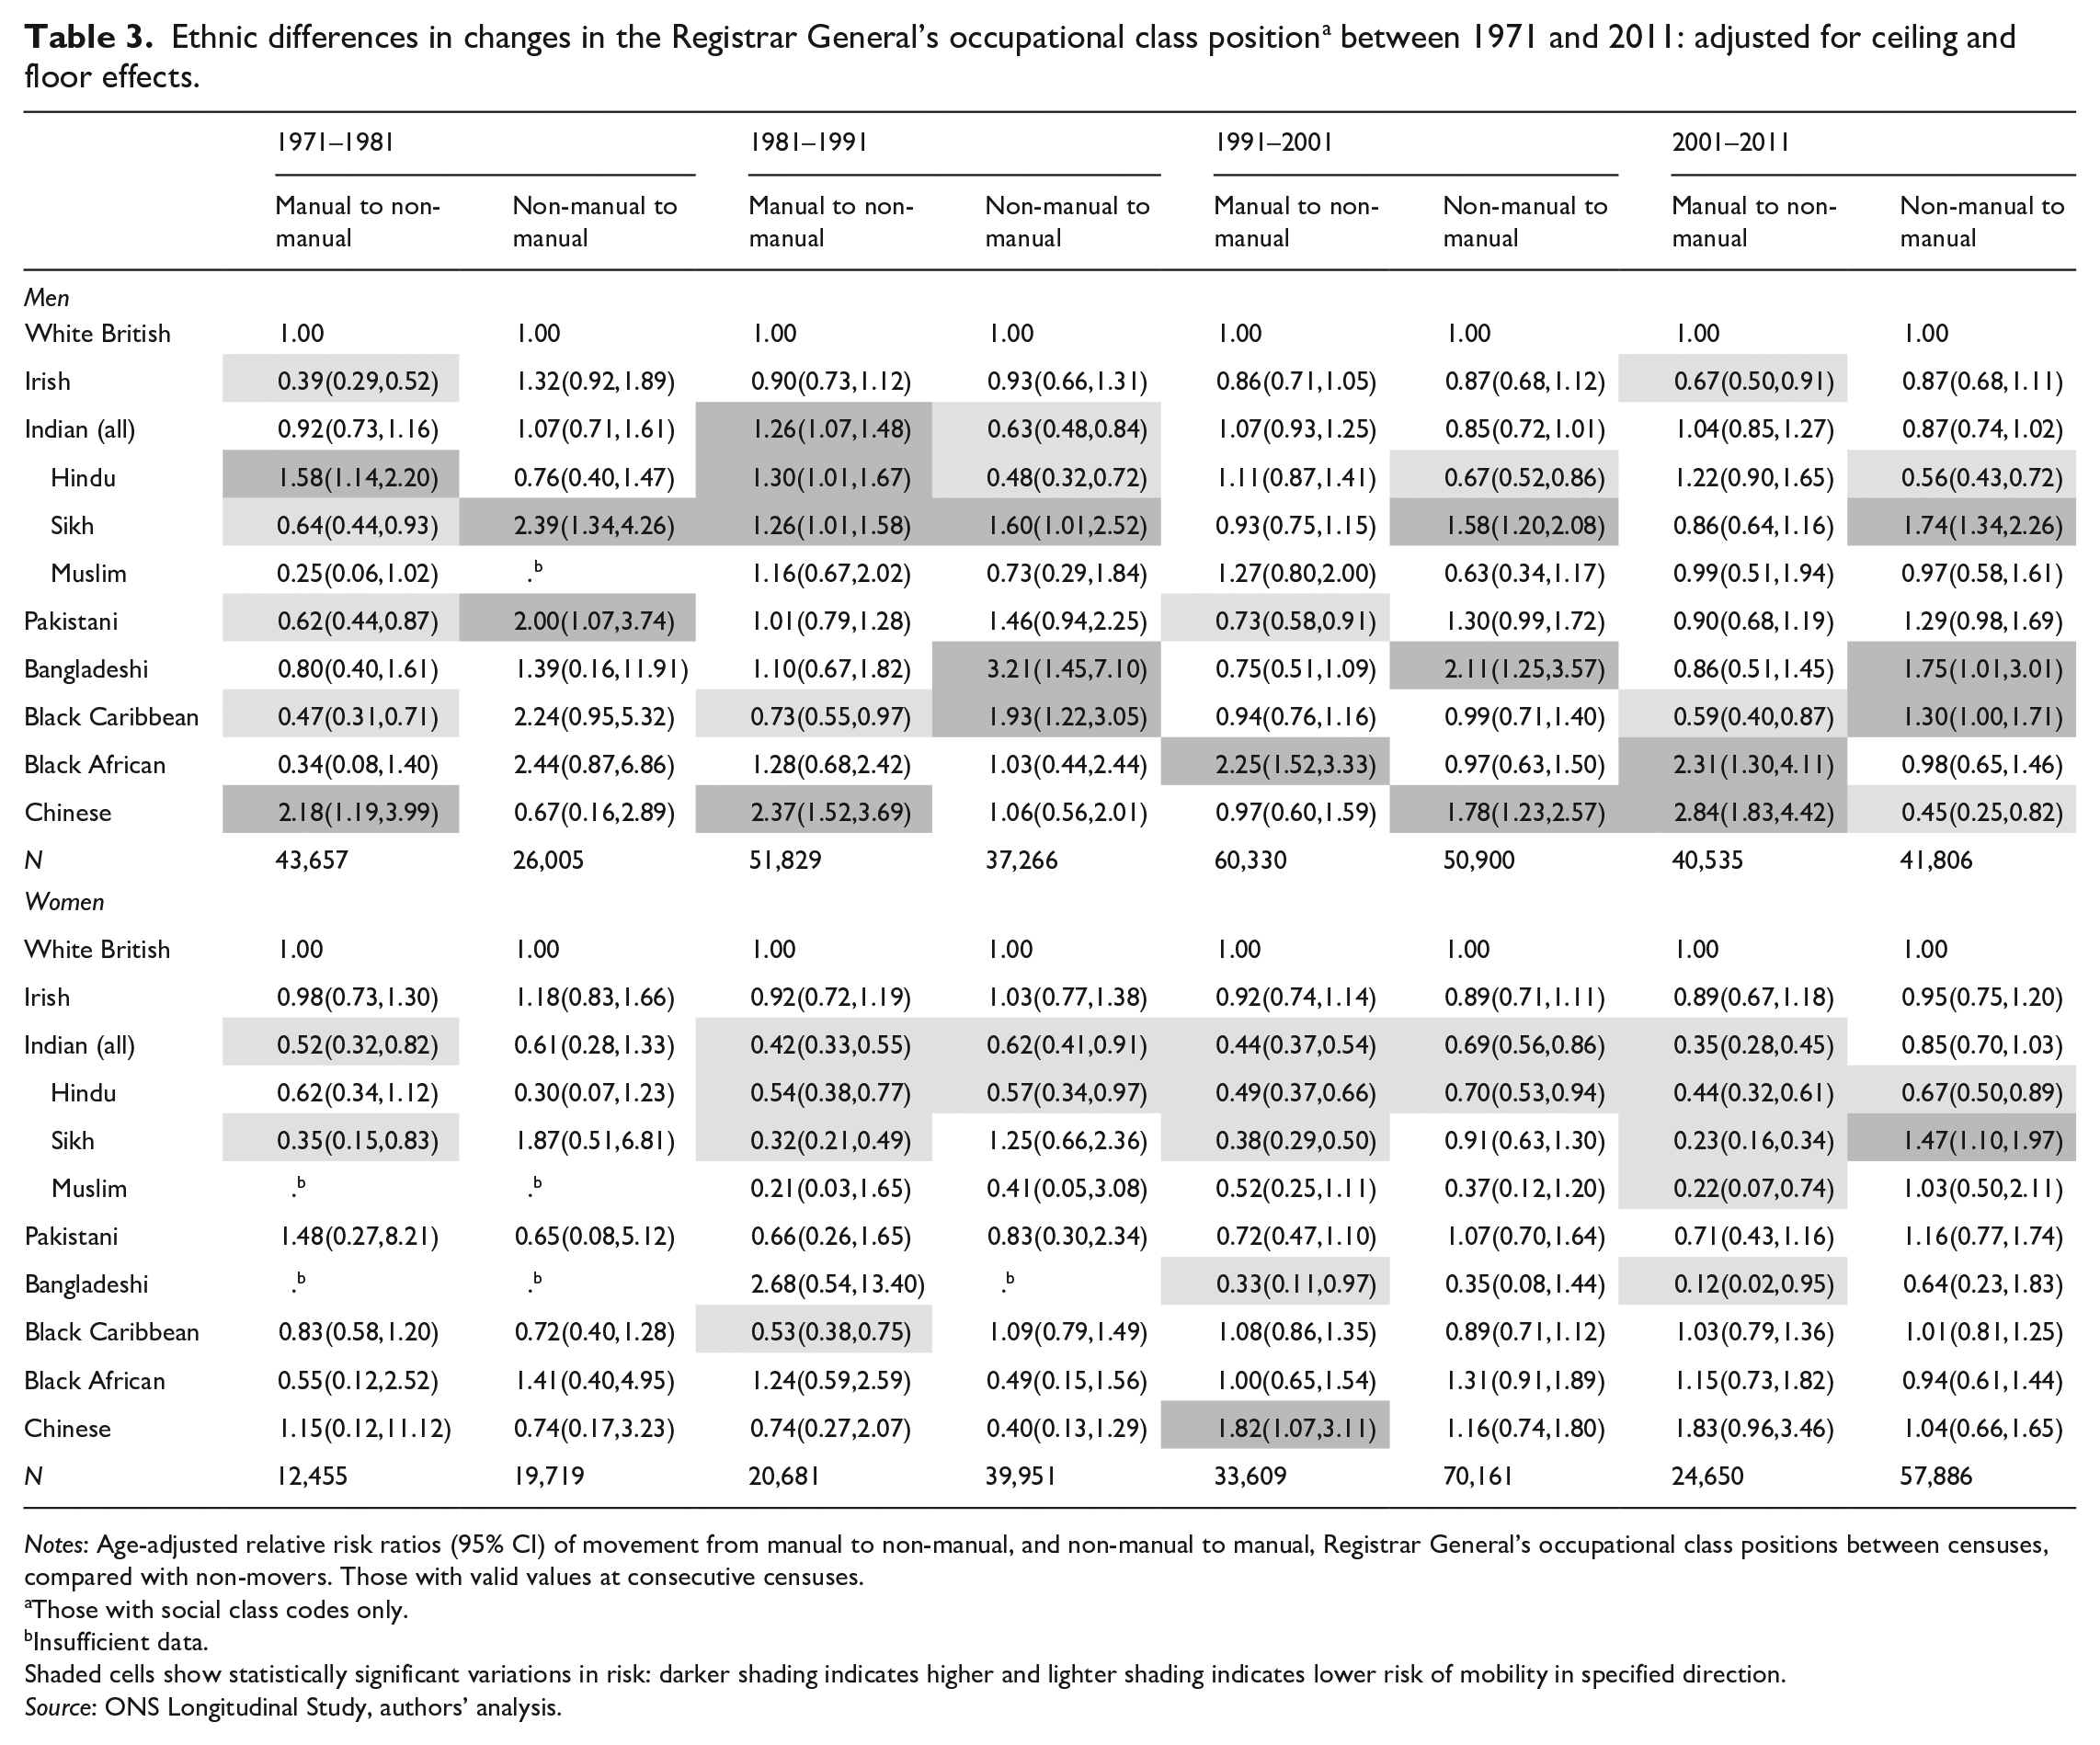
Notes: Age-adjusted relative risk ratios (95% CI) of movement from manual to non-manual, and non-manual to manual, Registrar General’s occupational class positions between censuses, compared with non-movers. Those with valid values at consecutive censuses.
Those with social class codes only.
Insufficient data.
Shaded cells show statistically significant variations in risk: darker shading indicates higher and lighter shading indicates lower risk of mobility in specified direction.
Source: ONS Longitudinal Study, authors’ analysis.
Comparing, first, changing ethnic differences in the likelihood of mobility across the period, shown in the findings for 1971–1981 and 2001–2011, would suggest broad improvements over time in the occupational class position of men with minority ethnicities/religions relative to white British men – with higher likelihood of moving into higher and lower likelihood of moving into lower occupational classes in the later period for most groups (with the exception of upward mobility for Indian Hindu men). But looking at the trends across the entire 40-year period suggests more variation in these patterns for men than this summary would suggest.
Moreover, it appears that while men in certain ethnic groups had greater likelihood of upward mobility than white British men during certain decades, the experience of men in other groups was more complex. For example, Black African men (in manual classes) were more than twice as likely as white British men (in manual classes) to experience upward mobility during the 1980s and 2000s. Chinese men (in manual classes) were also more likely than white British men (in manual classes) to experience upward mobility during the 1970s, 1980s and 2000s. But Chinese men (in non-manual occupations) were relatively more likely to experience downward occupational class mobility during the 1990s. Irish men were less likely than white British men to move into non-manual occupations during the 1970s and 2000s but had similar likelihood to white British men of moving in other directions and at other times. The experiences of social mobility of Pakistani, Bangladeshi and Black Caribbean men, in particular, are less positive. Pakistani men were more likely than white British men to experience downward mobility in the 1970s and were also less likely to experience upward mobility in both the 1970s and 1990s. The likelihood of employment mobility for Pakistani men is similar at other time points, but the estimates are not significant (due to a lack of sample power). Bangladeshi men were over three times as likely as white British men to move down to manual employment in the 1980s, and remained over twice as likely to do so in the 1990s and almost twice as likely in the 2000s. Black Caribbean men were more likely to move down into manual occupations in the 1980s and 2000s and were less likely to move up into non-manual occupations in the 1970s, 1980s and 2000s, compared with white British men.
Again, this focus on ethnicity disguises important variation by religion. During the 1980s Indian men, as a group, were more likely to move into non-manual and less likely to move into manual occupations than white British men, although this difference was smaller in other periods. However, the experience of Indian Hindu men was considerably more positive, relative to both white British men and Indian men with other religions. For example, Indian Hindu men were significantly more likely than white British men to experience upward mobility in the 1970s and 1980s and less likely to experience downward mobility from the 1980s onwards. Indian Sikh men, by contrast, were less likely than white British men to experience upward mobility during the 1970s and while they were more likely to experience upward mobility during the 1980s, they were also significantly more likely than white British men to experience downward mobility. Interestingly, there was no statistically significant variation in occupational mobility between Indian Muslim and white British men during any of the periods examined.
Turning now to the experiences of women, with the exception of the greater upward mobility among Chinese women in the 1990s and downward mobility among Indian Sikh women in the 2000s, the occupational pattern of women with ethnic (and religious) minority backgrounds speaks more to stability – and a lower relative risk of movement – than change. For example, Indian Sikh women in each period – and Indian Hindu women from the 1980s onwards – were less likely than white British women to experience upward mobility. Indian Hindu women were also less likely than white British women to experience downward mobility in every census pair. There was a lower likelihood of upward mobility relative to white British women among: Black Caribbean women in the 1980s; Bangladeshi women in the 1990s; and Indian Muslim and Bangladeshi women in the 2000s. There is therefore little indication of relative improvement over the period for women in any of the ethnic minority groups examined and women with Pakistani and Indian backgrounds (with a variety of religions) remain significantly less likely than white British women to experience upward mobility at the end of the period. However, as suggested earlier, interpreting these changes/stability is made more complicated by the fluctuating experience of the white British women to which they are being compared.
Table 4 presents the same analysis as Table 3, but focuses on the age-adjusted risks of becoming employed or unemployed/sick. Comparing the age-adjusted likelihood of changing employment status between 1971–1981 and 2001–2011 suggests considerable variation in the experiences of men in ethnic/religious minority groups relative to their white British peers across the period. On the one hand, the likelihood relative to white British men of becoming employed was higher and becoming unemployed or sick lower in the 2000s compared with the 1970s for men in several groups, including Irish, Indian Muslim, Bangladeshi and Black African men, although some of these differences are small. While the likelihood of Bangladeshi, Pakistani and Black African men becoming employed was only significantly greater than that of white British men between 2001 and 2011, men in almost all the groups examined (with the exception of Indian Hindu, Indian Muslim and Chinese men) were more likely to become unemployed or sick during both periods. Again, there is some heterogeneity in the periodicity of these trends. Indian Sikh men experienced higher likelihood of becoming employed during the first and last periods of the study (1971–1981 and 2001–2011) but not in the middle, while Bangladeshi men showed a higher likelihood of employment from the 1990s onwards, although this is offset by a simultaneous and fairly persistent higher risk of moving into unemployment or sickness. There is some evidence of a gradual improvement among Indian Muslim men across the period.
Ethnic differences in changes in employment status a between 1971 and 2011: adjusted for ceiling and floor effects.
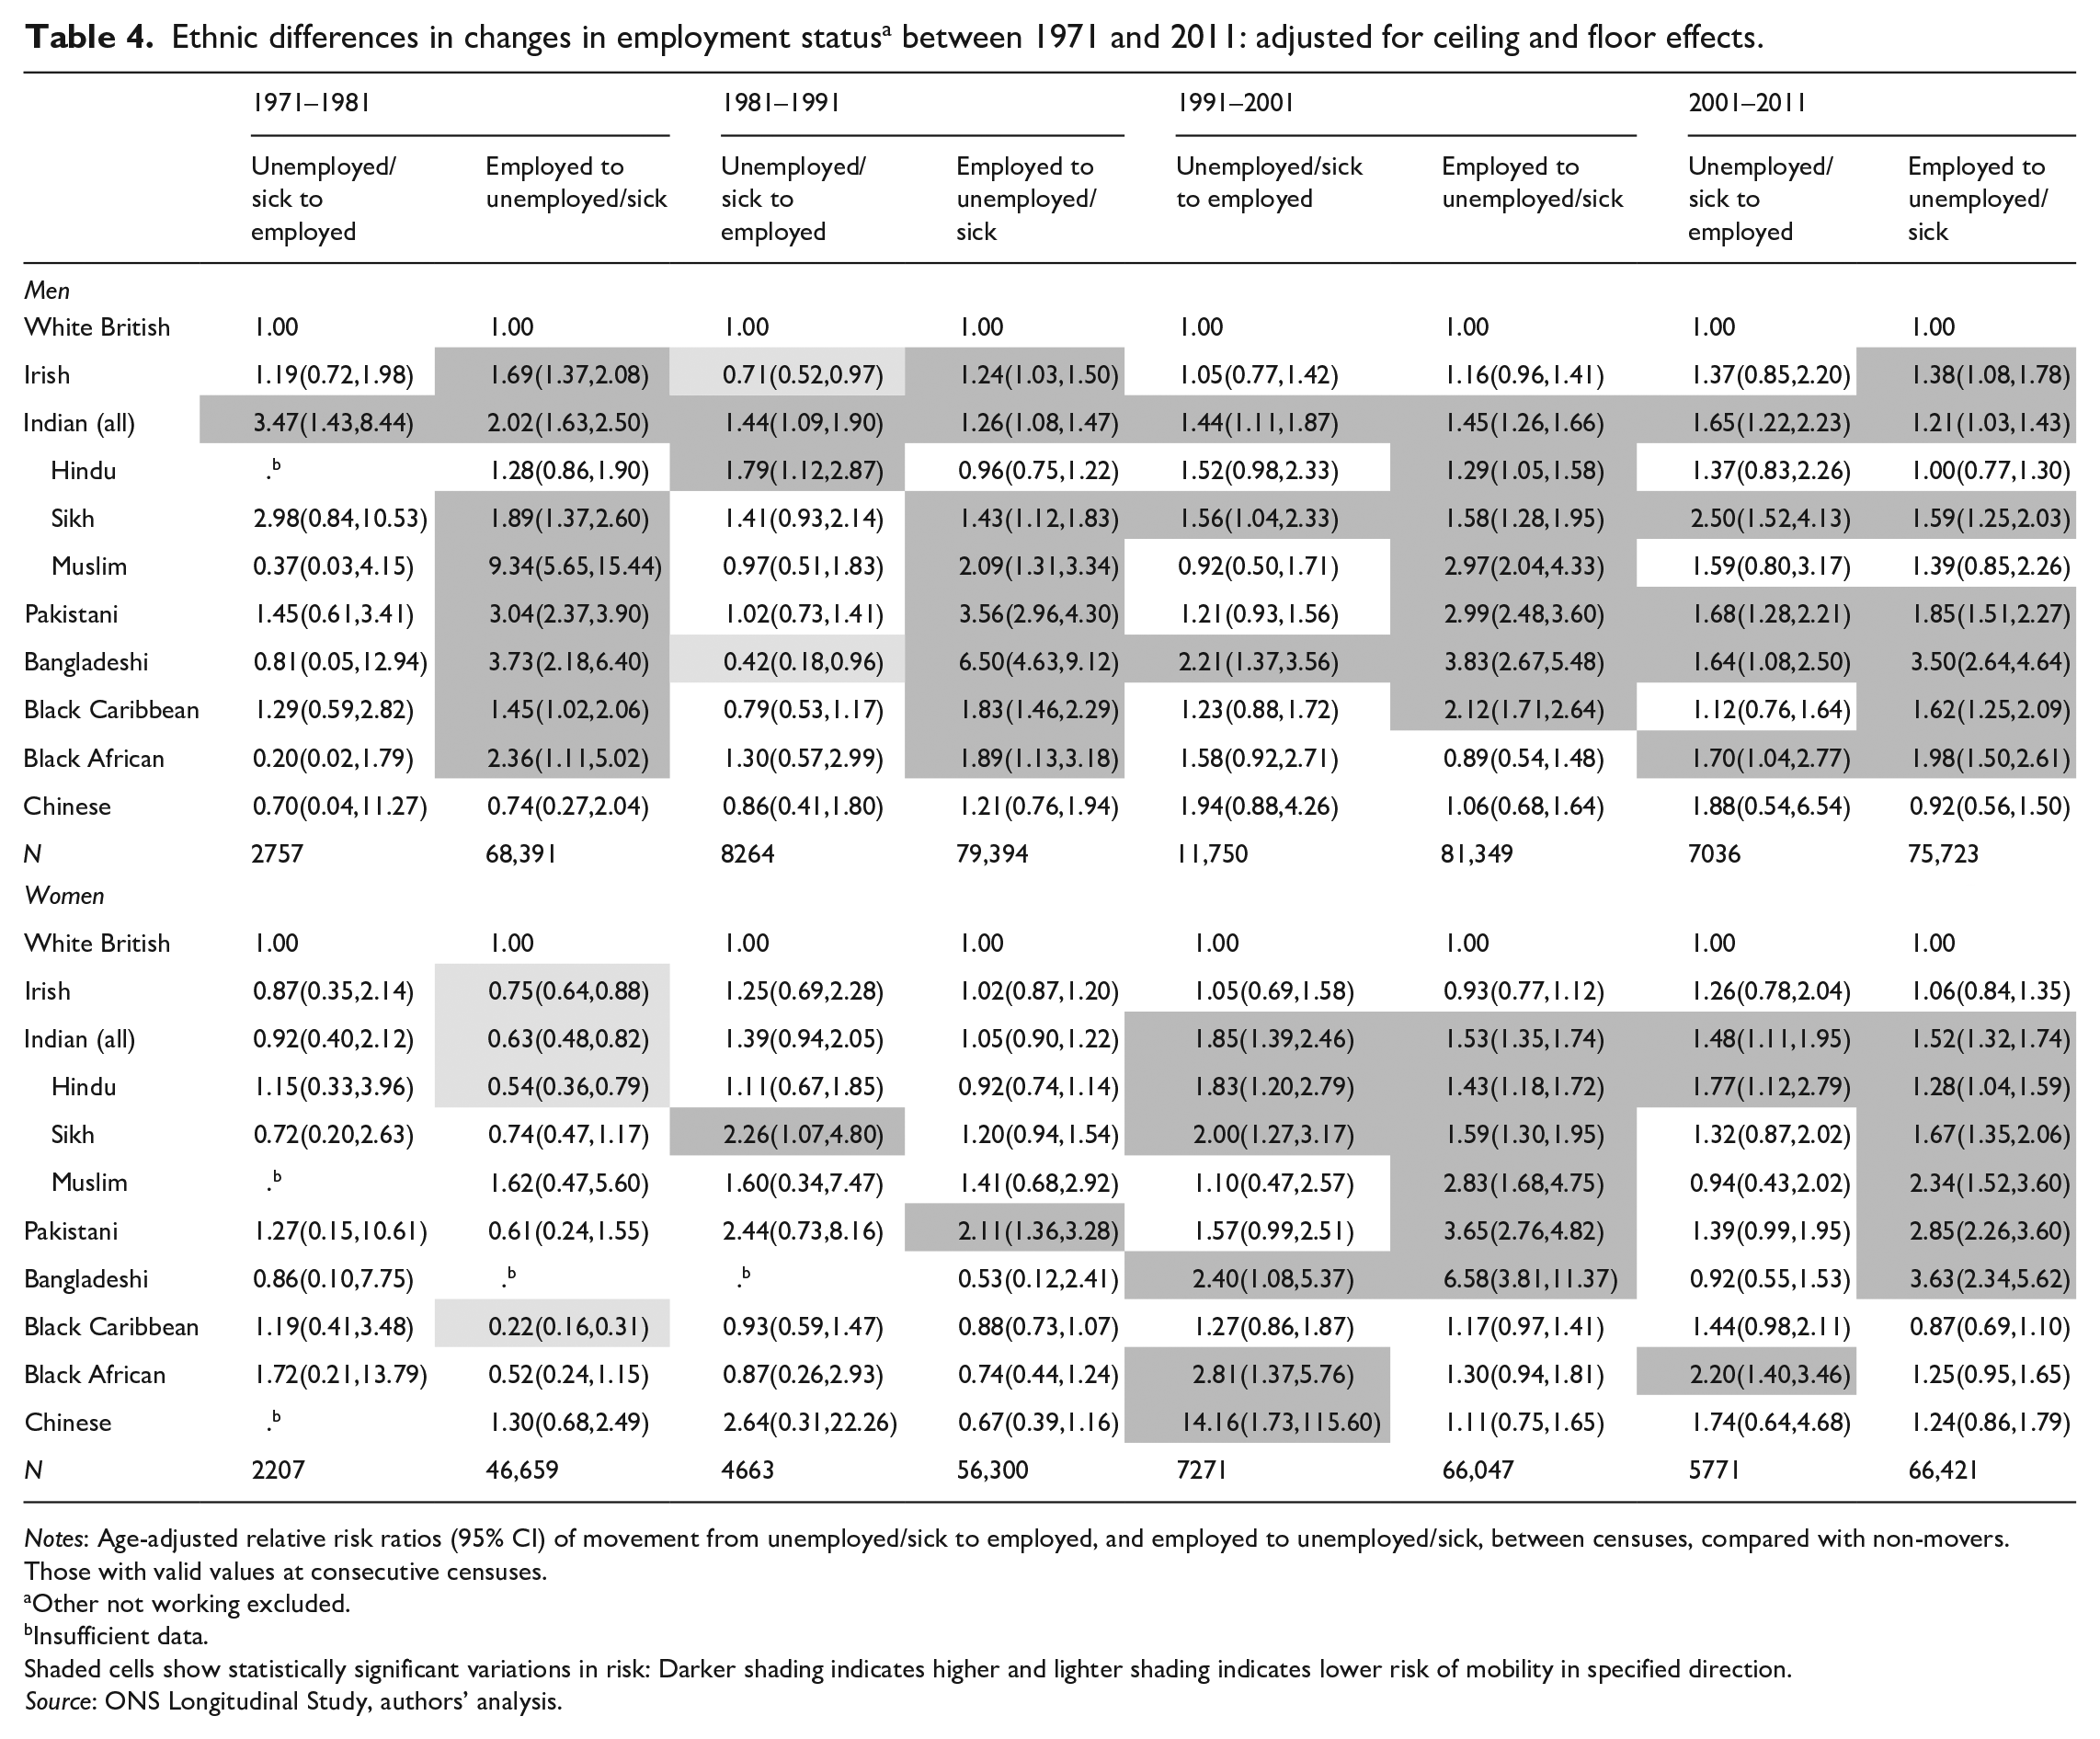
Notes: Age-adjusted relative risk ratios (95% CI) of movement from unemployed/sick to employed, and employed to unemployed/sick, between censuses, compared with non-movers. Those with valid values at consecutive censuses.
Other not working excluded.
Insufficient data.
Shaded cells show statistically significant variations in risk: Darker shading indicates higher and lighter shading indicates lower risk of mobility in specified direction.
Source: ONS Longitudinal Study, authors’ analysis.
In general, the likelihood of becoming employed was higher for women in ethnic/religious minority groups in 2001–2011 compared with 1971–1981. For Indian Hindu, Pakistani, Black Caribbean and Black African women, the likelihood of becoming employed was higher than that for white British women between 2001 and 2011, but not 1971–1981. However, their likelihood of becoming unemployed or sick relative to white British women was also higher in 2001–2011 compared with their position in 1971–1981. Indeed, Irish, Indian Hindu and Black Caribbean women were less likely than white British women to become unemployed or sick between 1971 and 1981. These findings therefore suggest greater instability in the employment situation of women with minority ethnicities over time, rather than improvement. During the 1990s and 2000s, there was an increase in movement into, but particularly out of, employment relative to white British women for many groups. Indian Hindu, Indian Sikh, Indian Muslim, Pakistani and Bangladeshi women were all more likely than white British women to become unemployed or sick between 2001 and 2011: Indian Muslim women were twice as likely, Pakistani women two-and-a-half times and Bangladeshi women three-and-a-half times as likely to become unemployed or sick than white British women.
Discussion
These analyses first compare the occupational class position and economic activity of people with different ethnicities and religions observed in both 1971 and 2011 to explore evidence for social mobility over time among this cohort. We also compare the position in 2011 of this 1971 cohort with that of the entire 2011 cohort (which includes those joining the working age population since 1971) to examine the extent to which any apparent social mobility might be related to changes in the nature of this cohort. Finally, using data linked across consecutive decennial censuses, we examine evidence of social mobility between censuses among specific individuals. Drawing broad conclusions which reflect these multiple and complex analyses is problematic, but we suggest that this evidence indicates that, in general, ethnic inequalities in economic disadvantage identified in the 1970s have persisted over the subsequent four decades and particularly disadvantage men and women in Bangladeshi, Black Caribbean and Pakistani groups.
The cohort comparison provides some indication of better outcomes for newer migrants and those who became adults after 1971, for certain groups. Findings relating to the occupational position of Irish and Black Caribbean women, and the employment status of Chinese men, suggest an improved economic position among the 2011 cohort. By contrast, however, changes to the employment status of Black African and Black Caribbean men and women in the 2011 cohort suggest a poorer economic position among newer migrants/more recent cohorts compared with longer resident/more distant cohorts. While the scale of the ethnic inequalities in occupational class position was smaller in 2011 than 1971, for women and men in most groups, Bangladeshi and Black Caribbean men and Pakistani men and women remained more likely than white British men to be in manual occupations in 2011, regardless of cohort. The findings relating to employment status also suggest persistent relative disadvantage experienced by Bangladeshi women and Pakistani men and women and an increasing disadvantage among Bangladeshi men over time, which appears to particularly affect those present in the 1971 cohort.
Our analyses of between-census changes in occupational class position provide little to suggest that the relative occupational position of men in these minority groups has improved over the 40 years of the study. In general, men in ethnic minority groups were significantly more likely to experience downward and/or less likely to experience upward occupational mobility than white British men. There was some indication, though, that men in some ethnic/religious minority groups were more likely to move into employment than white British men, and that this was improving over time, including those in groups traditionally considered more disadvantaged, such as Indian Muslim. But there is evidence for considerable within-group heterogeneity in the patterns, with men in certain ethnic minority groups (such as Indian Sikh men) more likely to move both into and out of employment and higher occupational classes during certain periods. The occupational profile and employment status of women over the period speaks to relative stability (be that in economic advantage or disadvantage) rather than change, although there is evidence of a shift in the employment patterns of women in ethnic/religious minority groups in the 1990s and 2000s, with more frequent moves both into and out of employment relative to white British women. Further research must determine how these trends develop in the future.
Determining more explicitly what drives these variations in economic disadvantage is beyond the scope of these analyses. However, we argue that the patterns identified here would suggest certain explanations to be more convincing than others. For example, the presence of an ‘immigration penalty’(Li and Heath, 2016; Platt, 2005), which operates to initially depress the occupational achievements of migrants relative to their skills and qualifications, could be identified in the upward mobility of individuals and groups over time as individuals develop country-specific social capital, and potentially experience other cultural shifts, with longer length of residence. Such social capital, or cultural shifts, could also explain an improved economic position among those born and/or educated in the UK, relative to others. The persistent disadvantage affecting, particularly, the 2011 cohort identified here – most of whom (at least in the Black Caribbean group), will have been born in the UK – offer little confidence in this as an explanation. Rather, these findings would appear more in keeping with work exposing the ‘ethnic penalty’ which continues to affect the access of minority groups to employment (Ashe and Nazroo, 2016; Battu and Sloane, 2002; Castilla, 2008; FRA, 2017; Heath and Cheung, 2006; Khattab and Johnson, 2015; Maume, 1999; Rafferty, 2012), education (Boliver, 2016; Zimdars et al., 2009) and elsewhere (Borjas, 2006; Heath and Smith, 2003; Longhi and Platt, 2008; Platt, 2005), and the ways in which persistent racism limits access to positive socioeconomic outcomes including social mobility (Virdee, 2006).
The broad ethnic groupings used in the cohort analysis concealed important variations between people with similar ethnic but different religious backgrounds. Indian Sikh men were significantly more and Indian Hindu and Indian Muslim men significantly less likely to be in manual occupations than white British men in certain cohort/periods. Indian Sikh and Indian Muslim men were both more likely than white British men to be unemployed/sick, an issue which affected Muslim men in both the 1971 and 2011 cohorts. By contrast, our findings indicate reduced ethnic inequalities in occupational position relative to white British women over time for women in the different Indian groups examined, but this particularly benefited Indian Sikh and Indian Hindu women in the 2011 cohort (although a significant variation between Indian Sikh and white British women remains). While a similarly positive picture emerges for Indian Hindu and, especially, Indian Sikh women with regard to their access to employment, the disadvantage experienced by Indian Muslim women has increased over time. The picture of disadvantage experienced by, particularly, Indian Muslim men and women is therefore somewhat inconsistent. However, the commonality of experience among Muslims with Bangladeshi, Indian and Pakistani ethnicities adds weight to an expanding body of evidence highlighting the impact of the victimisation experienced by Muslims in general (FRA, 2017; Karlsen and Nazroo, 2014), and Muslim women in particular (Hutchinson et al., 2011; Khattab, 2012; Maume, 1999; Niven et al., 2013; Stevenson et al., 2017). Further research should consider in more detail whether and how ethnicity, religion and gender intersect to explain the particular patterns identified.
These analyses combine heterogeneous individuals, who will relate to their ethnicities, religions, genders, economic activity and other aspects of their lives in different ways. And, despite this, some of these analyses remain affected by low sample power. These analyses cannot account for changes in ethnic or religious affiliation over the period, a potentially problematic issue (Simpson et al., 2016). We also rely on data collected at 10-year intervals, which is likely to underestimate the number of changes occurring and possibly ethnic/religious differences in instability in these trends. It is possible that these occupational class groupings are too broad to identify some meaningful social mobility, although the differences between narrower categories are also argued to be too slight to recognise meaningful effects on individuals’ socioeconomic position, health or lifestyles (Bartley and Plewis, 1997). It is also likely that, for some groups, moves into employment are as a consequence of increasing self-employment, which may indicate positive economic choices or responses to exclusion, but may also make them more vulnerable to the effects of economic downturns (Modood and Khattab, 2015). Unfortunately, without more fine-grained data, it is impossible to examine the impact of economic downturns on these trends.
This research identifies a persistent disadvantage affecting men and women with a range of ethnicities/religions over time. While there is considerable heterogeneity in these trends, including within particular groups, there is sufficient consistency to suggest that this is a problem produced and perpetuated at the societal level. Discrimination may deflate aspirations (Wrench and Solomos, 1993), or may force people to take less desirable jobs (Abrahamsen and Drange, 2015; Bhavanani, 2006 in Hutchinson et al., 2011), become self-employed (Clark and Drinkwater, 1998), or spend longer periods in unemployment. Institutional and other forms of racism influence other areas of life, such as access to good housing or health care (Paradies, 2006; Priest et al., 2013), which then directly impact on an individual’s ability to function effectively in the labour market. Addressing these inequalities will not be resolved by a focus on particular individuals or cultures and their perceived limitations, rather the focus should be racism, discrimination and their consequences.
Footnotes
Acknowledgements
Census output is Crown copyright and is reproduced with the permission of the Controller of HMSO and the Queen’s Printer for Scotland (output number 30103). The permission of the Office for National Statistics to use the Longitudinal Study is gratefully acknowledged, as is the help provided by staff of the Centre for Longitudinal Study Information & User Support (CeLSIUS). The authors alone are responsible for the interpretation of the data.
Funding
The authors disclosed receipt of the following financial support for the research, authorship and/or publication of this article: this work was supported by the Economic and Social Research Council (Award Ref: RES-163-25-0009). CeLSIUS is supported by the ESRC Census of Population Programme (Award Ref: RES-348-25-0004).