
Abstract
The relationship of elite schools to economic capital is central to understanding the maintenance of their cultural power and institutional longevity. Since Glennerster and Wilson’s analysis in 1970, there has been little analysis of how private schools in England manage their wealth or how they are differentiated hierarchically by the composition and scale of the capital they hold. Research has explored the financing of elite universities, with less attention on schools. Using detailed Charities Commission financial data, I examine the finances of 216 English private schools in the Head Masters’ Conference association. The analysis entails a Principal Components Analysis followed by a Hierarchical Clustering on the Principal Components to reveal the economic hierarchy amongst elite schools in England. I then draw on the schools’ published accounts to examine this hierarchy further. These analyses show how the economic field of elite schools is dominated by just five schools with almost unassailable levels of wealth in property, investments and fees. Beneath them sit a wealthy group with smaller capital holdings and more diverse incomes including lucrative satellite campuses in Asia. These wealthier schools are largely boarding schools located in southern England. The provincial day schools of northern England and less prestigious boarding schools have much lower incomes and almost total reliance on tuition fees. Proximity to and control over capital allow schools to maintain their dominance, underlining how the material basis for elite cultural and class power in and over education is ultimately economic.
Introduction
Wealth and economic capital are central to the formation of elites but within the sociology of elite education this perspective has been neglected. An understanding of the multiple and complex ways that cultures and practices of elite and middle-class identities are formed and the institutional context for this has been the core focus of this literature (Ball, 2015, p. 237). Research has consistently shown the link between private schooling and elite status. Reeves et al. (2017) and Green et al. (2017, p. 27) have shown how those attending fee-paying schools disproportionately come from the top 5% of the income distribution. In this article, I provide a theoretical understanding and an empirical analysis of the economic hierarchy between elite (fee-paying) schools in England. I examine how proximity to and control over economic capital at an institutional scale are associated with cultural and symbolic prestige, histories of capital accumulation and varying degrees of economic stability.
Understanding these neglected ‘material aspects’ of elite education research (Ball, 2015, p. 237) has a deeper empirical and political point: the educational institutions of the ruling and middle class are, to varying degrees, determined by their proximity to economic capital. This sometimes involves brutal processes of exploitation and inequality. Schools like Eton and Rugby educated many Caribbean slaveowners’ sons (Williams, 1944, p. 92); Bristol Grammar (Guasco, 2014, p. 92), Colston School (Steeds and Ball, 2020) and Dollar Academy (Legacies of British Slavery, 2022) were all founded with endowments from slaveowners and Trinity College Cambridge invested in the firm that put combustible cladding on Grenfell Tower (Adams & Greenwood, 2018). These examples link certain elite educational institutions very directly to violent forms of capital accumulation.
This article situates an analysis of elite education within a broader intellectual and political project of unveiling how class power is maintained and reproduced within education. This means understanding how the economic capital that is central to the functioning of elite fee-paying schools is maintained, managed, created and accumulated. Education is the key site of capital conversion for individuals (Bourdieu, 1986). Examining the mechanics of school finances and the relationship between elite schooling and (economic) capital allows us to peer behind the cultural ‘mystique of ivy covered walls’ (Joyce, 2013, p. 300) and observe the institutional relationship to capital that facilitates the social reproduction of the ruling and middle class through education. This article works on the hypothesis that individual processes of capital conversion are enabled and mirrored by institutional processes which convert wealth into material forms of cultural capital in the shape of lavish sporting, cultural and educational spaces (Gamsu, 2016).
This article maps the material economic basis for the educational formation of elites by analysing the economic hierarchies within the English field of elite schools. These schools benefit from many forms of cultural, legislative support, principally through influencing the state (Boden et al., 2020; James et al., in press; Lowe, 2020); privately-educated ruling elites have historically protected these schools’ financial interests. Whilst these processes have created the conditions for the financially advantageous position of these ‘charitable’ schools, they do not allow us to understand the different income streams of different schools. Nor do they allow us to distinguish the hierarchy in wealth and capital that exists between these schools. This article concentrates on the latter, providing an initial mapping of these schools’ wealth. Whilst wealth management of elite universities has a significant literature (Acharya & Dimson, 2007; Eaton et al., 2016), with few exceptions, this is not true for the financing of elite schools. This article seeks to fill this lacuna.
An ‘under-acknowledged’ aspect of the sociology of elite education (Kenway & Koh, 2015, p. 4) is how elite schooling is embedded in the economic functioning of global capitalism. Recentring on the relationships between capital, capitalism and power in education refocuses class analysis in education. How are power relations in elite education bound to capitalism? What knowledge can be gained by studying how these relations work? And how can we make this useful beyond the realms of academic study? This article is situated within a broader project to frame and do the sociology of elites within a politics that seeks to contest, and ultimately abolish, elite power in education (Gamsu, 2019, 2020b, 2021a).
There is a broader point here for the sociology of class, more specifically the sociology of elites, and schooling. Stripping back the cultural veneer, symbolic mystique and power of these institutions back to their economic basis is an act of demystification. It allows us to see how institutions that dominate the field of schooling are maintained through and in relation to economic capital; we can reveal the economic underpinnings which reproduce the dominance of elite schools and examine the economic hierarchy between them. Stripping back the power of these schools to its economic dimension is one way to highlight the sometimes elusive origins and causes of these schools’ dominance (Denord et al., 2020, p. 6).
This analysis of the economic field of institutions shows how a tiny minority of institutions hold wealth on a vast scale. These are the institutions that are closest to capital; capital accumulation is central to their history, present and future. They are also amongst the most prestigious and famous schools. It is no coincidence that those schools that are closest to capital dominate not only the field of elite schooling but educate those who have historically ruled Britain and its former empire. Beneath them sits a slightly larger wealthy subgroup and then a larger set of comparatively poorer institutions. Access to diverse income streams and/or accumulated investment wealth overlaps with traditional geographical, gendered and educational divides to reinforce hierarchy within the field of elite English private schools.
This article proceeds in four stages. Firstly, it provides a theoretical framework for understanding the relationship between economic capital and elite schools. I then review the literature on the financing of education, noting the more extensive research on relationships between capital, finance and elite universities as opposed to schools. The main analysis of the article follows with a Principal Components Analysis (PCA) and cluster analysis of elite schools’ economic resources allowing us to map four hierarchical positions within the field of elite schools in England. This uses a unique financial dataset covering 216 private schools in the prestigious Headmasters’ Conference (HMC) group of private schools. 1 Lastly, I examine schools’ individual accounts in four field positions. The definition of elite schools operationalized here focuses on their fee-paying status and their historic role in educating the middle and upper/ruling class or elite (Baron, 1955; Gamsu, 2020a; Rubinstein, 1986).
Mastering capital and time: Theorizing institutional wealth and schooling
To understand the functioning of (economic) capital at an institutional scale in education, a Bourdieusian lens is an important point of departure but not, on its own, sufficient. Bourdieu (1986) succinctly outlines the processes of accumulation and conversion of economic into cultural and social capital in education. Elsewhere he also outlines the strategies and hierarchies within the institutional field of elite French higher education (HE) that allow institutions to accumulate and sustain capital (Bourdieu, 1996). Theorizing the role of economic capital in allowing elite schools to dominate requires a broader range of references.
Longevity and history are in themselves important markers of prestige for elite schools (Gaztambide-Fernández, 2009; Kenway et al., 2017), but age reflects a deeper and more important element of how power is constructed in and through elite schools. Elite schools aim to create/maintain advantage for their students’ futures, but they also aim to continue and maintain the school’s institutional position. Time itself is deeply implicated in the creation of class power: There is no barrier more insurmountable than time . . . and all social bodies use it to maintain an order of succession, . . . in other words, to maintain the distances that must be kept, . . . because they are constitutive of the social order . . . so many social ranks that are very often distinguished by nothing but time. (Bourdieu, 1996, p. 333; original emphasis)
Bourdieu refers here to inheritance and reproduction of status as maintained through the passing of time. This allows an opening to consider how elite educational institutions relate to time. The temporal range of an elite educational institution, the period over which it seeks to maintain and enhance its position, extends far beyond the working lives of students or teachers. Formal autonomy from the state means the primary risk to these schools is financial instability. Money permits greater time and control for decision-making when faced with uncertainty; it allows institutions to manage risk (Konings, 2018, p. 140; Shackle, 1988, p. 227). Wealth management and profitability are essential to their control over time.
We can thus begin to theorize the position and relation of elite schooling to wealth. Derrida reminds us of Marx’s emphasis of the spectral and morbid qualities of capital: Marx then describes, whether it is a question of money or of ideologems, it is a production of ghosts, illusions, simulacra, appearances, or apparitions . . . . Later he will compare this spectral virtue of money with that which, in the desire to hoard, speculates on the use of money after death. (Derrida, 2006, p. 56)
This spectral quality of capital, the morbid speculation on, and accumulation of, wealth on such a scale that it lasts far beyond an individual’s life, underlines the temporal divisions highlighted by Bourdieu above. Money and value are bound to time. The speculative relationship to wealth and value that is central to capitalism means that capital is constantly organized around the commitment to creating further wealth, it is intrinsically bound to ‘an ever-receding horizon’ (Konings, 2018, p. 23). Elite educational institutions are engaged precisely in the construction of the same form of control and power over time which relies on the successful management of capital. These institutions also bind themselves to a continuous forward movement. Their fundraising efforts emphasize precisely the ‘ever-receding horizon’ of their continuing success and dominance; the magical qualities of age, history, luxurious architecture and cultural facilities. Crucially, the control over past, present and future is bound up in their relation to capital.
These schools are historically bound to the past and present creation of wealth, both in their foundation (original endowments) and institutional activity (tuition fees, fundraising, wealth management). Having provided a theoretical analysis linking institutional dominance to the functioning of capital and time, we now turn to the empirical literature on wealth management amongst elite educational institutions.
The financing and economics of elite education – ‘unto every one that hath shall be given, and he shall have abundance’
The wealthiest, most prestigious educational institutions find it easier to accumulate further wealth. This is explained in the literature on wealth management and philanthropy in American HE. Ostrower (1995, p. 90) found that those from the most selective educational institutions are also the most likely to attract larger donations from wealthy donors. Similarly, Piketty (2014, pp. 447–452) shows how investment returns are highest for institutions with the largest endowments. Underpinning this is the simple fact of economies of scale, the wealthiest institutions can afford the best portfolio managers who gain higher returns. The Matthew effect amongst academic institutions (Merton, 1968, p. 62) is underpinned by its economic equivalent. Materially and structurally, the accumulation of cultural and symbolic capital necessary to dominate the field of educational institutions is tied to economic capital. This often symbolically, and sometimes physically (as noted above with slavery and Grenfell), violent reality binds cultural prestige to processes of exploitation that are integral to forms of capital accumulation within capitalism.
The broader literature exploring the mechanisms behind institutional financial management has largely focused on universities. Economic geographers have examined increasing philanthropy in universities (Warren et al., 2014) and charted the changing holdings of Oxbridge colleges in agricultural/urban land, securities and investments (Spencer, 2000). There is also a more ‘practitioner’-oriented literature exploring the mechanical and strategic approaches to investments and endowments (Acharya & Dimson, 2007; Cejnek et al., 2014). A more critical literature looks at university finances through the lens of financialization and marketization (Eaton et al., 2016; Samuels, 2011). Stein (2020) explores how the foundation of educational institutions is connected to histories of capital accumulation, colonial conquest and land dispossession. Analysis of the financing and relationship of universities to the broader political economy is both more extensive and more critical than research on elite school finances.
The literature on the financing of UK private schools is scant and largely focuses on empirical analyses without theoretical framing. The most notable work is Glennerster and Wilson’s (1970) book which resulted from financial surveys undertaken for the 1968 Donnison/Newsom Public Schools Commissions. Glennerster and Wilson (1970, pp. 49–53) show how UK private schools rely on fee income, with only 17 schools receiving a substantial income share from endowments. This article updates their analysis of income variation, observing hierarchies and clusters amongst elite schools. The data used here are publicly available, allowing us to identify institutions.
More recent work has been less detailed than Glennerster and Wilson (1970) and has lacked any theorization of capital. Graddy and Stevens (2005) looked at the effects of private school resources on attainment and found that fees were positively correlated with A-level results and negatively correlated with pupil–teacher ratios. However, like Bee and Dolton (1985), they found that once students’ prior attainment is controlled for, capital spending has little effect on their attainment. The most recent article finds a positive association between higher fees and attainment at 18 (Davies & Davies, 2014). Focusing on attainment when these schools’ intake is already highly socially selective, and given that higher income private schools are more likely to spend more on employing non-teaching staff (Davies & Davies, 2014, p. 434), may suggest that the advantages provided by greater income do not map simply onto attainment. It seems likely that economic largesse may be associated with less measurable advantages, not least the formation of a habitus comfortable with elite architectural and social spaces and practices.
Data and methodology
The main analysis involves a PCA of Charities Commission (CC) accounts data. This includes 216 HMC member schools. The HMC is a historical association of high-status UK private schools formed in the late 19th century to protect their interests and financial independence as schools for the Victorian ruling and middle classes. The association still includes most of the more expensive and socially-selective private schools.
The sample represents most of the HMC (216/291). CC data include English and some Welsh schools. For consistency I have only included English HMC schools here, excluding Scottish, Welsh and Northern Irish schools. Several HMC members are in large school groups based on faith or gender (e.g. United Church Schools Trust, Girls’ Public Day School Trust). The charities funding these schools do not disaggregate individual schools, making it impossible to examine institutional finances. These schools were excluded. This does not significantly affect numbers of girls’/boys’ schools (19 boys’, 22 girls’, 175 mixed).
Financial data here are for 2017–18 (CC, 2020). Charity numbers were collected by hand. Data were then merged with Department for Education (2020) data providing data on student numbers and school type. All data analysed are published under Open Government License (National Archives, 2014). Data were analysed in R using ‘FactoMineR’ (Lê et al., 2008).
PCA allows us to explore how schools are positioned according to their characteristics. Where we have more than two continuous variables, a simple scatterplot will not allow us to examine relationships between many variables (Carlson, 2017, p. 265). PCA allows us to examine the interrelationship of multiple variables simultaneously. This works by deriving variables called Principal Components (PCs), which transform the original scores to maximize the amount of variance explained; this is repeated until all the variance is explained. The PCs are defined by the ‘loadings’ or the contribution of particular variables to the PC (Bro & Smilde, 2014, p. 2820). Each PC helps suggest the structure of the data, allowing us to understand hierarchies and groupings within it. Taking the first two PCs, as is done here, will often explain the largest amount of variance.
In our case the active variables that are used to construct the PCs are the economic variables in the CC dataset (see Table 1). These cover various sources of income, the composition of that income (percentages), loans (short- and long-term) and expenditure. There is more limited/less informative expenditure data. I have focused here on total expenditure and investment expenditure, with the latter variable allowing us to examine the association highlighted by Piketty between greater investment wealth and payments to investment managers. Fixed investment assets indicate the total investment capital held; current assets show other forms of cash assets. The variables chosen were selected to disaggregate the different approaches to financial management.
Summary statistics for 216 English HMC schools, accounting year 2017–18.
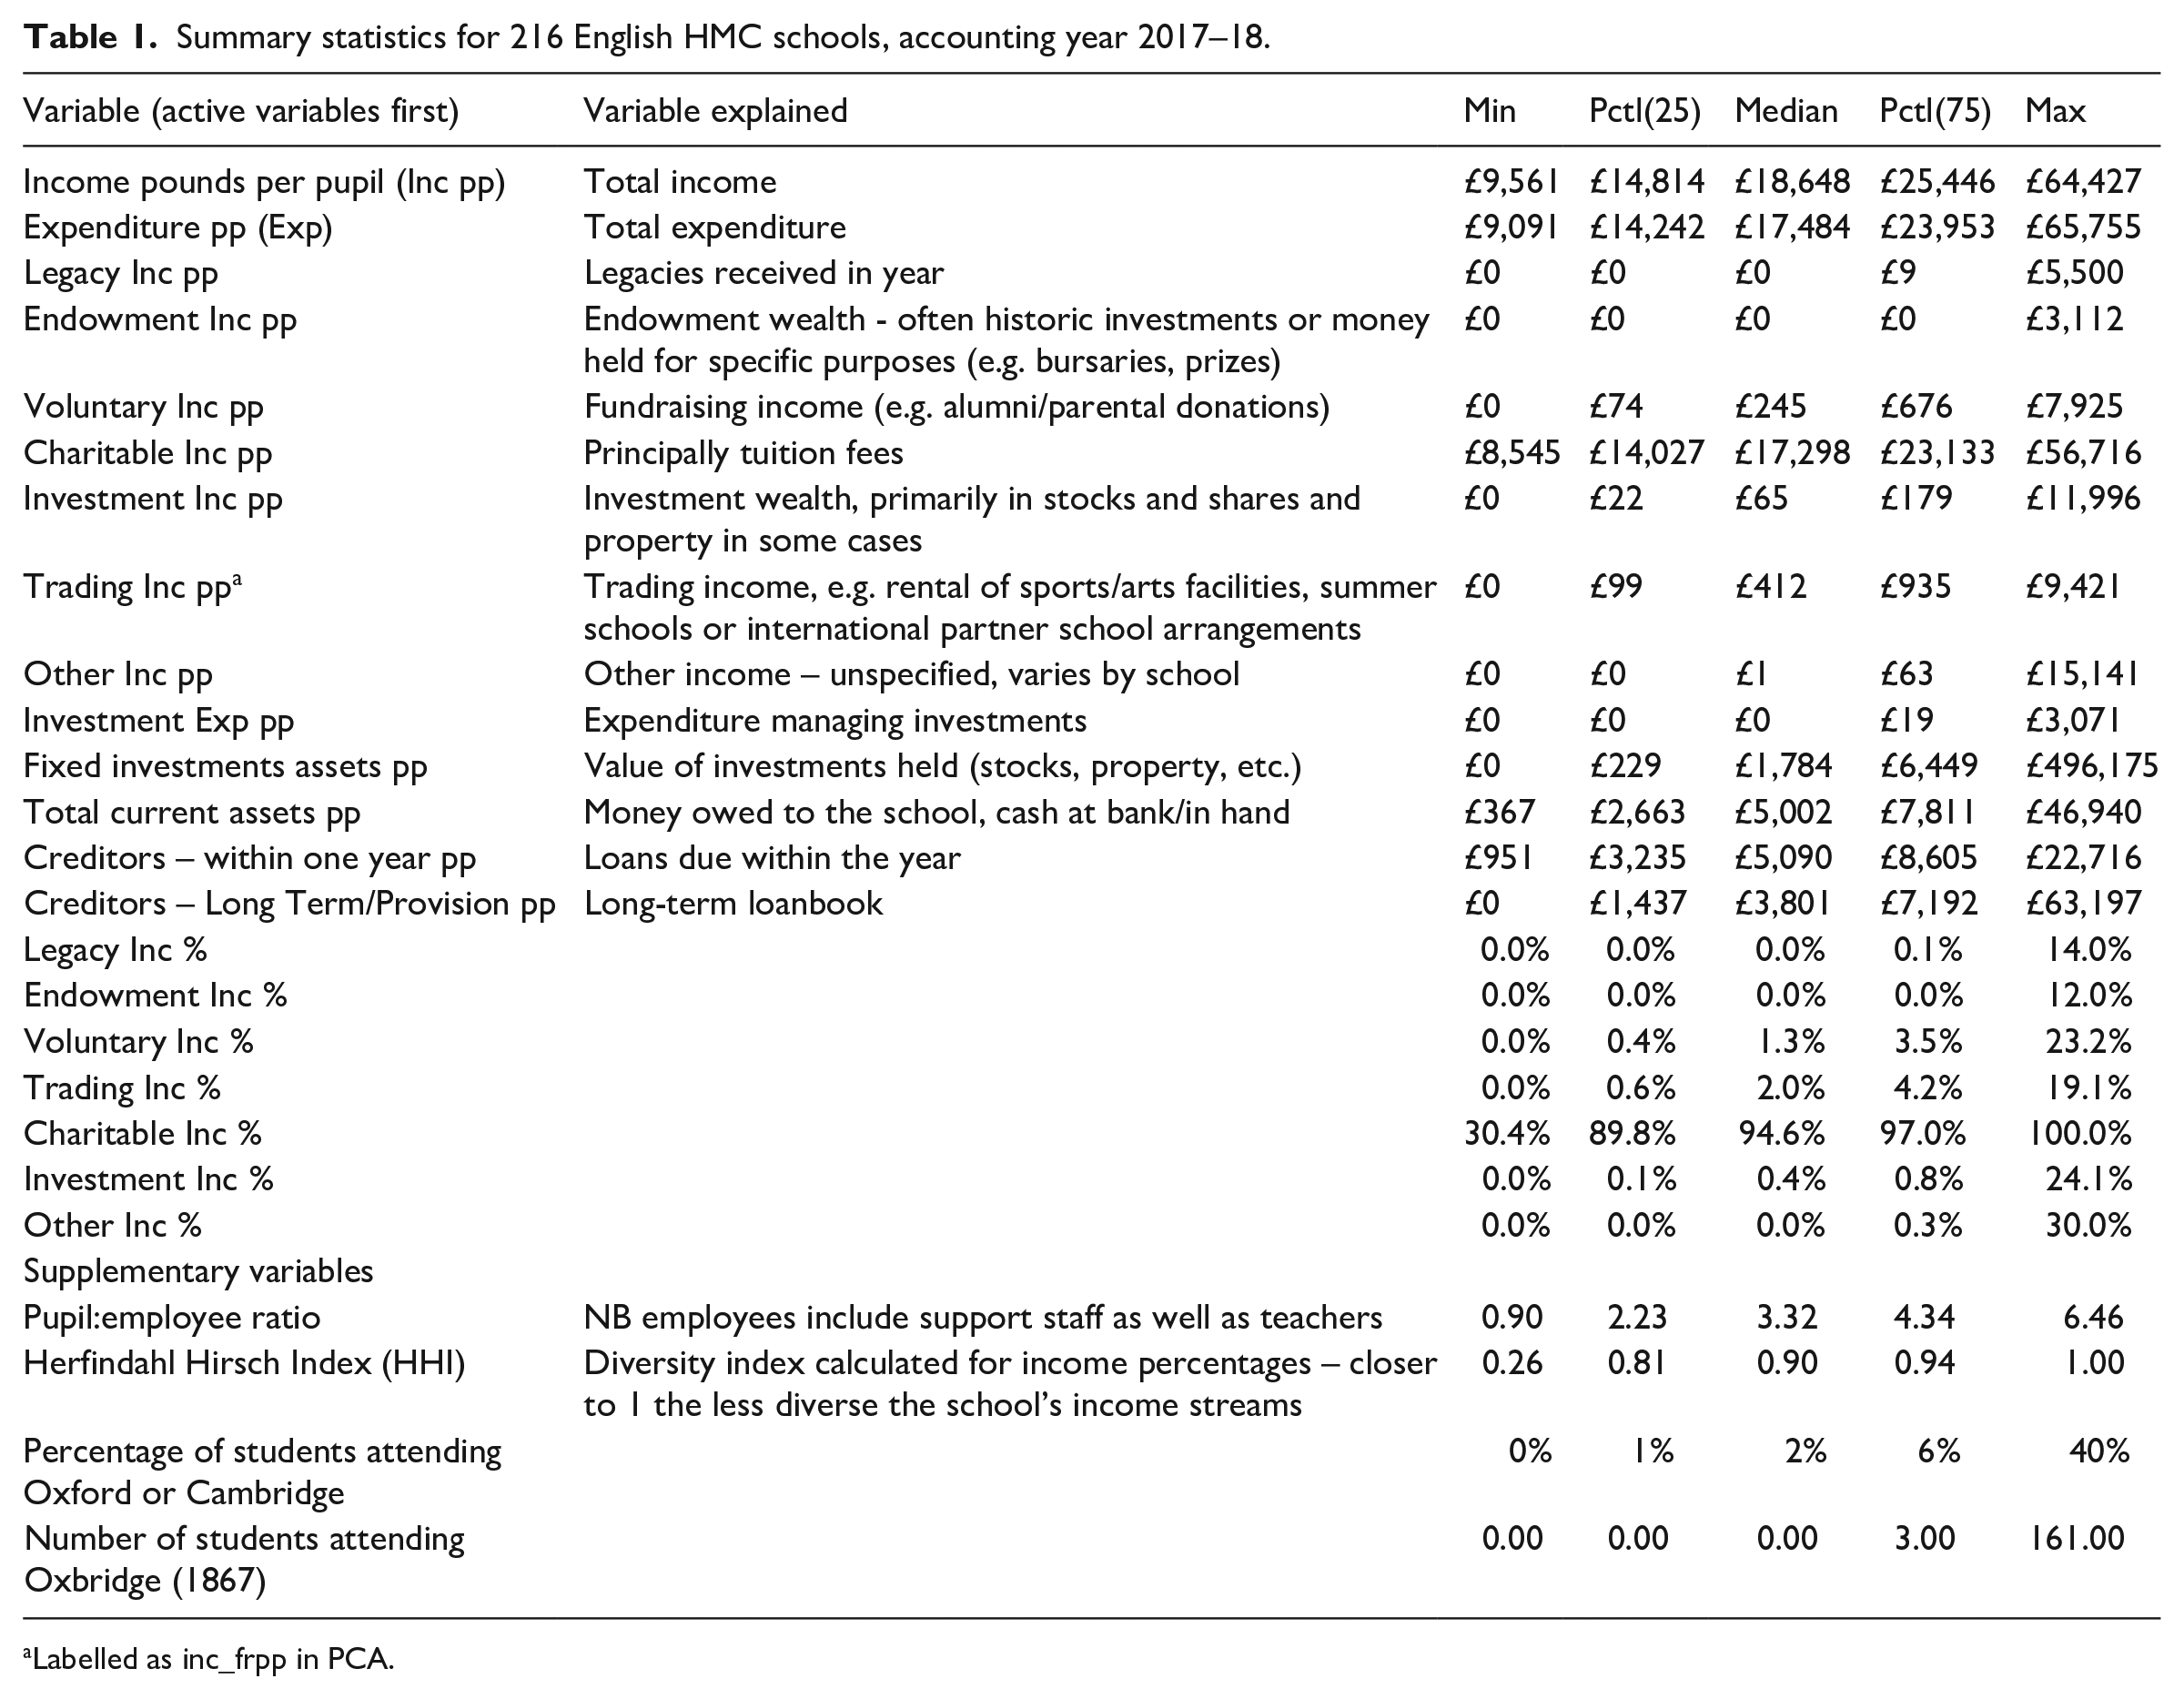
Labelled as inc_frpp in PCA.
Excluding income percentages, all the active variables are pounds per pupil (pp). Supplementary variables can also be included in PCA (Lê et al., 2008, p. 3). These do not contribute to the construction of the PCs but are projected into the space using the same method for continuous variables. These supplementary quantitative variables are pupil:employee ratio, income diversity index (HHI), percentage of students attending Oxbridge in 2017 (the last publicly available data), the number of students at Oxford/Cambridge in 1867 (using Government Commission data). These latter measures give an idea of contemporary entry to elite universities as well as a historic measure of 19th-century elite status (Steedman, 1987). For categorical supplementary variables for each PC, we calculate the position of the ‘mean individual’ for schools with certain characteristics (regions, boarding/day, girls’/boys’/mixed school).
Before doing the PCA I first transformed and standardized the active variables for the analysis. PCA is particularly sensitive to outliers with single individuals (Chen et al., 1996, p. 3563); normalization and standardization of data are thus not uncommon (Baxter, 1995). In these data the role of a small number of extremely wealthy schools (Eton, Christ’s Hospital, Rugby and Winchester) disproportionately influence the PCs, particularly with data left untransformed. However, running the analyses without these schools does not substantially change the axes, other (slightly less) wealthy schools have similar effects. As most variables are positively skewed but also contain large numbers of zeros, as is common for wealth data (Friedline et al., 2015), the inverse hyperbolic sine (IHS) transformation was used for most variables. Four variables received other appropriate transformations (specific transformations are shown with variable suffix – Figure 3); all active variables were standardized with z-scores following transformation.
I complement and expand the PCA analysis with a cluster analysis allowing us to further nuance our understanding of the field . This cluster analysis uses the PCA as a ‘pre-processing step’ with the principal components used to help define the clusters (Husson et al., 2010). This approach, Hierarchical Clustering on Principal Components, combines PCA, hierarchical clustering and the k-means algorithm to refine our understanding of multivariate datasets like this one (Maugeri et al., 2021).
A skewed field: The uneven accumulation of capital amongst elite schools in England
Glancing at the descriptives (Table 1) shows the skewed nature of the data, underlining the inequalities within the field. On average, these private schools had 3.7 times the income per pupil of local state schools (Gamsu, 2021b). Legacy, endowment and investment income are all relatively small for most schools, only the wealthiest 25% or less gain significant sums through these means. Voluntary income (often donations) is slightly more substantial across these schools, with a median income per pupil of £245. Most schools rely on school fees or ‘charitable’ income.
These descriptive statistics suggest a hierarchical set of relations to capital. The central division here is between schools that rely overwhelmingly on fees and those with more diverse incomes. This may also mirror a broader range of hierarchical positions within the field of schooling in England: geographical location, specifically proximity to South East England’s cultural and economic power (Cunningham & Savage, 2015), boys’ schools – historically wealthier than girls’ – and the more expensive boarding schools. Fee reliance also suggests greater vulnerability to economic change as pressure on family incomes would likely affect these schools’ finances (Gamsu, 2020a).
We might suggest a broader theoretical link here between institutional hierarchies and economic capital. The hierarchy between elite schools has always been relational and shifting (Honey, 1977). The less wealthy schools in this study rely on school fees, making them more exposed to reputational damage or academic competition from state schools. In contrast, schools with large capital wealth and/or other income streams possess deeper economic support for the construction of symbolic and cultural educational power. The substantial institutional wealth held by a minority of schools sets a particular benchmark relationship to capital; this is the apex of the system and symbolic and cultural prestige is mirrored and underpinned by their close proximity to and control over economic capital. Stripping the cultural power of these schools back to its economic basis allows us to see how capital conversion at the individual scale is paralleled and aided by capital conversion at the institutional scale (Gamsu, 2016). This also underlines how institutional hierarchies, and public perceptions/cultural understandings of what educational ‘excellence’ means, is ultimately strongly associated with economic capital. We now examine this hierarchy through the PCA and cluster analysis.
Principal Components’ Analysis
The PCA analysis shown below allows us to understand the field positions of elite schools in relation to their economic capital. Using PCA methods, we can examine the relational construction of economic hierarchies within the field. In keeping with a Bourdieusian approach to quantitative analysis, the conceptualization of hierarchy as a relational field overlaps with the statistical method (Lebaron, 2009, pp. 12–13). We discuss four hierarchical positions present within the field suggested by the PCA.
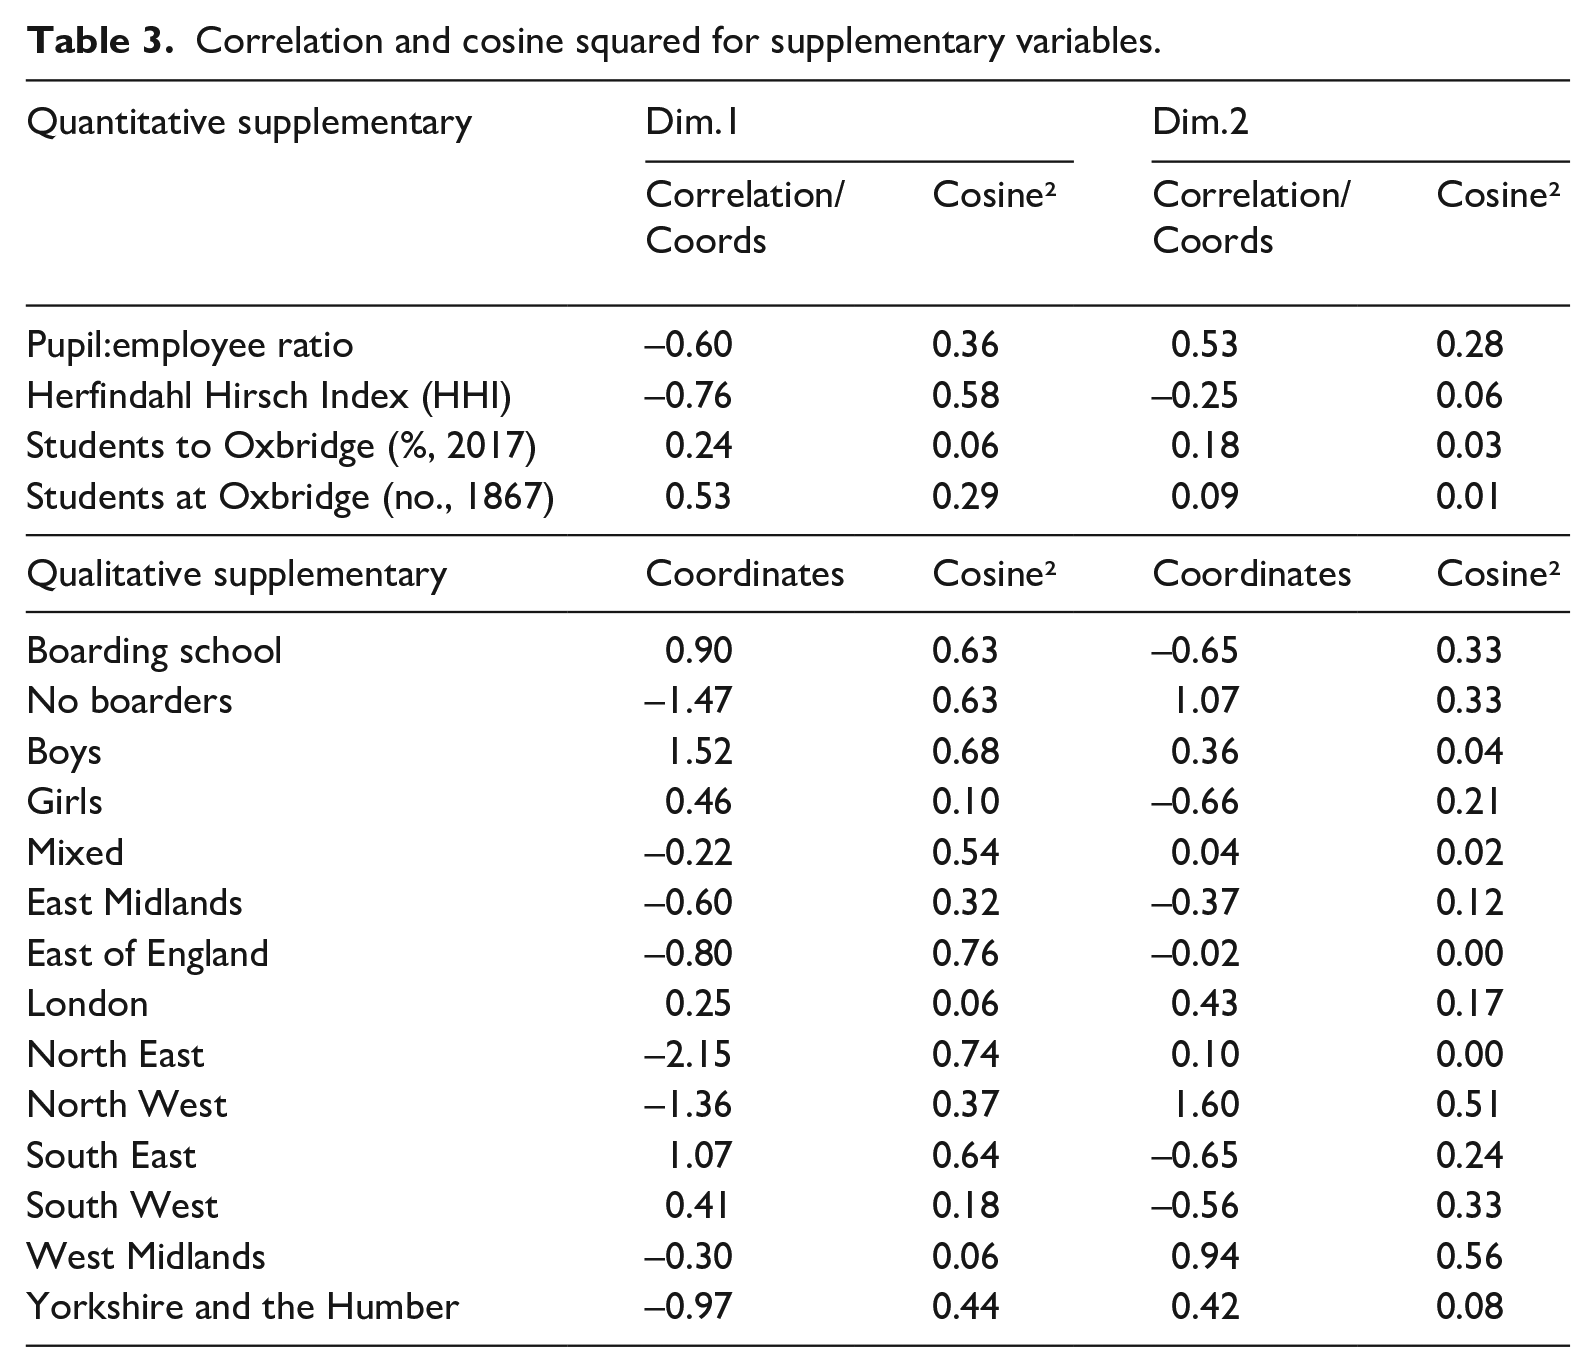
Figures 1–3 and Tables 2–3 allow us to understand the construction of the two PCs. The x axis represents the first PC, which accounts for 34.37% of the variance. In order of contribution (⩾5%) to PC and all positively correlated unless noted, the variables shaping this PC are total income, total expenditure, charitable income, investment income, percentage charitable income (negatively correlated), voluntary income, loans due in year, current assets, percentage voluntary income, investment expenditure/income percentage/assets. What this suggests is that schools with positive scores on the x axis/PC1 have larger income and expenditure per pupil with diverse income streams. Schools with negative scores on PC1 have lower and less diverse incomes, with fees constituting a larger proportion of total income. The supplementary variables reinforce this with the HHI being negative correlated to PC1, as is the pupil:employee ratio, with schools with higher numbers of pupils per employee located on the left of the graph. The Oxbridge supplementary variables are both positively correlated but this is much more the case for the 1867 data, which are positively correlated and better projected on PC1.
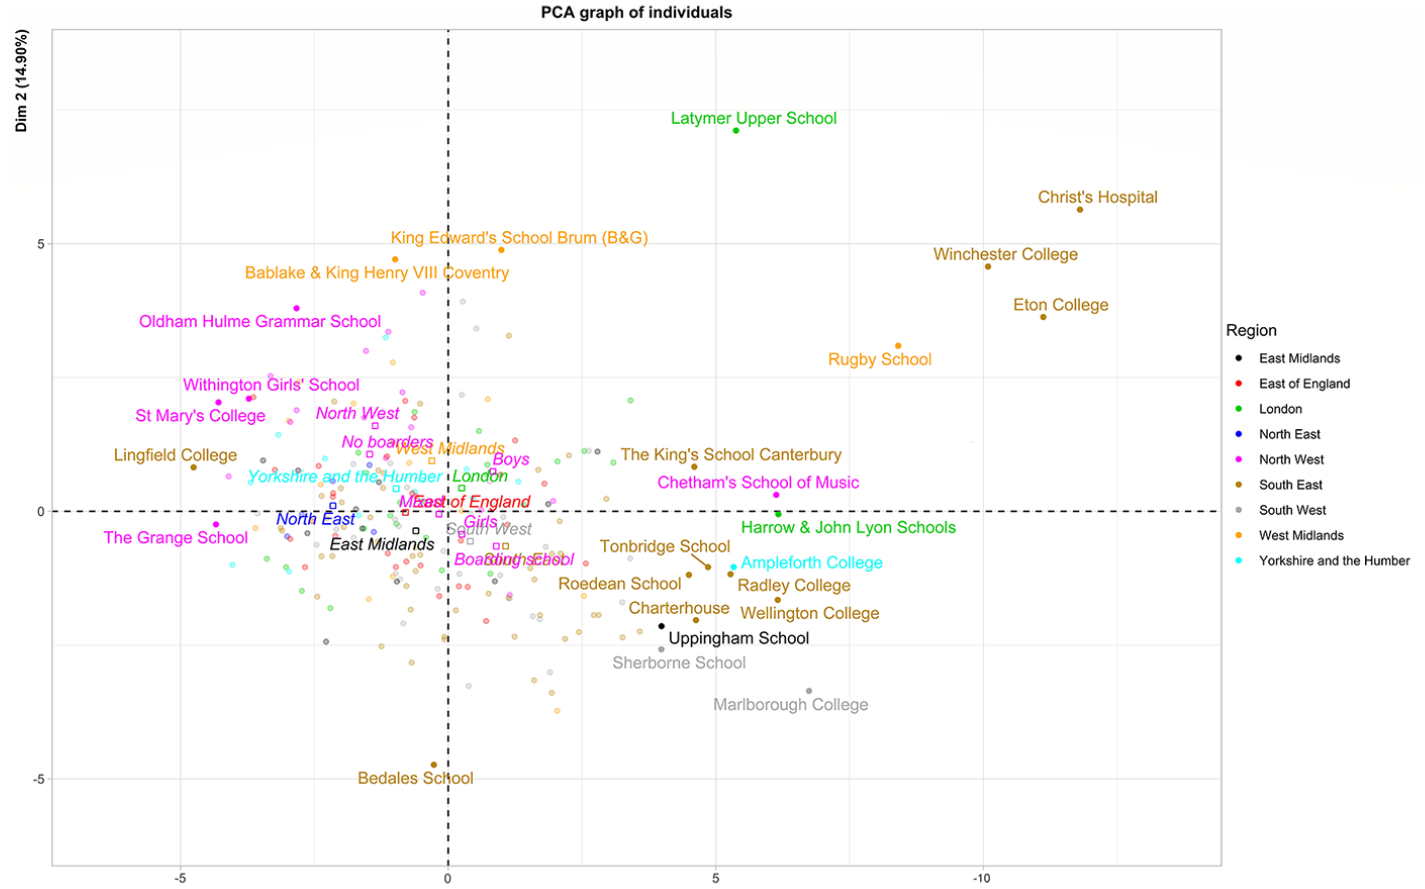
Graph of individual schools on PCs 1 and 2 coloured by region (highest contributing 25 schools labelled).
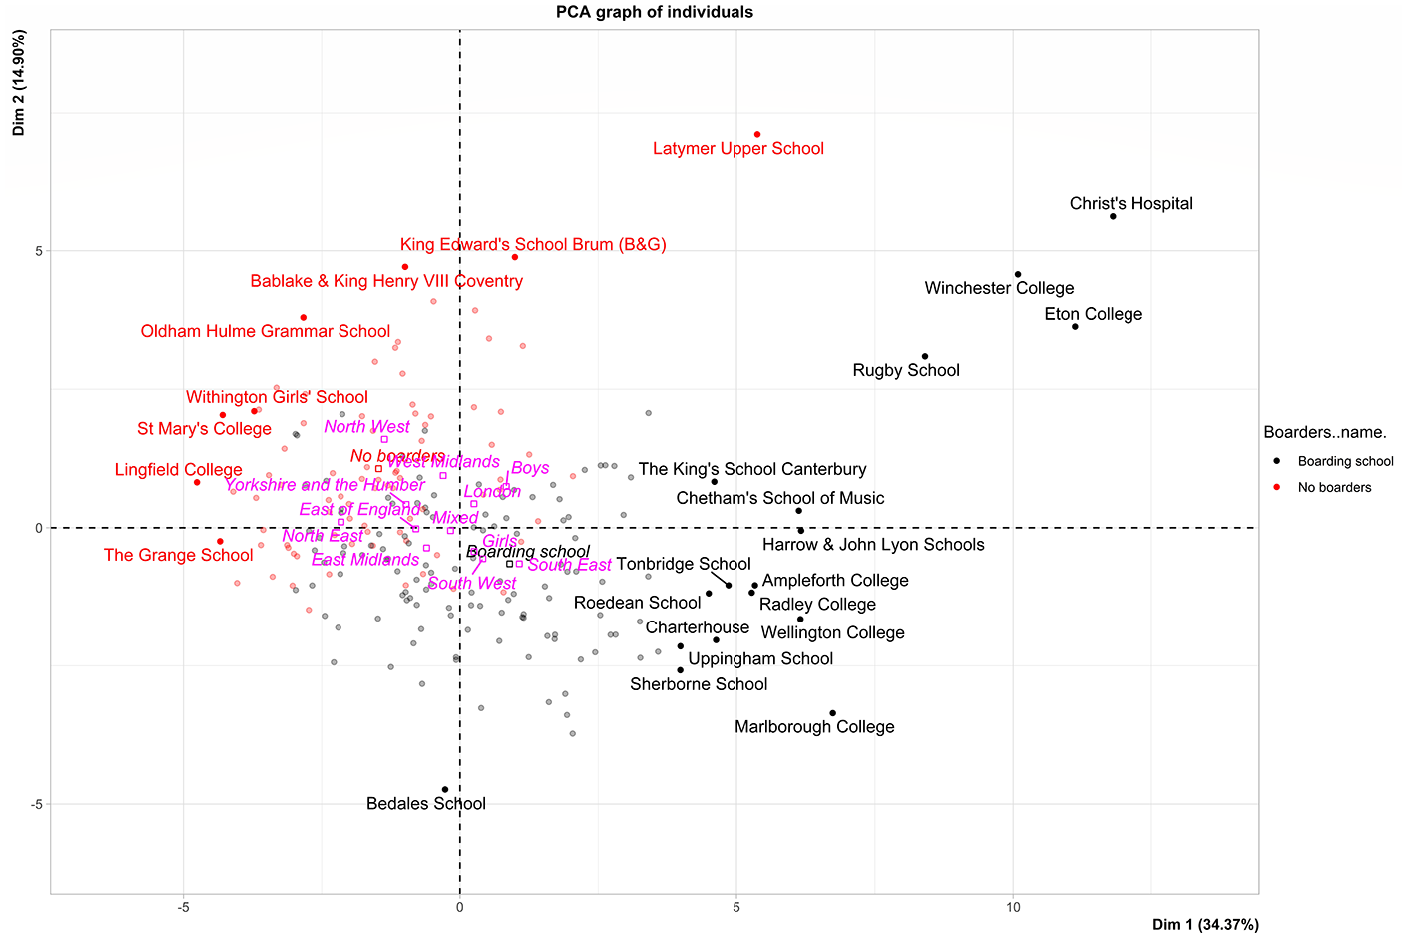
Graph of individual schools on PCs 1 and 2 coloured by school type (boarding/day) (highest contributing 25 schools labelled).
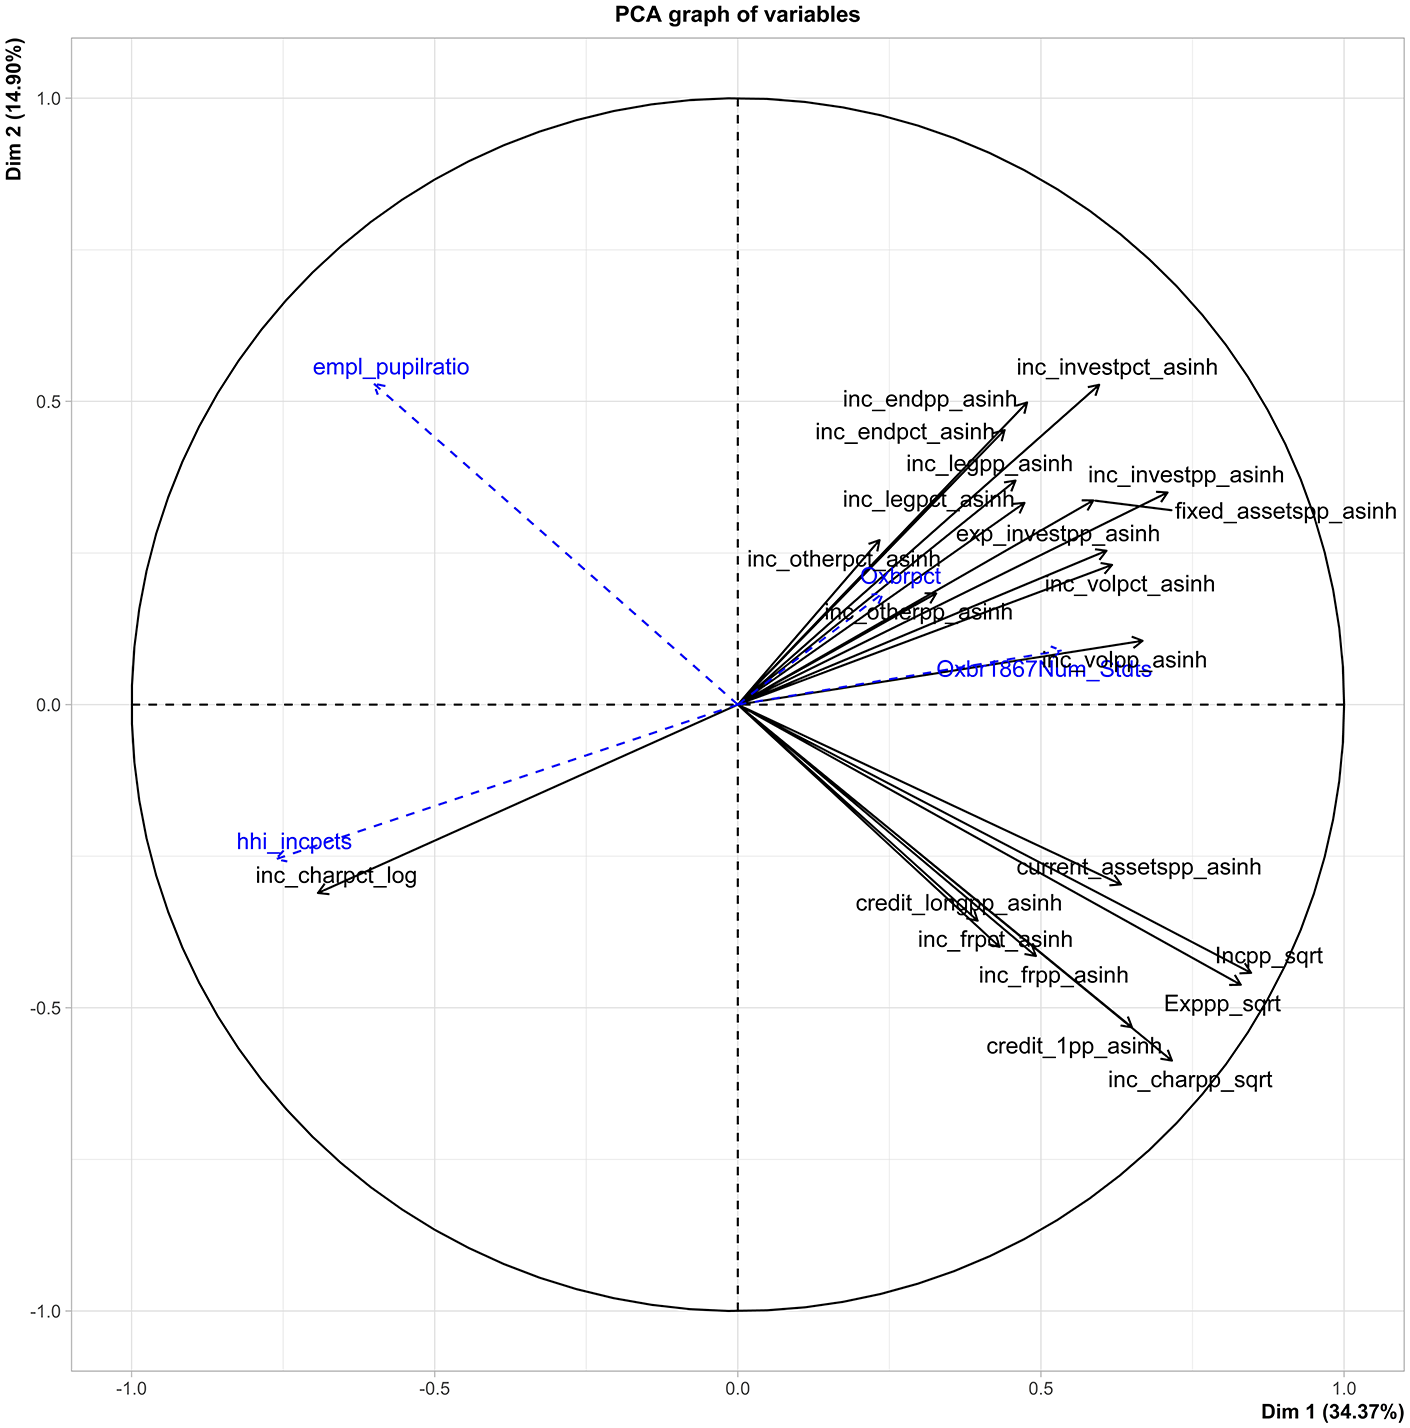
Graph showing contribution of variables to graph (dimensions 1 and 2).
Contribution, correlation and cosine squared for active variables (PCs 1–3).
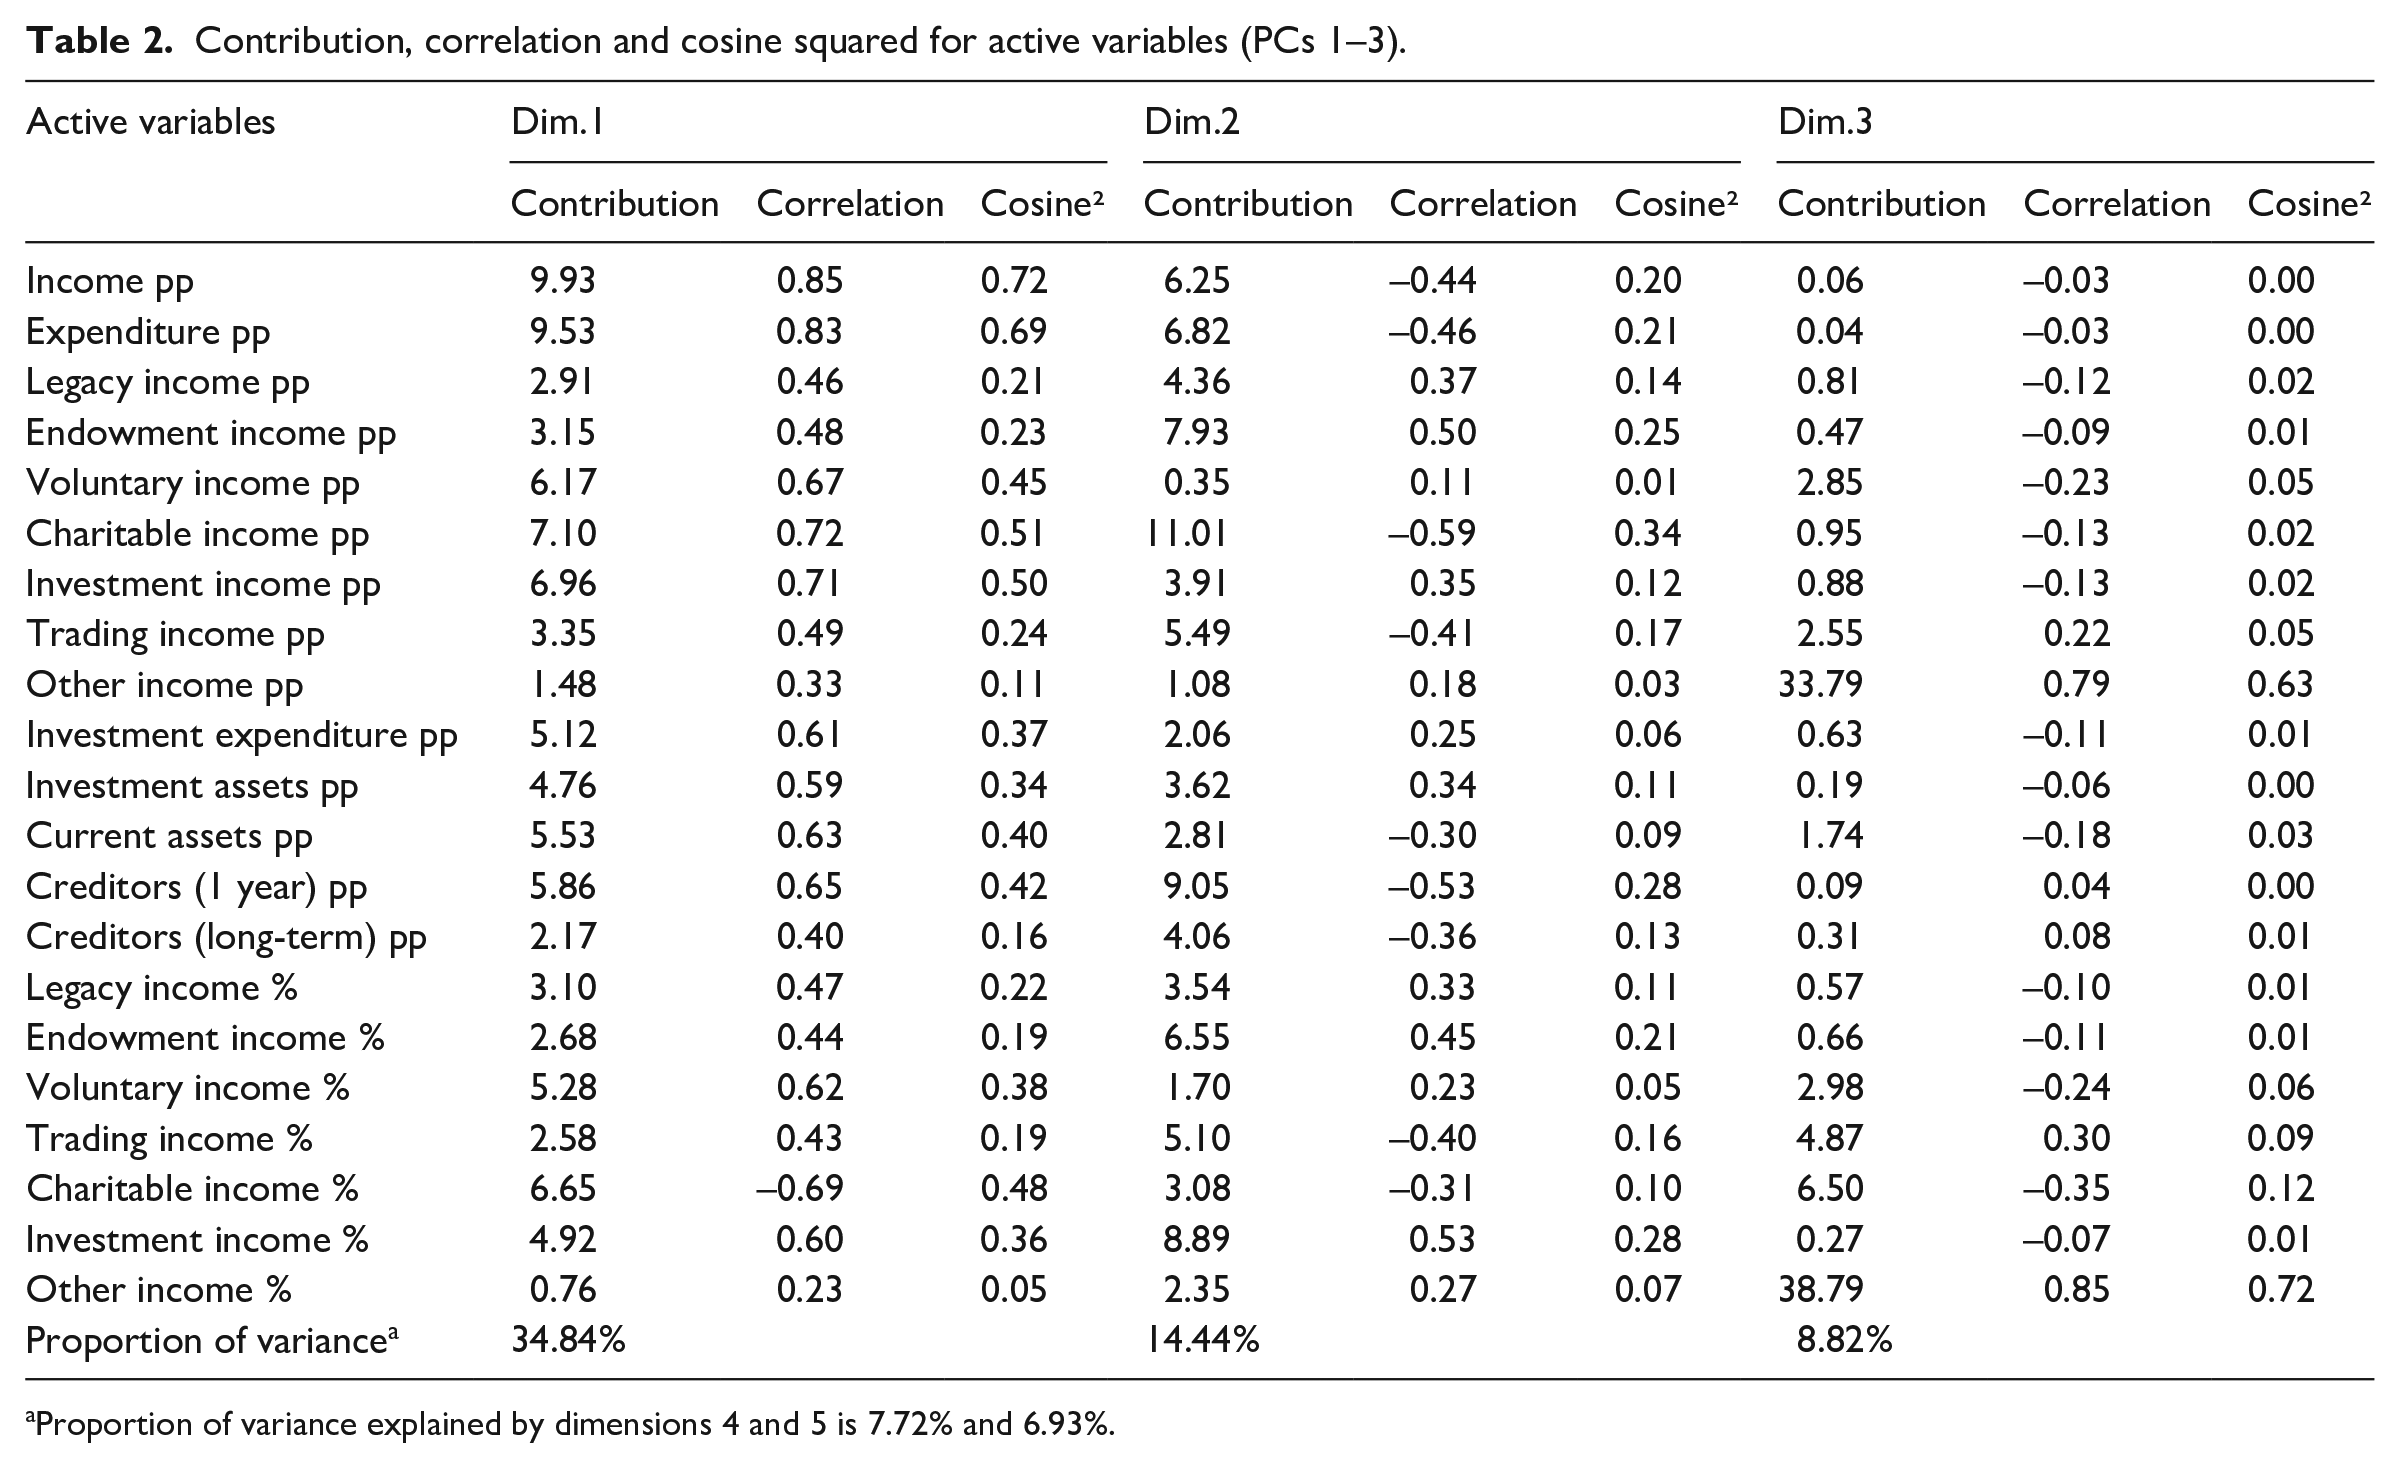
Proportion of variance explained by dimensions 4 and 5 is 7.72% and 6.93%.
Correlation and cosine squared for supplementary variables.
The second dimension/PC2 (y axis) accounts for 14.9% of the variation. PC2 is constructed through (again ⩾5%, correlation in brackets) charitable income (negative), loans due in year (negative), investment income percentage (positive), endowment income (positive), expenditure (negative), endowment income percentage (positive), total income (negative), trading income (negative), trading income percentage (negative). This divides those schools with higher levels of charitable income pp (fees) and those where there is some, often small, investment/endowment income.
We can further disaggregate these schools by applying a hierarchical cluster analysis to the PCA data; this allows us to cluster individuals across the active variables whilst also using the PCs to define the clusters (Husson et al., 2010). These clusters are projected in Figure 4, onto the same dimensions as above.
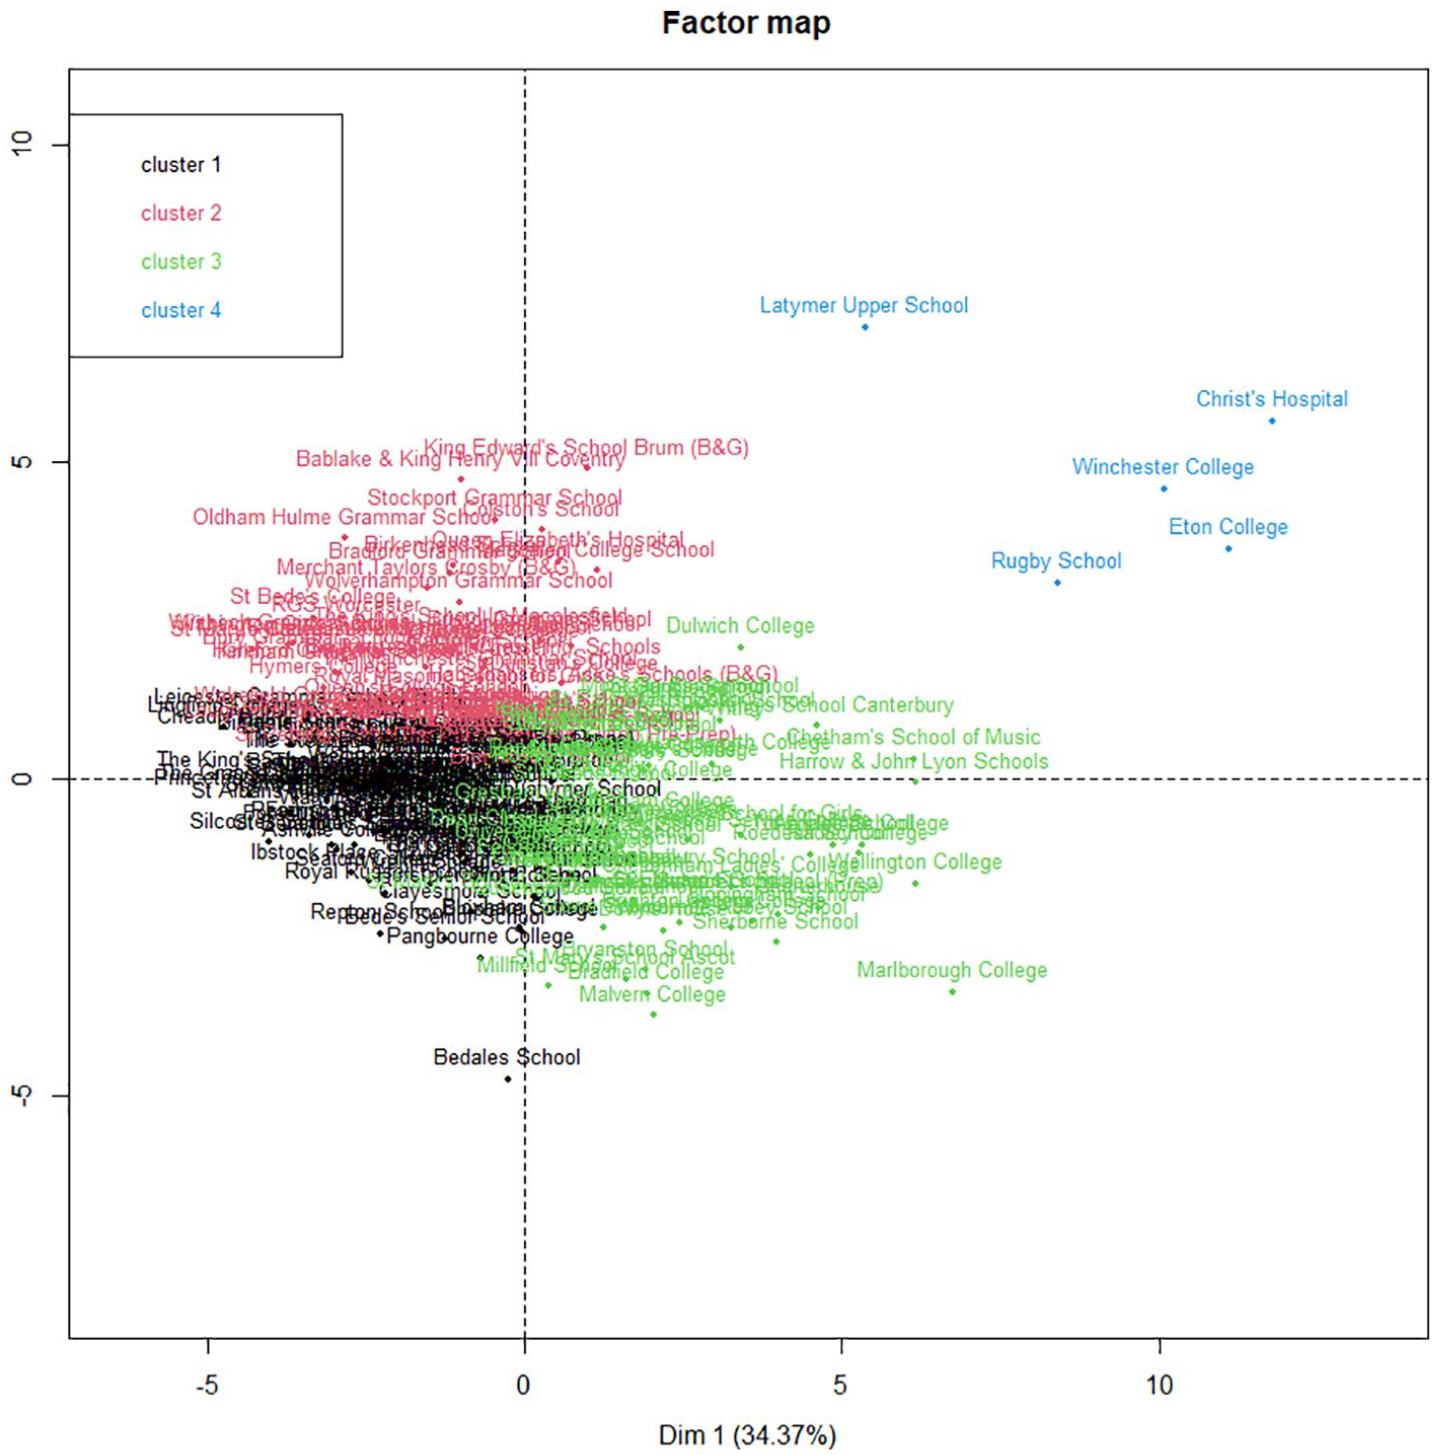
Hierarchical clustering on Principal Components – four clusters.
This approach further nuances our understanding of the economic hierarchy between these schools and allows us to incorporate the supplementary variables more easily to describe the clusters. The top right quadrant contains a tiny sub-group of five schools with extreme capital wealth (cluster 4) whilst the other schools in the top right quadrant with significant endowment/investment wealth are closer to schools in the top left or bottom right quadrant or clusters 2 and 3 respectively. We can now examine the characteristics of these clusters further (Tables 4 and 5).
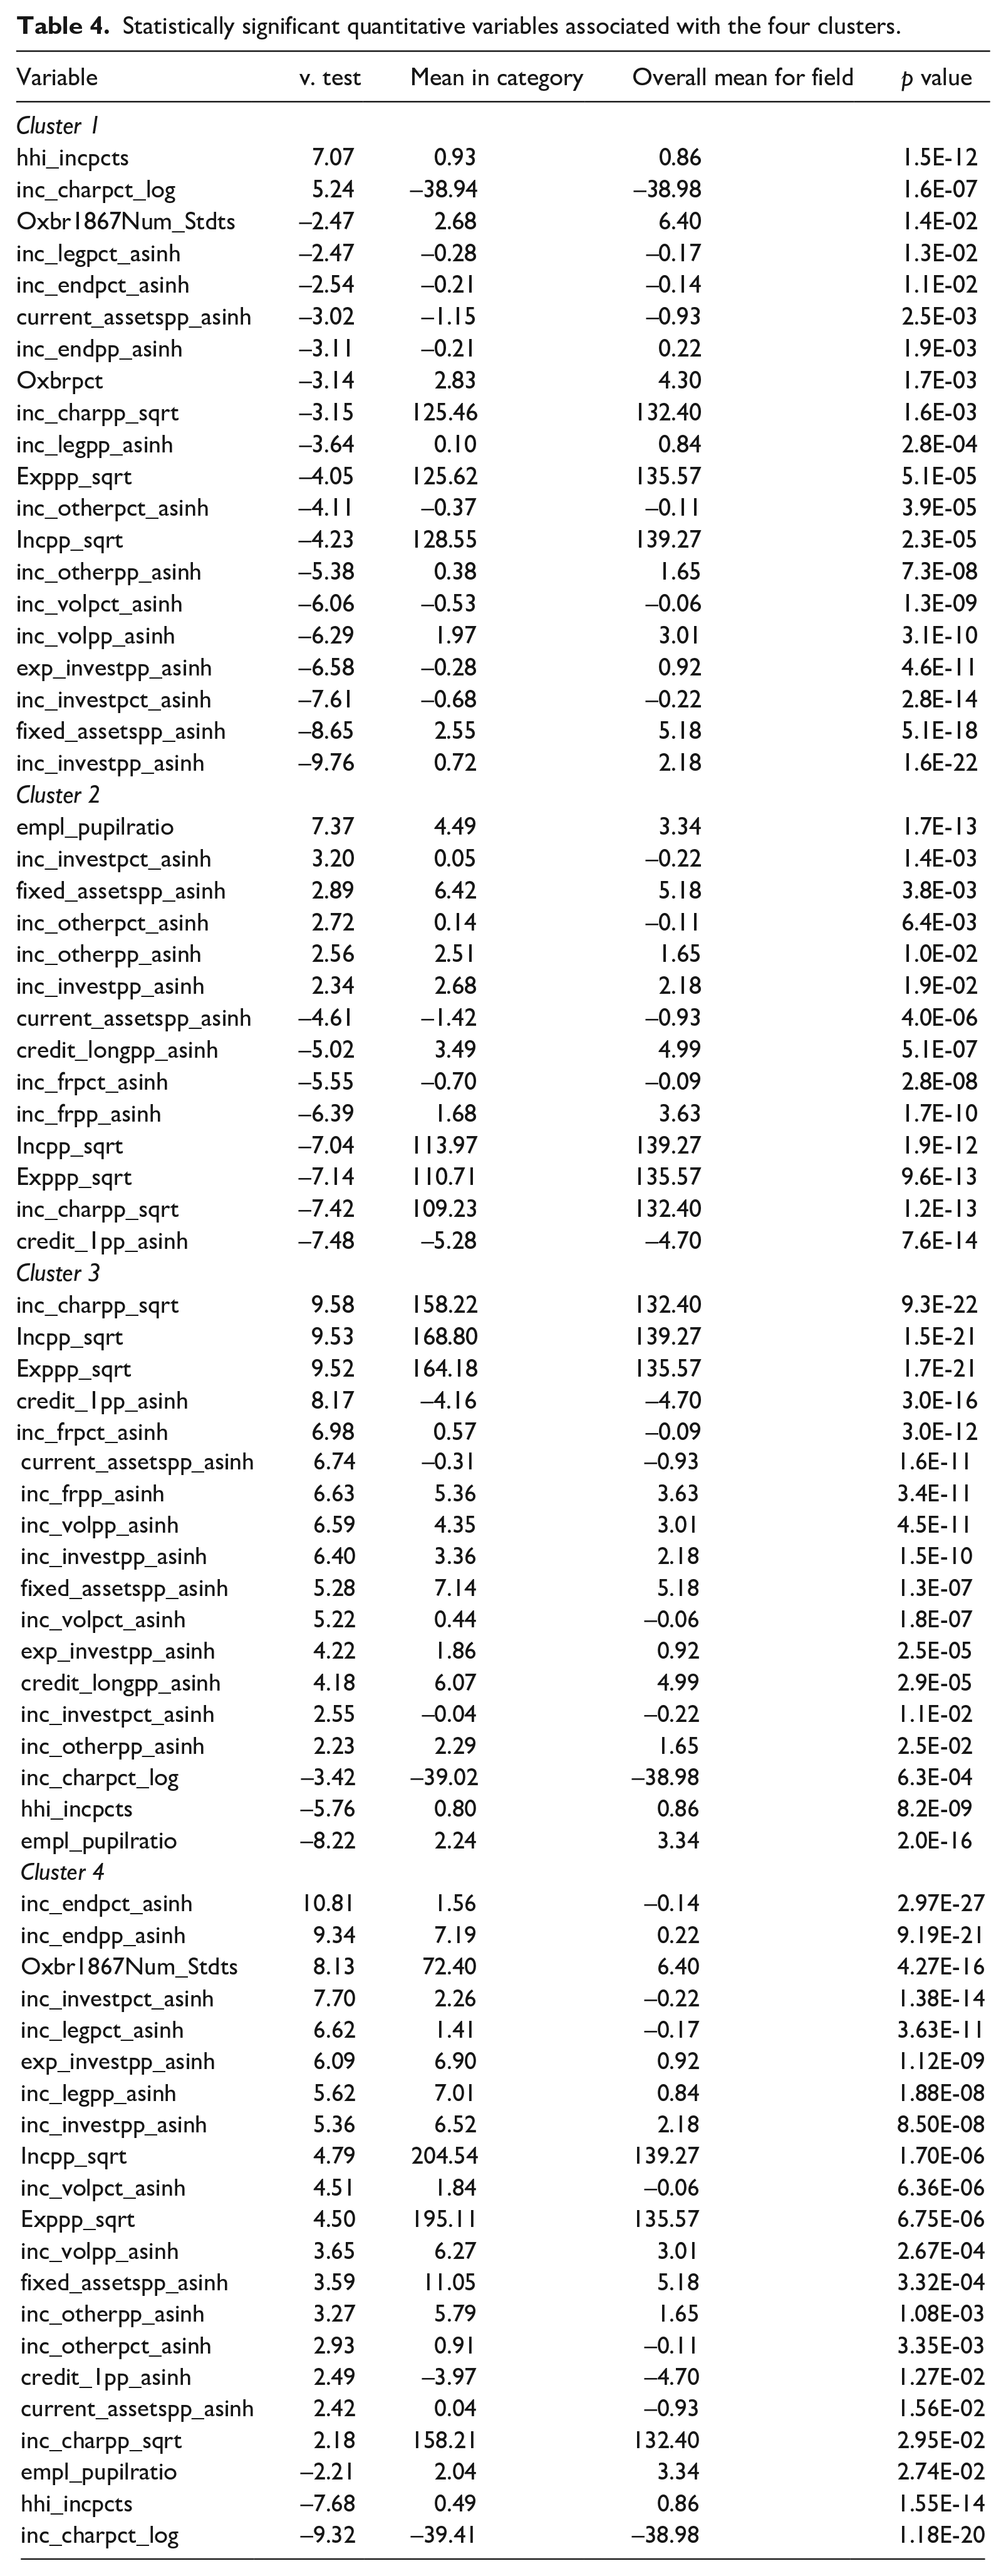
Statistically significant quantitative variables associated with the four clusters.
Statistically significant qualitative variables associated with the four clusters.
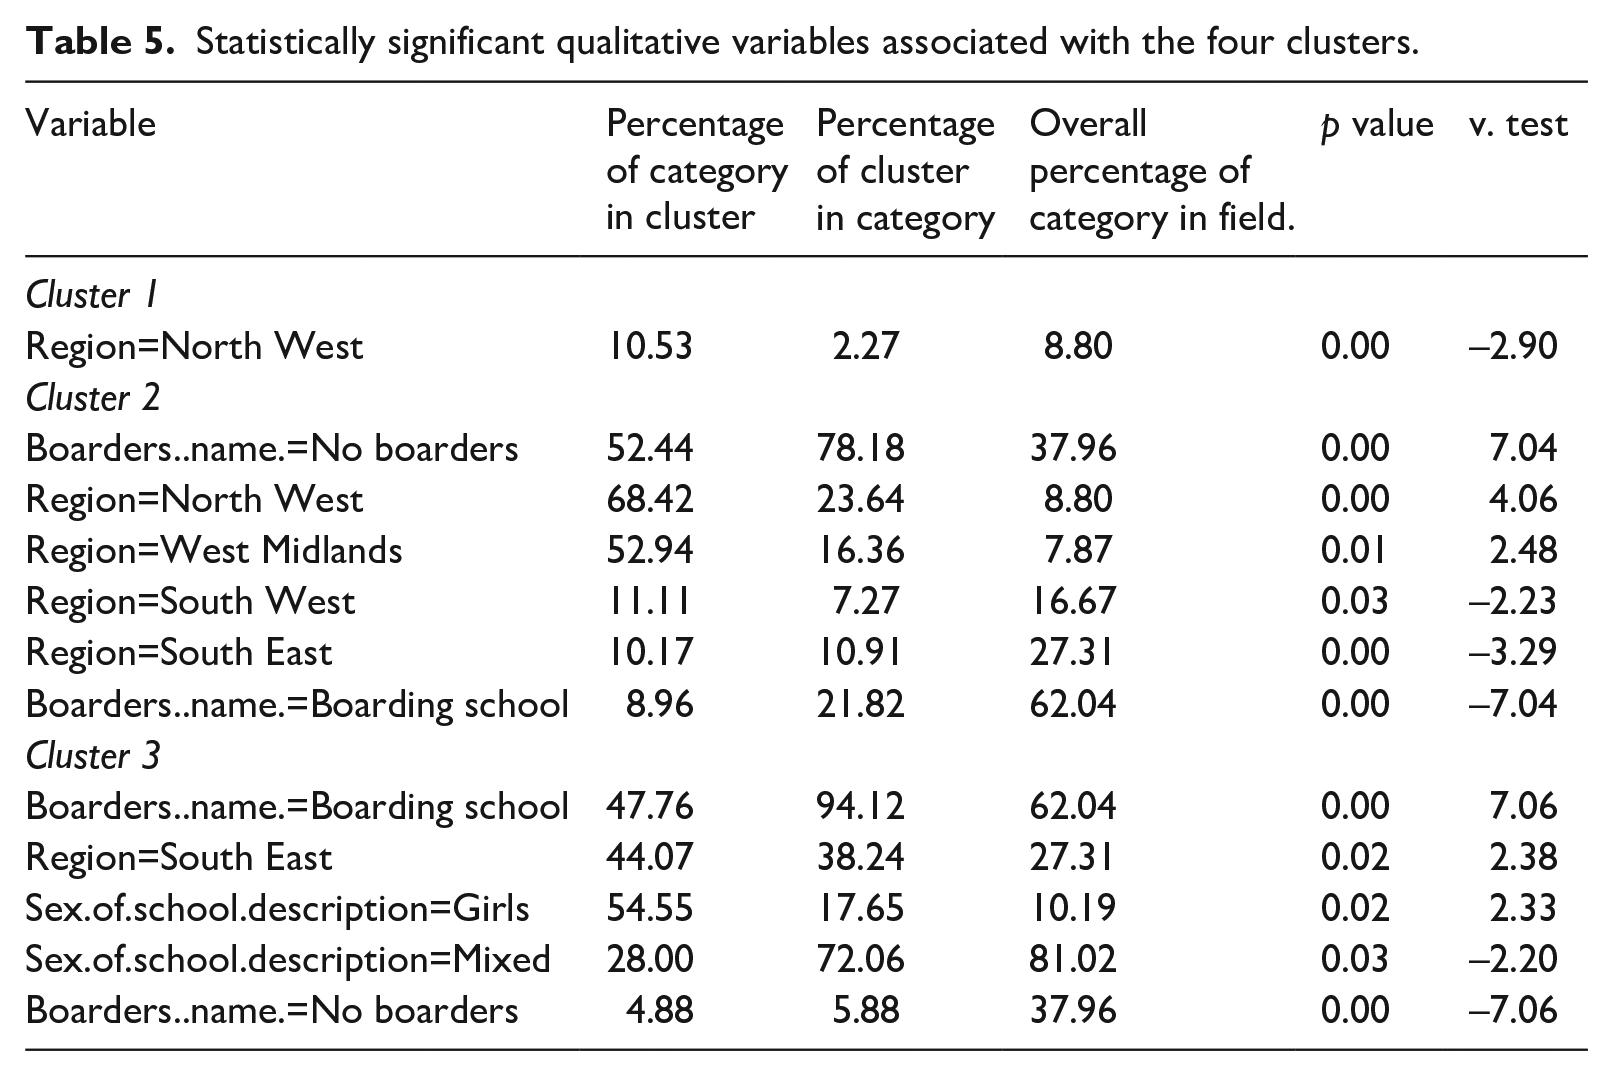
Tables 4 and 5 show the statistically significant variables that define and distinguish the clusters. We will examine their characteristics in descending order of overall wealth (cluster 4 to 1). Cluster 4 is a tiny, extremely wealthy subset that also heavily determine the PCA (very large contributions to PC1 and PC2). Across the full range of income types, and especially those associated with investment and other forms of capital wealth, cluster 4 has substantially higher averages than the overall group. It has on average just 2 pupils per employee, very diverse income (average HHI 0.49), very high historic numbers of students at Oxbridge (72 on average vs 9 in cluster 3, and 3 in both clusters 1 and 2) and the highest average percentage of students (9%) attending Oxbridge in 2017 (5% cluster 3, 5% cluster 2, 3% cluster 1). This is the old elite and their vast, historical wealth determines the field and the dominating position within it. The small numbers mean the categorical variables cannot be interpreted for cluster 4.
Cluster 3 is overwhelmingly (94%) boarding schools which are primarily co-educational (72%). The South East (38% of the cluster) is the only region that has a statistically significant association with this grouping. These schools are generally above average for income and expenditure, income from investments is also above average but notably less so than for Cluster 4. They have considerably larger than average trading incomes, which we examine further below as this reflects careful cultivation of alternative income streams. Pupils per employee is also very low.
Cluster 2 are the poorer day schools; just over half of all day schools in the sample are in this group and 78% of the cluster are day schools. These are provincial schools, with a large north-western group (68% of schools in North West England are in this cluster), they have above average numbers of pupils per employee (4.5). These schools have smaller debts due in year and tend to have lower/no long-term debt, unlike the wealthier schools on the right who appear to have much greater access to credit. This parallels recent trends in university finance where wealthier universities have greater access to loans on better terms (McGettigan, 2013). Key income variables (total income/expenditure pp, charitable income pp) are all notably lower than the overall average.
The other cluster, cluster 1, forms the majority of the bottom left quadrant. They are largely boarding schools (54/88), geographically heterogeneous but with a generally southern skew (73% in SE/SW/East/London). They have low levels of income diversity and below average total income and expenditure, whilst it is not significant in the cluster analysis, the PCA suggests that schools positioned here also have a high reliance on fees with charitable income a large percentage of income. Cluster 1 schools also have below average (mean) Oxbridge attendance in 2017 (2.8%) and 1867 (3 students) compared to schools in the field as a whole (mean for 2017 – 4.3%, 1867 – 6 students). This suggests they are lower prestige institutions with reduced financial resources relative to the dominant boarding schools of clusters 3 and 4.
Before examining the accounts of schools in these clusters, I summarize the four major field positions in the economic hierarchy of English private schools:
Top left: Fee reliant day schools. Mostly northern co-educational schools with higher numbers of pupils per employee. Some have very small endowment/investment income. Lowest incomes pp.
Bottom left: Fee-reliant boarding schools. Geographically diverse, mostly co-educational. Low income diversity. (Continued.)
Bottom right: Wealthy, income-diverse exclusively southern boarding schools. Greater fee reliance, some with considerable trading incomes. The older, more famous boarding schools.
Top right: Capital rich, mostly southern boarding schools. High income and expenditure, considerable investment/endowment income. Includes smaller subset of schools with vast capital wealth.
Cluster 4: The unassailable wealthy elite: managing large capital wealth
At the apex of the private school system, a handful institutions have vast wealth and income, allowing them substantial financial security. These institutions, like some Oxbridge colleges, have such substantial wealth-holdings that they are effectively in an unassailable class of their own. The dominant elite institutions that set the rules of the game in education are strongly bound to (economic) capital; we can only hypothesize here on how institutions use this wealth but proximity to capital appears strongly related to educational power and domination. With the partial exception of Latymer Upper, the schools in cluster 4 are essentially investment vehicles that happen to provide educational services. These schools are financialized, not as a site where capital can be accumulated for others, as is the case in state school systems under the academy or charter school model (Sanders, 2018; Whitfield, 2016), but rather as institutions that wield and accumulate capital themselves to ensure their own dominance. Looking at their CC accounts for 2017–18, Eton College (2018, p. 13) held investments worth £350.1m with a further £86.4m in property; Christ’s Hospital (2018, p. 7) held securities and other financial assets of £255m and £160.8m in property; Winchester College’s (2018, p. 26) investment income is primarily from (rural) property, valued at £268m; Rugby School (2018, p. 25) held a combined investments of £137.1m, (mostly property). This capital income allows them substantial economic power. Ignoring fee income, their investments, fundraising and endowments easily equal, and for Eton and Christ’s Hospital easily surpass, the income of most state secondary schools.
The other schools in the top right quadrant are dwarfed by these four boarding schools. The other school in this cluster, Latymer Upper, has the largest endowment income pp of any of the schools here, receiving over £3,000pp. In its 2017–18 accounts, Latymer Upper had investments worth £51m, managed by Smith and Williamson primarily for bursaries. Smith and Williamson managed the offshore investment vehicle established by David Cameron’s late father as revealed in the Panama Papers (Simpson, 2016); capital accumulation by the British ruling class, as individuals and for its schools, runs through the same hands. Latymer Upper also has very high voluntary income (over £8m or £5,806pp).
Most of the schools listed here have organized fundraising activities, and for some this is highly effective. Latymer Foundation (2018, pp. 2, 9) is typical in stating that the formalization of fundraising occurred around the year 2000 when state-funded Assisted Places were phased out (Manchester Grammar School Foundation, 2017, p. 4). Fundraising for bursaries, growing the endowment or for sports facilities/new buildings/renovation are all common. This is a highly strategic process, with the Institute of Development Professionals in Education (IDPE), founded in 1998, providing regular reports and analysis of effective fundraising strategies. Unsurprisingly, older, larger, better-funded development offices tend to have higher yields; schools earning over £5,000pp in voluntary income are, in descending order, Winchester College, Chetham’s School of Music, Eton, Harrow & John Lyon, Christ’s Hospital and Latymer Upper.
A comprehensive analysis of the source of school donations is beyond the scope of this article, but we can provide initial hints. Latymer Upper lists all donors that have contributed to their current fundraising campaign, aiming to fundraise £40m for the 400th anniversary of the school in 2024. In 2019, this list included 2,132 individuals of whom 288 were contributing over £2,024 pa, qualifying them as members of the ‘1624 Society’. Taking 20 members of the 1624 Society at random and looking at Companies House records, we can see these are often individuals in senior professional/managerial occupations (senior lawyers, senior academics, real estate directors), with 8/20 working in banking or investment, some of whom hold substantial private fortunes, as well as some individuals that have likely inherited wealth from and/or worked in multi-million or billion dollar family businesses. The proximity to capital in this small sample of donors further underlines the centrality of capital and finance to the maintenance and creation of prestige and power in education.
Fundraising also highlights the relationship between time and capital. There are many examples of fundraising associated with anniversaries: £10m by 2015 for the 500th anniversary of Manchester Grammar, £40m by 2024 for 400 years for Latymer Upper, and on a grand scale Cambridge University’s 800th anniversary – over £1bn in five years. These campaigns underline how history, time, capital accumulation and educational power intertwine. The narratives of these campaigns weave together institutional history, personal educational biography, experience and memory with financial wealth and the need to preserve, maintain and extend the institution into the future. Major gifts and legacies have been shown to be the most profitable element of private school fundraising activities (IDPE & Graham-Pelton, 2018, p. 16). This is a targeted process with more established schools keeping databases of ‘major prospects, i.e. a person able to donate at least the minimum value of a major gift’ (IDPE & Graham-Pelton, 2018, p. 17). Legacy income is a powerful reminder that capital allows existence beyond death; individuals’ economic success, partly due to their elite education, contributes to sustaining their former school. Their names live on in named scholarships, buildings or specific funds for the school’s students. The spectral, morbid and magical quality of capital is present here. History and time are woven together, combining the profitable working lives of former pupils, the institutional life of the school, which must survive beyond them, and the capital which will allow it to do so. Fundraising is another means by which these schools bind themselves to capital, keeping wealthy donors close and tracking the source of future donations through engagement and alumni networks. Whilst schools in clusters 4 and 3 are particularly successful at fundraising, these strategies and practices are found across the clusters.
Cluster 3: Elite schools with diversified income streams
The schools mostly concentrated in the bottom right quadrant have some very high incomes but with smaller endowment/investment wealth than cluster 4. Strategies for maintaining profitability are generally more diverse in these schools. This grouping includes many of the older, better-known boarding schools, which partly explains why their charitable incomes are so large, as boarding fees are substantially higher (£20k higher than day school fees in 2018). The larger schools mentioned here also operate fundraising campaigns and hold their own investments, though generally these provide much smaller incomes, mostly in the hundreds of thousands, with only Marlborough College earning over £1m through investments.
Several of the schools in this wealthy but less capital-rich grouping are involved in overseas franchising/partnerships to open satellite campuses. Bunnell et al. (2020, p. 708) suggest that older schools like Eton, St Paul’s and Winchester may not have got involved as they do not have the same financial need as others. This appears to be borne out here. Of the named schools in the bottom right quadrant (Figure 1) the following schools have satellites (earnings from CC or Companies House accounts in brackets): Harrow (£3.035m), Sherborne School (overseas company still repaying loan from school), Marlborough (income to school unclear, company’s surplus: £5.1m) and Wellington College (£1.4m). The financial arrangements underpinning these incomes are complex and vary substantially, and external investors are also involved (Bunnell et al., 2020, pp. 705–706; Sandgren, 2017, p. 208). These satellite schools are both profitable for the UK schools and allow healthy returns to private investors. Branding and reputation becomes a form of wealth creation – the sale of reputation now occurs transnationally, underlining how proximity to economic capital and innovative forms of commodification are central to these ‘charitable’ schools.
Clusters 1 and 2: The ‘poorer’ provincial day and boarding schools
At the lower end of the economic field of elite schools, we find the day schools of northern England and parts of the Midlands concentrated in the top left or cluster 2. This spatial hierarchy is not entirely accidental but rather reflects the contemporary and historical economic and social geography of capital and elites within England (Cunningham & Savage, 2015). The uneven development of the economy in the UK finds its corollary in the economic geography of private schooling. We will explore this geography briefly here. This serves to underline the spatial, social and economic differentiation of private school systems in the South East of England (including London) and elsewhere (Gamsu, 2020a). What really distinguishes schools in the North from those in the South, and especially the South East, is the absence of super-wealthy or wealthy boarding schools alongside a more diverse sector of private day schools. There are less wealthy private day schools in the South East, Lingfield College in Surrey being one example, but these sit alongside a larger number of much wealthier schools that are less common in northern England. Proximity to capital has regional dimensions for these schools which reflect the broader spatial structure of the English economy.
These schools do not have substantial investments of their own. Incomes from investments are in the tens of thousands as opposed to the hundreds of thousands or even millions. St Mary’s Crosby held £1.18m producing an income of £19,136. However, whilst these schools are a far cry from the apex of the wealth of the dominant institutions within the field, their incomes are still significantly larger than local state-funded secondaries. Though it had the lowest income pp in this analysis St Mary’s Crosby it was still higher (£8,477pp) than local state schools (£5,878pp) (Gamsu, 2021b). Located just outside Liverpool, it nearly became a state school in 2014/15 because of the difficulties parents faced in affording fees. Unlike in cluster 4 and likely in cluster 3, the wealth held by parents using schools in cluster 1 is much reduced; for St Mary’s Crosby and other similar schools this form of distance from capital makes their viability and stability as private schools precarious (Gamsu, 2020a).
At the lower end of the private school system, provincial day schools which are locally prestigious and ‘elite’ rely almost exclusively on smaller fee incomes. They may share similar cultural practices with the apex of the system but they are economically far closer to state schools. We can only speculate here, but it seems likely that their intake is also much less socially exclusive given the lower fees charged by day schools outside London. This would also fit with a theoretical and historical understanding of the role of elite schools in England within the class structure: that of joining the middle and ruling classes or elite within what appears to be a culturally unified system of private schooling. In fact, the proximity/relation to capital for both the families and the schools involved varies substantially.
Cluster 1 are largely southern institutions (73% from London/South East/South West/East England) with the majority (61%) being boarding schools. Schools that are closest to the centre of this cluster include provincial boarding schools like West Buckland School and day schools like the Grammar School at Leeds (GSAL). These are schools with middling low-diversity incomes, reliant on fees but with incomes that are higher than cluster 2. These fee incomes are still much lower than other more affluent day/boarding schools in the South East. These are mostly schools with minimal investment incomes, but higher fee incomes than cluster 2 due to boarding provision. West Buckland held long-term investments worth just £136,234 in 2017–18; GSAL held investments/stocks totalling just £45,000. West Buckland took an HSBC loan of £4.5m to build a new library and boarding house/sixth form; the loan was arranged assuming ‘only a steady rate of growth, recognizing that it operates in a remote area . . . with a niche [boarding] catchment’. This school relies overwhelmingly on fees (97% of income). Compare this to a boarding school like Tonbridge in cluster 3, which received a £6m loan from the school’s associated charitable foundation for a new science centre and held HSBC-managed investments worth £5.4m. With a few exceptions, notably Repton, Bedales and King’s College School, cluster 1 schools are less famous nationally and have middling incomes. These schools rely heavily on fees, which is their key unifying factor.
Conclusion: Proximity to capital and the maintenance of class power in and by elite schools
In the annual reports of the private schools just examined, the first few pages give long lists of educational achievements: success in sports, essay writing/debating competitions and examinations. These are followed, usually directly, by an account of the school’s income. The economics of these schools form the material basis for the symbolic and cultural prestige that is accumulated by these schools and their pupils. This article has provided an initial survey of how processes of capital conversion occurs at an institutional scale. More research is needed to look at the mechanics of this in greater depth than has been possible here.
Proximity to and control over capital is central to elite formation and reproduction. When we strip away the ornate historic architecture, the sporting and academic prowess and the embodied confidence and snobbery that these schools foster, we are left with brute economic inequality. For the schools analysed here, proximity to capital – the ownership of substantial wealth, or effective proximity to wealthy individuals, or the capacity to create alternative sources of income streams – varies both spatially and institutionally. The majority of HMC schools rely on fees, lack capital wealth and are provincially located outside South East England. However, wealth works relationally. Whilst they are much more distant from capital than the wealthy southern schools strongly associated with national elites, northern provincial day schools still possess resources that at a local/regional scale offer substantial advantages (Gamsu, 2021b). At the apex, four English schools hold and wield vast amounts of historically accumulated capital; unlike their exploited state counterparts (Whitfield, 2016) these institutions are the subjects not the objects of capital. Just below them on the next rung on the ladder is a slightly larger group, which are still highly wealthy and adept at manipulating different income streams to maintain their economic position. Taken together these 50–60 schools are culturally and economically extremely powerful. Despite the extensive literature on the continuing dominance of these institutions in producing ruling elites and the dominance of these institutions in determining what ‘excellence’ looks like in education, the material relation to capital is sometimes forgotten. Class power in education is strongly associated with capital.
An education in a setting of extreme economic affluence is not ‘the same’ as that experienced by those in poorly-funded state education, whatever these elite schools may claim (Khan, 2015, p. 68). This examination of school finances could be applied to elite schools elsewhere: in the USA the Eight/Ten Schools’ organizations form larger groupings of elite schools with substantial endowment wealth. Beyond that, what about Switzerland, Sweden, Japan’s new Kaiyo Academy, with its Toyota connections (Sandgren, 2017, pp. 209–210) or the new Chinese fee-paying schools (Liu, 2020)? What relations exist between new patterns of capital accumulation and the formation of new elites? We might also explore further how these economic dimensions of the field interrelate with other cultural dimensions (attainment, university entry and so on) to apply Bourdieu’s field techniques to contemporary inequalities.
Central to this story is the maintenance of prestige, control and dominance over the educational field. Capital is used here to exert power over time. If research in this field is to play a role in dismantling structural inequality and class power then it must be disruptive. Demystifying elite education must take place not simply in the academic field but publicly. We cannot simply rehearse analyses of class power for the sake of understanding alone. Instead, we should align and embed our work within the construction of movements that can overturn these systems of oppression.
Footnotes
Acknowledgements
Thanks to my co-presenters and attendees at the BSA special session on ‘The Material Basis for Elite Education’ (April 2021) and particularly Rebecca Boden and Malcolm James for their knowledge of school accounts. Thanks also to the students and staff in the HESI research group at Durham who provided thoughts and suggestions on this article.
Funding
The author received no financial support for the research, authorship, and/or publication of this article.