
Abstract
Estimating the performance of multimedia (MM) traffic is important in numerous contexts, including routing and forwarding, quality of service (QoS) provisioning, and adaptive video streaming. This paper proposes a network performance estimator which aims at providing, in quasi real-time, network performance estimates for IoT MM traffic in IEEE 802.11 multihop wireless networks. To our knowledge, the proposed MM-aware performance estimator, or MAPE, is the first deterministic simulation-based estimator that provides real-time per-flow throughput, packet loss, and delay estimates while considering inter-flow interference and multirate flows, typical of MM traffic. Our experimental results indicate that MAPE is able to provide network performance estimates that can be used by IoT MM services, notably to inform real-time route selection in IoT video transmission, at a fraction of the execution time when compared to stochastic network simulators. When compared to existing deterministic simulators, MAPE yields higher accuracy at comparable execution times due to its ability to consider multirate flows.
Keywords
1. Introduction
Efficient transmission of multimedia (MM) traffic in multihop wireless networks poses significant challenges mainly due to their more stringent quality of service (QoS) requirements (e.g., throughput and delay), especially in the case of real-time applications. 1 In addition, multihop wireless communication is inherently more prone to losses and congestion; for instance, the performance of a single wireless link can vary due to factors such as link-layer transmission rate, its signal-to-noise ratio (SNR), and complex propagation phenomena. Furthermore, transmission of multiple flows that are not limited by rate control mechanisms can also cause congestion, as well as inter-flow interference, medium access contention, and collisions. 2 And, in the specific case of MM traffic, even though compression techniques use a predefined average data rate as a target, the actual data rate of the compressed flow may vary considerably depending on scene complexity, flow resolution, and the different types of frames. 3
Estimating network performance is an effective mechanism to address the challenges raised by MM traffic as a way to achieve QoS-aware admission control, resource provisioning, and allocation in multihop wireless networks. 4 It allows estimating current available network capacity as well as deciding whether the network can fulfill each flow’s requirements. In addition, accurate MM performance estimates are useful for routing and video coding decisions.1,5,6
There are a wide variety of IoT (Internet of Things) MM applications that can benefit from a real-time network performance estimator to route selection, 5 such as surveillance systems for outdoor or indoor spaces in smart cities that require multiple video sources transmitting simultaneously to the monitoring center. 7 Note that the performance of these application scenarios can vary according to the selected route for each video flow, as this may cause inter-flow interference.
As will be discussed in more detail in section 2, different performance estimators have been proposed but do not fulfill the needs of IoT MM applications which require estimators to account for multirate flows as well as inter-flow interference, while being able to provide their estimates in a timely and resource-efficient manner.
In this paper, we propose the multimedia-aware performance estimator, or MAPE for short, which estimates network performance for multirate MM flows using their video coding rate as input. To the best of our knowledge, MAPE is the first estimator that is able to provide throughput, packet loss, and delay estimates in real-time considering rate-heterogeneous flows and accounting for inter-flow interference.
Experiments using different IoT MM application scenarios demonstrate that MAPE is able to provide real-time network performance estimates, i.e., throughput, delay, and packet loss, with savings of over two orders of magnitude in execution time when compared to the ns-38 network simulator. Furthermore, we show how MAPE can be used to improve video transmission quality by guiding route selection on a per-flow basis.
The remainder of this paper is organized as follows: section 2 reviews related work on network performance estimation in IEEE 802.11 networks. Section 3 describes MAPE’s design and operation in detail. Our experimental methodology, and results from our evaluation of MAPE’s accuracy are reported in sections 4 and 5, respectively. Section 6 shows how MAPE can be used to guide route selection in order to improve video transmission quality. Section 7 discusses how MAPE can be deployed in practical IoT MM applications while considering its performance profile as discussed in section 6. Finally, section 8 concludes the paper and presents directions for future work.
2. Related work
IEEE 802.11 networks have offered several attractive rate-capable amendments that serve various MM application scenarios. 1 Providing performance estimates is critical to meet QoS guarantees in such networks. Existing approaches to network performance estimation in IEEE 802.11 networks can be classified in three main categories, namely, mathematical models, online estimators, and discrete-event simulators.
2.1. Mathematical models
Estimators based on mathematical models typically make simplifying assumptions to make modeling tractable. For instance, most existing proposals target one-hop flows.9–11 Moreover, they make additional simplifications, such as perfect links and identical transmission rates for all nodes. In the context of per-flow performance estimation, Laufer and Kleinrock 12 present a more complete model for analyzing the throughput of carrier sense multiple access with collision avoidance (CSMA/CA) networks. This model estimates the maximum throughput for each flow by modeling the network behavior as a system of non-linear equations and solving the resulting optimization problem. That approach can become prohibitively expensive for larger networks, as the size of the system of equations grows exponentially with the number of network nodes.
2.2. Online estimators
While mathematical models for performance estimation are useful to understand the limits of contention-based medium access protocols, approaches that can be operated online are required in practice, e.g., for real-time applications such as adaptive video streaming6,13–20 and routing protocols. 21 In particular, performance estimation for adaptive video streaming is discussed in Wei et al. 16 and Karn et al. 18 These studies also consider buffer occupancy information for predicting performance to improve video streaming quality of experience (QoE). The work reported in Wang and Ren 20 proposes a method to reduce the impact of inaccurate throughput prediction on QoE by controlling the buffer occupancy within a safe range. In turn, routing metrics provide indirect information that is expected to correlate well with throughput, 21 but they usually fail to evaluate the interference between flows.
2.3. Discrete-event simulators
Discrete-event simulators can be stochastic or deterministic. Stochastic simulators use pseudo-random number generators to determine the outcomes of events that have some level of randomness (e.g., the choice of backoff intervals for medium access), while deterministic simulators replace pseudo-random generation with deterministic values (e.g., a fixed average backoff interval).
Network performance estimation performed by stochastic simulators like ns-38 and OMNET++ 22 is commonly used to either conduct an a priori evaluation of a certain network and its protocols, guide network provisioning, deployment, or operational tasks. Because of their random nature, they usually require a large enough number of runs for every experimental configuration in order to obtain statistically meaningful results, which adds to their inherent scalability limitations, long execution times, and high computational resource needs. However, deterministic estimators provide an adequate accuracy with identical results no matter how many times they are run. However, they must be designed to perform in real-time while the network operates to help dynamically adjust operational parameters.
One notable example of this latter class of performance estimators is Algorithmic Framework for Throughput EstimatoR (AFTER). 23 It was proposed to tackle the problem of real-time throughput estimation for multihop IEEE 802.11 networks. AFTER simulates the behavior of the link and network layers to quickly converge to steady-state behavior that allows it to estimate the long-term average throughput of each flow for a given set of application flows and corresponding routes. To this end, it maintains in memory a complete view of the network topology and performs a deterministic simulation of the network dynamics, generating simulated virtual packets (v_packets) for each flow at their respective virtual source nodes, triggering a number of other relevant simulation events, such as wireless medium access, queue management (v_packets being added, removed, and discarded from buffers), and, eventually, the delivery of v_packets to their virtual destination nodes. In particular, AFTER takes into account inter-flow interference, employing a set of deterministic rules to deal with nodes competing to access the wireless medium. However, AFTER cannot handle arbitrary traffic models because it seeks to estimate the maximum achievable network throughput by considering each flow to have an infinite backlog at the source. This means that AFTER provides no support for scenarios in which MM applications themselves limit the transmission rate of each flow. In summary, to our knowledge, MAPE is the first deterministic performance estimator that takes into account both inter-flow interference and heterogeneous flows, i.e., flows with different data rates, while being able to be executed in real-time.
3. MAPE
As discussed in section 2, although a number of performance estimation approaches have been proposed, none of them is able to provide real-time performance estimates that account for both inter-flow interference and rate-heterogeneous flows. The proposed MAPE tries to fill this gap and uses a deterministic simulation-based approach to estimate the long-term average throughput, packet loss, and end-to-end delay for all (multirate) flows considering inter-flow interference. Note that considering multirate flows is essential to more realistically reproduce the behavior of MM applications. For instance, in video applications, transmission rates are determined by video coding at each source and, therefore, each flow can be transmitted at different rates.
3.1. MAPE—design and operation
Algorithm 1 illustrates MAPE’s overall operation, which is divided in three steps: Step 1—MAPE starts with a complete snapshot of the current network state as input consisting of a representation of the network topology that includes link quality estimates (i.e., link frame delivery probability), list of currently active flows along with the respective paths, and each flow’s data rate; Step 2—MAPE then uses the initial network snapshot to simulate the network as it operates until reaching steady state, which is used to compute long-term throughput, packet loss, and end-to-end delay estimates in Step 3. Note that we employ the term steady state in the same sense as in Passos and Albuquerque, 23 i.e., a simulation is said to have reached steady state when, after a finite number of iterations, a set of states starts repeating itself forming a cycle.
MAPE’s pseudo-code.
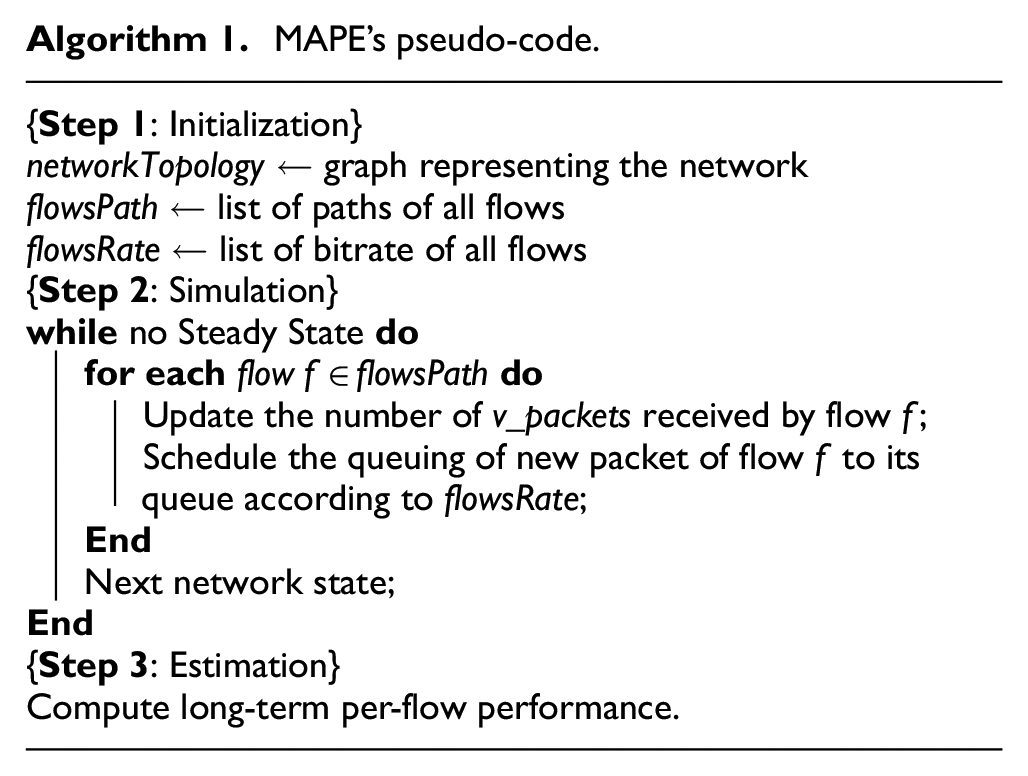
At the end of each iteration, MAPE stores a snapshot of the current network state, which consists of currently ongoing transmissions with their respective remaining times, the content of the queues and the backoff counter of the wireless medium access for all nodes that are traversed by any flow on the evaluated flow set, and the current medium access priority list. To decide whether the steady state has been achieved, the current state is compared to all previous ones. Whenever a duplicate state is found, MAPE declares that steady state has been reached and computes the average throughput, packet loss rate, and end-to-end delay for each flow. A heuristic stop criterion is also used to guarantee low execution time and adequate real-time performance independent of application scenarios. When duplicated states are not found, MAPE computes the average cycle performance of events within which at least one packet from each flow has been delivered to its final destination as an attempt to approximate steady-state performance.
Unlike stochastic simulators that study network behavior over a predefined period of time, MAPE aims at estimating the performance of the network, e.g., throughput, packet loss, and end-to-end delay at steady state. This can be especially useful for QoS provisioning and, as previously noted, for route selection in real-time MM applications. In addition, as discussed in section 2, deterministic simulators that assume rate-homogeneous flows may result in severely inaccurate estimates for a number of reasons. First, the performance of a flow is necessarily limited by its transmission rate. Thus, such simulators may grossly overestimate performance in scenarios where network capacity is much larger than the aggregate demand of the active flows. Furthermore, severe underestimates may also occur for individual flows because interfering flows may be transmitted at a higher rate, consuming more network resources than they would in reality, reducing the achievable performance of other flows. MAPE overcomes these limitations by explicitly accounting for both multirate flows and inter-flow interference and thus attains more accurate performance estimates in more realistic MM application scenarios.
While MAPE builds on “traditional” deterministic estimators such as AFTER, 23 unlike these estimators, MAPE relaxes the assumption that all flows have infinite backlogs and instead generates v_packets according to the rate of each flow—which can be specified as an input, based on the flows’ video coding rate, for instance. Whenever invoked, MAPE receives flow rate arguments as input and uses them deterministically to simulate the network dynamics by: (1) generating simulated v_packets for each flow at their respective source nodes, (2) triggering a number of other relevant simulation events, such as wireless medium access transmission, queue management (v_packets being added, removed, and discarded from buffers), and (3) eventually, delivering v_packets to their destination nodes. As such, inter-flow interference happens as a result of buffer overflow, link-layer transmission losses, and medium access conflicts.
3.2. MAPE—implementation
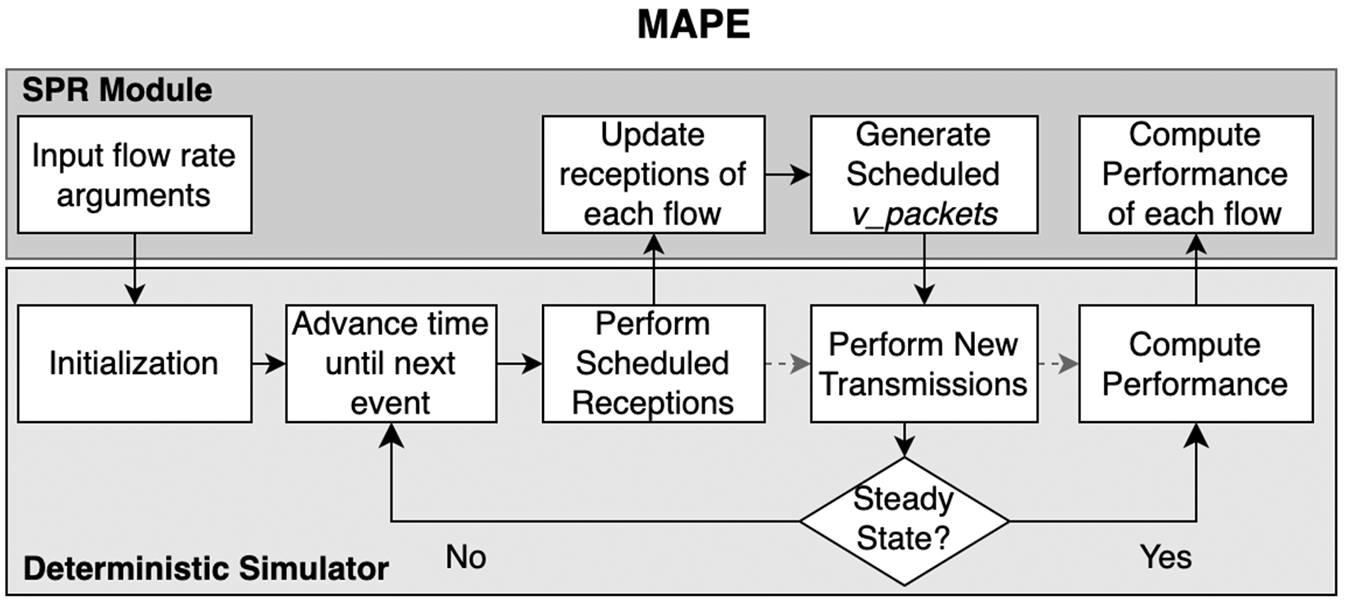
MAPE’s current implementation (publicly available at: https://github.com/fabianobhering/MAPE) uses AFTER 23 as the underlying deterministic performance estimator. As shown in Figure 1, MAPE starts by initializing the simulation state with its input arguments. In this phase, the first packet of each flow is added to the queue of the respective source node, and the simulation time is initialized to keep track of the events that are used to generate scheduled v_packets. Thus, the main loop of the simulation starts with the advance of the simulation according to the time of next possible events. This loop also handles packet receptions and eventually generates new transmission events until it detects that the network has reached a steady state which informs MAPE that it can then compute the estimated performance of each flow.
MAPE’s implementation.
MAPE’s functionality is implemented as a module (called SPR for Specific Per-flow Rates) that interfaces with the deterministic simulation engine to (1) provide flow rate information as part of simulation initialization, (2) update each flow when their v_packets are received, (3) generate new v_packets according to the stipulated flow rates, and (4) provide per-flow performance measurements. MAPE uses a representation of the current simulation state which includes information about all received v_packets. Furthermore, the SPR module implements a procedure to schedule the next packet generation for each flow according to the specified rate and keeps track of the number of v_packets received per flow, which is used to calculate performance estimates for each flow once steady state is reached.
To simulate v_packet transmissions, MAPE starts by placing the initial v_packet of each flow on the queue of the respective source node. It then iterates through all nodes that have at least one v_packet on their queues and triggers events for dequeuing a v_packet and adding this v_packet to a transmission buffer, where the v_packet is stored while waiting for an opportunity to be transmitted.
Note that MAPE’s SPR Module introduces a mechanism to schedule the next v_packet generation for each flow according to the specified rate. Once per-flow rates have been specified, the scheduler uses them to place new v_packets in each source node’s queue until the steady state is detected. Thus, v_packets of each flow are generated according to the intervals of the simulation time. To keep track of the simulated time, MAPE uses a time variable that is updated according to the end time of a link-layer transmission attempt and the backoff procedure.
Once the simulation reaches steady state, MAPE computes the average throughput of each flow as the ratio between the total number of v_packets delivered within the last steady-state cycle—i.e., the period between two repeating simulation events—the steady-state cycle length. In addition, the SPR Module computes packet loss and end-to-end delay by tracking all v_packets from the instant when they are generated at their source nodes until they are received at their destinations. MAPE is then able to estimate the average per-flow packet loss rate and end-to-end delay. Such metrics account for the data link-layer transmission attempts and queuing delays.
3.3. Discussion
While MAPE makes assumptions about network events and convergence to steady state, our experimental evaluation (see section 5) shows that MAPE is still able to estimate per-flow performance with adequate accuracy in quasi real-time.
Note that MAPE uses information about the topology of the network and the driving application (e.g., MM sources, flow rates), and, in the application scenarios envisioned (e.g., Smart Cities, Industrial Automation), nodes are typically stationary and have access to continuous power sources. As such, frequent topology changes (and energy limitations) are not expected to play a significant role. In scenarios where topology changes need to be considered, topology updates can be conveyed by proactive routing protocols.
Route selection is an example of how MAPE can be used in practice. The routing protocol would invoke MAPE with an up-to-date network snapshot as input. Then, based on MAPE’s performance estimates, it would perform route selection accordingly. For instance, a proactive link-state algorithm (e.g., optimized link-state routing (OLSR) 24 ) can periodically discover topology changes and disseminate this information through link-state updates that MAPE can use to adjust its estimates. Network topology information would be updated whenever a node identifies “significant” changes in the network topology, e.g., link failures, new nodes/links, or changes in link quality. As part of our experimental evaluation (see section 6), we show how MAPE can guide route selection and, as a result, improve video transmission quality.
In its current implementation, MAPE assumes that flows are transmitted at constant bitrate. However, MM applications typically employ variable bitrate transmission. One way to address this is to simply have MAPE use the flow’s average bitrate, which can be determined during transmission. Another approach to handle dynamic traffic patterns is to provide MAPE with updated data rate information whenever significant transmission rate changes are detected in the video coding process. In this work, we use the average bitrate of each video trace as input to MAPE. As part of future work, we plan to add support to variable bit rate flows.
4. Evaluation methodology
We evaluated MAPE against two types of discrete-event simulators—stochastic (ns-3) and deterministic (AFTER). We chose ns-3 because it is widely used by the network researchers and practitioners since it provides an adequate model of the network, and thus provides reliable estimates of network performance. We use AFTER as the example of a deterministic simulator and demonstrate that MAPE can achieve better accuracy by being able to model SPRs, i.e., it simulates each flow transmitting at specified MM bitrates. In this section, we describe the experimental methodology we use to evaluate MAPE, including the topologies and traffic models considered, as well as how the experiments were carried out.
4.1. Experimental topologies
We evaluate MAPE using two different IoT wireless network topologies akin of IoT scenarios and whose parameters are summarized in Table 1. The Random Indoor topology aims to replicate smart building scenarios and was generated by placing nodes randomly within an indoor environment. The Grid Outdoor topology tries to mirror smart city scenarios consisting of grids of neighborhood blocks and streets in an urban region. More specifically, we reproduced an area of the city of Niterói in the state of Rio de Janeiro, Brazil, using an
Simulation scenarios.
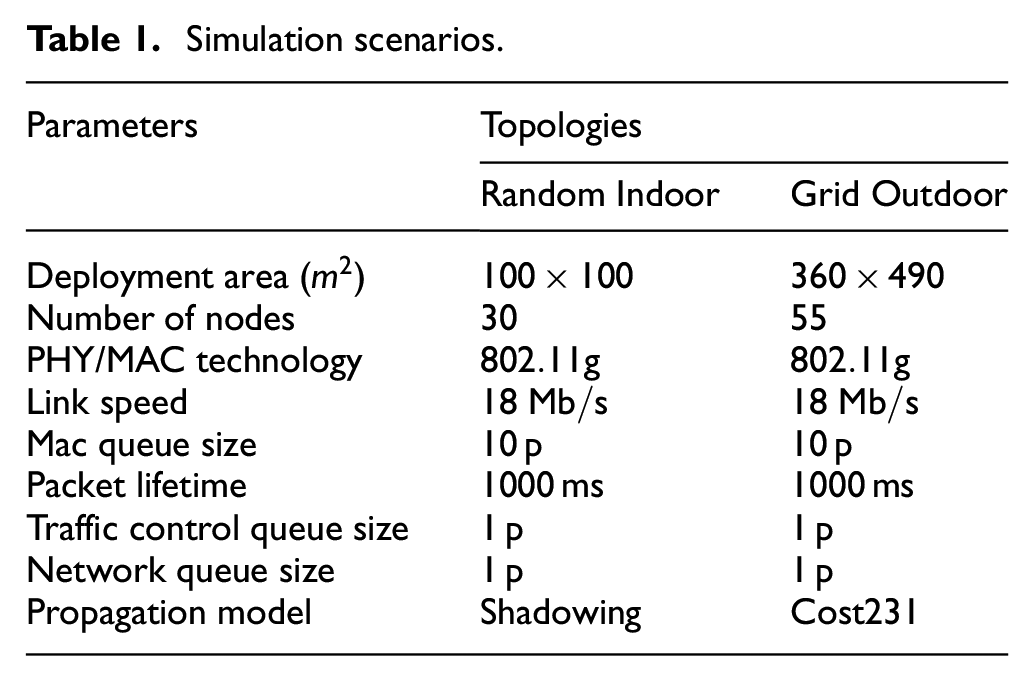
For a fair performance comparison, we use the same link speeds, queue sizes, and packet lifetime policy in ns-3, AFTER, and MAPE. The Shadowing and Cost231 propagation models 25 were chosen to more realistically reproduce indoor and urban environments. All simulations use the same MAC and PHY technology and the same link speed, which was chosen to support MM application scenarios.
In order to estimate link quality (an information that is required by MAPE), a series of preliminary simulations were performed using the ns-3 simulator. For all nodes in each topology, we executed a simulation transmitting
4.2. Traffic models
In addition to link quality, MAPE requires per-flow transmission rate information. In our experiments, we use a mix of three different rates (as shown in Table 2) to represent different levels of video quality. The EvalVid framework 26 was used to generate traces of the same video clip with these three rates, and the resulting average bitrate of each video trace was used as input to MAPE. Additional traffic generation parameters and their values used in our simulation experiments are listed in Table 2.
MM and CBR traffic parameters.
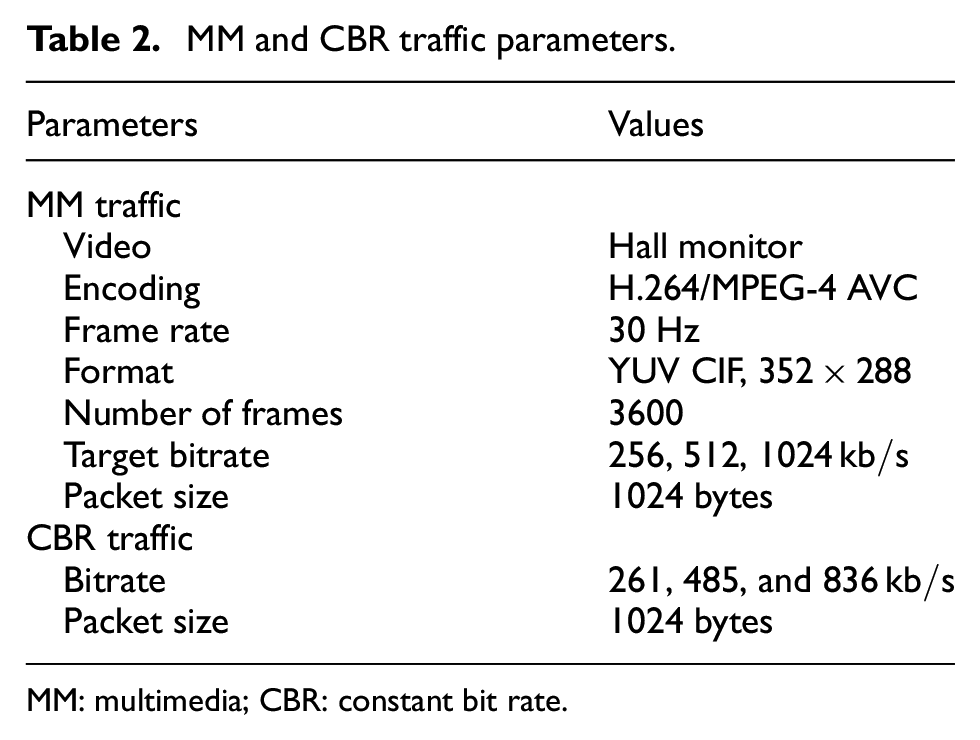
MM: multimedia; CBR: constant bit rate.
Experiments which used MM traffic employ a publicly available and commonly used video clip, namely, “Hall Monitor,”
3
which was converted to H.264 format with a rate of 30 frames per second. Considering real-time transmission delay and human tolerance, the play-out buffer is set to
In video traffic, transmission rates may vary according to the coding technique used. For example, more important video frames (e.g., MPEG I-frames) are often transmitted at higher rates than the target compression bitrate, while less important frames (e.g., MPEG P-frames and B-frames) are transmitted at lower rates. In our experiments, MM traffic target bitrates used by MAPE are based on long-term average bitrates calculated at the video source encoder. Because MAPE currently models variable bit rate flows using their long-term average rates, we also ran experiments with constant bit rate (CBR) traffic in our ns-3 simulations in order to assess how short-term fluctuations of the video traffic bitrate affect MAPE’s estimates. In those experiments, we adopt the same bitrates used as input for AFTER and MAPE as listed in Table 2. As part of our future work (see section 8), we will modify MAPE’s current variable bit rate traffic model to be able to account for shorter-term transmission rate variations.
4.3. Experiments
Simulation experiments were conducted as follows. For each topology, we computed the five best paths (based on the quality of their links) for 500 source–destination pairs generated randomly. Selecting one path for each pair, out of their five best, we generated random instances for scenarios with 3, 6, 9, and 12 pairs (or flows), which are used to transmit concurrent video flows with three different levels of quality—a third of the flows use each of the three transmission rates listed in Table 2. For instance, in a scenario with six flows, we have two sources transmitting at
Finally, all scenarios were also executed in the ns-3 simulator for both the CBR and MM traffic models using a simulation time of
4.4. Evaluation metrics
We evaluate MAPE’s performance according to execution time and prediction accuracy. Since ns-3 is a well-known, open-source packet-level simulation platform widely used by the networking research and practitioner community, we use its throughput, packet loss, and end-to-end delay statistics as the ground truth in our performance study. Throughput is calculated as the ratio between the number of packets delivered to the destination and simulation time. End-to-end delay is the time interval between when a packet is transmitted by the source node and when that packet is delivered at the destination, averaged over all packets received, and packet loss is calculated as the percentage of packets transmitted that were not delivered to the destination.
We expect MAPE to achieve predictions close to those of ns-3, but in a reproducible manner and at a fraction of the required execution time. We also use the Structural Similarity Index Measure (SSIM) 27 and another metric called classification inversions—as defined in Passos and Albuquerque, 23 and further explained in section 6.2—to evaluate video quality and demonstrate the practical suitability of MAPE to the problem of route selection for MM applications.
5. MAPE’s accuracy evaluation
Our experimental evaluation aims at demonstrating MAPE’s ability to accurately estimate per-flow throughput, delay, and packet loss in a timely manner when compared to estimates provided by existing stochastic and deterministic simulators. To this end, we compare MAPE against ns-38 and AFTER 23 by considering the trade-off between execution time and throughput, delay, and packet loss estimate accuracy.
5.1. Execution time
We measure average execution time for AFTER, MAPE, and ns-3 for each scenario considering the
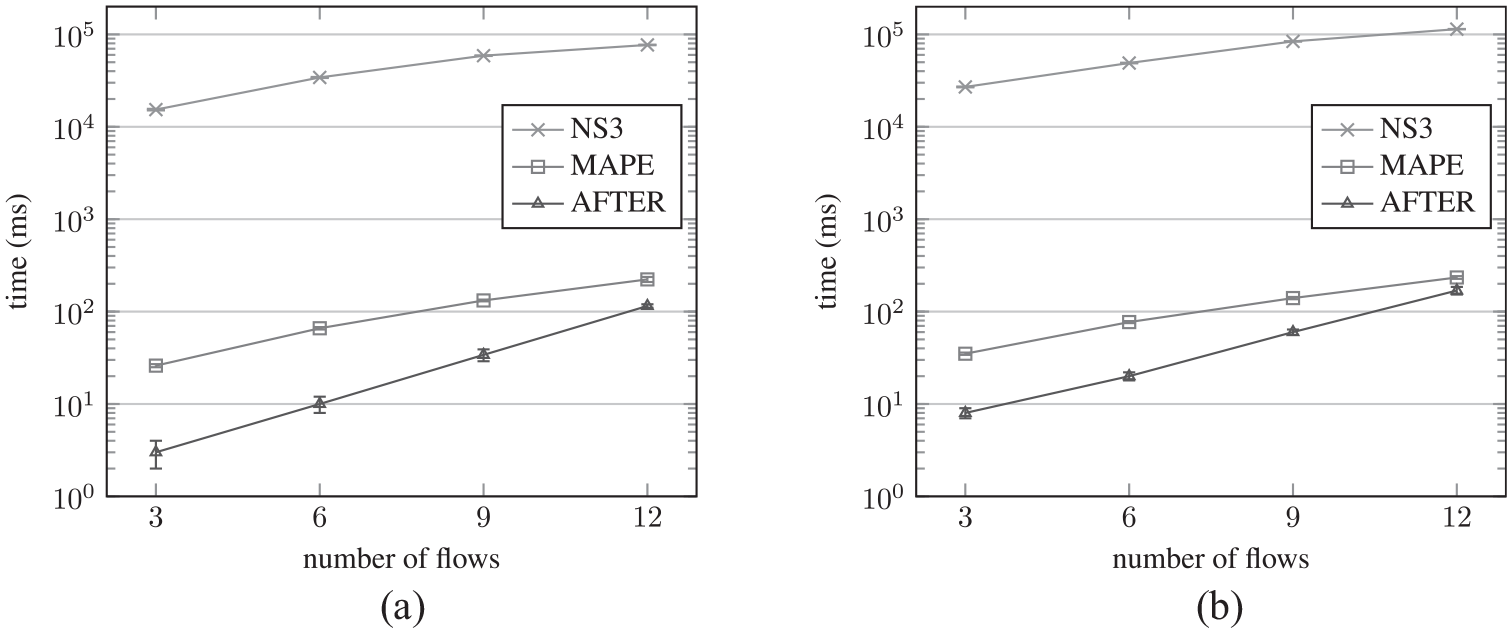
Execution time (log scale) for different number of flows (a) Random Indoor topology and (b) Grid Outdoor topology.
Note that execution times for ns-3 vary from tens to hundreds of seconds for the scenarios considered. While we observe a slight increase in MAPE’s time complexity when compared to AFTER’s for scenarios with only a few flows, that difference becomes negligible when the number of flows increases. In any case, MAPE is able to compute per-flow network performance estimates in real-time which can be used to inform core network services such as routing. MAPE and AFTER are fast because, unlike stochastic simulators, they do not need to simulate nearly as many events to reach steady state.
As expected, execution times increase with the number of flows. However, AFTER and MAPE’s execution times increase more significantly with the number of path hops because that increases the number of transmission and reception events needed to deliver the flows’v_packets to the destination node. This explains the slightly higher times measured with the Grid Outdoor topology, which typically requires paths with more hops because of the greater distances between nodes.
5.2. Estimated throughput
We measure throughput estimate accuracy as the ratio between the per-flow estimate returned by AFTER or MAPE and the per-flow throughput obtained by ns-3. Differently from other common ways to measure accuracy, such as the mean squared error, the way we evaluate accuracy conveys whether the estimate is an underestimate or overestimate of the reference value, which is the value reported by ns-3. Figures 3 and 4 show MAPE’s and AFTER’s throughput estimate accuracy for CBR and MM traffic in both the Random Indoor and the Grid Outdoor topologies, respectively. The red line represents the “ideal” ratio of 1, i.e., a perfect match between the estimates and ns-3’s measured throughput.
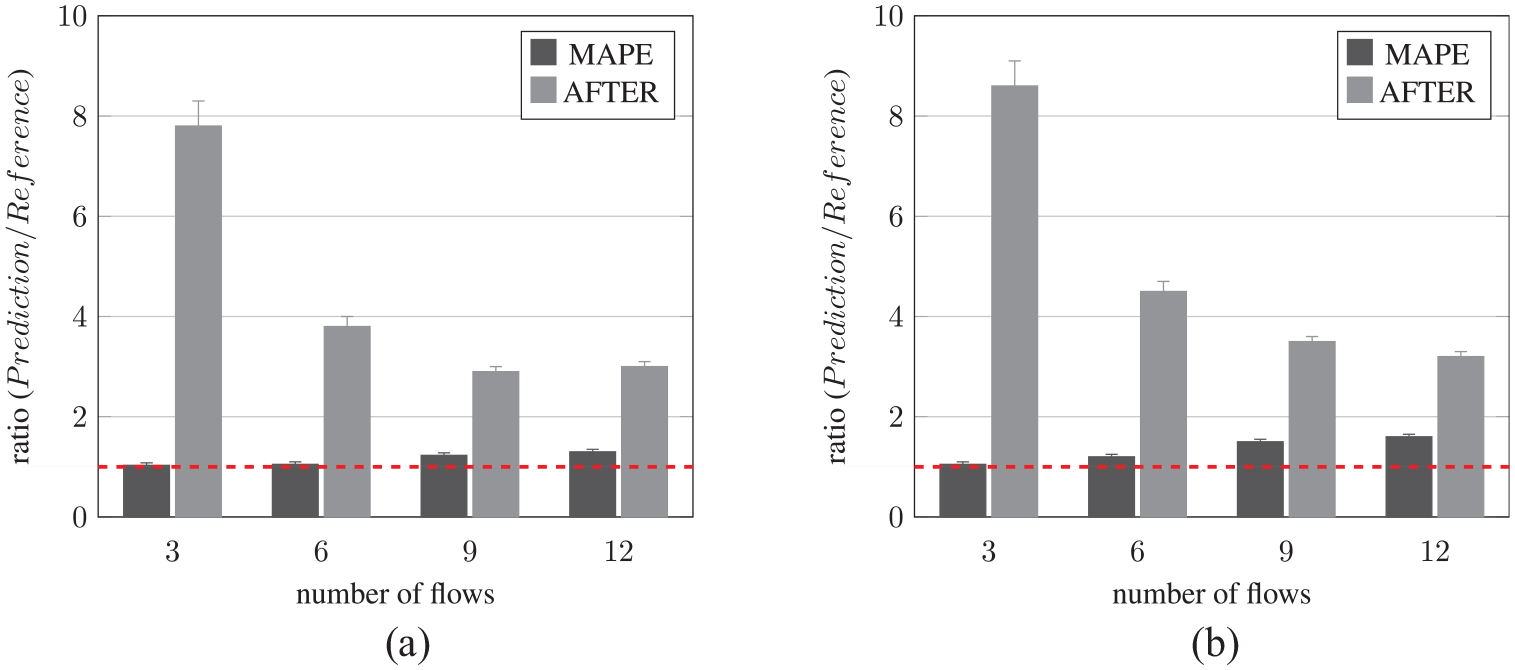
Estimated throughput accuracy relative to ns-3 in the Indoor Random topology (a) CBR traffic and (b) MM traffic.
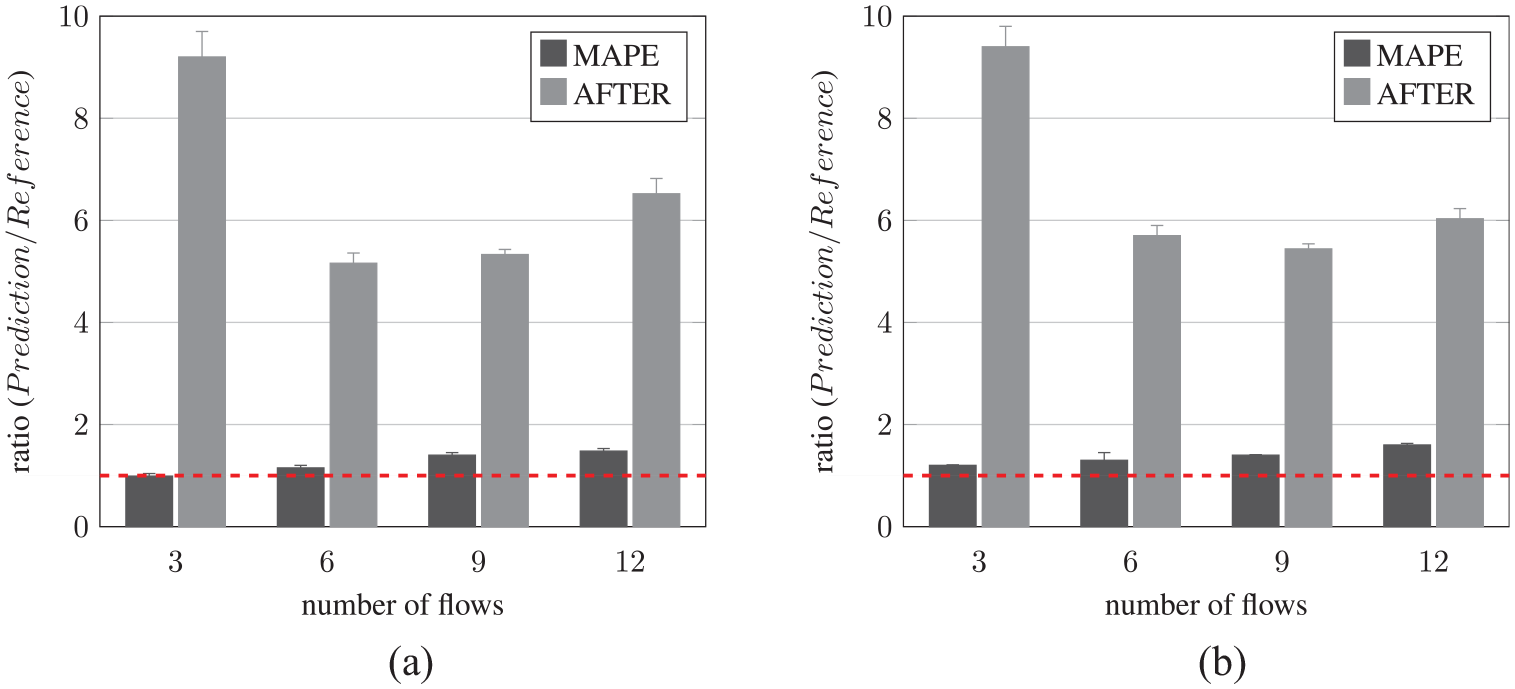
Estimated throughput accuracy relative to ns-3 in the Outdoor Grid topology (a) CBR traffic and (b) MM traffic.
We observe that AFTER’s throughput estimates are significantly less accurate when compared to MAPE because AFTER’s simulated flows attempt to transmit at the highest supported rate, typically resulting in overestimates. This is particularly pronounced for scenarios with few flows in which there is low inter-flow interference and, consequently, more residual network capacity to support higher transmission rates. As more flows are added, AFTER’s prediction improves because, with more flows sharing the network’s capacity, there is less room for each flow’s transmission rate to increase beyond the real transmission rate.
This prediction discrepancy between AFTER and MAPE also quantitatively demonstrates the impact that not accounting for specific flow transmission rates may have. It also illustrates that MAPE is able to significantly improve prediction accuracy for scenarios with few flows (in our experiments, three- and six-flow scenarios). MAPE’s accuracy decreases in scenarios with more flows—with a bias toward overestimates due to some simplifications inherited from AFTER. For instance, AFTER does not take into account packet losses due to collision, which may influence network throughput when there are more flows transmitting simultaneously. Instead, in its inter-flow interference model, AFTER implements a medium access scheduler based on an interference graph of the topology. In future work, we plan to address this issue by improving how flow interference is modeled.
Note that MAPE yields higher accuracy for CBR traffic (Figures 3(a) and 4(a)). That is because its scheduler also generates v_packets at constant rates. For MM traffic scenarios (Figures 3(b) and 4(b)), however, transmission rate variations cause MAPE to overestimate the throughput. This is because bursts of the more important video packets cause losses due to buffer overflow and packet collisions, while less important video packets which have lower transmission rates are delivered more reliably.
We also evaluate the per-flow throughput prediction accuracy considering the different classes of flows based on their transmission rates. Figure 5 summarizes the results for six flows using CBR and MM traffic in both the indoor and outdoor topologies. We also ran these experiments for 3, 9, and 12 flows, but we omit those results since they show similar trends. The red reference lines represent the ideal throughput based on the average bitrate generated for each video trace.
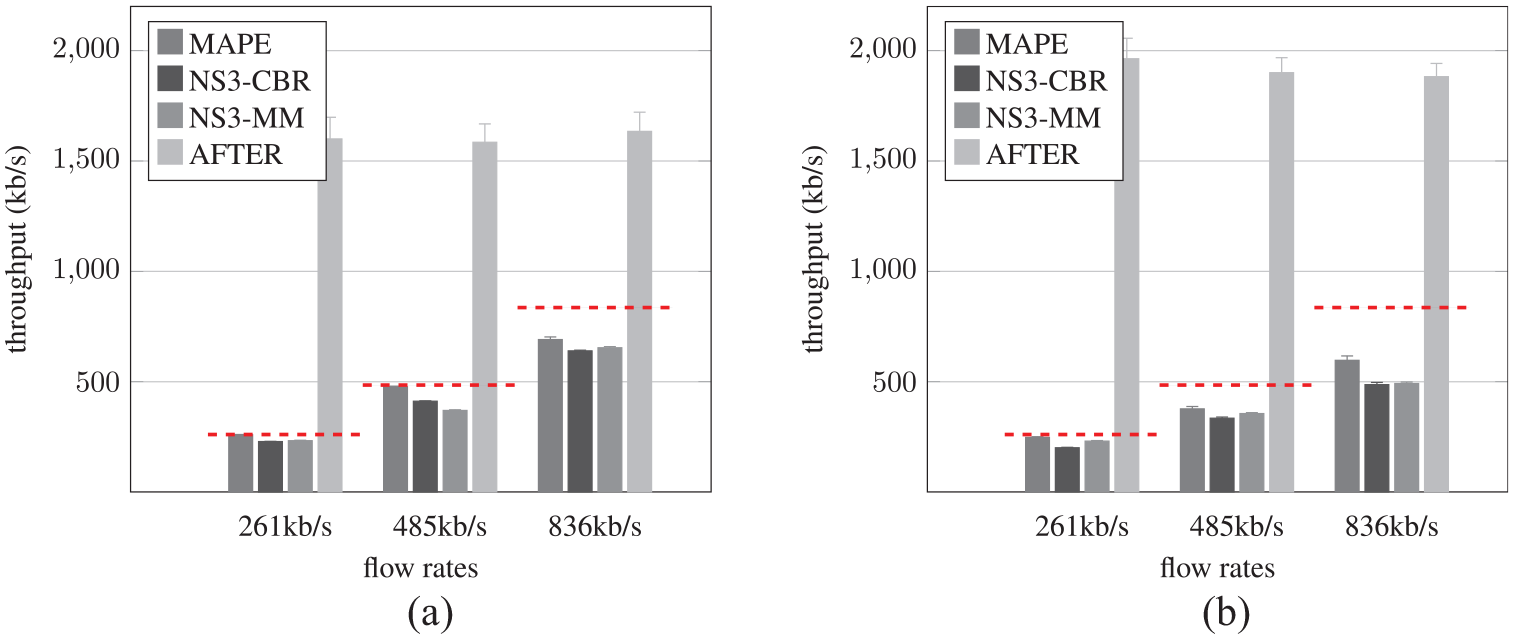
Average throughput for scenarios with six flows (a) Random Indoor topology and (b) Grid Outdoor topology.
The figure shows that AFTER tends to overestimate all three classes of flows. Moreover, as the source–destination pair is chosen randomly regardless of the transmission rate of the flow, the average throughput estimated by AFTER tends to be roughly the same for all three classes. Conversely, by knowing the transmission rate of each flow, MAPE is able to more accurately estimate per-flow throughput. Note, however, that it slightly overestimates MM’s throughput. This issue, which is more pronounced in the outdoor topology due to its higher link reliability, is due to the fact that MAPE’s current implementation uses AFTER, and thus, it inherits the mechanism used by AFTER to estimate packet loss. It considers two possible sources of packet loss: buffer overflow and link-layer transmission losses. If all links that compose a path have perfect delivery rates, losses computed by AFTER are only due to buffer overflow. In practice, however, there are other sources of losses, such as collisions, and as a result, MAPE and AFTER tend to overestimate flows’ throughputs.
5.3. Estimated delay and packet loss
We also evaluate MAPE’s delay and packet loss estimates. Figure 6 shows the average end-to-end delay, considering the
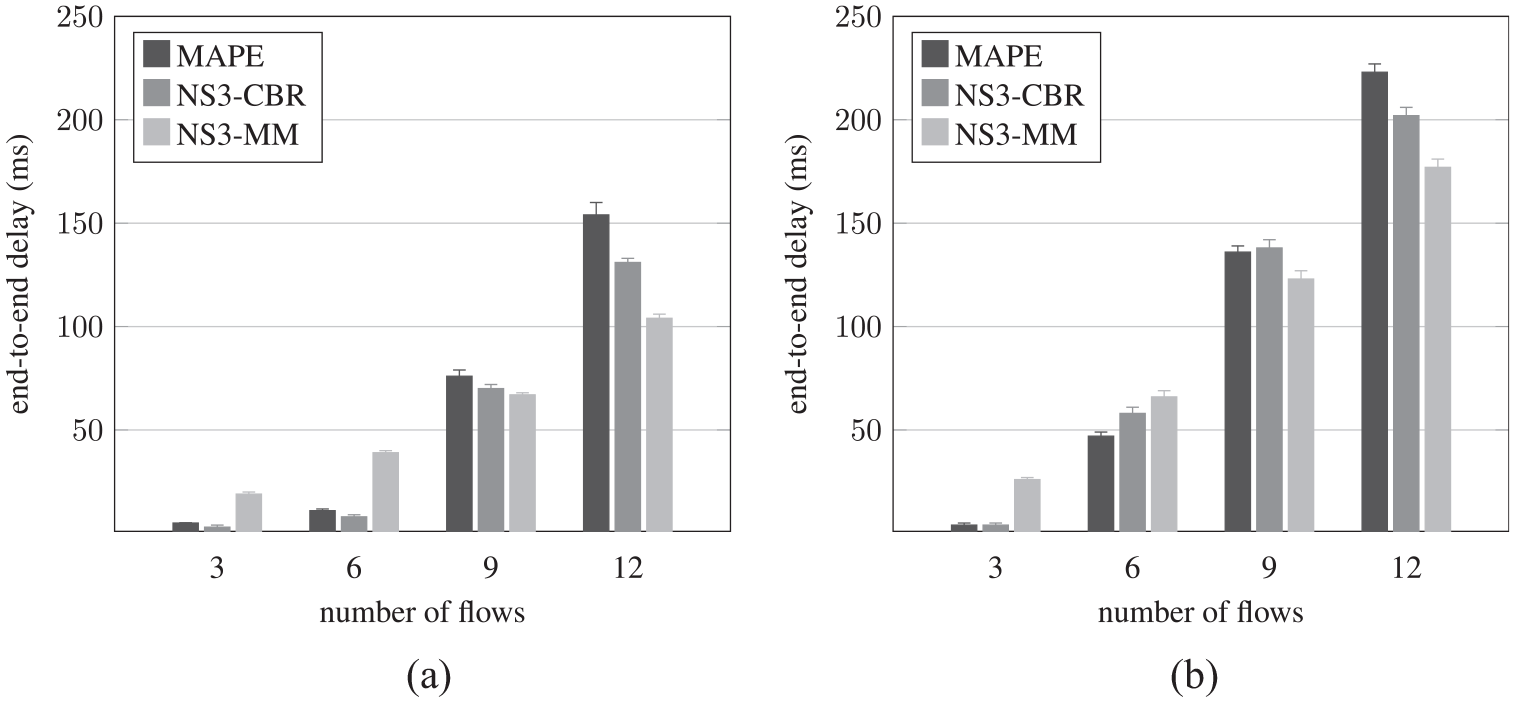
Average end-to-end delay for different number of flows (a) Random Indoor topology and (b) Grid Outdoor topology.
Figure 7 plots the average packet loss rate. It also shows a discrepancy between MAPE’s and ns-3’s estimates in both topologies. But here, instead of overestimating, losses are generally underestimated by MAPE. The culprit is the absence of a collision packet loss counter in MAPE, which causes it to be more prone to estimate lower overall loss rates. These results also help explain the reason for instances in which MAPE overestimates the throughput—a consequence of fewer packets being discarded at the MAC layer. Furthermore, as expected, packet losses for MM traffic were even more impacted by the bursty nature of the video packet flows. As part of our future work, we plan to improve how MAPE models packet losses due to collision.
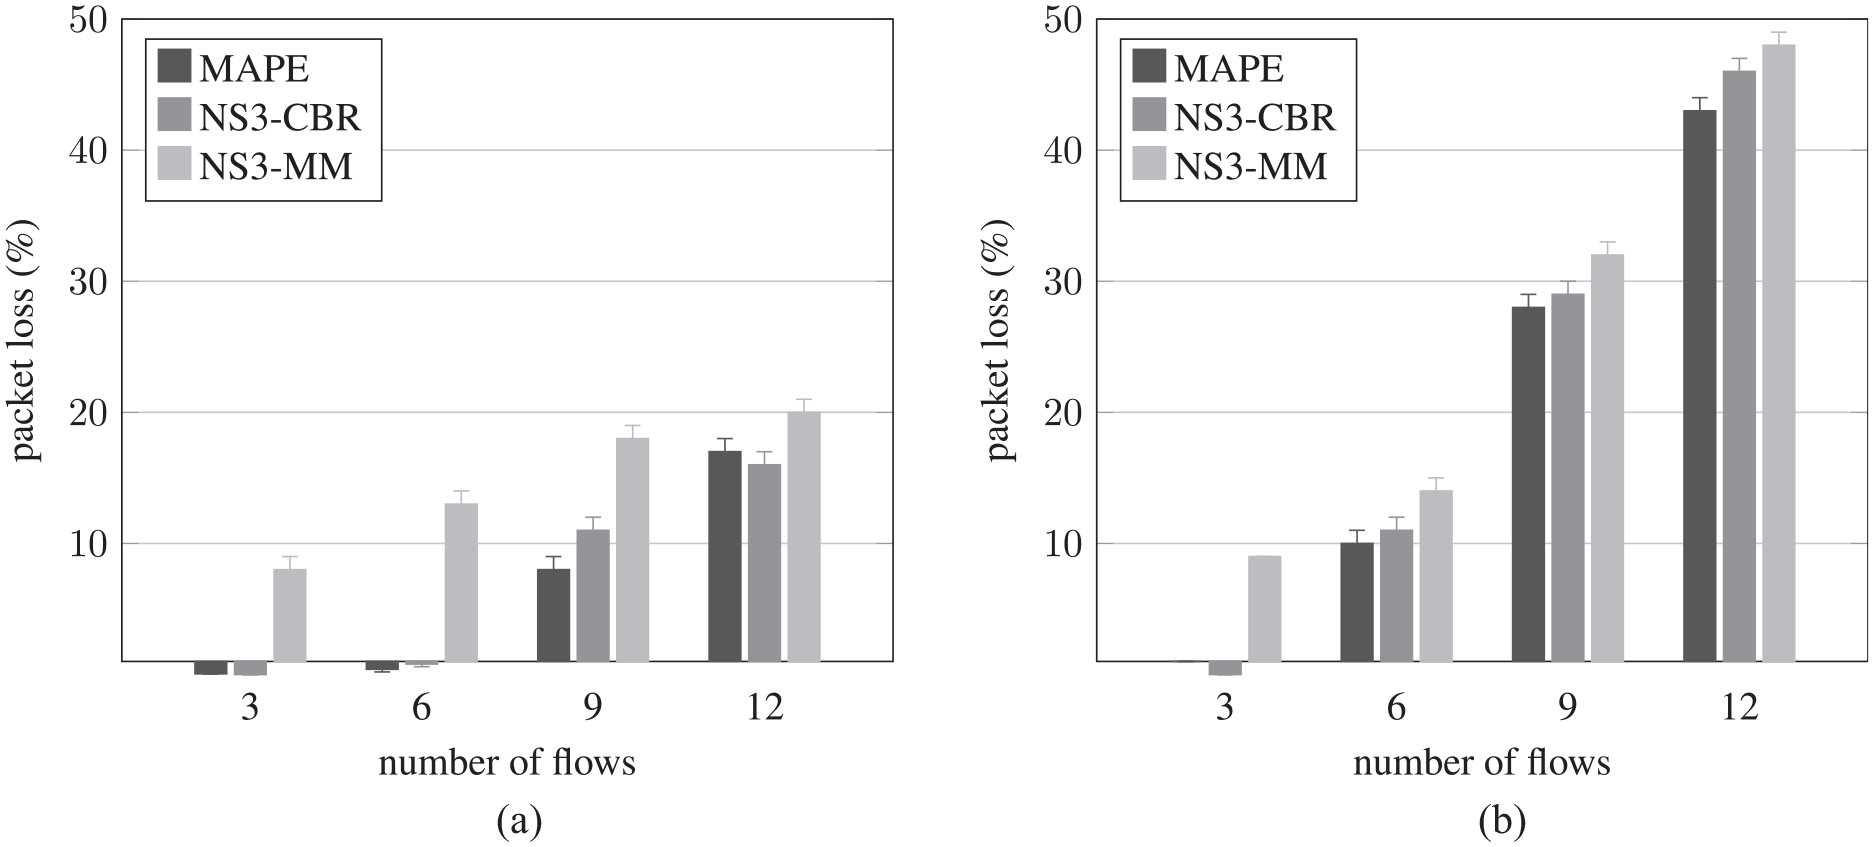
Average packet loss for different number of flows (a) Random Indoor topology and (b) Grid Outdoor topology.
Despite those discrepancies, the results shown in Figures 5–7 demonstrate MAPE’s ability to capture the overall trend in throughput, delay, and packet loss for MM flows in different application scenarios. Furthermore, we note that the discrepancies for 9 and 12 flows are mostly caused by network congestion and MAPE estimates being generated before steady state are achieved.
In order to confirm this hypothesis, in Figure 8 we show a scatter plot for the 9-flow runs using the Random Indoor topology representing which instances did and did not reach the steady state and their respective delays discrepancies when comparing MAPE to ns-3—i.e., the difference between MAPE’s and ns-3’s average delay estimates. Note that we show results for the 9-flow Random Indoor topology experiments because, with 9 flows (and above), the network gets more congested and consequently the number of instances that do not reach steady state increases, which, as previously discussed, results in higher delay and packet loss discrepancies.
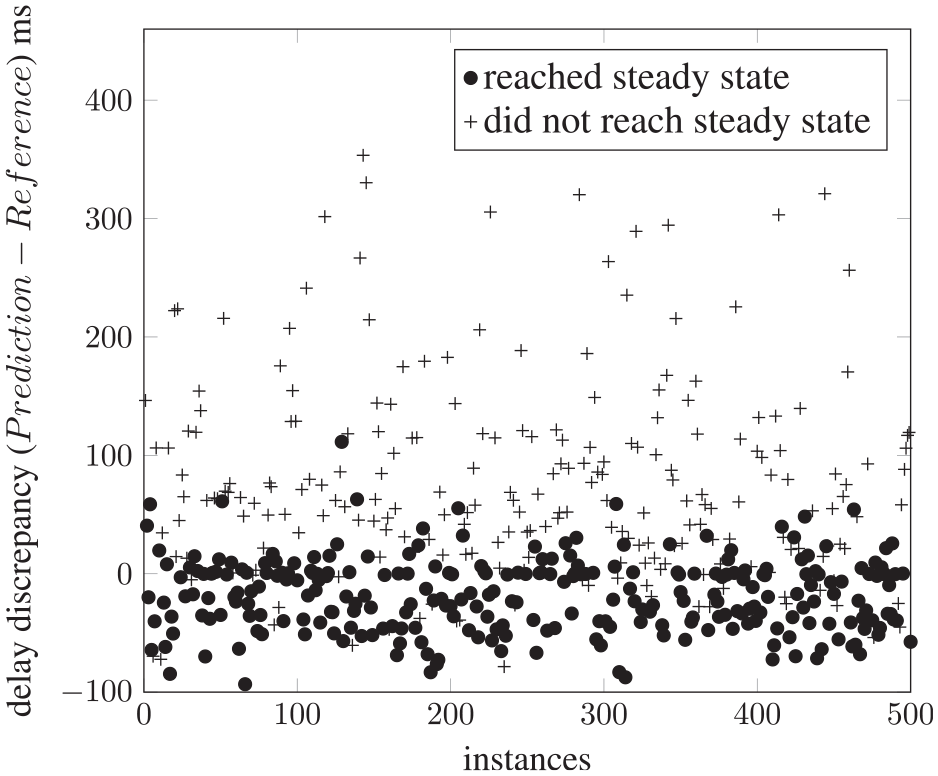
Difference between MAPE’s and ns-3’s average delay predictions considering MAPE’s steady and non-steady instances for scenarios with 9 flows in the Random Indoor topology.
As the plot shows, when steady state is reached, MAPE yields adequate estimation accuracy, with discrepancies concentrating around less than
Figure 9 confirms this observation—it shows a scatter plot of the path average throughput according to ns-3 for instances that reached the steady state and those that did not as a function of the delay estimate discrepancies for the
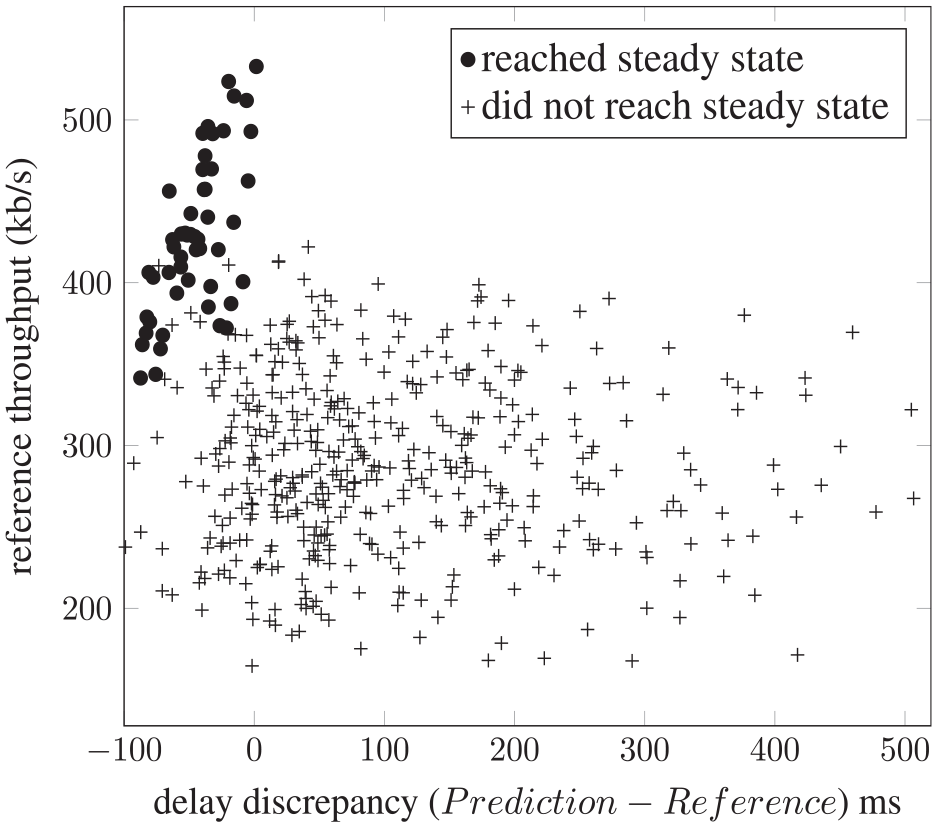
Path average throughput (according to ns-3) as a function of the difference between MAPE’s and ns-3’s average delay predictions for scenarios with 12 flows in the Random Indoor topology.
As a tool to guide real-time route selection decisions for IoT MM applications, low throughput routes—likely because of congestion—are generally undesirable, as they are often unable to meet the requirements of MM flows. As such, overestimating delay for those paths should not negatively impact path selection. That is, MAPE’s delay overestimates when compared to ns-3’s correspond to paths that are undesirable for video traffic anyway, and therefore should not be selected by routing.
6. Video quality evaluation
The ability to estimate network performance is essential to ensure adequate network support for many IoT MM applications. In the case of applications involving video transmission, for instance, timely and fresh estimates of the current state of the network can significantly help routing protocols to rapidly identify paths that satisfy QoS constraints, as well as promote load balancing and network resource utilization. To examine how MAPE’s performance estimates can be used to improve overall video quality, we use a well-known QoE metric called SSIM 27 measured by the EvalVid video transmission and quality evaluation framework. 26 In our experiments, we used an EvalVid module available for the ns-3 simulator which evaluates the quality of the video transmitted through the selected paths. This is another reason we employed ns-3 as the baseline simulator for our performance study. In the second part of this section, we evaluate the quality of the video transmitted using the route selected based on MAPE’s estimates.
6.1. Video structural similarity
The SSIM measures video structural distortion which is known to correlate with video quality as perceived by the end user. 27 This metric combines luminance, contrast, and structural similarity of the frames to compute the correlation between the original frame and the (possibly distorted) displayed one. SSIM values vary between 0 and 1, with higher values meaning better quality.
To show how MAPE estimates can be used to improve video quality, we run experiments transmitting the “Hall Monitor” video clip (as described in section 4.2) and compute the SSIM by comparing all transmitted and received video frames.
Figure 10 plots the average SSIM of the instances for different numbers of flows in the Random Indoor topology. According to the delay discrepancy ranges observed in Figure 8, we group experimental run instances in two classes, where the first class exhibits delay discrepancies greater than
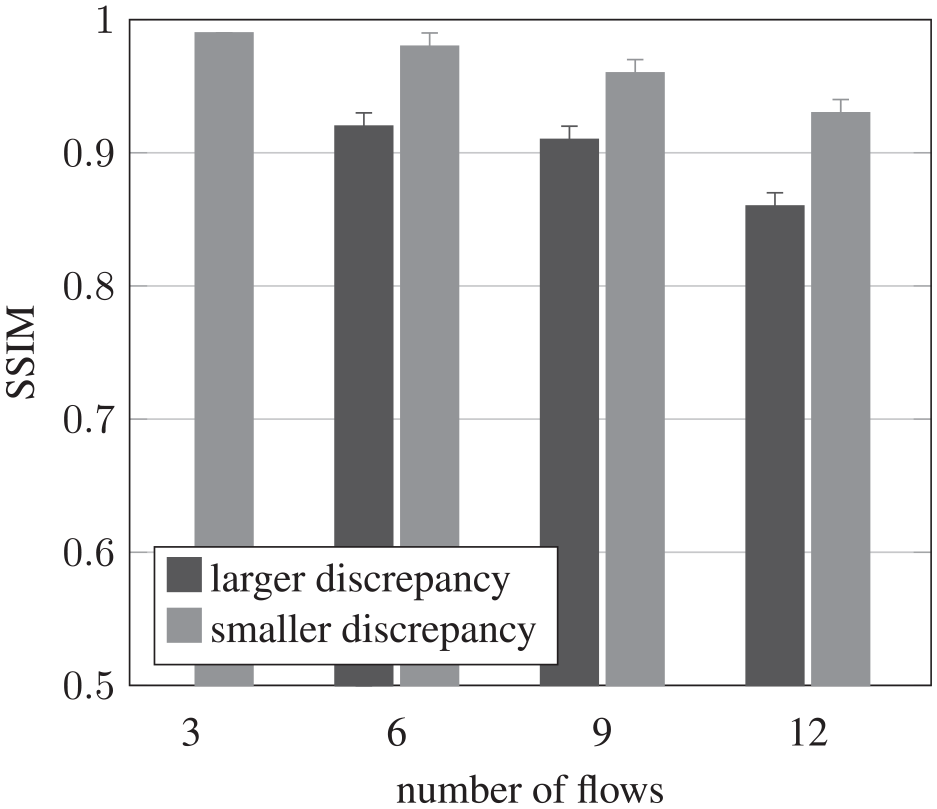
Average SSIM according to the instances with larger and smaller delay discrepancies for scenarios with different number of flows in Random Indoor topology.
6.2. Classification inversions
To evaluate how MAPE can be used to inform path selection for video transmission, we use the concept of classification inversions
23
defined as follows. Consider two different paths
To better understand how classification inversions can be used in practice, let us consider the route selection problem in multipath forwarding, where a set of paths needs to be selected for the transmission of multiple flows based on low transmission rate. In this example, the most important aspect is to get the relative ranking of the paths correctly in order to make adequate flow-to-path assignments.
Figure 11 shows a comparison between MAPE and AFTER in terms of classification inversions for both the Random Indoor and the Grid Outdoor topologies as a function of the number of flows. We evaluate the quality of paths using SSIM metric. For MAPE, we consider three possible scenarios: using the average throughput, packet loss, or end-to-end delay as metrics to compare the set of paths of all instances. Since AFTER does not estimate delay or packet loss, we only show results when throughput is used to calculate classification inversions based on AFTER estimates. MAPE results in lower percentages of classification inversions (lower than
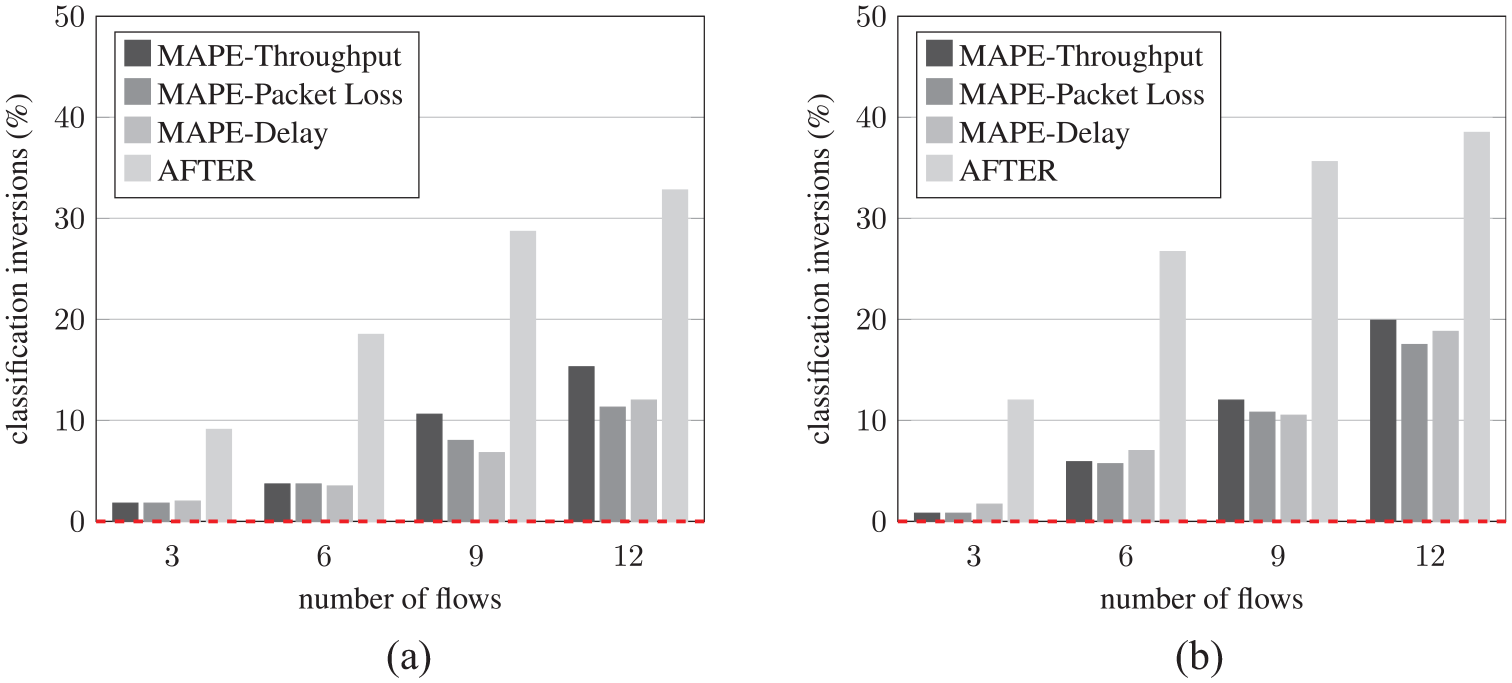
Percentage of classification inversions in terms of SSIM for different numbers of flows (a) Random Indoor topology and (b) Grid Outdoor topology.
Note that MAPE’s packet loss and delay estimates result in lower classification inversions for 9 and 12 flows when compared to classification inversions based on throughput. This demonstrates that both delay and loss should be considered when selecting paths for video transmission, especially when the network becomes saturated. These results are relevant because they confirm that MAPE’s estimates, which can be computed in quasi real-time, can be used to select paths that improve user QoE in terms of perceived video quality.
7. Route selection for IoT MM applications
In this section, we discuss how MAPE can be deployed to inform route selection in IoT MM applications. Our experiments use surveillance system scenarios in smart cities where multiple sources transmit multiple video flows simultaneously to a single monitoring center (sink) as illustrated in Figure 12. In these scenarios, each source may generate video flows with different bitrates according to the video resolution and encoder used. These flows are transmitted from each source node through selected paths. At the destination, i.e., the monitoring center, the video decoder is responsible for synchronizing and merging the flows received and for rendering the resulting video. Depending on the application scenario, the system can also handle multiple sinks by specifying the sink for each source.
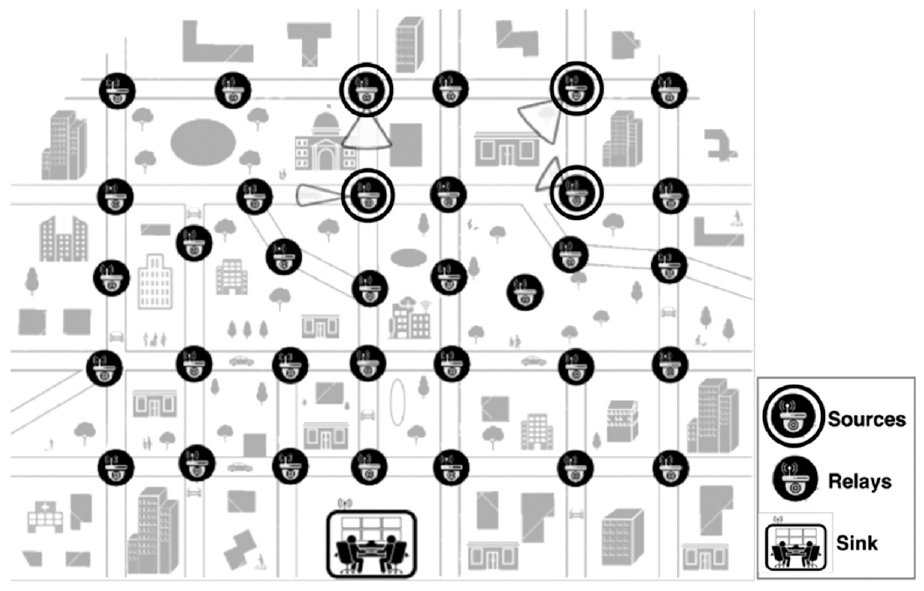
Example of a wireless video surveillance system with multiple video sources transmitting to a monitoring center.
Since video sources may generate flows with different bitrates, route decisions must account for the flow’s bitrate to balance network load and reduce packet losses and delays. Therefore, MAPE can be used to assist routing decisions by estimating path costs based on current network topology knowledge and the flows’ bitrates. For instance, in deployments that use centralized network control (the software-defined networking (SDN)), the controller evaluates a set of paths over which video flows can be transmitted and then selects appropriate routes based on MAPE’s estimates. The controller then updates the nodes’ routing tables so that flows are forwarded according to the selected paths. As discussed in section 3.3, when network control is decentralized, source nodes can execute MAPE to make informed routing decisions based on network topology information obtained and disseminated by a proactive link-state algorithm (e.g., OLSR 24 ). In this case, flows could be forwarded along selected paths using a source routing technique in which the source includes complete path information in the packet header.
Regardless of whether a centralized or distributed routing solution is used, paths must be found in a timely manner since the time required for this task contributes to the overall video acquisition delay. As shown in Figure 2, while execution times for MAPE and AFTER are in the order of tens of milliseconds, ns-3 takes tens of seconds to execute, i.e., two orders of magnitude higher execution time.
In order to showcase MAPE’s ability to account for flows with different bitrates, we compare video transmission quality when route selection is based on MAPE’s and AFTER’s estimates. For that, we evaluated 30 random outdoor grid topologies with 60 nodes mirroring the scenario illustrated Figure 12. In these experiments, we consider four sources transmitting two video flows each to a sink node. For each video flow, a path was selected among 100 candidate paths. For each source, we generate offered loads between 1 and 8 Mb/s—where offered load is defined as the sum of the bitrates of all flows transmitted simultaneously (Note that most current encoders have variable bit rates due to compression. Hence, for this experiment, we considered the average bitrate requested as the target when generating the video traffic.).
Figure 13 shows the SSIM (mean and 95% confidence intervals) for different offered loads when MAPE and AFTER estimates are used to select routes. As expected, video quality decreases with increased offered load, since flows with higher bitrates result in higher contention and consequently more collisions and longer queuing delays. However, our results show that route decisions based on MAPE outperform those by AFTER for all offered loads. Moreover, the performance gap grows for scenarios with higher offered loads. This can be explained by the fact that since MAPE’s network performance estimation strategy accounts for flows with different bitrates, MAPE is able to select paths that are able to accommodate the flows’ different resource requirements and make better use of the network’s available resources. This result is also consistent with our previous observation that MAPE is able to deliver adequate real-time performance estimation under challenging network conditions and more stringent application requirements.
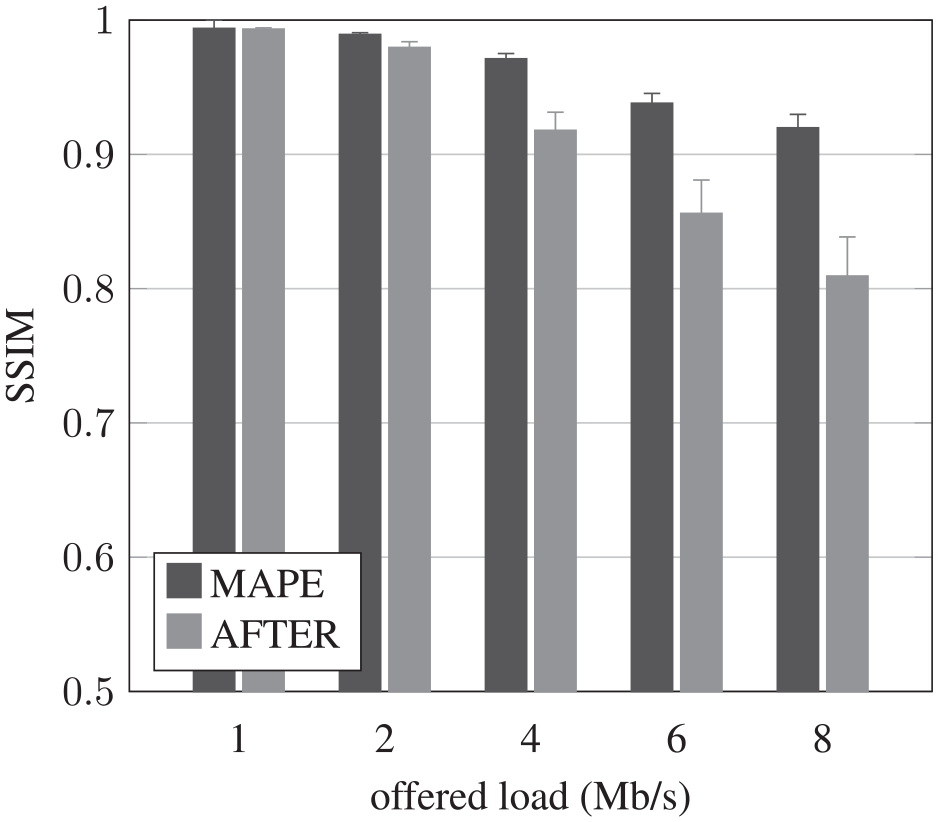
SSIM for different offered loads when path selection is informed by MAPE and AFTER estimates.
8. Conclusion
This paper introduced the MAPE, a per-flow estimator based on a deterministic discrete-event simulation approach. MAPE estimates the throughput, packet loss, and end-to-end delay of individual flows using their average transmission rate as input. To the best of our knowledge, MAPE is the first performance estimator that is able to both account for inter-flow interference and accommodate rate-heterogeneous flows, which is essential to more realistically model the behavior of MM traffic.
We evaluated MAPE in terms of execution time, prediction accuracy, and ability to classify sets of paths according to the video quality at the receiver. Our results indicate that MAPE yields comparable throughput, packet loss, and delay estimate accuracy when compared to stochastic network simulators such as ns-3 at a fraction of the execution time. When compared to AFTER, through its ability to consider SPRs, MAPE yields higher accuracy at comparable execution times. We also show in practice that by adopting video coding rates as input, MAPE is able to obtain estimates similar to the ones obtained by ns-3 when driven by MM traffic.
In this work, we also demonstrated how MAPE’s real-time throughput and delay predictions can be used to make routing decisions for MM applications. In particular, our results showed that MAPE’s path selection decisions results in superior video quality for over 80% of the cases, including saturated network scenarios. Finally, our experiments using surveillance system scenarios showed that route decisions based on MAPE, which account for multiple sources generating flows with different bitrates, increase video quality for different offered loads.
As part of future work, we plan to refine MAPE’s packet loss and delay models which will help improve its estimation accuracy. While our current implementation uses IEEE 802.11, we also plan to extend MAPE so that it can also be used with other IoT communication technologies such as IEEE 802.15.4 networks. We also intend to further explore the correlation between routing metrics and video quality (e.g., based on the SSIM) and to incorporate into MAPE alternate ways to model variable bitrate streams, including traffic patterns representative of prominent adaptive bitrate streaming traffic, e.g., by simulating video frame packets bursts. Our overarching goal is to propose a cross-layer framework that integrates MAPE with video coding for improved QoE.
Footnotes
Funding
The author(s) disclosed receipt of the following financial support for the research, authorship, and/or publication of this article: This work was supported by the following Brazilian research agencies: FAPESP, FAPERJ, CAPES, and CNPq. This study was financed in part by the Coordenação de Aperfeiçoamento de Pessoal de Nível Superior—Brasil (CAPES)—Finance Code 001.