
Abstract
As technology advances, architects often employ innovative, non-standard shapes in their designs for the fast-growing number of high-rise buildings. Conversely, climate change is bringing about an increasing number of dangerous wind events causing damage to buildings and their surroundings. These factors further complicate the already difficult field of structural wind analysis. Current methods for calculating structural wind response, such as the Eurocode, do not provide methods for unconventional building shapes or, in the case of physical wind tunnel test and in-depth computational fluid dynamics (CFD) simulation, they are prohibitively expensive and time-consuming. Thus, wind load analysis is often relegated to late in the design process. This paper presents the development of a computational method to analyze the effect of wind on the structural behavior of a 3D building model and optimize the external geometry to reduce those effects at an early design phase. It combines CFD, finite-element analysis (FEA), and an optimization algorithm in the popular parametric design tool, Grasshopper. This allows it to be used in an early design stage for performance-based design exploration in complement to the more traditional late-stage methods outlined above. After developing the method and testing the timeliness and precision of the CFD, and FEA portions on case study buildings, the tool was able to output an optimal geometry as well as a database of improved geometric options with their corresponding performance for the wind loading.
Keywords
1. Introduction
Tall, slender towers are especially susceptible to wind forces. Their inherent flexibility can lead to significant movement in the building during normal use when the high winds near the upper part of the building impinge on its surface. This can be a source of discomfort for occupants and may even cause damage to certain building elements. This is particularly a problem for areas that are predisposed to strong winds, both regularly and at certain times of the year such in as hurricane-prone regions. Due to climate change, it can be expected that these effects will only worsen. For example, since the 1980s, the strength of North Atlantic hurricanes has been increasing. In the United States alone, hurricanes and tropical storms have caused more damage than any other large-scale natural disaster since 1980. 1 At the same time, the increasingly sophisticated design tools being used by architects and engineers are bringing about exciting new unconventional building shapes. Technologies such as parametric and generative design enable a vast new array of building geometries that were unrealizable years ago. These factors create a major challenge for the field of structural wind engineering. The main methods used in practice for calculating the structural effect of wind are building codes, for example, the Eurocode in Europe, wind tunnel testing, and to a lesser extent, in-depth computational fluid dynamics (CFD) simulations, but these methods in their current state have significant drawbacks.
The Eurocode, specifically EN 1991-1-4:2005, 2 only gives calculation methods for regular shapes such as rectangular or circular plan towers up to 200 m high. Applying these methods to non-standard geometry high-rise buildings produces results that would undoubtedly be inaccurate. Not to mention that the number of equations, tables, and charts required to perform these calculations makes the process tedious and error-prone. Physical scaled-model wind tunnel testing is the most accurate method for determining wind forces on a building model and can deal with any given shape. To obtain this accuracy, however, it requires a lot of effort from skilled technicians to first create the scaled model then properly set it up in the tunnel, use the wind tunnel, and post-process the data. This can take a lot of time and expense just for a single model. Thus, these analysis methods are usually only done at a late stage for verification purposes. To mitigate this issue, three techniques, namely CFD, finite-element analysis (FEA), and optimization, were looked at for this research due to their potential for dealing with such novel building designs. CFD is a technique that allows a user to simulate wind flow around a model and the effects on the building body such as pressure and drag forces regardless of shape. 3 While not so commonly used in professional practice for structural wind engineering, it has been widely studied for many years.4–8 These simulations, however, can take a lot of time and computational power to complete especially when very detailed meshes and complicated settings are used to be as accurate as possible. CFD requires careful setup of the simulation to ensure accuracy, and most architects and engineers may not be familiar enough with the principles of CFD to do that. However, its ability to analyze almost any building shape digitally gives great potential for its use in building design. FEA software analyses the structural response of buildings and is widely used in practice today. It can give very detailed results about the structural performance of a building under load. Different software packages offer various levels of detail and accuracy and, as a result, vary in complexity of use and time for set up and calculation. Most architects, and certainly engineers, are familiar with some sort of FEA package and the types of structural calculations they perform. Optimization algorithms allow a user to iteratively manipulate input variables until the resulting output value(s) of some algorithm or simulation reaches an optimum. It can arrive at a goal such as minimizing structural deflection or the building’s energy use automatically so that a user does not have to employ trial and error and educated guessing to conclude what is the best performing design. Based on the combination of these three techniques, a fluid–structure interaction–based optimization (FSIO) method was developed (Figure 1).

FSIO method flowchart.
This is a computational method that simulates wind flow and the resulting pressure on the external geometry of an input building model and translates it to a structural finite-element model (FEM) that is analyzed with FEA to obtain the resulting structural response. The combination of CFD and FEA creates a fluid–structure interaction (FSI) method. This is then combined with optimization where the algorithm iteratively manipulates parameters that define the external geometry of a building model that is then analyzed by the FSI algorithm and the output, in this case, the mass of the structure needed to resist deflection, is the objective that the optimization minimizes. Figure 1 shows the layout of this method. The main portions, that is, CFD, FEA, and optimization, are done using existing software. These are combined with custom programming to form a complete method. While CFD, FEA, and optimization can all be performed separately using a wide array of already available software, this research aimed to create a single package that is easy to use, robust, and efficient to encourage designers to take wind forces into account in early-stage design exploration. The testing of the method focuses not on absolute accuracy compared to physical wind tunnel tests but on obtaining rapid results with sufficient precision, meaning that it produces results that are expected for a given geometry type and does so consistently in each iteration. Thus, it can be used repeatedly and reliably in practice on three-dimensional (3D) building models in an early design exploration stage as a complement to the more detailed traditional methods mentioned.
2. Background
Fluid dynamics is the study of how a fluid, which is anything that flows to take the shape of its container, such as air, moves and the effects it has on objects in its flow and vice versa. The motion of fluids is governed by three principles: mass is conserved, Newton’s second lay (F = ma), and energy is conserved. These, in turn, form the basis of the three governing equations of fluid dynamics—the continuity, momentum, and energy equations. These principles are generalized as a series of partial differential equations known as the Navier–Stokes equations. 9
Bodies in airflow are characterized by how they cause the air to separate around them. In this respect, buildings are considered bluff bodies. These are bodies that cause a large separation of the airflow making the air highly turbulent or unstable as opposed to streamlined bodies such as airplane wings where the air flows smoothly around them. 10 This flow separation imparts three types of forces on a building: along-wind, acting in the direction of the airflow caused by the difference in positive pressure on the front and negative pressure on the back of the building, cross-wind, which acts perpendicular to the wind flow on the sides of the building, and torsional, which causes the building to twist due to non-uniform pressure on the face of the building. 11 This research focuses on the along-wind loads also called drag:

Equation (1): Wind force on a building according to EN 1991-1-4:2005.
The Eurocode (EN 1991-1-4:2005) calculates this wind force (Fw) using Equation 1 where cscd is the structural factor that accounts for the non-simultaneous action of peak wind pressures over the building face and the dynamic response of the structure due to turbulence, cf is the force coefficient which accounts for the building shape, qp(ze) is the peak velocity pressure at reference height ze, and Aref is the reference area on which the force is acting. This equation, however, requires the solution of at least 20 other equations and the reading of many values from tables and charts to solve it. Even worse is that these values and equations are given for a limited number of standard building types such as circular or rectangular cross-sections and buildings with hipped or flat roofs. It is also specified to be valid for buildings only up to 200 m in height.
CFD uses numerical methods to simulate fluid flow and its impact on a body in its flow using the Navier–Stokes equations. It subdivides a domain into a mesh of control volumes for which the solutions to the governing equations can be found. To enable this solution, the continuous non-linear partial differentials, have to be replaced with an algebraic expression that gives a solution at a specific point. This process is called discretization and is typically done in CFD using the finite difference method (FDM). 12 Computational wind engineering (CWE) is the specific branch of engineering that uses computational techniques such as CFD to analyze the effects of wind on a building.
CFD simulations usually employ turbulence models which are algorithms that can more efficiently account for the small random turbulent flows near a body than directly calculating them. The choice of turbulence model can have a large impact on accuracy and simulation time. The two most common types of turbulence model are large eddy simulation (LES), which give time-dependent results, and Reynolds-averaged Navier–Stokes (RANS), which give time-averaged results. Tamura et al. 7 recommends LES for CWE purposes due to its accuracy; however, this is a very computationally expensive procedure. Clannachan et al. 4 after testing various turbulence models on tall building models conclude that RANS is the most practical method for typical structural engineering due to its efficiency. While they conclude that CFD is not yet able to replace physical testing, it has great potential as a complementary tool in early-stage structural design to assess a broad array of design alternatives.
There has been a lot of research into CWE over the last three decades which is accelerated by the continued advancements in computer technology. 4 However, it is still not widely accepted by many building codes as a definitive method for structural wind analysis though there is some room for its use. For example, the Eurocode 2 allows for “properly validated numerical methods” as a supplement to its calculation procedure. Also, the Architectural Institute of Japan (AIJ) has published a guide that advises on using CFD for wind engineering. 7 There are some shortcomings in CWE techniques compared to traditional wind tunnel tests particularly in modeling the complex airflows induced by buildings with sufficient accuracy. 4 Nonetheless, the benefits of CWE over time-consuming and expensive physical tests continue to inspire more research in the field.
Optimization in a computational sense is the iterative manipulation of various input variables to minimize or maximize one or more resulting output values. Optimization is often used in performance-based design where buildings are designed not only based on aesthetics but on how they perform structurally, environmentally, and so on. 13 Most optimization algorithms used in building design are black-box optimization algorithms, meaning they only focus on the inputs and resulting outputs with no recognition of the in-between algorithms. 14 This allows it to be used with any number of simulations or calculations like CFD or FEA. The optimization follows a loop structure where some parameters such as the building’s height, width, position, and so on. are the inputs, the building is evaluated and a resulting output value known as the objective is given. This output value is read by the optimization algorithm, a new set of inputs values are chosen, and the cycle continues until an end condition has been met such as a goal value for the objective, a max number of iterations, or little or no change in objective value for the past however many iterations. How close the objective gets to its goal is its fitness. The new input values are chosen based on the type of optimization algorithm. Algorithms used for optimization include metaheuristics such as genetic algorithms which are widely applicable but require a lot of iterations to converge to an optimum, 15 direct search methods, such as Nelder–Mead method, which are efficient but not very robust, 16 and model-based algorithms like RBFOpt 17 that use machine learning methods to give robust performance with fewer evaluations making it ideal for heavy simulations such as CFD. 18
Optimization has seen extensive use and research in building design, particularly in the area of sustainability. Evins, 16 Waibel et al., 19 and Ekici et al. 20 all compare several optimization algorithms by optimizing building designs for factors such as daylight and energy use. Chronis et al. 21 used CFD in his optimization of the natural ventilation of atrium spaces. CFD-based optimization (CFD-O) for structural purposes, while applied extensively in aerospace, is rare in building design. 22 It is the process of changing the shape of a body in fluid flow to reduce the undesirable forces on and around it. Kormaníková et al. 23 parametrically designed a membrane structure to improve the wind flow on an urban site. This was done in manual iterations, not with an optimization algorithm, by adjusting the geometry in Grasshopper and then exporting to flow design for CFD simulation, which the authors acknowledge was a limitation to finding an optimum design. Integrating an optimization algorithm has great benefits over typical trial-and-error approaches for finding optimal shapes in structural wind design like physical scaled wind tunnel tests. However, optimization only compounds the computational expense of CFD. Bernardini et al. 24 conclude that CFD-O is only practical if a single CFD evaluation takes at most a few hours. In that study, surrogate model–based optimization was used along with two-dimensional (2D) CFD to find the optimum cross-section of a high-rise building that minimizes lift force and drag coefficient with minimal optimization evaluations. Chronis et al. 25 used fast fluid dynamics (FFD), a lower-order CFD method that is faster but much less accurate, combined with evolutionary optimization to optimize the shape of a free-form surface based on surface pressure. Wang et al. 26 devised a method to link geometry generation in Rhinoceros 3D to the CFD software ANSYS Fluent via the optimization software iSIGHT. While results were promising, it required linking three different software packages via imports and exports, and the complete optimization process took 6–10 days. Creating a method in a single software environment and tuning the CFD to minimize time while maintaining precision can reduce the time and complexity of CFD-O and make it more accessible for designers.
3. Research methodology
The research methodology is divided into four parts: development, CFD validation and sensitivity analysis, FSI validation, and optimization testing.
In developing the method, certain goals had to be met to ensure not only its accuracy and precision but also its usefulness, particularly in the early design phase. It should be able to fit into the workflow of an architect or engineer and not require a steep learning curve. Ideally, it should be present in one tool avoiding any complicated import or export of data from one software package to another. It should be able to produce results faster than wind tunnel testing and be more robust and adaptable than the Eurocode. Moreover, it should be fast enough that it can be used on multiple designs in succession so that the results can be compared or generate an array of performance-based design options itself. While absolute accuracy is of less concern, it ought to produce results within a certain limit compared to established methods. More important is the precision of the method especially in capturing the expected airflow and its effects on any given building geometry.
Since CFD, FEA, and optimization are fairly complicated, it was thought best to use existing software for these main parts and focus the development on combining them to create the method. To use and test the method, it had to be developed into a software tool. Grasshopper, the visual scripting plugin for Rhinoceros 3D was chosen as the platform for creating it. This is because it has existing plugins that can perform CFD, FEA, and optimization which can then be combined into one tool using custom scripting with native or add-in Grasshopper components as well as other coding languages. Also, Grasshopper is fairly easy to use and is already widely known and used by many architects and engineers for creating complex-geometry building models using parametric and generative design and doing analyses of their models. The method could then be easily integrated into their design workflow.
To test the method, various building models of non-standard shape were utilized. For the CFD validation, however, the Commonwealth Advisory Aeronautical Research Council (CAARC) Standard Tall Building Model was used. This is a rectangular building model created in 1969 for comparison of wind tunnel tests and has since been used in many studies including for CFD. 27 Thus, there are existing wind tunnel results to compare to for understanding the accuracy of the proposed method. This was used first to ensure that the CFD settings chosen were precise for a known case before extending to other models. To test the method’s effectiveness for complex-geometry high-rise buildings, three such buildings were used as hypothetical case study models. These are the Absolute World Towers by MAD Architects, Jiangxi Nanchang Greenland Central Plaza by SOM, and Ardmore Residence by UN Studio. Each possesses unique geometric features that test the robustness of the tool and method. These were recreated parametrically in Grasshopper from publicly available drawings and images so that each had a few parameters controlling certain aspects of their design that can be used as inputs in the optimization phase.
4. FSIO
4.1. Development
The proposed FSIO method was implemented in Grasshopper with the use of three main plugins: Butterfly, Karamba3D, and Opossum. These are combined using custom scripting with Grasshopper components as well as Python and C# code to produce an easy-to-use tool employing the FSIO method where a parametrically defined building model can be input to obtain a collection of variations of that model based on structural performance under wind load.
Butterfly is a Grasshopper plugin and Python library developed by Mostapha Sadeghipour Roudsari and Pak 28 as part of the Ladybug Tools suite. It allows users to run OpenFOAM CFD simulations from within the Grasshopper environment for cases pertaining to building design such as outdoor airflow. OpenFOAM 29 is a free open-source CFD software package that has been widely used and validated. Karamba3D is a parametric FEA plugin for Grasshopper developed by Preisinger 30 in cooperation with Bollinger und Grohmann ZT GmbH. It is widely used and offers many options for structural analysis including many types of loads, materials, cross-sections, as well as solvers and results. Opossum, developed by Wortmann 14 is a model-based optimization plugin. It is based on RBFOpt 17 which uses radial basis functions (RBFs) to generate a response surface approximating the solution space reducing runtime, particularly for heavy simulations such as CFD and FEA. 18 Model-based optimization creates and successively updates and refines a surrogate model which is an approximation of the design space. Thus, they can at some point use this surrogate model, which is much quicker to evaluate than whatever simulation is used in the optimization, to produce an optimal result greatly reducing the time taken. 14 These plugins were selected based on their wide use, previous validation, fast performance, and ease of use.
The Butterfly portion was set up according to an outdoor airflow simulation as given in its included examples but with modifications to increase its ease of use and adaptability. An algorithm was created for the automatic setting of mesh cell size and size of the domain based on the building dimensions. The simulation procedure was also modified with an algorithm for placing probe points for sampling wind pressure on the façade automatically based on the building dimensions in a way that the unique features of the building shape can be captured. These modifications were made to limit the interaction of the user with complicated CFD settings and allow the tool to set best practice values automatically for any building geometry that was input thus lowering the barrier of entry. This also ensures consistent and reliable results between all tests. The output of the Butterfly CFD simulation used for this method is a quad mesh of the building geometry with a corresponding pressure value for each mesh face. This mesh is unrelated to the CFD mesh and simply represents the geometry of the building. This will be the force used by Karamba to calculate the structural response.
This coupling of two separate CFD and FEA solvers is known as a partitioned FSI procedure. The output of the CFD simulation needs to be translated into a form that can be input to the FEA solver. To do so, an algorithm was written to translate the mean static pressure values from the mesh to point loads and moments on an upright fixed beam representing the core of the tower. The center line is found automatically based on averaging the points of the external mesh into a straight upward line. This is then given a cross-section approximately equal to the dimensions of the core of the actual building. To obtain the loads, the faces of the building mesh are sorted then divided into six groups in height then further divided around the circumference of the building. The pressure values are then multiplied by the area of the mesh face and the normal vector of the face is scaled with that value to obtain a point load vector. Each group is then summed to obtain a resultant vector which is then applied to the core line as a load at 6 points (Figure 2). This is the FEM that Karamba analyses. The analysis outputs results for deflection, the mass of the structural model, forces, etc. which can be used as the objective for Opossum. The input variables are the numerical sliders controlling the shape of the model being analyzed. The script was set up in a way that any parametric building geometry could be input into a single Brep component for the FSI analysis. No other settings require modification.
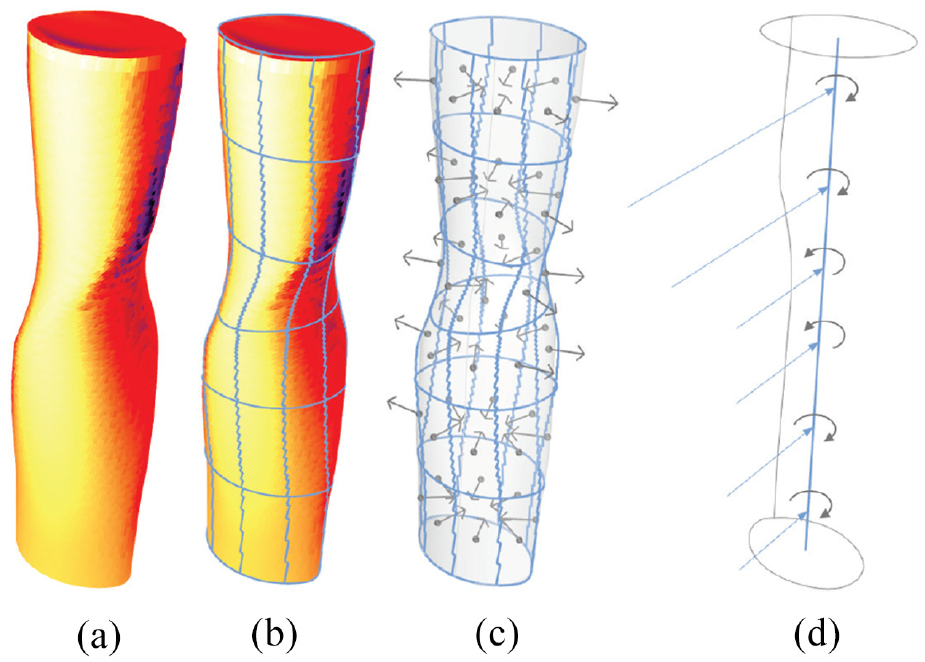
(a) Mesh from Butterfly with corresponding pressures, (b) division into segments, (c) force vectors summed per segment and applied to center point plus distance vector from center of the building, and (d) force vectors and moment vectors applied to core beam.
4.2. CFD validation and sensitivity
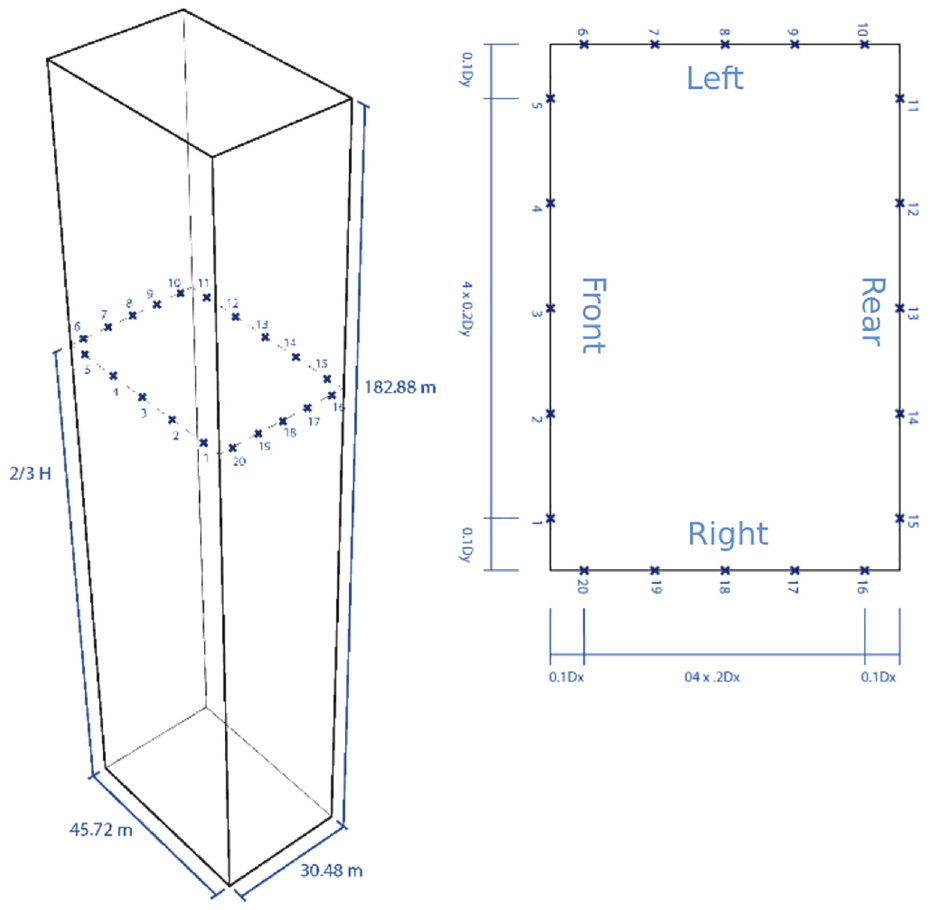
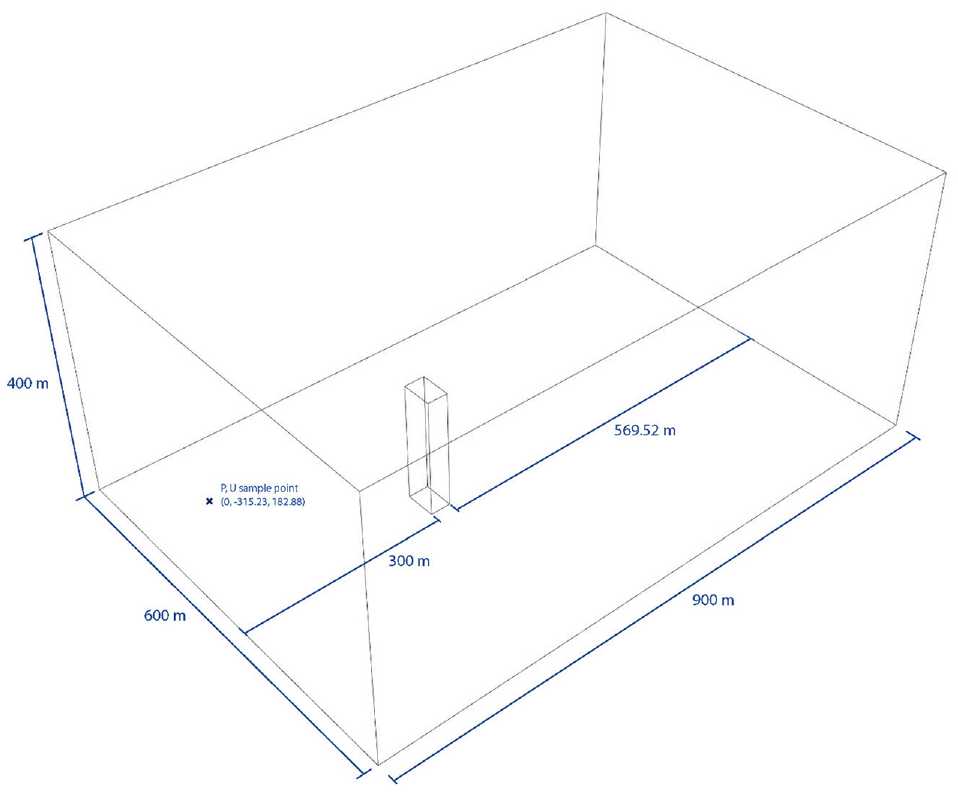
A validation study was performed to ascertain the accuracy of the Butterfly CFD setup by comparing the pressure coefficient (Cp) at specific points on the building façade obtained from a CFD simulation to those at equal points from a physical wind tunnel test. An absolute deviation of ±20% is deemed acceptable for an early-stage method such as this. 31 For the comparison, the CAARC Standard Tall Building Model was used for which physical wind tunnel test results were obtained from a study by Meng et al. 31 The digital model was set up just as the physical model in the cited research where pressure coefficient (Cp) was measured at 20 points around the façade at two-third of the height (Figure 3). The virtual wind tunnel was also set up according to Meng et al. 31 with a CFD domain size of 900 × 600 × 400 m3, and the building is centrally located in the Y direction 300 m from the front inlet boundary. This corresponds to a blockage ratio of 3.48% (Figure 4). The number of CFD iterations was set at 30,000.
CAARC model CFD setup.
CFD domain setup.
Three RANS turbulence models were tested: standard k-ε, Realizable k-ε, 32 and RNG k-ε. 33 The k-ε models solve equations for the turbulent viscosity of the flowing air by calculating the kinetic energy, k, and the turbulent dissipation rate, ε. 4 All other CFD settings were kept constant. The resulting Cp obtained was compared between each of the turbulence models and the wind tunnel results at each pressure tap. The overall shape of the graph was also examined to determine its precision in capturing results in each area of the building. Finally, these results were considered along with the time taken for the simulation to determine how efficient it is.
After a suitably accurate turbulence model was chosen from the validation tests a sensitivity analysis was performed. This involves changing one parameter of the CFD simulation while keeping others constant to see how much the simulation time can be reduced while maintaining sufficient precision and accuracy. The hypothetical building model used for this sensitivity analysis was a simplified model of the Absolute Tower. In this case, the number of CFD iterations and mesh cell size were tested. To evaluate the effect of the number of iterations on simulation time, simulations were done with 30,000, 10,000, and 5000 max iterations using the chosen turbulence model. All other settings remained constant. The Cp was compared for each simulation to determine deviation. To test the effect of mesh cell size on precision and timeliness, simulations were done by reducing cell sizes with a starting value equal to the length of the shortest side of the building divided by 10,
34
then successively reduced by a chosen value of
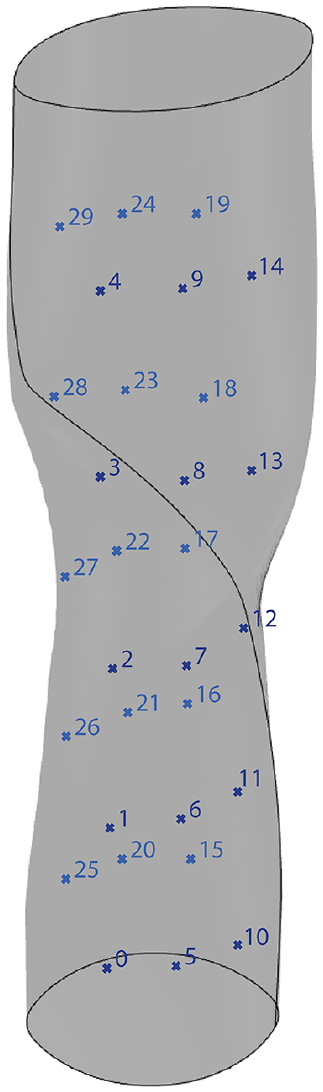
Absolute tower model CFD setup.
4.3. FSI validation
To validate the FSI portion of the method, the values obtained using the Eurocode (EN) calculation method were compared to those obtained from the FSI method implemented in the script. The wind force (Fw) was calculated at the six heights along the building obtained from the FSI portion of the method using the EN method and compared. As the EN only gives guidance for regular-shaped building cross-sections, it was chosen to use values and equations assuming a circular cross-section for this calculation as these building models have a smooth cross-sectional shape. Basic wind velocity was taken as 30 m/s, roughness length as 1 m and Aref was set at 1 m2. Simplified models of the Absolute Tower and Nanchang Tower were used in this test. The areas to which the Fw would be applied were obtained in Grasshopper by finding the areas around the point loads of the building perpendicular to the wind flow. This was done for each of the tested case study buildings and the loads compared to those from the FSIO method.
4.4. Optimization
The optimization tests aimed to determine whether, and the extent to which, the building’s structural performance due to wind can be optimized by making relatively small changes to the external geometry. All three non-standard geometry building models were used for this study. The models were set up parametrically so that their geometry could be manipulated by the optimization algorithm.
For the hypothetical case of the Absolute Tower, the building is characterized by an elliptical cross-section that twists as it rises. A base ellipse was created whose width and length are controlled by sliders. This curve was then copied and moved upward in the position of each floor and each rotated according to the angles given in the original design. A slider was added to act as a multiplier to these angles so that the twist could be increased or decreased. These three sliders: base length, base width, and twist multiplier, were the input variables (Figure 6). The Nanchang tower features a gradually changing smooth cross-sectional shape. To parameterize the geometry, the model was made in Rhinoceros based on floor plan and section drawings and then referenced into Grasshopper. Contour curves were cut along the height of the building. These were modified to allow sliders to change the geometry by squeezing inward or bulging outward. This was split between the top and bottom half of the tower with a slider controlling each. These were the two parameters (Figure 7). In the hypothetical case of the Ardmore Residence model, two design variables control the position of each of the wings along the main body. A third slider modifies the edges of these wings from straight to a more angled position. From this curve outline, the massing was extruded to the height of the building. These three parameters are the input variables. In addition, the building was rotated 45°, so the wind would impinge on the building off-axis (Figure 8).
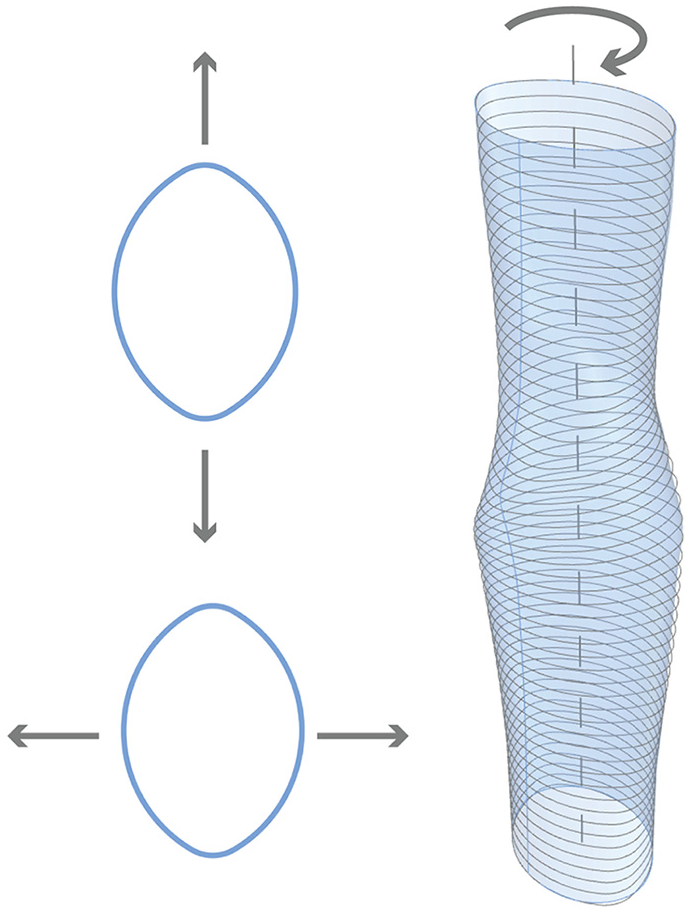
Absolute tower model parametric definition.
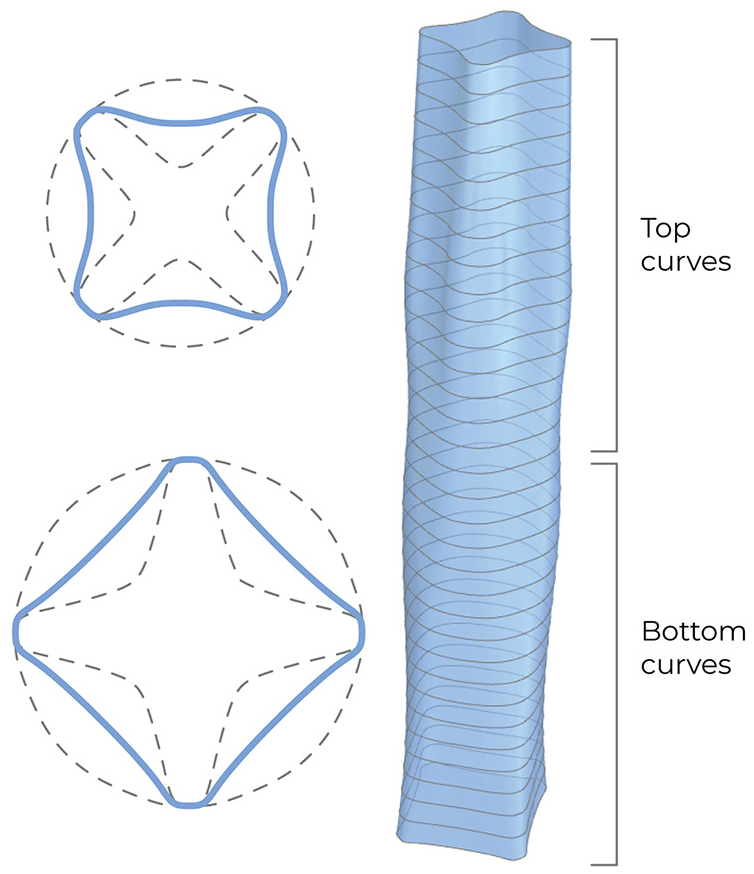
Nanchang tower model parametric definition.
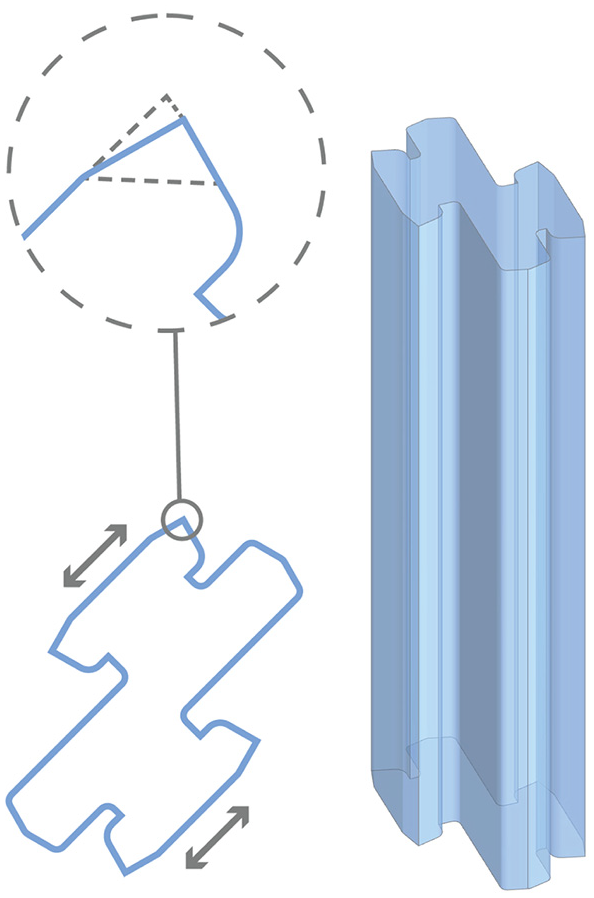
Ardmore residence model parametric definition.
CFD settings were chosen to minimize the time for a single iteration. Thus, a coarse mesh setting was used, and max iterations were set to 2000 based on the sensitivity analysis results. The output objective to be optimized was the mass of structural material needed to resist the wind force to a deflection limit obtained by an initial FSI simulation of the original building geometry. This was determined by modeling the core of each building as a hollow rectangular concrete (C45/55) beam approximately the dimensions of the core of the existing building and recording the resulting deflection.
The optimize cross-section component of Karamba was used to automatically select from a list of cross-sections thicknesses (length and width kept constant) that satisfies the deflection limit for each building model. In Opossum, the RBFOpt optimization algorithm was used and the max number of iterations was set initially at 60 but increased to 100 in the last test. The geometry created at each optimization iteration and its corresponding objective value (mass of the core) were recorded in Grasshopper to create a database of design options.
5. Results
5.1. CFD validation and sensitivity
The RNG k-ε turbulence model showed the closest Cp values to the physical wind tunnel results (WT) from Meng et al. 31 followed by standard k-ε (Figure 9). The realizable k-ε model gave unrealistic Cp values the reason for which was not found and thus this turbulence model was omitted.
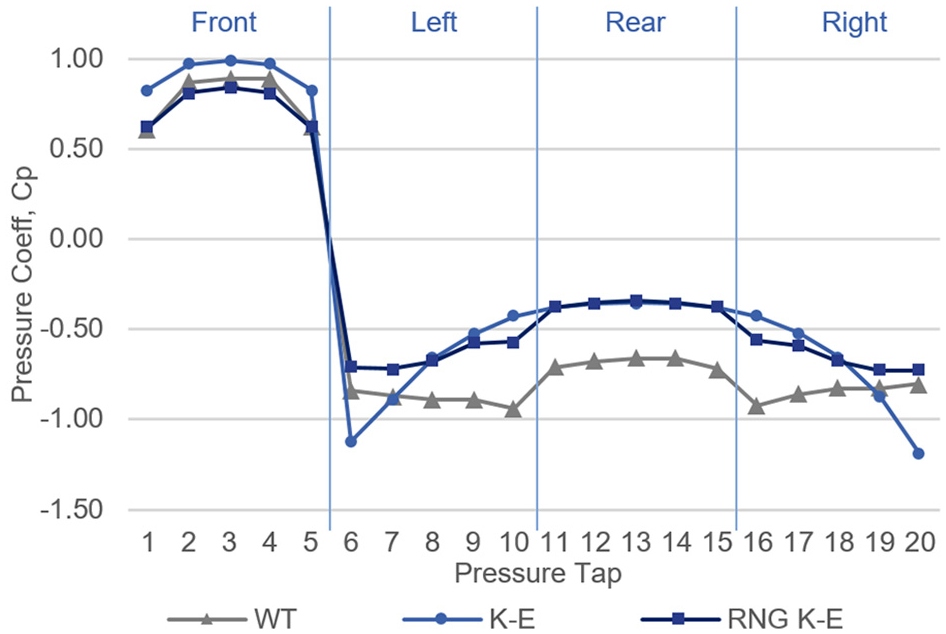
Graph of Cp at each pressure tap from each turbulence model and wind tunnel (WT) for CAARC model.
From Figure 9 the Cp values of all turbulence models are quite close at the front face of the CAARC building (pressure tap 1–5). On the sides and rear (6–20) the values deviate more. RNG k-ε, while with an absolute deviation of 25%, deviates much less from the wind tunnel values compared to standard k-ε which has a more rounded graph shape. This is likely due to the known poor performance of standard k-ε in predicting regions of flow separation like the building rear and edges. 7 Time-wise, RNG k-ε took 42.6 h to complete, standard k-ε took 41.7 h and realizable KE, 37.4 h. RNG k-ε, therefore, proved to be the best choice due to its level of precision in capturing the flows at different areas of the building while taking not much more time than other models.
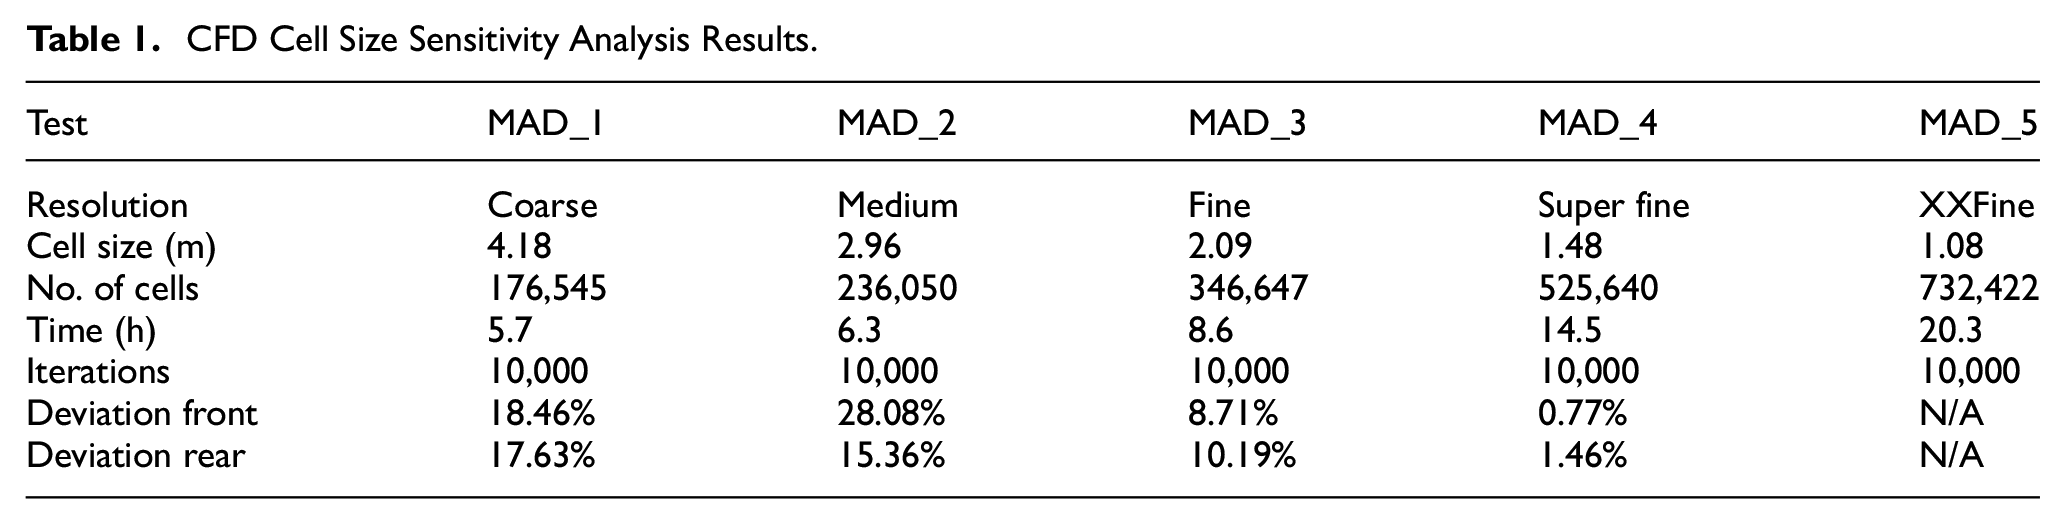
The timeliness of the RNG k-ε model was further evaluated in the sensitivity analysis. At 10,000 and 5000 CFD iterations, the Cp values obtained were nearly identical to that of the 30,000 iteration simulation done previously while taking only 15.7 h and 6.95 h, respectively to complete. Looking at a graph of the residuals, that is the scaled errors of calculated values between successive iterations, the values are sufficiently below the iterations used in the validation study (Figure 10). Table 1 shows the settings used, the time taken, and absolute deviation at the front and rear of the building from the MAD_5 test, which is assumed to be the most accurate, for each run at differing mesh sizes. XXFine took the most time with 20.3 h. The coarse mesh size has the lowest time of 5.7 h. Absolute deviation increases steadily as cell size increases except for the front at medium resolution possibly due to inaccurate meshing at the sharp twist of the building as can be deduced from Figure 11. At fine resolution, the time is greatly reduced while deviation is still around 10%, making it an ideal choice to balance time and accuracy for an early-stage FSI simulation. However, for optimization, the coarse mesh may be best since it offers under 20% deviation with a comparatively low 5.7-h runtime.
CFD Cell Size Sensitivity Analysis Results.
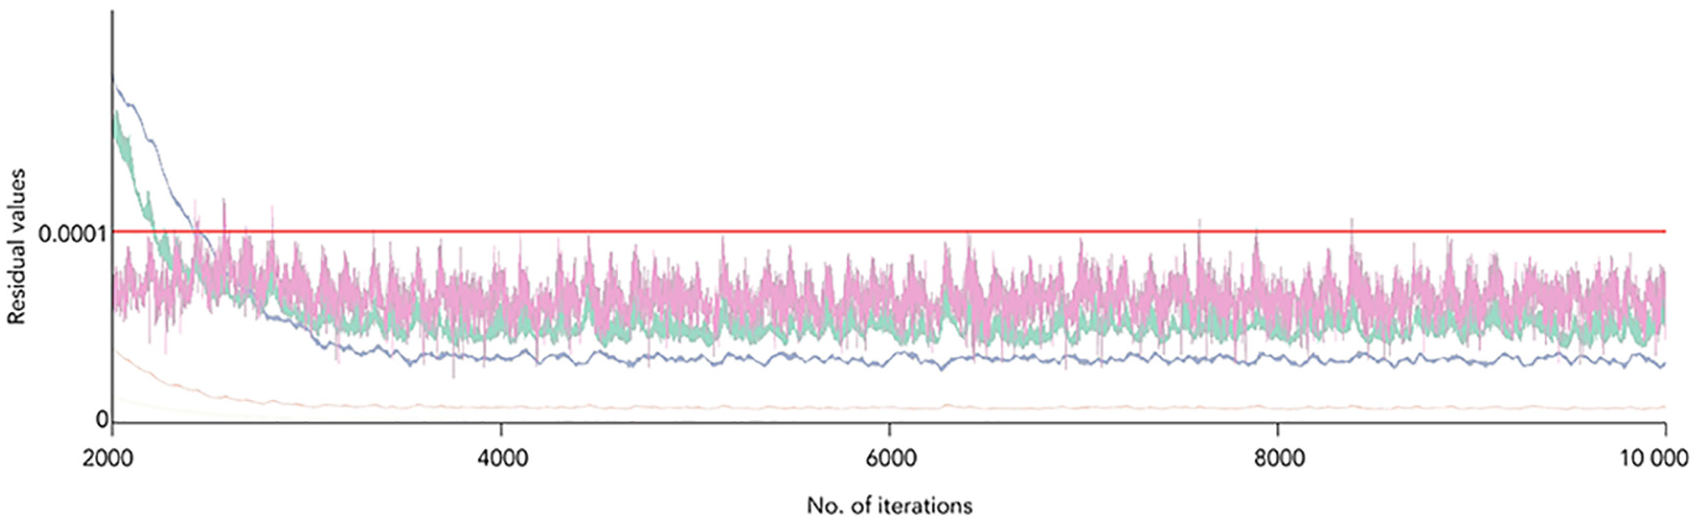
Residuals graph of RNG k-ε simulation.
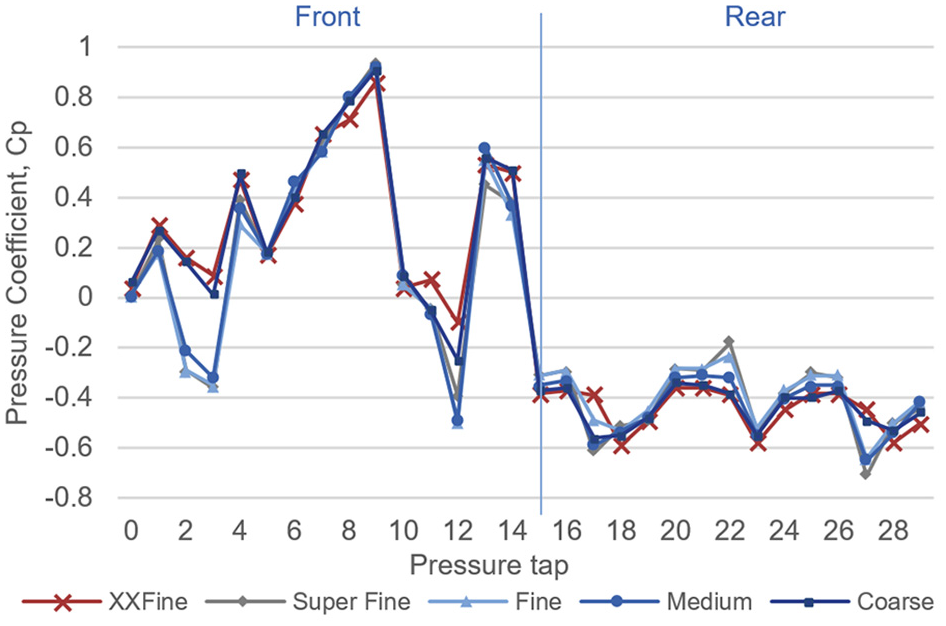
CFD mesh cell size sensitivity analysis.
From Figure 11, while there is some deviation the Cp values generally follow the same trend. The exception being around the edges of the building near the twist (pressure tap 1–4 and 10–12) which can be reasonably assumed to be caused by issues in generating the mesh at those points for medium and fine resolution. The result shows that between mesh sizes precision can generally be maintained and give predictable results. Thus, particularly for optimization purposes, a coarser, faster setting (such as the coarse resolution or even one with a larger cell size) can be used to obtain quick and repeatable results that can reliably inform early-stage decision-making. A finer resolution is suitable for a later stage as a final check.
5.2. FSI validation
The results for the Absolute Tower model are shown in Figure 12. The Eurocode numbers begin to rise then fall with respect to the decrease in the perpendicular area near the middle of the tower then rise again to a maximum value of 1256 kN. The values from the FSI method follow a similar pattern but are much higher as CFD with RANS turbulence models like the RNG k-ε simulate the mean static pressures across the entire surface. In reality, wind flow in the atmospheric boundary layer is more random and peak pressures do not occur simultaneously over the whole structure at one time. 36 To account for this, the FSI values were multiplied by the structural factor, cscd, and force coefficient, cf, from the Eurocode (FSI Reduced) which take this effect into account. 2 As seen in Figure 12, the reduced values from the FSI simulation are now closer in line with those from EN calculations. The discrepancy in values above 100 m can be concluded to be accounted for by the unique geometry of the building. At the top of the tower, FSI values are higher than EN as this point has the broad side of the elliptical plan thus causing more pressure than the EN (which assumes a circular plan) has calculated. This is more pronounced since wind speed is highest near the top.
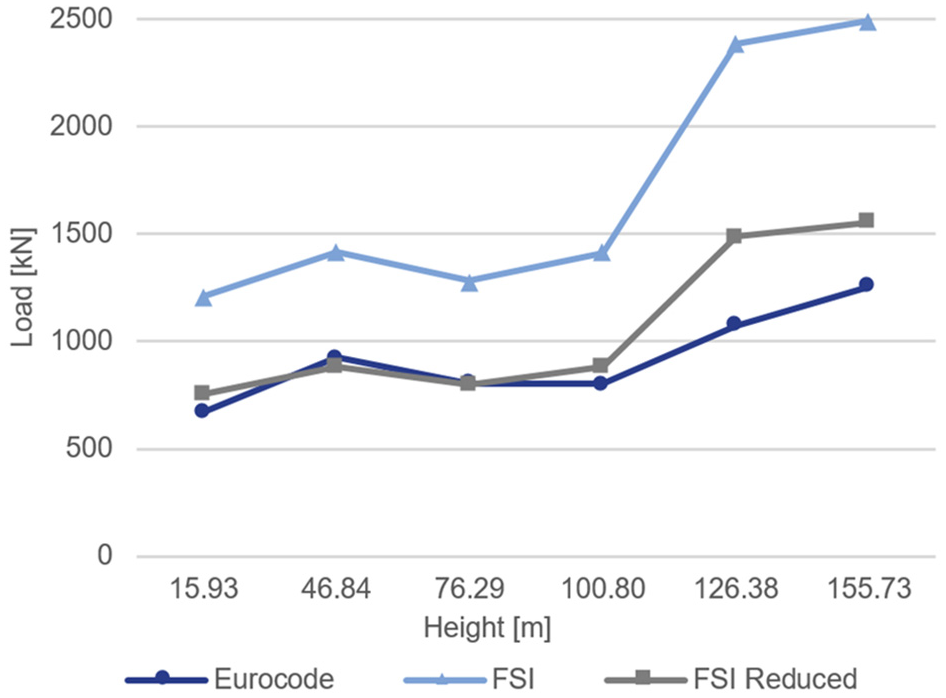
Absolute tower EN/FSI comparison.
For the Nanchang Tower model, the EN values follow a smooth curve as wind speed increases and the cross-sectional area decreases with height. For the FSI values, the values smoothly increase until a height of 178.44 m then jump at 229.46 m. Two factors account for this difference. First, the high wind speed near the top of the over 300 m tall building and, second, the concave shape of the façade at this point leads to a higher pressure as the air would have difficulty flowing around the building compared to a smooth convex circular plan as assumed by the EN calculation. The value, while still high, then drops back down at the highest point where the wind can flow over the top of the building (Figure 13).
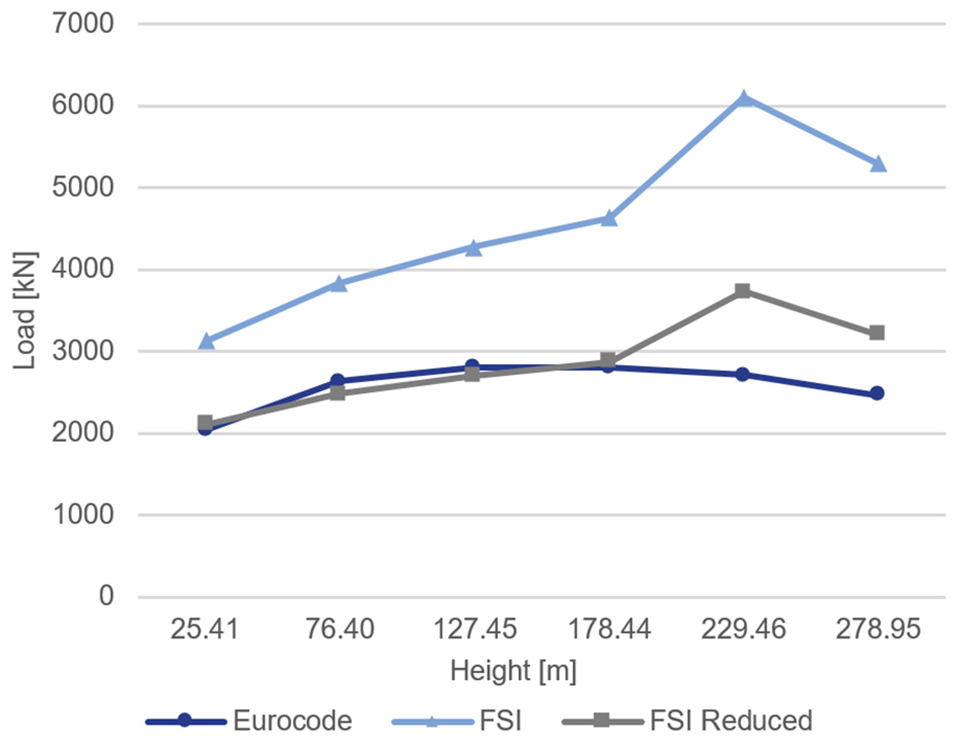
Nanchang tower EN/FSI comparison.
5.3. Optimization
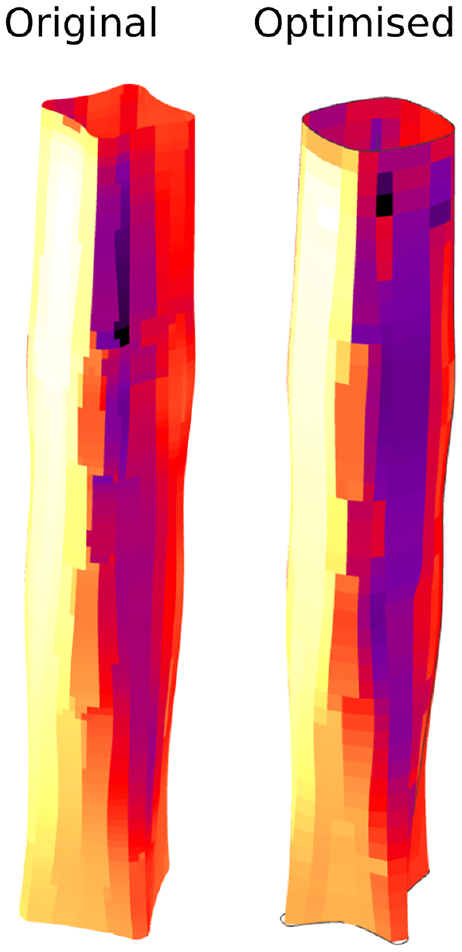
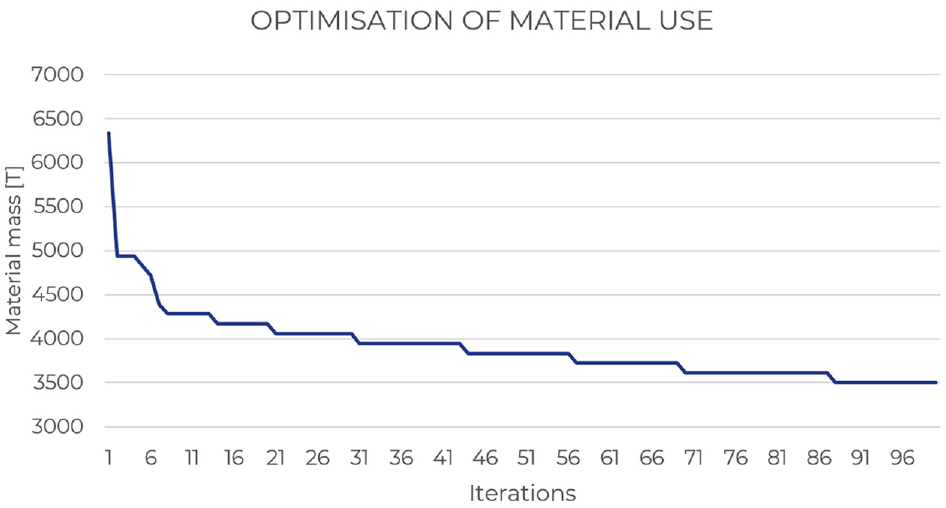
For the Absolute Tower model, Figure 14 shows the gradual reduction of mass over time. A minimum of 3522 tons was recorded at completion with a cross-section thickness of 0.26 m after 60 optimization iterations. This is a 42% reduction from the original 5984 ton mass. Figure 15 shows the original versus the resulting optimum geometry with surface pressure from CFD (yellow high pressure, purple low pressure) after completion of the optimization test. The building is now slightly rotated from the original and the cross-section is a bit wider/more rounded no doubt reducing the pressure of the broader elliptical plan at the top portion of the building. This, though being the best-performing option, is quite different from the original design of the building and may not be acceptable to an architect.
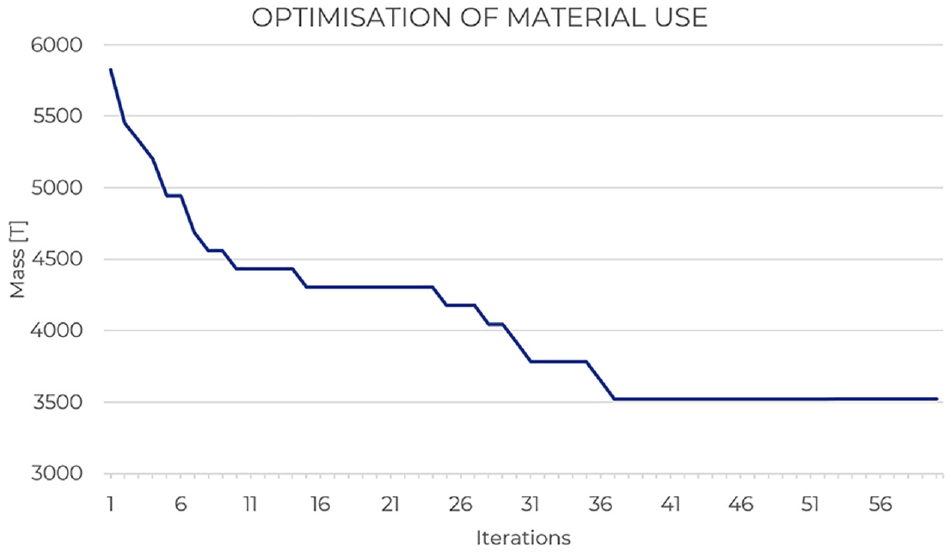
Absolute tower mass of structural material per iteration.
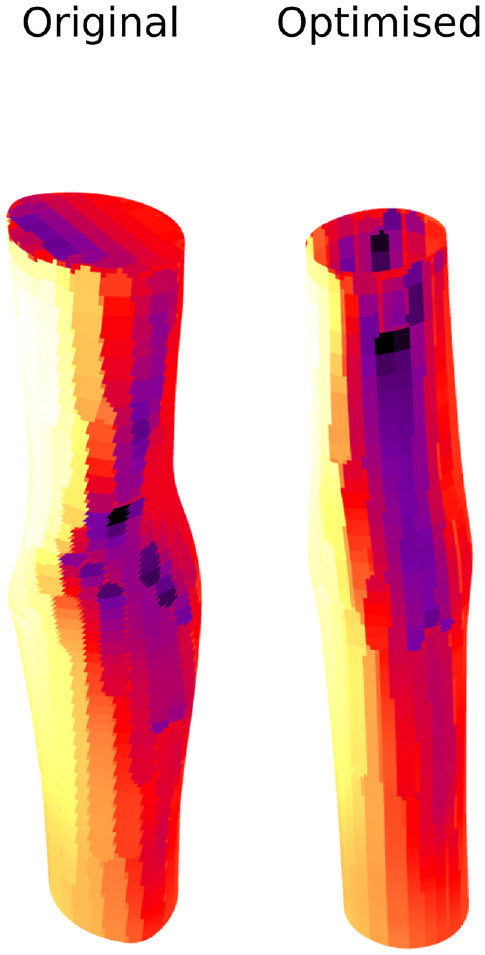
Absolute tower geometry original vs optimized.
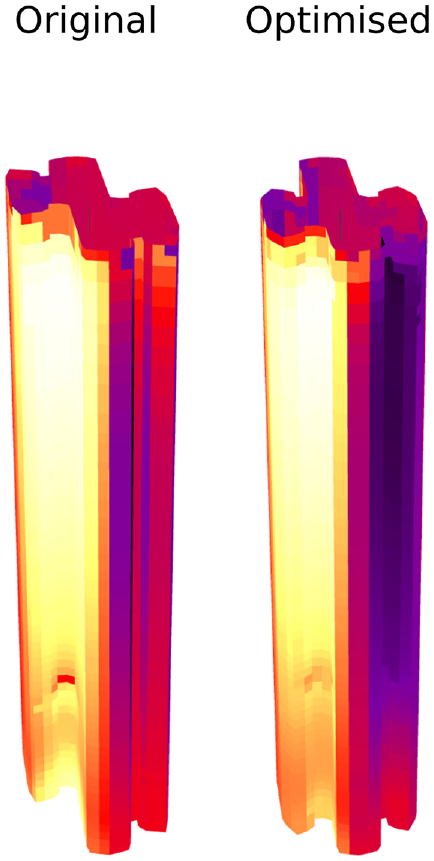
For the Nanchang tower, the core thickness was reduced from 1 m to 0.85 m corresponding to a reduction in material mass of 15% to 47,533 tons after 60 iterations (Figure 16). Figure 17 shows the original and optimized Nanchang Tower model. The optimized geometry smooths out the area near the top where it was originally concave allowing air to flow easily around it rather than get caught in the concave area and impart higher pressures. The resulting loading should now be a gradual increase from bottom to top corresponding to the increase of wind velocity with height.
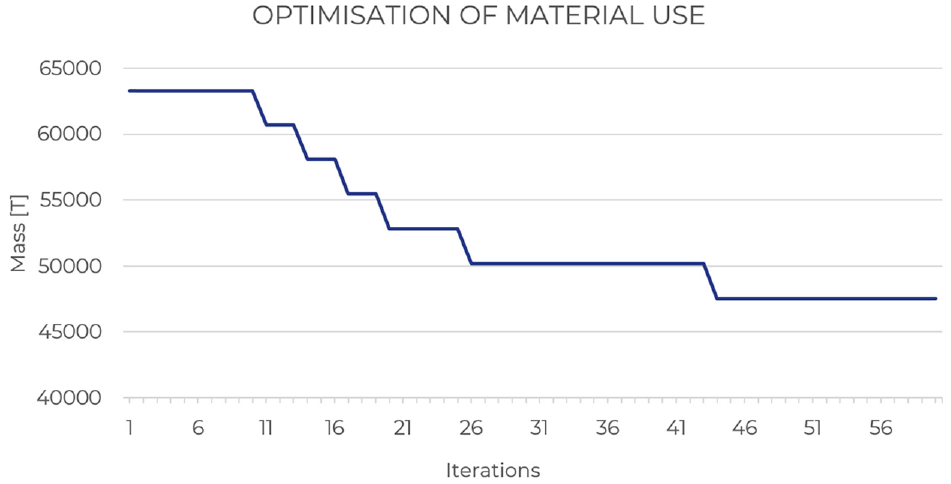
Nanchang tower mass of structural material per iteration.
Nanchang tower geometry original vs optimized.
Figure 18 shows the gradual reduction of the objective over each optimization iteration for the Ardmore Residence model. A 24% reduction in the material mass was achieved by reducing the building’s structural core thickness from 0.40 m to 0.30 m after 100 iterations. The iterations were increased to allow more time to reach an optimum. The model-based approach of Opossum seems to have sufficiently converged but perhaps could have run longer to confirm since the final line of the graph is quite short.
Ardmore residence mass of structural material per iteration.
Finally, Figure 19 shows the original versus the resulting optimum geometry with surface pressure from CFD after completion of the optimization test on the Ardmore Residence model. The lower wing is moved to the front resulting in a more symmetrical cross-section. The edges were also pulled to a sharper angle. This reduces the flat pressure-inducing wall area on the windward of the building and allows the wind the flow more smoothly around the building. The reduced pressure results in lower forces on the core of the building requiring less thickness to resist deflection.
Ardmore residence geometry original vs optimized.
As with the other models, this optimal shape is quite different from the original. Using the data recorded from Grasshopper, a database of results was created where the shape of the building at each optimization iteration and its corresponding objective of structural mass calculated by the FSIO method was displayed (Figure 20). This feature allows a user to make decisions based on both performance and architectural factors.
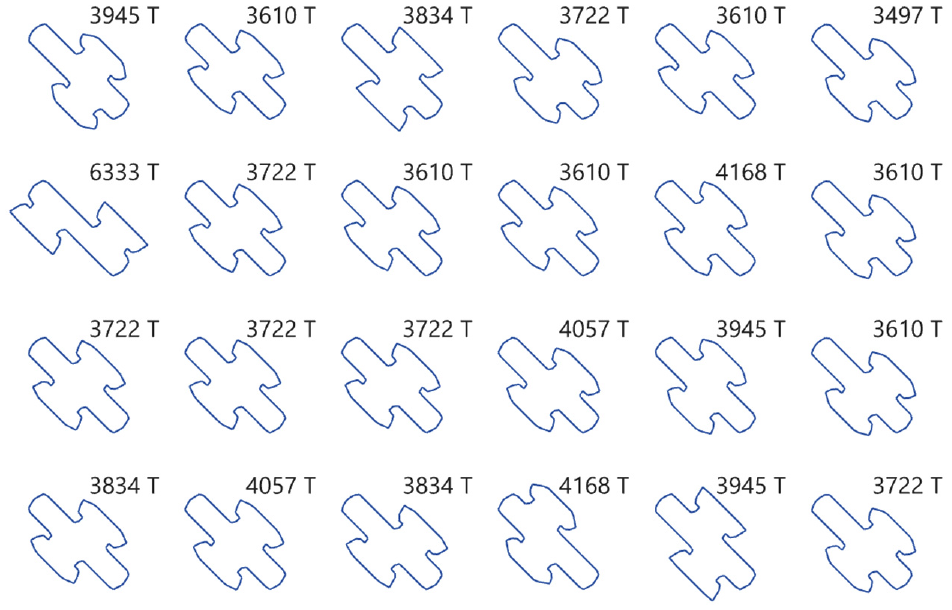
Excerpt of resulting geometries and corresponding mass.
6. Conclusion
This paper outlined the development and testing of an FSIO method used to optimize the shape of complex-geometry high-rise building models based on structural response due to wind in the early design phase. The aim was to create and implement this method into a tool to aid in performance-based design exploration as a complement to more traditional methods of structural wind analysis used in the late phases of building design.
The first part detailed the validation and sensitivity analysis of the CFD simulations and showed that using Butterfly with the RNG k-ε turbulence model performed best. It was able to capture variations in pressure around different areas of the building reasonably accurately in close accordance with physical wind tunnel results which is essential for complex geometries. The sensitivity analysis revealed that simulation runtime could be greatly reduced, from 42.6 h to 5.7 h, by doing fewer CFD iterations, while having little to no impact on the accuracy. It can further be reduced using a lower mesh resolution with about an 18% deviation in results for the coarsest mesh. However, precision was still maintained since all values mostly followed an expected trend irrespective of resolution showing that it captures the unique geometry of the building model. Thus it can reliably show relative improvement between simulations of different geometries if CFD settings remain constant.
The second test involved comparing the results from the FSI method (the combination of CFD and FEA) to results obtained by Eurocode (EN) calculations. It showed that the FSI results offer near exact values with the EN procedure when combined with the structural factor and force coefficient values to account for the random nature of turbulent wind flow. The differences in values can be concluded to occur due to the unique characteristics of the geometry of the building showing the FSIO method’s applicability to non-standard shapes while the EN assumes a standard shape. The values obtained could be lower than the EN if a finer mesh resolution and a higher number of iterations were used for the CFD simulation which was kept low in these tests to save time.
7. Discussion
Overall, the method, particularly in the form of this Grasshopper-based tool, performs well in optimizing complex building models to reduce structural wind effects and is best suited early on in the form-finding stage of design for complex towers in high wind situations. It can be used to further optimize an initially chosen geometry by making small geometric adjustments to improve wind performance. This can help make tall buildings more resilient to the strong wind events expected in future due to climate change. The reduction of structural material realized in this method also helps in reducing the building’s carbon footprint. The database of results produced allows the user to strike a balance between performance and architectural aesthetic. Although wind performance is only one aspect affecting the structure of the building, the ability to optimize for it at an early stage can contribute to the overall structural design. The tool is made as simple as possible for designers by automating most of the complicated CFD and FEA setup. A user only needs to input the parametrically defined geometry and attach the optimization component to the model’s input sliders and the FSI output number component. The hope is that such a method will encourage and better enable designers to think about wind performance in the design exploration phase of their projects. At a later stage, a more detailed CFD simulation or wind tunnel test should be done to verify safety and building code compliance. There is little upfront time cost as most of the complex CFD simulation setup is generated automatically. There is, however, still a time commitment in waiting for the results though this can be done in the background or over a weekend. The number of design options produced further makes this time worth it.
The Grasshopper script is made freely available on GitHub (https://github.com/errone92/FSIO). Further work for this method should look at increasing accuracy and speed. Additional CFD software, turbulence models, and meshing procedures could be tested. While FFD was looked at early in the research, the results from test simulations proved very inconsistent and were thus abandoned in favor CFD. The testing of multiple wind directions can also have a large impact on the results. The choice of optimization algorithm in this project was based on research; however, tests on different algorithms could be done to find the best performing option for this specific use case. Zhang et al. 37 performed research after the events described in this paper which further builds on this method by optimizing the shape of a high-rise building model comparing CFD and FFD as well as two optimization algorithms RBFOpt and CMA-ES. In addition, the method would benefit from testing in a real-world design project to ascertain the true level of contribution to the field.
Footnotes
Acknowledgements
Special thanks to Andreja Andrejevic of OMRT for guidance on the computational development of the method, Dr Adelya Doudart de la Grée and Christoph Waibel for support on the CFD aspects of the project, Baojie He for providing the wind tunnel data, and Hans Hoogenboom for support in running the simulations.
Funding
This research received no specific grant from any funding agency in the public, commercial, or not-for-profit sectors.