
Abstract
Computer simulation of dense crowds is finding increased use in event planning, congestion prediction, and threat assessment. State-of-the-art particle-based crowd methods assume and aim for collision-free trajectories. That is an idealistic yet not overly realistic expectation, as near-collisions increase in dense and rushed settings compared with typically sparse pedestrian scenarios. Centroidal particle dynamics (CPD) is a method we defined that explicitly models the compressible personal space area surrounding each entity to inform its local pathing and collision-avoidance decisions. We illustrate how our proposed agent-based method for local dynamics can reproduce several key emergent dense crowd phenomena at the microscopic level with higher congruence to real trajectory data and with more visually convincing collision-avoidance paths than the existing state of the art. We present advanced models in which we consider distraction of the pedestrians in the crowd, flocking behavior, interaction with vehicles (ambulances, police) and other advanced models that show that emergent behavior in the simulated crowds is similar to the behavior observed in reality. We discuss how to increase confidence in CPD, potentially making it also suitable for use in safety-critical applications, including urban design, evacuation analysis, and crowd-safety planning.
Keywords
1. Introduction
Human motion is seemingly non-deterministic, and pedestrian path simulation is currently an exercise in imprecise abstraction. Dense crowd simulation is concerned with assessing and predicting the motion paths of large groups of people within a limited physical space. Applications range from presenting crowds in gaming and film production, to designing public spaces and assessing their quality of occupancy, to the safety-critical analysis of the potential for stampedes and crowd crashes. 1 When simulating the movement of high-density pedestrian traffic (e.g., at outdoor festivals, concerts, or mass-gathering events), macroscopic methods that rely on aggregate parameters (bringing a sense of determinism through bounded stochasticity) can be very effective when analyzing collective motion metrics, such as rate of evacuation and expected human density distribution over an area. Because they do not rely on simulating individual entities, those macroscopic methods are often efficient enough to accommodate large-scale simulation of the position update of thousands of crowd members. However, microscopic methods that can reproduce the intricate details of every single individual’s trajectory and cognitive state are becoming increasingly accessible to designers, architects, and event planners to readily assess the risks and focus stakeholder efforts around potential congestion issues.
Using a hierarchy of systems, we can divide the abstractions into three inter-operating levels: a cognitive model (for decision-making), a global pathing model (for finding a path to the destination), and the local dynamics model (for minor interaction in the optimal path). For a quick analogy, the cognitive model would involve a car driver deciding on a destination and entering it into their GPS device; the global pathing model would use the navigation service to suggest a route; and the local dynamics model would take care of the driver control over the car (e.g., lane switching, overtaking slower cars, collision avoidance, etc.). While there are crowd-simulation methods that blur the lines and attempt to solve more than one level simultaneously (e.g., Continuum Crowds), 2 this hierarchical view encourages separation of concerns (e.g., the GPS navigation model is not expected to also be a self-driving local avoidance model) and allows further experimentation and mixing of components and solutions from various sources.
The main contribution of this research focuses on advanced modeling of local dynamics of dense crowds, with the assumption that the cognitive and global pathing is modeled adequately by other methods, and they can feed their desired destination into our local dynamics model. The research presented here focuses on the modeling and simulation of motion paths adjustments (i.e., trajectory of entity’s center of mass) in response to changes in an entity’s short-range environment (roughly an arm’s length); particularly for high-density scenarios.
Our research provides new methods for avoidance and steering decisions that each entity makes in response to the position of other entities or obstacles. We use the term personal space (PS) to refer to that short-ranged area of interest. At this level of density, we do not consider psychological factors. To this end, we present a novel area-based penalty force that operates on the premise of PS preservation and we demonstrate promising results obtained from simulation on consumer-grade graphics hardware. The method, called centroidal particle dynamics (CPD), is an explicit 2D model of the dynamics of response to violations of PS. It is implemented through autonomous Lagrangian agents, which emergently recreate global phenomena observed in dense crowds with high congruency to real-life trajectory data. The model reproduces empirically known phenomena where state of the art either struggles or fails completely, including collision-avoidance behavior exhibited by individuals in high-density crowds, as in Figure 1.
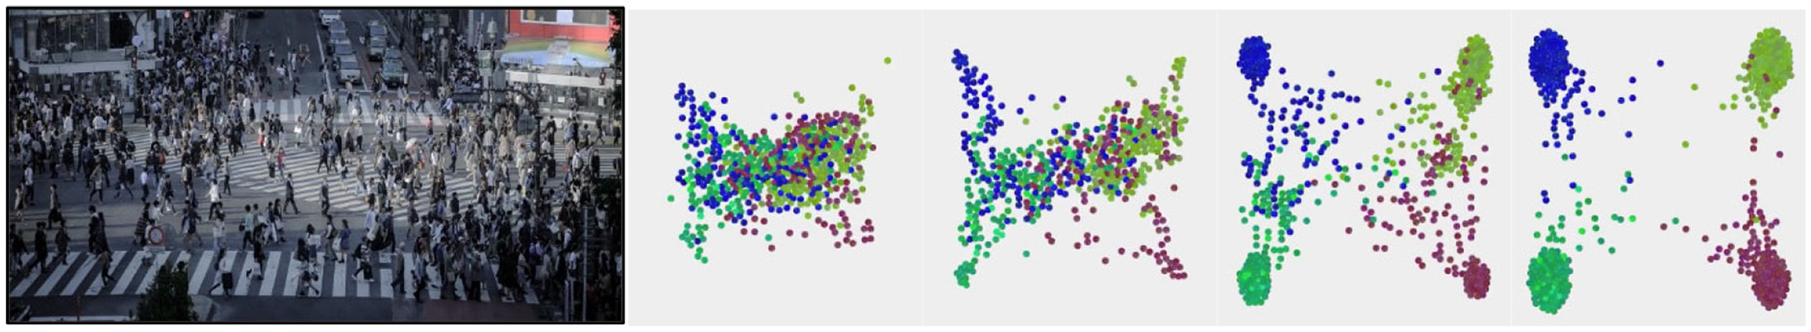
Dense pedestrian activity at Shibuya crossing, Tokyo, Japan; CPD pedestrian simulation.
The article includes new extensions to the original CPD model that include different types of vehicles, allowing heterogeneous crowd models using the Minkowski sum approach. The computation allows for arbitrary shapes. We show a close-range model that allows compression of PS. The method presented has the following advantages:
- It is a resolution-free space that does not require adaptive meshing schemes just to accommodate non-axis-aligned structures.
- It is a modular modeling approach where each entity (or class of entities) is responsible for encoding its own behavior with the environment, as opposed to the typically monolithic modeling in a Eulerian grid where every fixed node (cell) has to encode the behavior of any and all possible entities that pass through its space.
- From a purely qualitative M&S (modeling and simulation) point of view, the Lagrangian evaluation of crowd dynamics is a more faithful representation of the real-life processes performed by the entities being simulated. That is, individuals tend to continuously evaluate their next moves during motion, as opposed to doing so at fixed spatiotemporal intervals.
The paper is organized as follows. The relevant background is discussed in Section 2; the proposed method and a GPU-accelerated implementation are presented in Section 3, followed by a discussion of the extensions to the model in Section 4. Finally, in Section 5, we reflect on validation, limitations, and opportunities for future work.
2. Background
Human path planning simulation is fundamentally an exercise in stochastic abstraction, due to the apparent non-determinism of steering decisions and other socio-psychological factors which would become too complex to use as a basis for dense crowds. Replicating human decision-making is an ambitious endeavor, never mind simulating an entire crowd. To this end, the abstraction of motion dynamics by generalizing observed phenomena is necessary to achieving a computable result. Historically, the earliest methods were macroscopic, simulating aggregate behavioral patterns, rather than actual individual trajectories in the scene. They were based on adapting existing fluid simulation models to incorporate aggregate human motion parameters. They were typically computed over a Eulerian grid3–5 to provide computational stability and high performance. This granularity was enough to assess and validate collective motion parameters such as egress rate (i.e., evacuation) and density distribution over a given scene layout. Flow-based methods have since evolved, with notable contributions such as Continuum Crowds 2 delivering visually convincing large-scale results at interactive frame rates, suitable for animation, gaming, and training.
Fluid dynamics models study the crowd as a continuum using coupled nonlinear, partial differential equations that can be solved for simple geometries; in particular Bradley 6 suggested that the Navier–Stokes equations could be applied to pedestrian flows. In Hughes, 7 crowds were modeled using fluid dynamics, but with the additional assumption that human flows “think” (to consider physiological, psychological, and social factors that affect the crowd). Network optimization techniques have also been adapted to simulate occupant movement within a predefined multi-compartment environment.7,8 Each compartment is treated as a graph node that might represent a section within a room, a hallway, or even an entire building. The choice of what a node represents depends on the desired granularity of describing the spatial structure of the model. The edges connecting those nodes would then represent the capacity of pedestrians moving from one node to another. Safety engineers, architects, and event planners who are concerned about occupant experience could then utilize classic optimization techniques such as Dijkstra’s shortest path 9 or max-flow detection 10 to focus their limited resources and efforts on areas of potential pedestrian bottlenecks.
With ever-increasing hardware capabilities and improved modeling methodology, we can now simulate entity-to-entity interactions. These methods, called microscopic, focus on simulating individual agents with localized rules, in which we can find emergent behavior that matches the results of macroscopic methods (and more importantly, reality). For instance, cellular automata (CA) divide space into a uniform grid, whose future state is determined based on the states of the cells in the local neighborhood 11 using discrete time steps. Numerous authors used CA for modeling crowds, for instance Vihas et al. 12 where the authors defined a CA in which pedestrians follow leaders, or Was et al. 13 where a detailed representation of spatial relations was discussed, as well as Ji et al. 14 where models of acceleration and overtaking of aggressive and conservative pedestrians were presented. Other models include the situated CA15,16 used to study the jamming of pedestrian crowds that occurs due to the formation of arches at bottlenecks.
Although CA have shown success, the discrete-time evolution of the models reduces the potential for performance, and it makes it hard to integrate the models with other components. Likewise, CA are logical models (i.e., only the logical aspects of the rules are considered, and time is not explicitly modeled). The Cell-DEVS formalism 17 provides a discrete-event approach for cellular models’ specification, which shows it can be used for modeling and simulating pedestrian behavior and crowds. 18 For instance, Figure 2 shows a visualization of a Cell-DEVS model used to study a corridor of concern for the tenants of a commercial building (Sun Life, Ottawa, Canada) which expected a rush of new foot traffic due to the opening of a public transit rail station. 19 The figure shows the reference corridor of concern, contextualized within the rest of the building and demonstrating its potential for bottlenecks, a layered view of the state variables used, and a 3D visualization of the underlying Eulerian simulation.
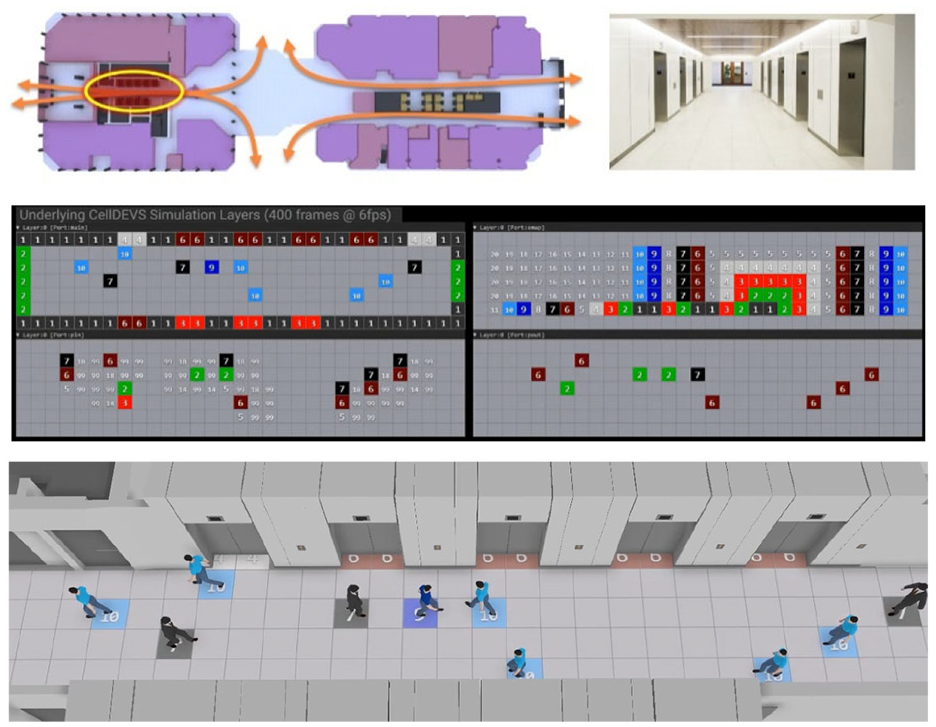
Pedestrian simulation in a building. 19
Discrete-event modeling simulation has been explored in both macroscopic and microscopic crowd simulation models, most of which rely on a Eulerian numerical solution and an axis-aligned grid-like tessellation of the scene layout, such as Cell-DEVS. These are popular for crowd modeling due to parallel-friendly processing and visualization (every cell is both the computational unit and the visual representation). Nevertheless, grid-based Eulerian evaluation of agent dynamics using discretized stepping or finite directions of motion does not faithfully reflect the fluidity of human trajectories. Lagrangian methods, instead, are spatially unrestricted and can perform their numerical computations (e.g., neighborhood sampling, collision detection, advection, etc.) in-place, avoiding the finite and limited degrees of motion exhibited by Eulerian models. For instance, Helbing et al. 20 proposed the social force method, where the human motion is viewed as a complex behavior subject to a self-driving force combined with other forces from pedestrians and obstacles. The model, extended in Helbing at al., 21 included escape panic, mixing socio-psychological and physical forces.
Finally, agent-based models are also popular for modeling crowds, making everyone in the crowd a separate agent that takes decisions independently of the others. Agent-based models usually try to simulate crowds at fine scale, which makes them computationally demanding and more suitable for short-term simulations with small-sized crowds. The local phenomena affect everyone, and therefore we can see emerging patterns that are deducted by the social and physical aspects of each individual. 22 Agent-based methods such as ORCA 23 and modifications enable the exhibiting of density-dependent behavior, 24 and data-driven motion profiles. 25 While those methods typically operate on linear path and velocity predictions, methods such as WarpDriver 26 perform non-linear prediction of the upcoming optimal path for a relatively short imminent time frame. Ideally, entities would not have access to the predicted paths of their surrounding neighbors, to mimic the true encapsulation of such data in real pedestrians.
Our own approach, called CPD, 27 is based on PS, and can be seen as a variant of the social forces method. The study of the intangible PS often occurs under the umbrella of proxemics, a sub-field of social sciences that is focused on non-verbal spatial communication. 28 The method is based on the idea that when we focus our attention on avoidance behavior at a very short range, the reference system we are trying to model turns out to be more biomechanical and deterministic than the systems deriving long-range (global) and medium-range (within vision distance) path planning decisions. Medical studies have discovered the specific cause for the phenomenon of PS preservation, proving that it originates from and is regulated by the amygdala, the fear center of the brain. 29 PS is a fear response rooted in physiology, confirmed by observing the lack of PS preservation in patients that had damaged or missing amygdalae. One evolutionary explanation indicates that PS is a mechanism for subconsciously affording us (and mammals in general) a buffer of time to react to potentially negative outcomes, especially near strangers. In an interesting display of “nature vs. nurture”, the specific PS radius varies across cultures and social settings, 30 but the shared biological origin could explain the near universal radius of ~ 0.8 m–1.0 m. Other studies have determined that conditions leading to crowd crushes and stampede disasters in what are otherwise peaceful gatherings can typically be traced back to the mismanagement of crowd flow, ultimately exceeding critical crowd densities.31–33 Based on these ideas, CPD, discussed in the next section, models close-range interactions of pedestrians in dense crowds by explicitly asking them to step in the direction that would best maintain and attempt to regain PS in their vicinity.
3. CPD
The main idea of the CPD method is to model close-range interactions of pedestrians in dense crowds by explicitly asking them to step in the direction that would best maintain and attempt to regain PS in their vicinity. For our purpose, a dense area of the crowd is one with 3 ft 2 to 10 ft 2 per pedestrian 34 (less than that is considered a contact-collision with possible injury). With the CPD approach, we first build a personal space map (PSM) for the pedestrians in the model, by checking the surrounding area of each pedestrian, and calculating the available and violated space for each of them. Then, we compute a new geometric center that would allow the pedestrian to regain the full range of PS (the centroid). We also calculate the centroidal force, a vector pointing from the current location of the pedestrian to the new calculated centroid. The centroidal force is built as a combination of the individual’s drive toward the destination, their regard for PS violations, and their resistance to paths that deviate from their path.
The PS definition of shared space can be geometrically represented by a constrained centroidal Voronoi tessellation. 23 In the context of Lagrangian crowds, the Voronoi tessellation has been used to accelerate spatial queries such as nearest neighbor search or developing a navigation mesh for global path planning. Voronoi diagrams use the idea of proximity to a finite set of points in the plane. The diagram associates every point to its closest point, conforming covering sets. Points equidistant to two elements define the border of a region. The resulting sets define a tessellation of the plane (exhaustive, as every point belongs to a set, and they are mutually exclusive). Voronoi diagrams can be used for describing paths surrounding obstacles (and indicating the distance to them). These indicators allow to determine if the path is feasible to pass through the path. This tessellation does not need to happen pairwise; it can be computed over the entire domain of entities (including obstacles), accounting for the aggregate infringement of each entity’s PS. The PSM can be treated as a truncated Voronoi diagram, whose cells are bounded by a certain distance from their sites. We use textured 3D cones to represent the entities and their PS, with the tip of the cone representing the footprint center, and the base representing the outer edges of the PS. In effect, the height along the surface of the cone encodes the distance to the center of the entity. When rendered from an orthographic top view facing the tips (free of any perspective distortion), two cones will overlap at precise points that are equidistant to both entities, as seen in Figure 3.
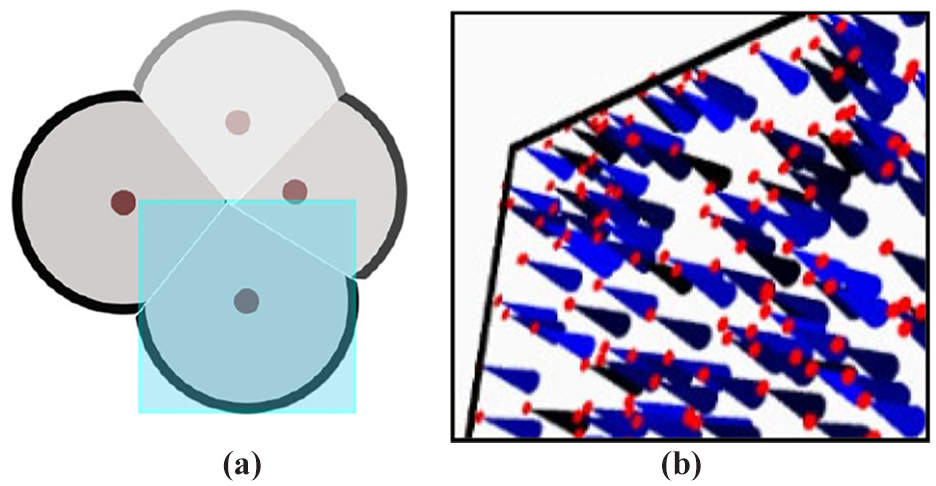
(a) PSM computation of forces; (b) side view of 3D cones.
Once the local centroidal force is computed, it is integrated with other forces relevant to the pedestrian (e.g., global path, friction, proximity to nearby family members), and we give weights to the forces, which can then be treated as the parameters of the overall model. Lastly, the advection due to the net acceleration experienced by each pedestrian is integrated using a typical numerical solver. We use a Verlet integrator 35 executed in parallel in CPU (central processing unit)-GPU (graphics processing unit). We do not model the physics of contact collisions or friction among pedestrians as previously done in rigid/soft-body simulation literature in this area, and it is outside our scope of research. The mass of the individuals can be modeled by adjusting the height of the cones. The heavier the individual is (less likely to be affected by force), the closer the cone should be to the camera. Lighter individuals must exert more force to make up for their increased distance to infringe on the heavier individual’s space.
The compute flow of the method is presented in Figure 4: we encode the entities as geometric primitives and use the GPU’s depth buffer to quickly obtain the PSM tessellation as discrete pixels, obtaining a shared data structure that allows each entity to compute its relative centroid and resulting penalty forces in a data-parallel fashion. The entities do not need to conduct a costly nearest neighbor search, as they simply consume and interact with the set of pixels representing their PS in the PSM. To differentiate between the rendered cones, they are colored using a reversible hash map that is a function of the unique entity IDs. The reverse lookup (a constant cost function) enables any entity to directly identify the ID of another entity infringing on its pixel space. After the PSM is evaluated, we compute the total force experienced by each entity as a weighted sum of the local forces (including the centroidal force and the global pathing direction). In ideal conditions with a single entity in the scene, it would simply follow the current global path direction to its destination. However, with other entities in the scene, the local forces are necessary to enact collision-avoidance maneuvers with their surrounding environment.
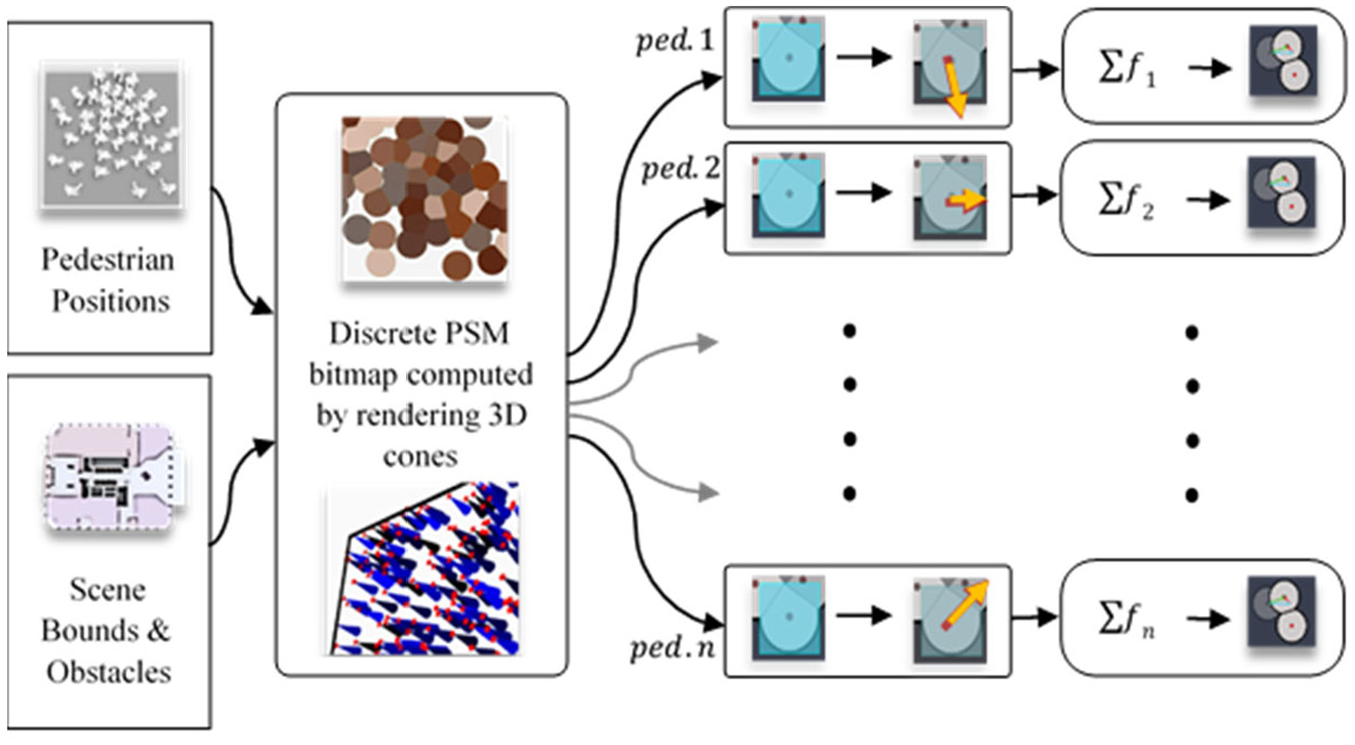
Data-parallel implementation of the CPD method.
Trying to accelerate the PSM computation, we found out that the CPU was a primary bottleneck, due to repeated rendering calls made for each entity cone. Each render call produced overhead on the graphics API (application programming interface) and the CPU-to-GPU memory transfers. Modern graphics APIs have features that allow instanced rendering: the CPU sends the shape information only once, along with a point cloud of instance locations. Then, the GPU would perform the replication on-chip without communicating again with the CPU over the relatively slow system bus. Unfortunately, using this feature for PSM computation was not straightforward, because of the dynamic PS shapes (especially with the introduction of velocity-dependent extensions, and the extensions to be discussed later in this article). Consequently, we opted instead to develop Geometry Shaders that dynamically generate the PS shapes on the GPU. Geometry Shaders are part of the modern graphics processing pipeline that can programmatically generate new meshes and geometry that the CPU did not initially send. Our Geometry Shaders accept a point cloud of entity positions along with an array of entity attributes (e.g., current velocity, bearing, comfort speed, etc.) and let the GPU generate the appropriate voronoidal PS shapes per entity. This reduction in CPU render calls has improved the simulation frame rate (a performance analysis of such reduction is not the goal of this research; some performance results can be found in Hesham et al). 27
The CPD in the model presented in Hesham et al.27,36 assumes that the agents are individual, cooperative and behaviorally homogenous; they also have little to no relationship with each other. In those initial studies, we could analyze phenomena of self-organized lane formation, bidirectional flows of real crowds in general, and in dense crowds. We illustrated how these phenomena, which appear to be organized, are in fact just emergent global behaviors due to each entity pursuing entirely individualistic pedestrian dynamics. The model was validated with sources of in-lab bidirectional scenarios where the entities are not forming lanes due to any explicit laning rules, cultural norms, or barriers in the scene, but rather it is a global phenomenon that emerges from local optimization decisions.
Custom obstacle maps can be introduced to modify the behavior of the crowd in the presence of various kinds of obstacles, as seen in Figure 5, which shows a bidirectional flow crowd built with the CPD method and several types of obstacles.
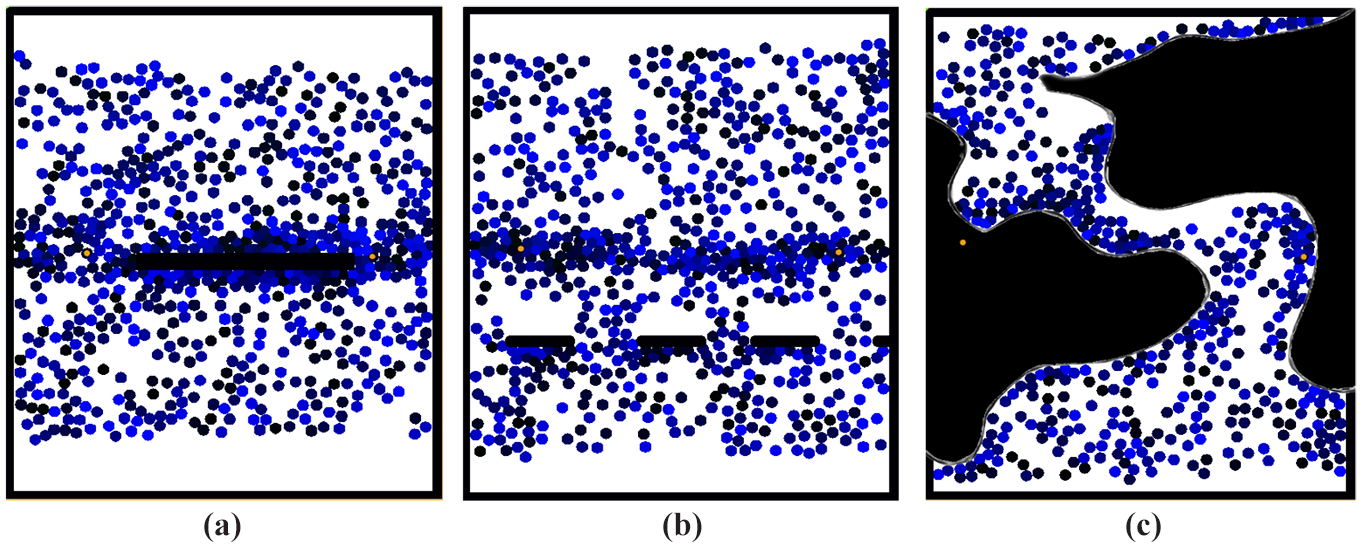
(a) Center gate; (b) barricade; (c) custom path.
In the centralized PSM computation, the GPU renders a global PSM map that all entities can query. To decentralize this, we utilize a truncated Voronoi tessellation, in which every entity computes only the Voronoi cell it belongs to, and not the whole PSM diagram. In this way, every entity ends up with a polygonal cell representing its unviolated PS kernel, and the centroidal force computation continues in the same data-parallel fashion, as seen in Figure 6. As we can see in the figure, given an entity a surrounded by neighbors b, c, and d within a’s proximity sensor range, the unviolated PS cell can be updated using the perpendicular bisector of the vector to each neighbor. Notice that even though c is within a’s detection range, it is not close enough to affect the PS cell update.
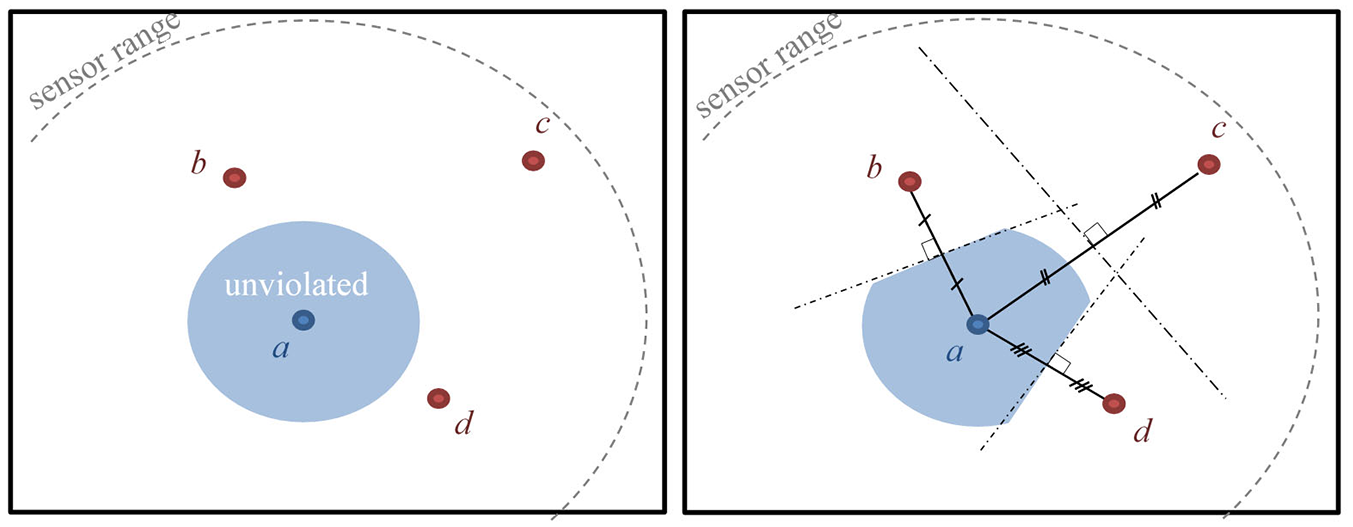
Distributed computation of CPD.
This is a zero-communication implementation that does not require a message passing between the agents, does not query a centralized cone renderer, but instead relies purely on the sensory abilities available to each agent. If the agents lack perfect detection and proximity sensing of their surroundings, then it will be reflected in the fidelity of the PS kernel they can locally generate and update.
In the remaining sections, we discuss advanced emergent results found with our method, expanding the use of CPD to cases of intentional organization (e.g., pedestrians in a tour group, or friends staying close at a crowded festival), non-homogenous behavior and groups with non-cooperative behavior. In those cases, the entities require additional social forces to be accounted for when computing each entity’s net force. Having said that, in all cases we assume that overall, the PS (centroidal) forces and their amygdala-driven dynamics do not change; every entity still wants to maintain a reasonable PS within its surrounding.
4. Advanced emergent behavior modeling with CPD
This section shows extensions to CPD to simulate scenarios that exhibit micro-grouping, competitive pathing, distracted entities, and uncooperative behavior. To do so, the extended models’ computation of forces has been changed. We added a variety of new applicable forces to the special entities, and the main applicable forces we consider in the extended models include:
The following sub-sections discuss a new series of observed behaviors based on a combination of the CPD and these new forces applied to the method.
4.1. Flocking in CPD
We first introduce the results of crowds with micro-grouping in which the entities present flocking behavior. The entities that are part of a flock follow three simple steering behaviors known as the Boids flocking rules, namely alignment, cohesion, and separation. 37 The alignment behavior causes a particular entity to line up with the entities near it, and each individual to steer toward the average heading of the remaining local flock mates. Cohesion causes the entities to steer toward the average position of entities within the certain radius that determines whether the entity is a part of a flock or not. Finally, separation is a steering force whose behavior causes individuals to steer away from other neighboring entities.
The extended model combines the flocking behavior of individuals in the crowd as a combination of these three forces. Figure 7 shows a scenario of disruptive micro-grouping, in which a crowd of 990 entities is in bidirectional flow through a 40 m corridor. Here, 10 of the entities are grouped by the Boids flocking rules. The case study considers the flock starting from the sideline, and the group is asked to move across the bidirectional stream to reach the opposite end, and, starting from the north, the group is asked to move along the bidirectional stream to reach the south. The average time it took the group to complete task (a) was 83.75 s and task (b) 68 s, confirming the intuitive notion that going across the established flow of a dense crowd will be slower, as the group has to wait either for openings to cross or to force their way to disrupt the bidirectional flow. As we can see in the figure, the 10 individuals grouped stay together as they traverse across the scene, while the rest of the crowd follows a north-south bidirectional motion.
Shows 10 entities explicitly grouped using Boids flocking (a) initial and (b) final positions.
While the opposing-flow pedestrians resulted in observed lane formation as an emergent optimization strategy, the micro-groups flocking across the corridor did not display any emergent behavior, further explaining the delays in performing task (a). The disparity between tasks (a) and (b) did not noticeably change for larger micro-groups of more than 10 individuals; however, as the groups became smaller, nearing individualistic behavior, the disparity between the two tasks was significantly reduced, and almost imperceptible in groups of two. The immediately observable explanation is that smaller groups can seize on smaller “openings” available to cross amidst the dense crowd. Additionally, task (b) is limited by the emergent bidirectional flow rate, which at high-enough densities effectively equalizes movement speed for large portions of the crowd. In other words, even though task (b) seems easier, overtaking people ahead in a very dense crowd is quite difficult; hence the reduction in disparity between tasks (a) and (b) as the group size decreases.
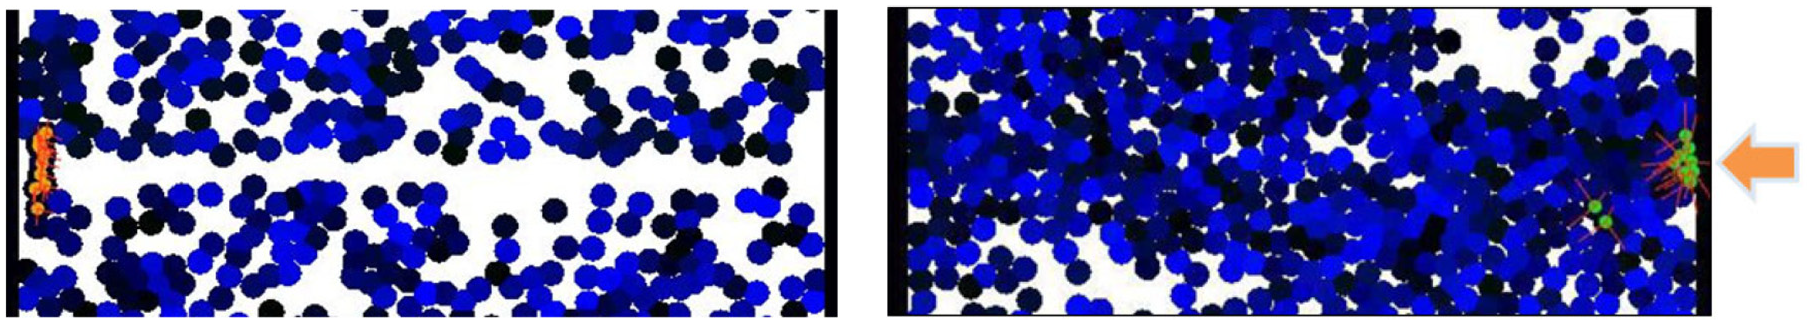
We also conducted different tests varying the three steering forces. The time taken by the flock to travel horizontally under the influence of all three steering forces was slower than when the cohesion and separation forces were turned off; on the other hand, the time taken for vertical travel under the influence of all three steering forces was greater than when the cohesion and separation forces were turned off. When the cohesion and separation forces were turned off, the flock took less time when passing through the perpendicular crowd (in the absence of the two forces, the entities travelled more individually and made their own way through the crowd), as seen in Figure 8.
Two entities, finding and meeting crossing horizontally a bidirectional crowd.
The model can be modified to have two individuals meet at a certain point in the middle of the crowd when placed at various locations. This is presented in Figure 8, which shows a moving crowd with individuals at opposite horizontal positions. To define the meeting/finding behavior, we use the gathering force, the VoroForce and the frictional force. The strength of each of these can be changed to provide different speeds for searching and finding, and interaction with the crowd.
4.2. Uncooperative behavior
In certain situations, there will be entities that do not act in the best interest of the collective motion of a crowd. For instance, construction workers might stop in the middle of a busy hallway to inspect the area, causing the hallway to become narrower, less navigable, and potentially leading to more pedestrian collisions, or when people suddenly stop while in the middle of a busy lane (e.g., exiting a train). Those “uncooperative” persons effectively become an obstacle, like any other in the environment. To model these scenarios, we modified the forces of attraction to the initial position force, and a gentle sway normally used to make the visualization of the pedestrians better. Figure 9 shows a basic scenario where uncooperative pedestrians interfere with bidirectional flow and create disturbances. The uncooperative entities are attracted to their initial position (using the attraction force to the initial position, and a gentle sway force).
Non-cooperative pedestrian scenario.
Based on this modification, Figure 10 shows a case of non-cooperative behavior of pedestrians blocking a passage. The ideal pedestrian would pay attention all the time to their surroundings. By pre-emptively and carefully retaining their PS, they should be able to avoid most collisions and disruptions to their intended motion. We see such efficiencies in busy crossings, where hundreds of pedestrians with competing trajectories can cross smoothly. However, unlike clearly visible and static obstacles in the scene (e.g., wall, vegetation, park benches), stationary subgroups in the crowd can be more difficult to detect in a dense scenario until close to that group. Figure 10 shows such a case for a bidirectional scenario in a 3.5 m hallway. The figure shows how a few pedestrians standing still could cause significant congestion.
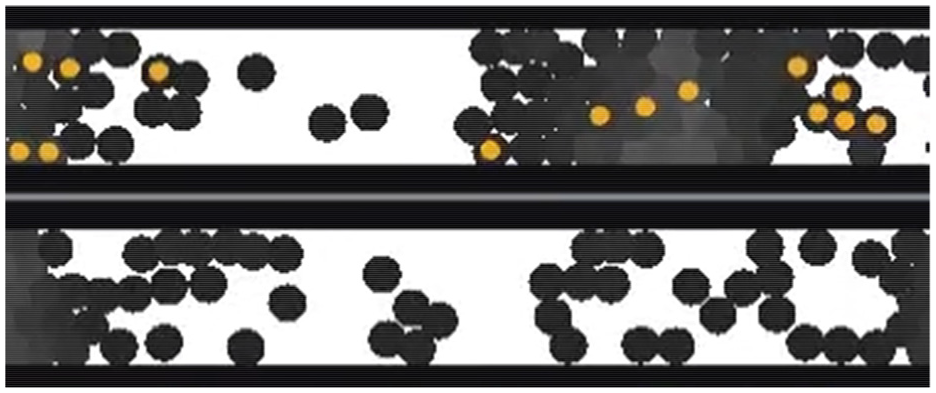
(a) Entities standing still; (b) same simulation time instance with no blockage.
As expected, the pedestrian flow rate across the hallway is decreased: we observed a reduction by 40% on average. The clogging behavior matches observed behavior in narrow hallways 38 involving uncooperative agents. Our 2D compressible PS kernel permits smooth passage for many entities, but over time, the density pileup overwhelms the compressibility threshold of the PS kernel (a threshold that varies stochastically across entities) and thus creating a congestion that slows the flow rate significantly until completely stopping for the previously mentioned 36%. An intuitive way to visualize this phenomenon is to imagine that eventually, the congestion leaves a single lane that is one entity-wide, and now both directions of flow need to alternate in sharing that single path. Thus, many entities will wait until that lane frees up, or the overall density dissipates to the point that compressibility will allow for other lanes again.
When a much wider 40 m corridor was simulated, as shown in Figure 11, we could observe interesting emergent behavior. As expected, the area surrounding the uncooperative group (for instance, a group of friends chatting in the middle of a crowded area) experienced congestion. However, later in the simulation, we observed multiple pockets of congestion forming away from the initial group. These secondary masses of congestion result from the diverted traffic concentrating on the new limited space. A high pedestrian flow rate will cause pockets of congestion to inevitably form across the width of the corridor. This observation agrees vehicular accidents in one lane can cause traffic to slow down and potentially congest across the width of the road, due to the decreased traffic bandwidth (i.e., available lanes).
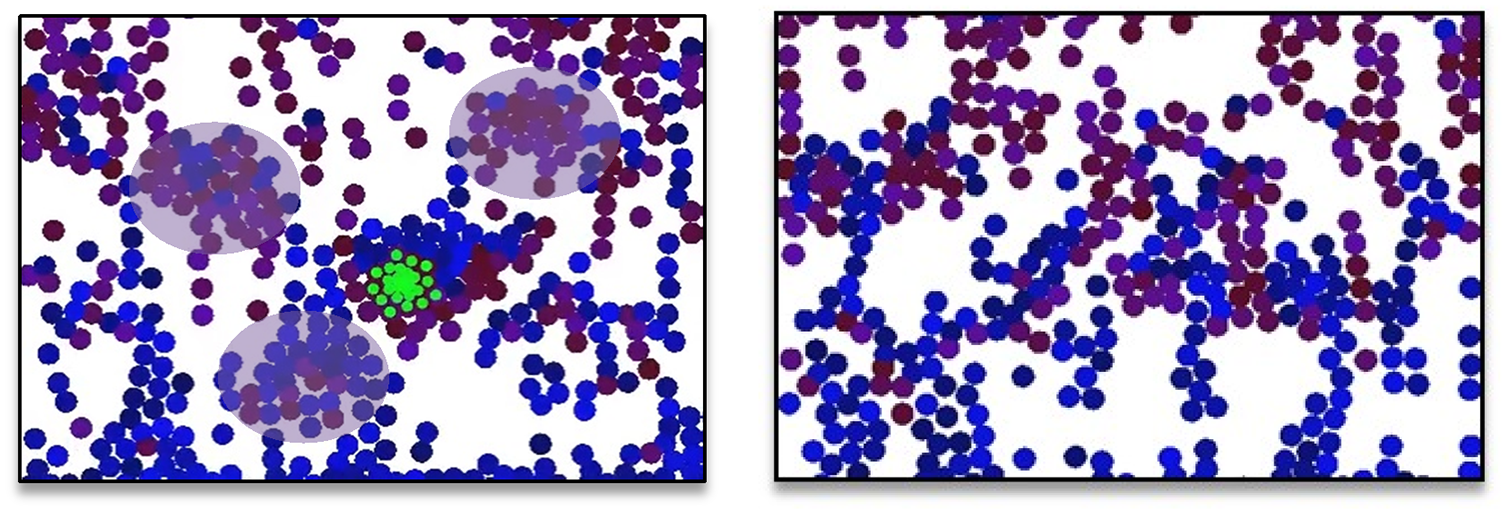
North-south bound bidirectional flow. Left: entities disrupting the flow by standing still. Right: an unimpeded corridor captured at the same simulation time as the left scenario.
4.3. Distracted pedestrians
The next phenomenon modeled as a new extension to CPD included distracted pedestrians. It is known that distracted pedestrians can cause injury to themselves and others. Large events are tricky to navigate as it is, and the possibility for slight collision (shoulder rubbing) is reasonable to expect. Therefore, we wanted to simulate how distracted pedestrians might make navigating such events even harder. One of the causes of such distracted behavior is pedestrians using their cell phones.39,40 This is a serious enough issue that the experiments from the literature recommend that cities with high pedestrian traffic should consider and implement a ban on cell-phone usage at street crossings. 41
To model this behavior, we modified our asymmetric PS kernel (which is an extension to the basic PS behavior presented in Figure 2) to represent the PSs of distracted pedestrians as in Figure 12. We introduce a distraction period argument, during which the speed of the pedestrian slows down to 40% 39 and the PS weight map is culled to match the reduced visibility ahead of the distracted entity, as shown in Figure 12.
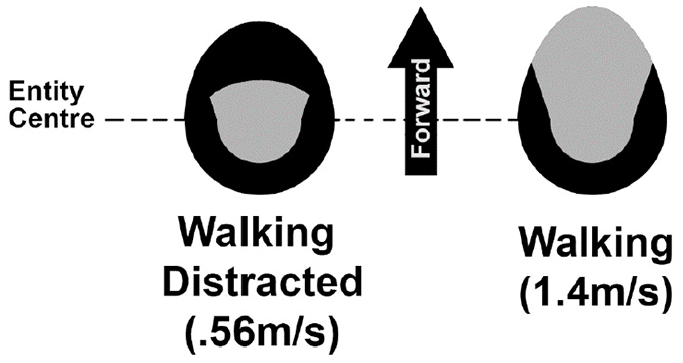
PS weight map for a pedestrian distracted on their phone (left) is culled from the front due to lack of visibility, in contrast to a normally walking CPD kernel.
We also introduced a collision detection system. PS truncation happens because the pedestrians are looking down at their phones, so they will have less forward and peripheral range of visibility. Since a distracted pedestrian’s PS is reduced, they tend to reduce their movement speed to give themselves more time to react to obstacles. The comfort speed of pedestrians was reduced by about 50 percent to mimic their behavior in real life. This reduction is overall and dynamic since an entity’s speed also depends on the crowd density and on the maximum speed. As for the collision detection system, this was to search the immediate neighborhood of each entity. If an intrusion is detected, the collision-avoidance force is activated to repel the entity in a direction opposite to the occurring intrusion. After the reduction in PS, the centroid of the entity is recalculated and shifted to account for the reduction in PS. Consequently, collision avoidance will be delayed until a bigger intrusion has happened, which gives the entity less time to react to that intrusion.
A collided state is applied to an entity if a certain degree of intrusion has been recorded in its PS. The amount of intrusion required to go into a collided state is chosen in a way that disregards minor collisions such as shoulder rubs, and only accounts for serious collisions that have an impact.
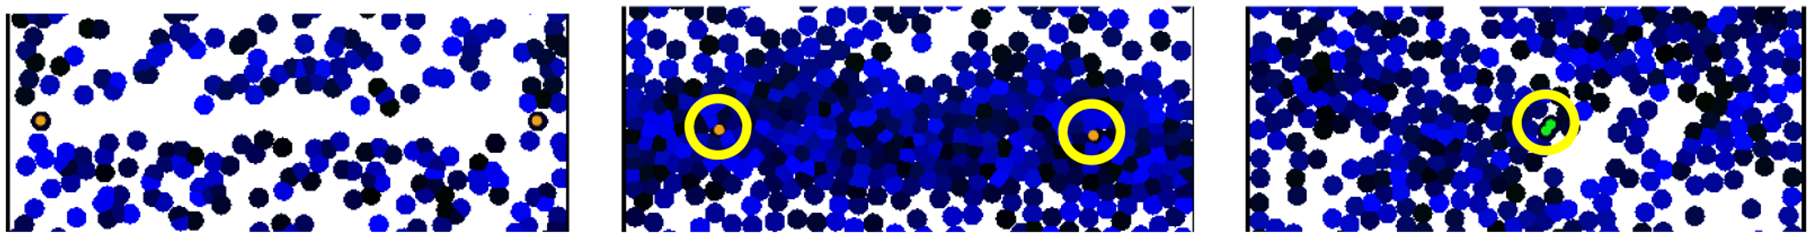
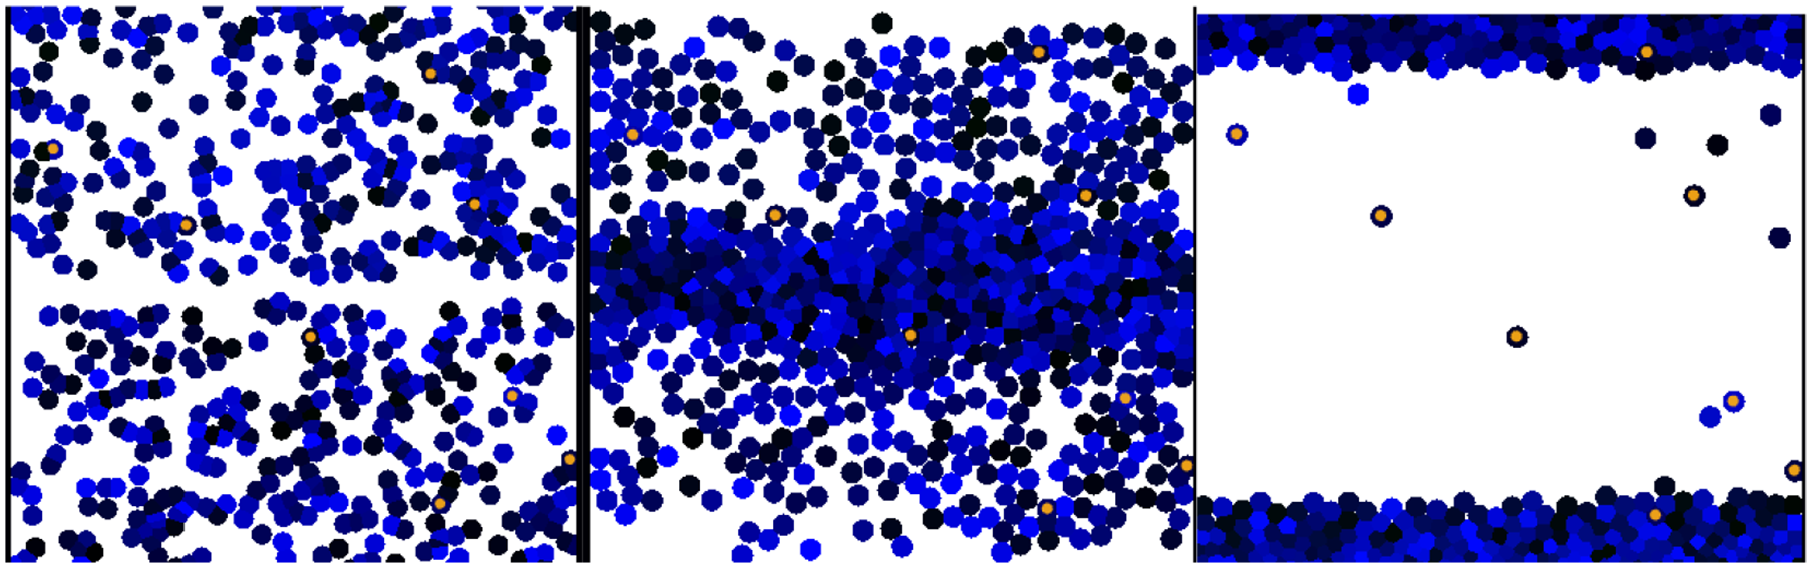
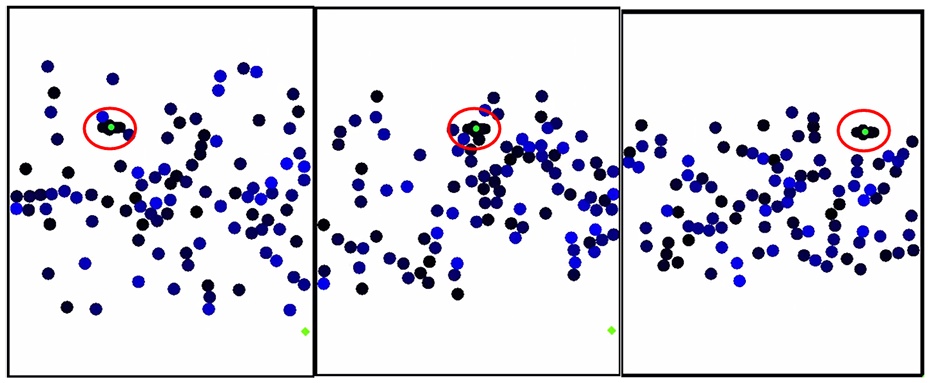
The first set of simulations, presented in Figure 13, are performed in a crowd with a bidirectional flow. The crowd size affects the crowd density and the amount of space available for each pedestrian. Multiple simulations were done by varying the total crowd count and the distraction ratio or the canvas width. The total collision count was measured for all simulations.
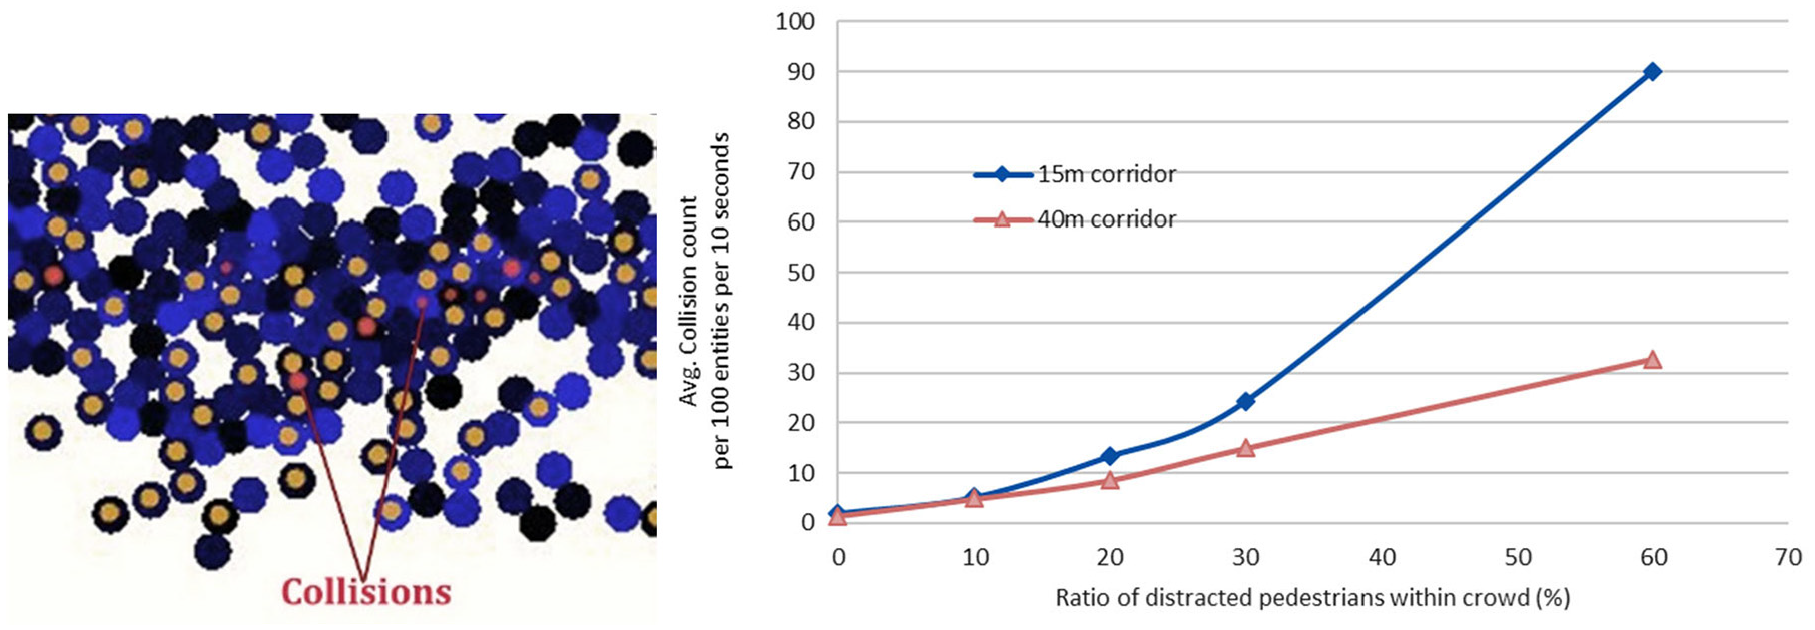
Collisions highlighted.
In the absence of any distracted pedestrians, only a handful of instances of high collision likelihood have been observed. The count increases exponentially as the ratio of distracted entities increases within the dense crowd, as seen in Figure 14. These collision counts were also inversely proportional to corridor width; not due to increased bidirectional flow density, but rather due to the lack of additional space for undistracted pedestrians to perform their avoidance maneuvers. Collisions counts were much less pronounced in unidirectional flow, where the biggest effect was instead the slowdown of surrounding entity motion.
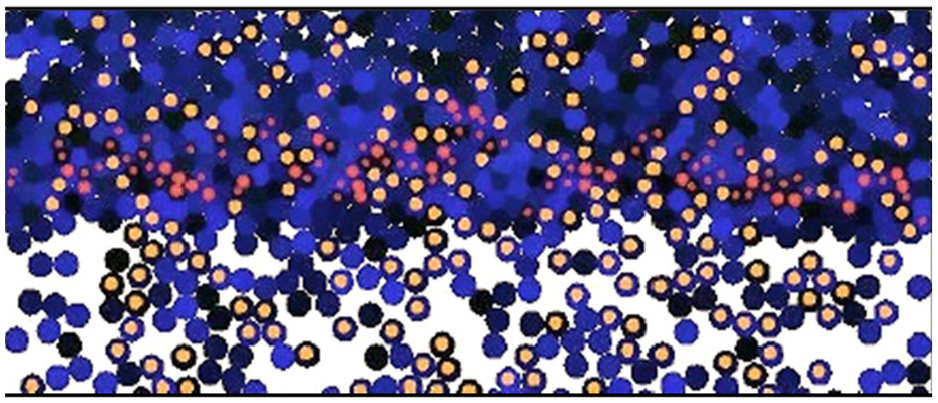
An example of 30% distracted pedestrians in north-south bidirectional flow. Red indicates detected instance of high likelihood of collision. Orange indicates all distracted pedestrians.
That can be explained by observing that relative velocities between the entities are on average less than the relative velocities in bidirectional flow, which gives fully aware entities a larger amount of time to react and maneuver around the distracted crowd when needed.
4.4. Competition
Another set of modifications included competitive pathing to illustrate the potential use of CPD in an architectural/urban design context to address anticipated dense-crowd issues. The scenario to be discussed is an artificial setup, where entities are initially arranged equally around a ring. Each entity’s target is to arrive at the opposite side of the ring. There are no other global paths and no organized grouping. This setup is designed to assess an algorithm’s ability to manage the least optimal configuration: all pedestrians are headed into each other, and all are competing for the center of the ring to reach the other side in the shortest path possible. Such scenarios can be seen in real case scenarios; indeed, major crossings such as Shibuya (Figure 1) can display such a massively competitive pedestrian scenario. Figure 15 shows the results of the crowd motion at various time instances. Figure 15(a) shows the results for an aggressive crowd, in which the average density experienced by all entities is 3.3 ft 2 /pedestrian, with a peak density of 1.75 ft 2 /pedestrian. Figure 15(b) shows low aggression crowd with an average density of 3.4 ft 2 /pedestrian and a peak density of 1.92 ft 2 /pedestrian). Figure 15(c) introduces a cylindrical architectural artifact at the center of the ring with a low aggression crowd (average density: 3.3 ft 2 /pedestrian; peak density: 2.5 ft 2 /pedestrian). These different behaviors are obtained by varying parameters in the CPD equations presented in Hesham et al.: 27
a) High aggression: the individuals display higher-than-default drive toward the destination and lesser regard for the PS violations. Additionally, the entities are highly resistant to paths that deviate from the optimal route (i.e., straight through the center of the ring). Hence, we can see heavy congestion and a pattern where some entities pierce through the others to get to the other side.
b) Low aggression: the individuals display higher regard for PS violations than the aggressive entities in (a). They are also more receptive to deviating from the optimal path.
c) A round obstacle is inserted at the center of the ring, with the entities maintaining their low aggression parameters.
In the last scenario, as if gently guided by the obstacle, a cyclone pattern quickly forms and facilitates the crowd’s collaborative turning motion. It might be counter-intuitive to think that an obstacle would ease traffic, but this is an example where architectural design can experiment with ways to help guide flow without explicitly designating single-way lanes. In-lab experiments confirm the possibility of crowd motion shaping solely through passive obstacle design. For instance, it turns out that forcing queue lines to form near a congested gate will emergently reduce the peak experienced density; 42 also, counter-intuitively, a column placed near (but not blocking) a gate will improve its flow rate and reduce experienced density. 38 This shows how CPD can complement and integrate with the recent trend of generative design (i.e., design-by-optimization) in the field of architecture and urban design. 43
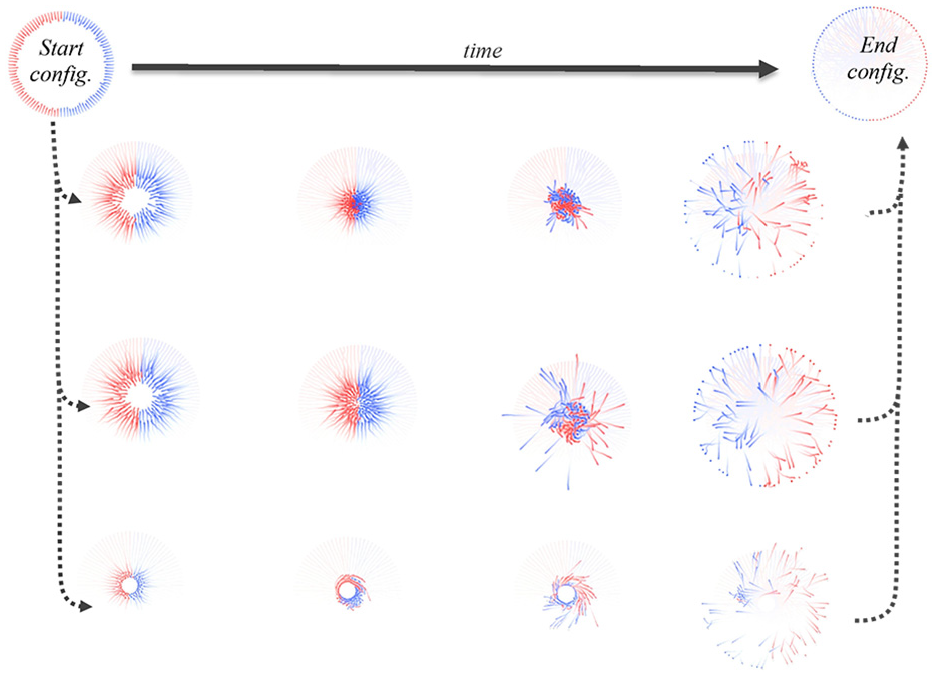
Concentric crowd motion under different parameter values.
4.5. Heterogeneous crowd and multi-layered PSM
The centroidal force computed a locally preferred bearing and direction of motion for the entity to restore its PS. However, acting on that centroidal “preference” can be left up to the entity and its constraints. Human motion is quite flexible with the ability to turn in-place if needed. To extend the simulation to non-human and heterogeneous entities sharing the same simulation space, we can still compute the centroidal forces as we did with humans, but the mechanics of following that centroidal “preference” to compute the relevant forces might differ for each kind of entity (e.g., strollers, shopping carts, bikes, vehicles).
Those other kinds of entities will use the same rules about PS update but execute those maneuvers under their own physical constraints (e.g., a bike or a car will have a turning radius compared with a human’s ability to turn on the spot). To complement this effort, other methods for computing the Voronoi PSM must be evaluated, since the scene might include lengthy entities whose centroid is no longer a concentric point, but possibly spine segment. In this case, the jump flooding technique 44 might be a suitable alternative to Voronoi cones.
We extended the CPD method to allow polygonal objects such as vehicles and shopping carts. To do so, we built a 3D cone around a 2D object that can be staged by a Minkowski sum approach. The idea is that, for a given two sets P and Q, the sum P ⊕ Q is constructed by considering a secondary polygon on multiple segments around each vertex of the primary polygon. The segments of the convolution will form several closed polygonal curves, generally represented as convolution circles. Based on the convolution circles of P and Q polygons, we compute the winding numbers which represent the faces formed by Minkowski boundary (Figure 16). 45
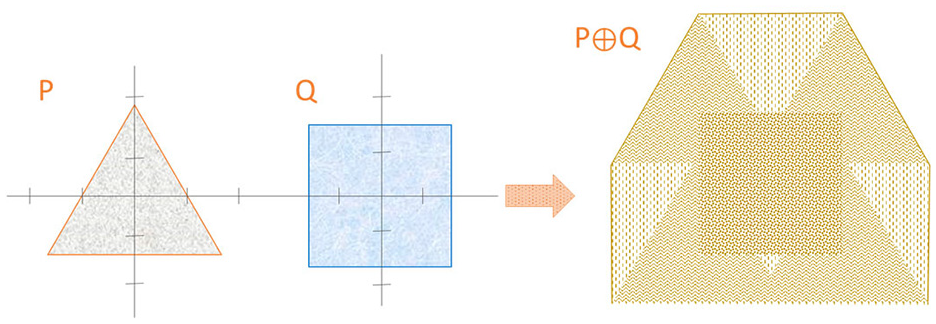
Minkowski sum representation of a triangle and a square.
These models needed to be included in the heterogeneous environment, which is different from the traditional homogeneous setup (where the entities are all humans represented as circles). With heterogeneity and n-sided polygon profiles, we need to compute the geometric center of their shape, to account for irregular shapes and to allow them to stand still when no external forces are experienced:

The CPD method uses a global PSM to mask over the defined space and to accelerate the nearest entity search by carefully pointing and calculating its short-range directional vectors. The VoroForce is used to compute the response to a local violation to PS. In order to balance the local response against the intended global path, we used a VoroForce that has to be specifically defined such that the resultant path has to be either 1 or 0. Equation (1) represents this motion, and we integrated the equation into the net VoroForce entity system to mimic a real-life behavior, like the one observed in vehicles or objects. Here, the
The entities are modeled after this governing force in the form of a linear force in the direction of the centroid. Based on this approach, PS uses a geometrical approach. It is computed over the entire defined scene of simulated obstacles, vehicles, and entities, as seen in Figure 17. The resulting force
Representation of an entity experiencing a net force f from global path force g and collision penalty force p.
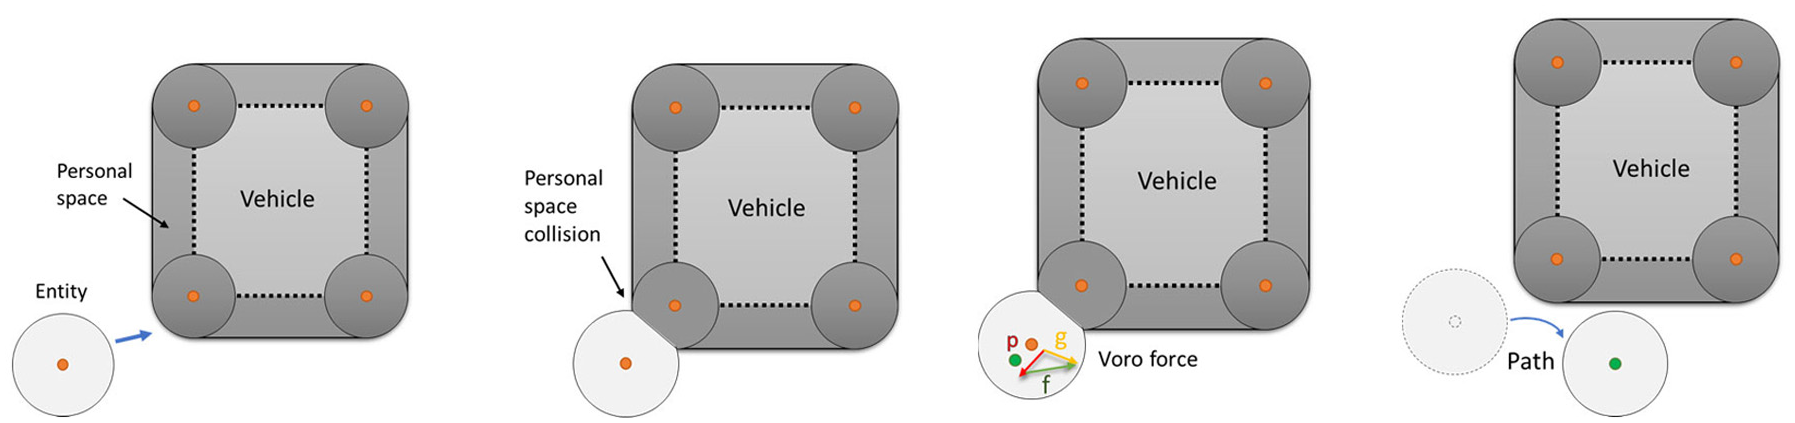
The first scenario in Figure 18 shows a motorcycle (in a circle) trying to pass through a dense crowd. In this scenario, a motorcycle is trying to pass through a dense crowd count of 100 from left to right while half of the crowd is moving from bottom to top and the remaining 50 entities are trying to move from top to bottom.
Motorcycle crossing through crowd moving in a bipolar direction.
In the next set of experiments, an ambulance is trying to cross the path from left to right through entities moving in a bipolar direction. In Figures 19 and 20 we can observe an ambulance (in a circle) and a tail-side empty space. As in real-world scenarios, the crowd do not have any option to step aside from an ambulance that is passing. When this happens, we can notice that people do not tend to go behind the back of ambulance just because of available empty space. We can notice such emergent behavior in the simulation justifying the assumed geometrically defined forces and parameters for the simulation.
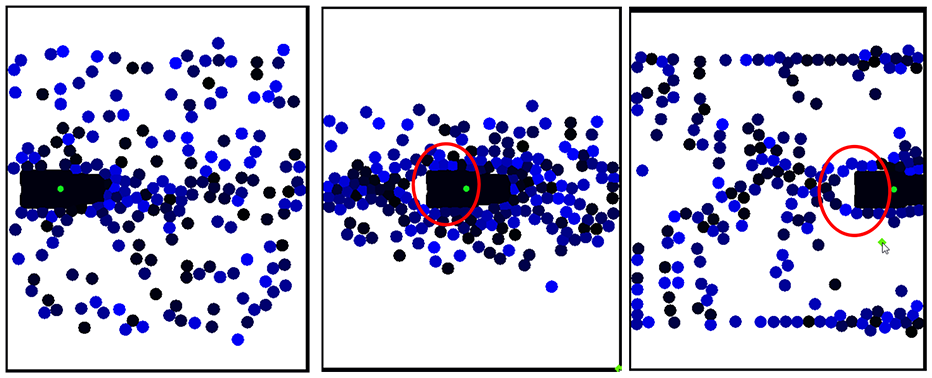
Ambulance trying to pass through 200 entities; tail space caused due to the movement.
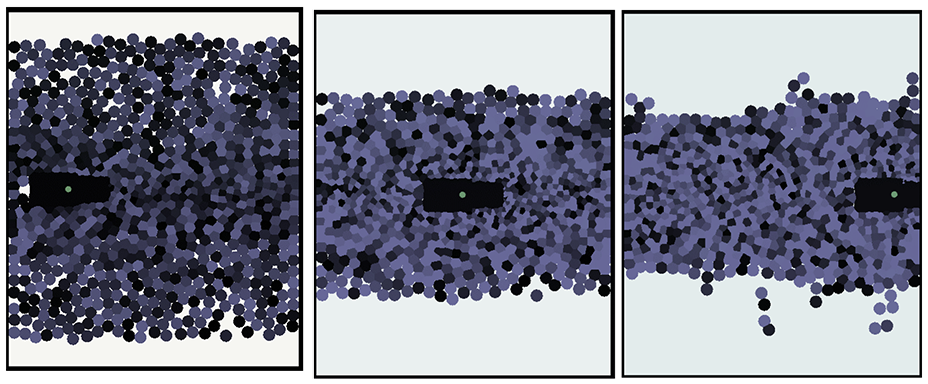
Simulation with an ambulance trying to pass through 900 entities.
This simulation was run multiple times to get an averaged value of the vehicle crossing time. Changing the crowd count varying from 100 to 900 entities represented in the same scene, this increase in crowd count is used in this case to simulate dense crowd situations and behavior among the crowd under high reduction of PS and the unwanted introduction of a vehicle to the scene.
The simulation demonstrates how the crowd interacts with moving traffic, representing a truly heterogeneous environment. The barricades are forcing the crowd to take a detour and causing a stream of individuals. The entities are colliding with the vehicle’s PS and altering their directional vector path as per geometrically defined VoroForce. Though the net force of combined entities is overwhelming the vehicle, the vehicle prefers to keep its destination vector and chooses to ignore in recalculating its resultant destination path. Moreover, the entities are in a free flow and choose to favor the resultant VoroForce derived from resulting vectors. This experimental simulation of such a scenario is visually appealing and mimicking a situation akin to real life. This opens the possibility of future opportunities in creating multi-lane traffic junctions and traffic simulations that are highly customizable and scalable.
5. Discussion
The application of our research and its proposed CPD method so far has been the film, gaming, and serious education industries. But safety-critical applications such as civil planning, crowd control, and large-scale event threat assessment stand to benefit the most from dense-crowd simulation research. Our method uses empirically driven parameters to produce visually convincing emergent behavior. We echo our earlier assertion that crowd-path modeling is essentially an exercise in abstraction with no precise microscopic “ground truth” to converge on. According to the established wisdom in crowd M&S literature (extensively surveyed in Shi et al.) 46 , the very concept of data-validation in the context of crowd simulation is not without its criticism. The first critique comes from fire-safety literature, 47 which brings attention to the absence of an international standard for the verification and validation of evacuation models, and that the definition of “validity” is itself still ambiguous and can carry different meanings and differing levels of acceptable rigor to different experts in different fields. They argue that the problem is further compounded by the M&S literature’s tendency to “validate” against data “outside their original context of use” (e.g., building evacuation data being used to validate ship or stadium evacuation models). Another critique comes from the field of neurocomputing, 48 which presented crowd-trajectory data captured in lab settings; and it argues that collision-avoidance methods in general should take empirically captured macroscopic statistical “truths” into account when deriving their microscopic model. That is, instead of calibrating some abstract model parameters and “hoping” to validate the model by achieving certain macroscopic properties that match the statistical data, it is argued that those learned macroscopic truths should be known to the microscopic model beforehand, and thus guaranteeing the desired emergent macroscopic properties. This is a bit too restrictive, in our view, and it encourages a model that departs from the way that actual pedestrians process their surrounding stimuli and make collision-avoidance decisions locally. Their recommended approach means that each virtual pedestrian would have knowledge about the surrounding aggregate dynamics than the real pedestrian entity it supposedly models.
State-of-the-art methods that share our target application of real-time crowd dynamics for film, gaming and education (methods such as WarpDriver, ORCA, RVO, Social Forces, discussed in Section 2) struggle to reproduce believable microscopic effects, particularly in dense bidirectional flow scenarios, due to the emergent lane rigidity or artificial congestion. One of the causes for their artificial congestion is the rigid 1D separation distance between entities. In contrast, CPD models use a compressible 2D area.
6. Conclusion
We presented advanced models based on CPD, an agent-based short-range collision-avoidance model for pedestrians in dense crowds. We have shown our model’s ability to reproduce visually convincing emergent crowd phenomena that show high congruence to real pedestrian trajectory data. We introduced extensions to the CPD model for crowd modeling and simulation that address the addition of vehicles, motorcycles, and obstacles entities into a single system, making it heterogeneous. 49 We added the Minkowski sum approach, flexibility for adding foreign objects and simulating traffic scenarios. The developed engine displays potential to simulate multiple scenarios of vehicle and crowd interactions. We made use of some of such scenarios and reviewed in-depth analysis on each case while keeping the global variables fixed as per defined geometrically derived variables and global path parameters. The tool used in simulating has the potential for prototyping interactive simulations and cross-platform flexibility.
Our explicit 2D approach to modeling PS meant that it can be edited and modified visually and intuitively (e.g., culling the front of a PS cone for pedestrians distracted on cell phones). Additionally, the PSM computation allows for arbitrary shapes, affording high flexibility of scene walls, obstacles and barrier designs, a favorable property when simulating crowd motion in architectural and urban design contexts. The inherent compressibility of our PS model meant that it accommodates dense scenarios correctly as opposed to existing methods that treat the PS as a rigid 1D separation distance leading to artificial congestion and unnecessary clogging of pathways.
From the simulation results, the vehicles are leaving a trail of empty space upon forward movement which resembles a real-life scenario. Likewise, the simulation results show that upon increasing the density of the crowd, the vehicle’s movement is restricted. Based on this result we can determine which are the upper limits of the crowd density that will lead to a traffic jam situation. For future development, gathering more statistical data from real-life events or social experiments will greatly improve the behavioral patterns used in these heterogeneous simulations.
Footnotes
Acknowledgements
We thank Moustafa H. Fouad and the Molecular Imaging Probes and Radiochemistry Lab at the University of Ottawa Heart Institute for their insights regarding the physiological origins of PS; M. Van Schyndel, S. Janapalli, Princy, Walter Aburime, Ziyad Rabeh, and Shashi Bhushan developed some of the models presented.
Funding
The author(s) disclosed receipt of the following financial support for the research, authorship, and/or publication of this article: This research was partially supported by NSERC.