
Abstract
This study investigates the use of recycled steel fibers (RSF) derived from waste tires as reinforcement in cementitious mortar composites, assessing both mechanical performance and internal structural integrity. Four mortar mixtures containing 0%, 0.5%, 1.0% and 1.5% RSF by volume were prepared and tested at 28 days using compressive and flexural strength testing alongside a suite of ultrasonic diagnostic methods including ultrasonic pulse velocity (UPV), the nonlinear parameter β, the sideband peak count index (SPC-I) and the spectral dissipation index (SDI). UPV measurements remained largely unchanged across all mixtures at 3200 to 3400 m/s revealing its limited sensitivity to fiber-induced microstructural changes. In contrast the nonlinear parameter β and hybrid parameter SDI both exhibited a distinct U-shaped trend with minimum values recorded at 1.0% RSF signaling optimal fiber distribution and matrix integrity at that dosage. At 1.5% RSF both parameters increased, suggesting the onset of fiber clustering and microstructural deterioration. SPC-I showed a moderate correlation with compressive strength while its minimum at 0.5% RSF reflects defect-dominated behavior at low fiber content rather than an optimal dosage. Statistical analysis confirmed there was no significant difference in compressive strength between the 1.0% and 1.5% dosages with a p-value of 0.51. The convergence of near-maximum mechanical strength and minimum nonlinear ultrasonic response at 1.0% RSF collectively identifies this as the optimal dosage. One methodological consideration worth noting is that different material batches from the same supplier were used for each dosage level to reflect real-world commercial variability. This introduces a batch-dosage confounding effect that may limit the broader generalizability of the findings. Nevertheless, convergent evidence from multiple independent measurement techniques supports the conclusion that dosage is the primary influencing factor within the tested material range.

Keywords
1. Introduction
The construction industry faces unprecedented pressure to reduce its environmental footprint while maintaining or enhancing structural performance standards. This challenge has catalyzed extensive research into sustainable materials that can simultaneously address environmental concerns and meet demanding performance requirements. Among the most promising developments in this field is the utilization of recycled steel fibers (RSF) extracted from waste tires as reinforcement in cementitious composites. RSF offers dual benefits: waste reduction from landfills and improved structural performance. This approach aligns with circular economy principles and modern sustainable construction practices. Recent years have witnessed a strong drive toward incorporating recycled materials such as demolition waste, recycled aggregates, and recycled fibers into concrete and other construction materials, with numerous studies demonstrating that these sustainable alternatives can be used in structural applications without sacrificing performance. 1 Another example is recycling incinerated sludge ash (ISA) as a supplementary cementitious material, which improves waste management, but its low reactivity can limit cement hydration, and its porous structure can increase drying shrinkage. 2 Within this context, RSF recovered from waste tires have attracted considerable attention as concrete reinforcement for their potential to improve mechanical behavior, enhance durability, and yield significant environmental benefits. RSF in concrete serves as discrete reinforcement that bridges cracks and redistributes stresses, thereby increasing the tensile, flexural, and shear capacity of the composite. 3 The mechanical performance benefits of RSF incorporation have been extensively documented across multiple research investigations. Early work by Aiello et al. 4 demonstrated that adding RSF can improve pull-out resistance, compressive strength, and flexural toughness of concrete by up to approximately 30% compared to an unreinforced mix. Subsequent studies have reported similar gains, with Centonze et al. 5 observing 15–25% higher flexural strength and greater energy absorption with RSF, while Liew and Akbar 6 noted that the post-cracking performance of RSF-reinforced concrete can rival that of industrial steel fibers, with toughness improved on the order of 20–40%. A recent comprehensive review by Zia et al. 7 further confirmed significant tensile strength improvements, typically 10–40% in split tension, when optimal fiber lengths (approximately 20–60 mm) and aspect ratios are used. The effectiveness of RSF is often attributed to the fibers’ high tensile strength and irregular, rough surface texture, which together improve fiber–matrix bonding and crack-bridging action compared to smoother commercial alternatives. 8 This enhanced interfacial bonding, resulting from the twisted and rough texture of RSF, leads to approximately 25–30% higher flexural toughness in concrete applications. Carbon black coated polypropylene (PP) fiber cement composites offer a cost-effective self-sensing material. These composites enable structural health monitoring in concrete structures and maintain practical performance under service conditions. 9 Similarly, the rough surface texture and residual coatings on RSF enhance interfacial bonding, contributing to improved stress transfer and crack control capabilities.
Multiple studies have identified an optimal fiber content around 0.5–1.5% by volume, beyond which additional RSF yields diminishing returns due to fiber clumping and workability issues. 10 This optimum corresponds to roughly 1% fiber volume, at which flexural strength gains peak (on the order of 20–40% above plain concrete) before excess fibers cause matrix congestion. The underlying effectiveness of RSF is often attributed to the fibers’ high tensile strength and irregular, rough surface, which together improve fiber–matrix bonding and crack-bridging action. Beyond mechanical performance, RSF markedly improves the durability of concrete in aggressive environments. Because the steel fibers bridge microcracks and limit crack growth, they reduce the loss of harmful agents such as chlorides and moisture, thereby slowing deterioration processes. Frazão et al. 11 reported that concrete with RSF experienced 15–20% lower reinforcement corrosion rates under chloride exposure compared to plain concrete. Similarly, RSF-reinforced concretes retain more strength after freeze–thaw cycling, with Carrillo et al. 12 finding an increase of about 10–15% in residual strength after repeated freeze–thaw cycles relative to mixes with no fibers. In terms of sustainability, RSF offers compelling environmental advantages for civil engineering applications. Using recycled steel tire fibers diverts a significant waste stream from landfills and reduces the need for energy-intensive production of new steel fibers. Pilakoutas et al. 13 estimated that repurposing tire-derived steel fibers on a large scale could cut down tire landfill volume by 10–15% and reduce raw steel material extraction by 20–30%, particularly in regions with high tire waste. Additionally, the carbon footprint of producing recycled steel fiber is substantially lower than that of manufacturing virgin steel fiber, with Qin et al. 14 reporting that RSF production emits 50–70% less CO2 than traditional steel fiber production, yielding energy savings on the order of 30–40%. Despite these advantages, several practical challenges remain when using RSF in concrete. One issue is the variability in RSF quality due to their source: fibers extracted from waste tires can have residual rubber or inconsistent geometry, which may affect dispersion and long-term performance. Ensuring uniform fiber distribution is crucial, as at higher dosages (>2% by volume), RSF tends to clump or “ball”, leading to workability problems and voids in the mix. 6 On the other hand, RSF offers economic benefits, as recycled fibers often cost 50–70% less than commercial steel fibers, making them attractive for large-scale usage, especially in cost-sensitive projects or developing regions. 13 The reliable assessment of concrete structures, especially those incorporating novel sustainable materials like RSF, requires advanced monitoring techniques that can detect subtle changes in material properties and internal structure. Traditional destructive tests are impractical for continuous in-situ evaluation, whereas nondestructive methods provide real-time insights without damaging the material. Among these, ultrasonic testing has emerged as a crucial tool for evaluating concrete quality and detecting internal flaws, with particular relevance for fiber-reinforced composites where conventional testing methods may not adequately capture the complex interactions between fibers and matrix. Linear ultrasonic pulse velocity (UPV) technique is widely used to estimate concrete strength by correlating wave propagation speed with compressive strength development. 15 Other linear ultrasonic measures, such as signal attenuation and waveform energy loss16,17 or ultrasonic imaging methods,18,19 offer additional information on material homogeneity and internal defects. These linear ultrasonic techniques are effective for overall strength assessment since a higher UPV generally indicates a denser, stronger matrix and lower UPV can signal internal damage or poor quality.20–22 However, they often lack the sensitivity to detect early-stage microstructural changes that precede macroscopic strength loss. To capture subtle defects and incipient damage, a range of advanced nonlinear ultrasonic (NLU) techniques has been developed. Notable examples include Nonlinear Resonance Ultrasound Spectroscopy (NRUS),23,24 Nonlinear Wave Modulation Spectroscopy (NWMS),25–27 higher-harmonic generation methods,22,28,29 and acoustic emission monitoring.30–32 Each of these NLU methods can reveal micro-cracks and other forms of micro-damage that linear methods may not detect. The amplitude of the higher (second) harmonic (represented by the nonlinear β parameter) increases markedly in the presence of distributed micro-cracks or other incipient defects.33–37 Monitoring these higher harmonics through nonlinear ultrasonic evaluation thus provides an “early warning” of damage progression, capturing changes in stiffness and bonding well before they significantly affect bulk strength. Hybrid approaches that combine linear and nonlinear effects have shown improved sensitivity to micro-defects. One such hybrid metric is the Sideband Peak Count Index (SPC-I),38–42 which effectively integrates information from both fundamental and harmonic frequency content to track subtle changes in material properties. Among the various nonlinear ultrasonic indicators explored in recent studies, the Spectral Dissipation Index (SDI)43,44 has emerged as a particularly promising approach. SDI quantifies the dissipation of ultrasonic energy across the frequency spectrum, providing a detailed signature of internal friction and microstructural evolution that can be used to detect early degradation processes before they manifest as visible damage. For all the progress made in studying RSF’s mechanical and durability performance, one emerging benefit of RSF remains under-explored: its potential for integration with advanced nondestructive evaluation techniques for comprehensive material characterization. Because steel fibers are electrically conductive, RSF-reinforced concrete can form internal conductive networks that respond to strain or cracking, enabling structural health monitoring through changes in electrical resistivity. However, relatively few studies to date have leveraged advanced ultrasonic techniques for comprehensive characterization of RSF-reinforced systems or combined multiple ultrasonic parameters in a single investigation. Moreover, existing predictive models for fiber-reinforced concrete rarely incorporate the unique geometry and distribution characteristics of recycled tire fibers. Important knowledge gaps thus remain in harnessing RSF’s full potential to create smart, sustainable infrastructure that not only exhibits improved strength and durability but also can be comprehensively monitored through advanced nondestructive evaluation techniques. The present study addresses these gaps by adopting a novel integrated experimental approach that combines comprehensive mechanical testing of RSF-reinforced mortar with advanced ultrasonic characterization using linear (UPV), nonlinear (β), and hybrid (SPC-I, SDI) parameters. This integration of multiple ultrasonic evaluation techniques with mechanical performance assessment represents the first comprehensive investigation of its kind for RSF, allowing concurrent assessment of structural performance improvements and internal microstructural evolution. The study demonstrates how RSF can simultaneously enhance the mechanical properties of cementitious composites while providing detailed insights into internal material state through advanced ultrasonic diagnostics, presenting a comprehensive framework for optimizing RSF-reinforced sustainable construction materials. Sustainable construction materials present unique challenges for quality assessment. Their inherent variability and limited long-term performance records create concerns about structural reliability over time. This makes statistical methods essential for proper evaluation. Researchers often apply one-way analysis of variance (ANOVA) when comparing different mortar and concrete mixtures.45,46 They then use post-hoc tests such as Tukey’s HSD (Honestly Significant Difference) or Dunnett’s method to pinpoint specific group differences. Effect size measures like Cohen’s d help quantify the practical importance of observed variations beyond just statistical significance. 47 These analytical approaches become particularly valuable when working with recycled materials where batch-to-batch differences may influence performance.
The primary objective of this research is to determine which ultrasonic parameters, specifically the higher (second) harmonic index (β), SPC-I, and SDI, best capture strength development and fiber distribution in mortar incorporating RSF. By establishing robust correlations between ultrasonic parameters and mechanical properties, this study aims to validate the effectiveness of advanced ultrasonic techniques for quality assessment and optimization of sustainable fiber-reinforced construction materials. This study hypothesizes that an optimal RSF dosage of approximately 1.0% by volume exists to maximize composite performance, as excessive fiber content beyond this threshold may yield diminishing returns or negatively impact the mortar’s structural integrity. Through comprehensive analysis of linear, nonlinear, and hybrid ultrasonic responses, this research seeks to identify the precise fiber dosage that enhances mechanical strength while preventing internal damage. Thereby, establishing the critical balance between reinforcement benefits and potential microstructural disruption in fiber-reinforced cementitious composites. The overall experimental approach, including ultrasonic analysis, is summarized visually in the graphical abstract for quick reference.
2. Materials and methods
2.1. Materials
Chemical compositions of Type II Portland cement used.

RSF extracted from waste tires were sourced from three separate batches to represent realistic material variability in commercial RSF sources. All three batches were supplied by the same supplier (Bright Future Tyre Recycling Factory, Qatar) using identical tire-derived steel fiber extraction processes. This ensures fundamental material similarity while introducing the realistic batch-to-batch variability encountered in commercial RSF sources. Designated as Batch A (0.5% dosage), Batch B (1.0% dosage), and Batch C (1.5% dosage). All fiber samples showed typical tire-derived characteristics with diameters ranging from 0.2 to 0.3 mm and lengths between 10 and 60 mm. The RSF from each supplier displayed the rough, irregular surface texture expected from the tire extraction process, with some fibers retaining residual rubber or brass coatings that enhance mechanical interlock within the cement matrix. The SEM and Optical images shown in Figure 1 demonstrate the rough surfaces of the RSF. a) SEM image of RSF embedded in mortar mix. b) Optical image of RSF embedded in mortar.
2.2. Mortar mix design
Mix Design of the mortar with different RSF dosages (RSF % by volume of mortar).

Quantitative characterization of RSF from three supplier batches.

aANOVA on mean AR values computed from Table S1 data.
Note. Mean AR (L̄/D̄) is computed by dividing the batch mean length by the batch mean diameter; it does not represent the most commonly occurring fiber geometry. Modal AR is the peak (most frequent) bin in the full individual-fiber AR distribution shown in Figure 13, which measures actual L and D values for each fiber individually. The large discrepancy between mean AR and modal AR especially for Batch A (mean AR ≈ 130 vs. modal AR 280–300), arises because Batch A’s individual fiber length distribution is strongly right-skewed: many fibers are simultaneously near the upper length extreme and near the minimum diameter, producing a modal AR far exceeding the ratio of mean values. Batch C presents the inverse: mean AR is highest (≈142) because the mean length is longest, yet the modal AR is lowest (50–60) because the most frequently occurring fibers in Batch C are short relative to their diameter. These opposing skewness patterns are batch-specific manufacturing characteristics. Since each batch was used at only one dosage level, these AR distribution differences are confounded with dosage (see Section 5.4).
The ANOVA p-value of 0.31 confirms no statistically significant difference in fiber length distributions among batches at the 95% confidence level. However, a non-significant p-value does not formally prove batch equivalence; it indicates insufficient evidence to reject the null hypothesis of equal means. The high coefficients of variation (44-53%) reflect substantial within-batch variability inherent to the mechanical extraction process of RSF from waste tires, consistent with published literature on recycled tire fibers. While the batches are statistically comparable in terms of central tendency (mean length) and geometric consistency (identical diameter distributions), unmeasured properties such as tensile strength or surface chemistry could theoretically vary between sources. Therefore, conclusions regarding optimal dosage should be understood as applying to the specific RSF sources tested, and dosage effects cannot be completely isolated from potential batch influences in the present design.
2.3. Specimen preparation and curing
Mixing was performed using a standardized mechanical mixer in accordance with ASTM C305 51 protocols. The dry components (cement, sand, RSF) were mixed for one minute to ensure homogeneous distribution, followed by gradual water addition and continued mixing for three minutes to achieve uniform consistency. Special attention was paid to fiber dispersion during mixing to prevent agglomeration and ensure uniform distribution throughout the matrix. Mortars were cast into 50 mm cubes (three samples per mix design) for compressive strength testing and 40 × 40 × 160 mm prisms (three samples per mix design) for flexural testing, conforming to ASTM C109 52 and ASTM C348 53 standards, respectively. The prismatic specimens were also used for ultrasonic testing to enable direct correlation between mechanical properties and ultrasonic parameters. All specimens were demolded after 24 hours and cured in a water bath maintained at 23 ± 2°C until testing at 28 days, ensuring consistent hydration conditions across all mix designs.
2.4. Mechanical Testing
Compressive and flexural strength properties were systematically evaluated following established ASTM standards to provide baseline performance data for correlation with ultrasonic measurements. For statistical reliability, three replicate specimens of each geometry were tested for every mix design after 28 days of curing, with average values and standard deviations calculated to ensure meaningful results and reliable assessment of strength variations attributable to RSF dosage effects. These mechanical strength measurements served as reference data for establishing correlations with ultrasonic testing indicators, providing a robust foundation for validating nondestructive evaluation methodologies.
3. Ultrasonic testing
Ultrasonic evaluation of mortar specimens was conducted in through-transmission mode using a sophisticated experimental setup designed to capture both linear and nonlinear ultrasonic phenomena with high precision and repeatability. The instrumentation system
54
comprised several essential components carefully selected for optimal performance in cementitious material characterization. The transducer system employed proprietary gel-coupled PZT transducers (model PW24, Pacific Waves NDT Inc.) featuring contact-surface tapered design with 10 mm diameter active faces. These transducers were specifically selected for their high sensitivity, excellent frequency response characteristics, and ability to generate high-intensity, narrow-band excitation frequencies suitable for both linear and nonlinear ultrasonic analysis. The tapered configuration focuses acoustic energy to improve measurement consistency,55,56 enhance signal penetration through the heterogeneous mortar matrix and enhance the signal to noise ratio. The schematic of the experimental set up is presented in Figure 2. Signal generation was accomplished using a computer controlled arbitrary waveform generator (AWG) connected to a PiezoDrive PD200 power amplifier. This setup provided precise control over excitation parameters while delivering sufficient power for nonlinear ultrasonic generation. All results represent averages of three readings per sample, with standard deviations reported. The excitation frequency was set at 42 kHz based on three optimization criteria. First, this frequency falls within the standard range for mortar NDT testing (20–50 kHz) recommended in ASTM guidelines, balancing signal penetration against material attenuation. Second, at 42 kHz, the generated second harmonic frequency reaches approximately 84 kHz, which remains within the transducer bandwidth (37.8–46.2 kHz fundamental, with harmonic response), ensuring reliable harmonic detection. Third, preliminary frequency sweep tests (10–100 kHz range) confirmed that 42 kHz provided the highest signal-to-noise ratio in RSF-reinforced mortar specimens with fiber lengths up to 60 mm while maintaining adequate wave penetration across 160 mm specimen length. Excitation was applied as 10-cycle sinusoidal bursts with Hanning window shaping to minimize spectral leakage and preserve harmonic content during FFT analysis. Data acquisition was performed using a high-resolution USB oscilloscope (HS5 TiePie Engineering) with sampling rates of 50 MHz and 50,000 data points per acquisition, enabling detailed capture of waveform characteristics necessary for both time-domain and frequency-domain analysis. This high-resolution acquisition system ensures adequate temporal and spectral resolution for extracting linear, nonlinear, and hybrid ultrasonic parameters with high precision. Schematic of ultrasonic testing setup for both linear and nonlinear testing.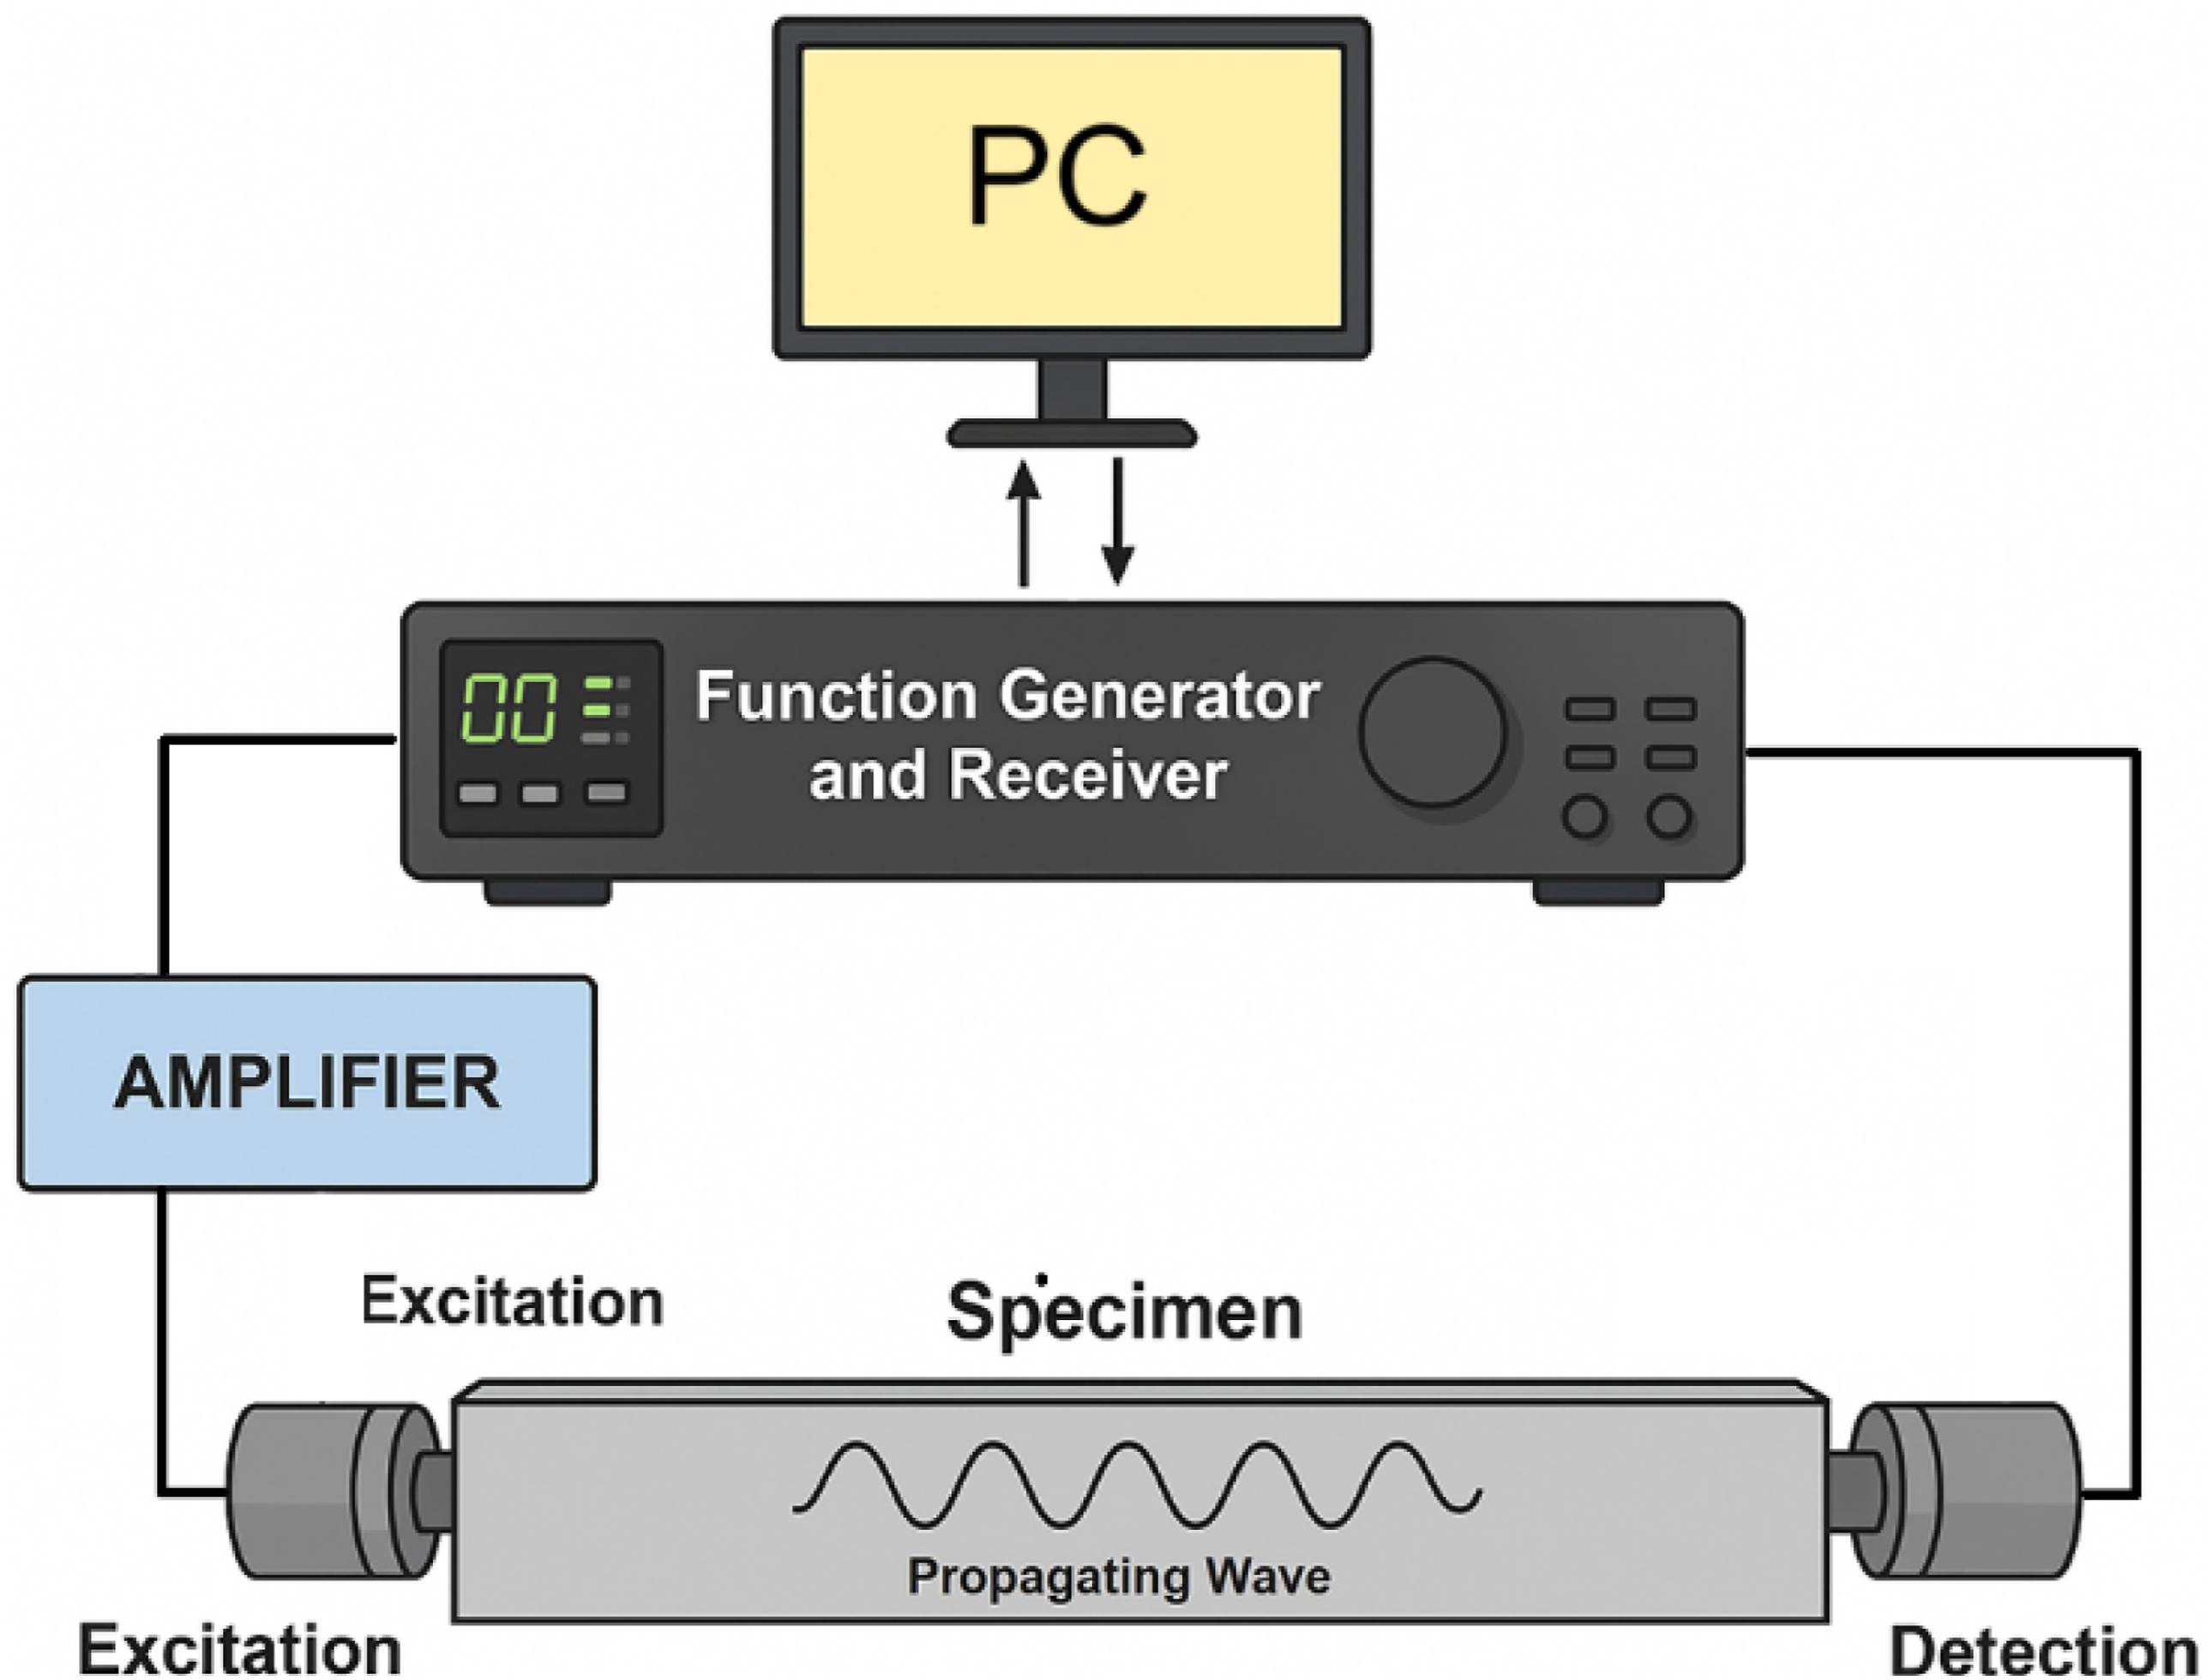
To ensure robust and repeatable measurements, strict quality control protocols were implemented. The picture of the experimental setup is shown in Fig. S1 of the supplementary information. A 3D-printed mechanical fixture standardized transducer coupling pressure to minimize manual variability as shown in supplementary information Fig. S1. A precision holder maintained perpendicular alignment and kept angular deviation under 2°. Testing occurred at a controlled temperature of 23 ± 2 °C to prevent thermal fluctuations from affecting velocity. Triplicate measurements were averaged for each specimen. Standard deviations of 2-4% for SPC-I and 2-3% for SDI confirmed high reproducibility. An aluminum reference block was tested periodically to verify system stability and rule out instrumental drift. These steps ensure that the observed variations in linear, nonlinear, and hybrid parameters stem from genuine microstructural differences rather than artifacts. Future studies should adopt similar quality assurance procedures to maintain data reliability. The key equations used for analyzing mechanical strength, ultrasonic parameters, and statistical analysis are given in section S10 of the supplementary information.
3.1. Signal processing and parameter extraction
The ultrasonic signal processing methodology employed sophisticated digital signal processing techniques to extract multiple ultrasonic parameters from acquired waveforms. Time-domain signals underwent spectral decomposition via Fast Fourier Transform (FFT) implemented through discrete Fourier transform algorithms, with signal integrity optimized through integer-cycle Hanning windowing to mitigate spectral leakage effects. Fourier analysis confirmed a spectrally pure output dominated by a main lobe centered at 42 kHz (bandwidth 8.4 kHz, FWHM: 37.8–46.2 kHz), with suppressed side lobes ensuring minimal out-of-band interference. This spectral purity is essential for isolating material-derived second-harmonic content from equipment artifacts and ensuring accurate nonlinear parameter extraction. The signal processing protocol incorporated amplitude normalization procedures to decouple harmonic content analysis from coupling efficiency and attenuation artifacts. Each spectrum underwent amplitude normalization at A1 = 1.0 (where A1 represents the fundamental frequency amplitude), enabling precise quantification of relative harmonic content independent of absolute signal levels.
3.2. Linear ultrasonic parameter: Ultrasonic pulse velocity (UPV)
Ultrasonic pulse velocity measurements were performed using time-of-flight (TOF) analysis based on cross-correlation techniques following ASTM C597 57 protocols. The methodology employed reference signal comparison and cross-correlation-based TOF detection to achieve high accuracy and reproducibility in wave speed determination. UPV calculation was performed using the relationship UPV = L/TOF, where L represents the specimen length (160 mm for prismatic specimens), and TOF is the measured time-of-flight of the ultrasonic pulse through the material. The cross-correlation approach provides superior accuracy compared to simple threshold detection methods, particularly in heterogeneous materials where signal characteristics may vary. Higher UPV values generally correlate with material continuity and density, indicating good quality mortar with enhanced mechanical properties, while lower values can indicate the presence of defects, increased porosity, or reduced matrix integrity. The UPV measurements provide baseline elastic property assessment and serve as reference parameters for comparison with advanced nonlinear and hybrid ultrasonic techniques.
3.3. Nonlinear ultrasonic parameter: Higher harmonic generation (β)
Nonlinear ultrasonic evaluation was systematically conducted to characterize microstructural evolution in RSF-reinforced mortars through higher (second) harmonic generation analysis. The experimental protocol involved monitoring the four mix designs (Control, 0.5% RSF, 1.0% RSF, and 1.5% RSF) to assess the relationship between fiber content and material nonlinearity. Spectral analysis of ultrasonic signals in heterogeneous mortar revealed well-defined fundamental frequency components (A1) at 42 ± 4 kHz alongside systematic identification of second-harmonic peaks (A2) within the 88 ± 6 kHz range through rigorous bandwidth-constrained scanning, ensuring accurate characterization rather than relying on theoretical frequency doubling assumptions that may not account for material-specific spectral characteristics.58–60 Instead of observing a single isolated second-harmonic peak, FFT spectra exhibited multiple small peaks distributed around the expected second-harmonic frequency. This phenomenon is attributed to sideband generation and nonlinear scattering effects characteristic of heterogeneous mortar, combined with the finite bandwidth of the excitation pulse.61,62 In nonlinear acoustic studies, local contact nonlinearities arising from friction at fiber-matrix interfaces and microcrack opening/closing dynamics modulate the propagating wave, producing secondary peaks (sidebands) adjacent to the main harmonic frequencies.62,63 For β calculation purposes, 64 the largest-amplitude peak within the doubled frequency range (84–92 kHz) was designated as A2, representing the characteristic second harmonic amplitude for each specimen. The nonlinearity parameter β was defined as the ratio A2/A1, quantifying the relative amplitude of the second harmonic compared to the fundamental frequency.58–60 Under unity-normalized conditions (A1 = 1.0), this simplification proves equivalent to the more complex quadratic normalization (A2/A12) established in nonlinear ultrasonics literature.60,64,65 In classical nonlinear ultrasonics, β is typically defined as β ∝ A2/A12 to account for propagation effects and amplitude dependence. However, under the unity-normalized conditions employed in this study (each spectrum normalized such that A1 = 1.0), the simplified ratio A2/A1 equals A2/A12 = A2/1.02 = A2, making both formulations equivalent for comparative purposes. All specimens maintained a constant propagation path length of 160 mm, eliminating geometric path-length effects. This normalization approach enables consistent comparative assessment across specimens and remains consistent with established theoretical frameworks.
For comparative analysis, β values were further normalized such that the control specimen (0% RSF) yielded β = 1.0, providing a standardized reference point for evaluating RSF incorporation effects.58,62 Microstructural interpretation associates elevated β values with enhanced acoustic nonlinearity from distributed defects, including microcrack networks, fiber-matrix interface degradation, and weak interfacial zones, while reduced β values indicate improved matrix integrity and reduced internal defect density, suggesting optimal fiber dispersion and enhanced material quality.64–66
3.4. Hybrid ultrasonic parameter: Sideband peak count index (SPC-I)
The SPC-I technique38–40 represents an innovative hybrid ultrasonic evaluation method that combines linear and nonlinear ultrasonic effects to achieve enhanced sensitivity for material characterization. As ultrasonic waves propagate through heterogeneous materials such as fiber-reinforced mortar composites, they generate frequencies different from the original input wave frequency due to material nonlinearity and microstructural interactions. The SPC-I methodology involves systematic analysis of the frequency spectrum of received ultrasonic signals to identify and count sideband peaks additional frequency components that arise around the main excitation frequency due to material nonlinearity, heterogeneity, and fiber-matrix interactions. These sideband peaks, which have much lower magnitude than the original exciting frequency peaks, provide sensitive indicators of material microstructural characteristics. The SPC-I calculation protocol counts detectable peaks above a moving threshold across predefined amplitude ranges in the frequency spectrum. Peak counts are recorded at various threshold levels between lower and upper amplitude limits. The average count over this range defines the SPC-I value. Amplitude threshold limits are defined based on preliminary signal quality evaluation. The lower threshold is set to suppress background noise. The upper threshold is set to capture meaningful spectral components. This dual-threshold approach maintains consistent detection sensitivity across all specimens while accommodating the high signal-to-noise ratio. Further details on SPC-I, including mathematical formulation, are discussed in the supplementary document section S6. In fiber-reinforced cementitious composites, sideband generation arises from multiple wave-material interactions. Well-bonded fiber-matrix interfaces modulate propagating waves, generating sidebands proportional to interface density and bonding quality. Progressive cement hydration and fiber incorporation create heterogeneous elastic modulus distributions that produce acoustic modulation.
3.5. Hybrid ultrasonic parameter: Spectral dissipation index (SDI)
The SDI43,44 represents an advanced hybrid ultrasonic parameter that quantifies how propagating wave energy is dissipated or redistributed across the frequency domain. While SPC-I focuses on counting discrete sideband peaks, SDI provides complementary information by quantifying the spread or dissipation of spectral energy into sideband regions and higher harmonic regions of the Fourier spectrum. The SDI methodology measures the proportion of ultrasonic energy that has been scattered or attenuated into frequencies outside the main fundamental frequency band. The fundamental mathematical relationship governing SDI is presented in the following Equation (1), expressed through the normalized spectral ratio: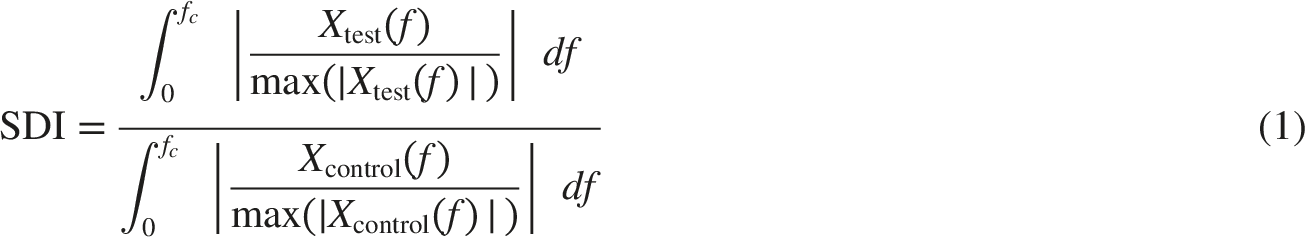
This equation compares the normalized frequency spectra of test and control ultrasonic signals up to the cutoff frequency fc, where the Fourier transform
The SDI technique excels at detecting both microscopic and macroscopic defects by leveraging complex ultrasonic behaviors including higher-harmonic generation, frictional contact interactions, and modulation-induced sidebands from breathing cracks or fiber-matrix interface effects. This comprehensive sensitivity makes SDI particularly valuable for monitoring microstructural evolution in sustainable construction materials like RSF-modified mortars.
3.6. Measurement protocols and quality control
Standardized protocols for transducer coupling, alignment, and input voltage calibration were rigorously maintained throughout all ultrasonic measurements to minimize variability and enhance measurement reliability. The parameters considered for quality control and measurement reliability are briefly discussed in section S8 of the supplementary information. Petroleum gel was applied at transducer-specimen interfaces to eliminate air gaps and optimize impedance matching, ensuring stable acoustic coupling and repeatable measurements across all trials. The measurement system was calibrated across a range of input voltages to identify optimal excitation levels that yield minimal standard deviation in higher harmonic values while maintaining operation within the transducers’ linear range to avoid spurious harmonic generation from instrumentation. Continuous triggering every 3 ms maintained temporal consistency across all measurements. Three prismatic mortar specimens (40 × 40 × 160 mm) per mix design were tested, with each specimen evaluated three times to ensure statistical reliability. Results are reported as averages with standard deviations from nine total readings per mix design (three specimens × three measurements per specimen), providing robust statistical foundation for comparative analysis. Figure 3 illustrates sample time-domain signals and their FFTs for a control mortar vs. a 1.0% RSF mortar, highlighting the presence of the higher (second) harmonic and sidebands in the RSF mix. (left) Transient signals for control and 1% RSF specimen, (right) Fast Fourier Transform of control and 1 % RSF specimen.
3.7. Validation of nonlinear measurement
To confirm the presence of genuine nonlinear wave-material interactions in the tested mortars and validate the measurement methodology, a comprehensive validation study was performed comparing the response of RSF-reinforced specimens under different excitation levels with aluminum bar (20 × 20 × 160 mm) reference specimens representing linear material behavior.
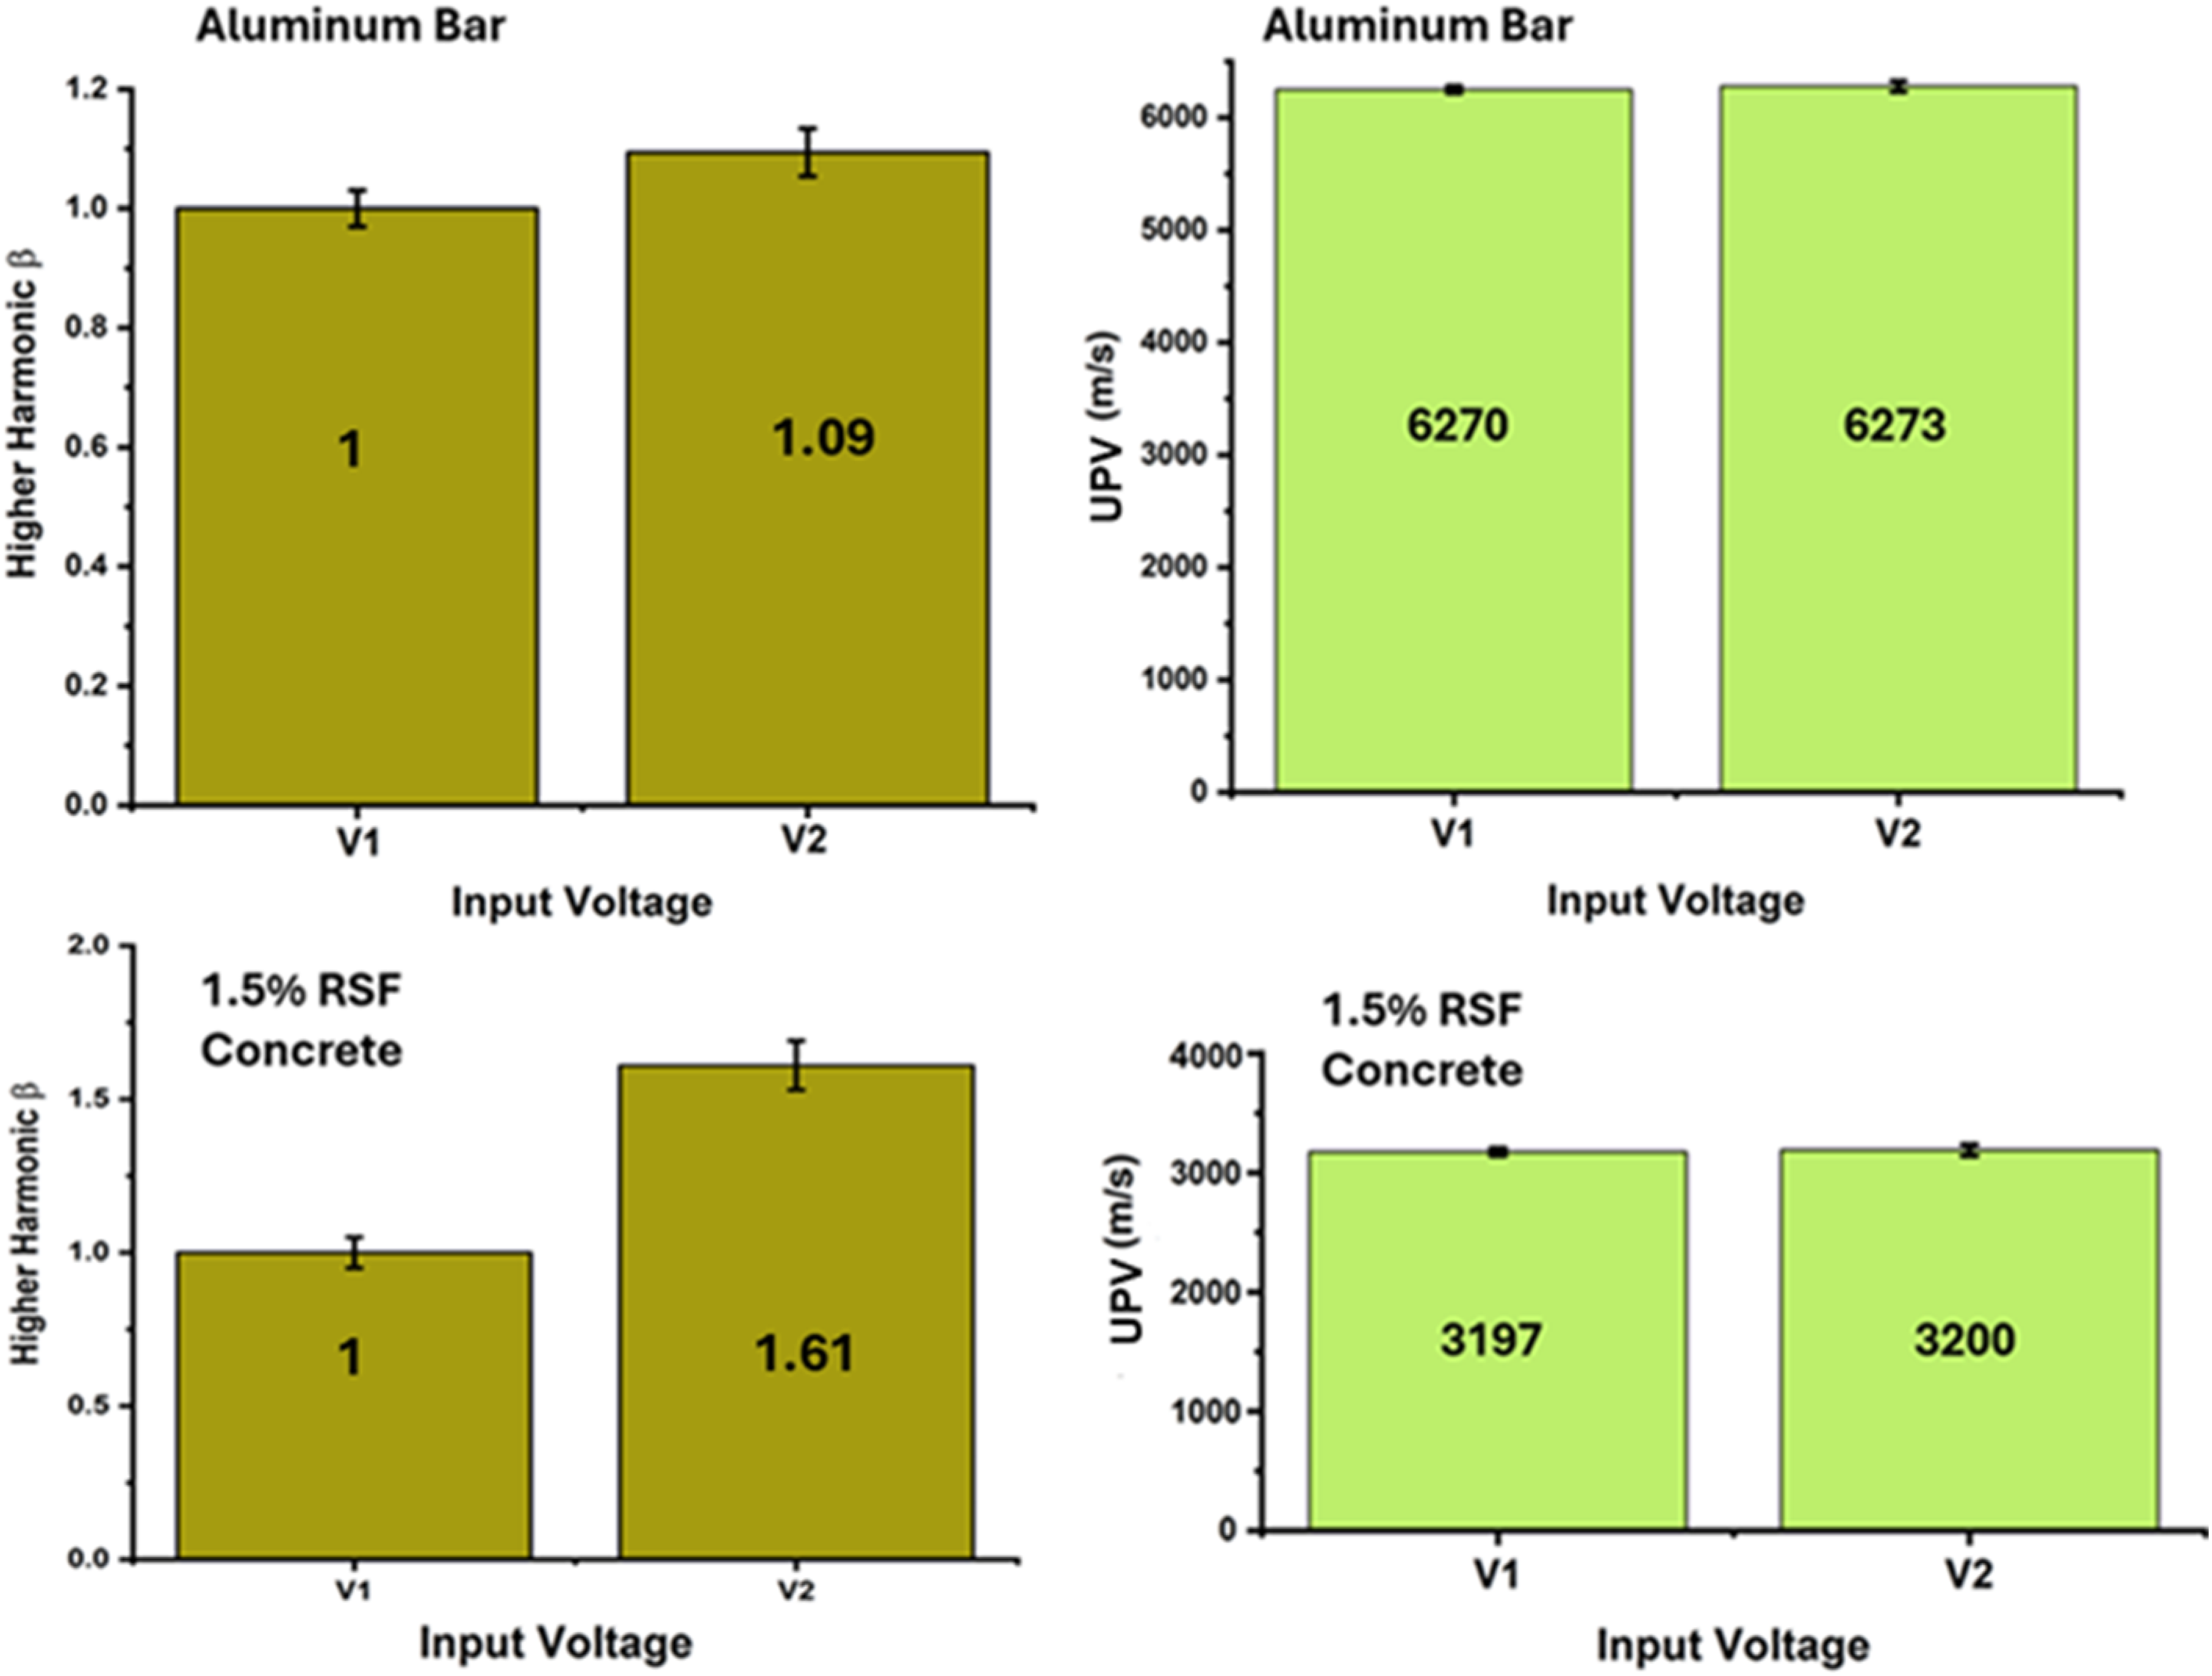
The validation protocol employed 4V and 6V excitation signals corresponding to a 50% increase in amplitude or 150% amplification (Figure 4), focusing on two key ultrasonic parameters: UPV, which reflects linear elastic behavior, and the higher (second) harmonic index (β), which is sensitive to nonlinear effects caused by microcracking and interface debonding. UPV measurements showed virtually no change between the two excitation levels for both aluminum and mortar specimens. The aluminum bar UPV values remained almost unchanged. It only changed from 6270 m/s to 6273 m/s (Figure 5), while the 1.5% RSF mix exhibited UPV values of 3197 m/s and 3200 m/s, both showing differences of less than 0.1%. This negligible variation falls within experimental uncertainty and confirms that UPV, being a linear acoustic parameter, is unaffected by changes in input energy. The higher harmonic index β demonstrated a pronounced amplitude-dependent response in mortar specimens, exhibiting significant nonlinear behavior that distinguishes it from the amplitude-invariant UPV measurements.62,67,68 The β parameter increased markedly from 1.0 at baseline excitation to 1.61 under 50% enhanced amplification (equivalent to 6 V excitation), representing a substantial 61% enhancement in higher (second) harmonic energy content, while the aluminum reference bar exhibited minimal variation from 1.0 to 1.09 (approximately 9% increase), confirming its predominantly linear elastic response.62,68 This nonlinear amplification of β in recycled steel fiber RSF reinforced mortar specimens provides evidence of genuine material nonlinearity arising from amplitude-sensitive microstructural mechanisms, including interfacial microcrack opening under tensile stress cycles, local frictional contact dynamics between fiber-matrix interfaces, and nonlinear scattering phenomena induced by heterogeneous fiber clustering and distribution patterns.62,67 The aluminum bar’s modest ∼9% β increase can be attributed to intrinsic lattice anharmonicity in the crystalline metal structure and minor experimental measurement uncertainties, which validate its nearly linear acoustic behavior under elastic deformation conditions.
68
In contrast to classical harmonic nonlinearity observed in homogeneous materials where β remains relatively amplitude-invariant, the contact-based acoustic nonlinearity in microcracked, heterogeneous cementitious materials like RSF mortar becomes significantly more pronounced with increasing excitation amplitude due to the opening and closing dynamics of interfacial defects and the activation of frictional mechanisms at higher stress levels.62,69 This fundamental disparity in acoustic response explains why β values remain essentially unchanged for the linear aluminum reference while demonstrating marked amplitude dependence for the mortar specimens at elevated input levels, thereby demonstrating that the observed nonlinear ultrasonic signature originates from intrinsic microstructural features rather than instrumentation artifacts or system nonlinearities.67,68 The validation study establishes that the experimental system successfully captures authentic material nonlinearity through the complementary behavior of two distinct ultrasonic parameters: the amplitude-invariant UPV confirms baseline linear wave propagation characteristics, while the strongly amplitude-dependent β parameter validates higher harmonic generation analysis as a sensitive indicator of microstructural nonlinearity and damage evolution in RSF-reinforced mortar specimen.62,67,70 (left) Transient signals for 4V and 6V signal through aluminum bar (right) Fast Fourier Transform of 4V and 6V signal through aluminum bar (both normalized to 4V signal). UPV and Higher Harmonic β values for an aluminum bar and 1.5% RSF at 2 levels of amplification.
4. Results
4.1. Mechanical properties
4.1.1. Compressive strength analysis
The compressive strength performance of mortar mixes containing RSF was systematically evaluated at 28 days across four different dosage levels: 0%, 0.5%, 1.0%, and 1.5% (Figure 6). The obtained compressive strength with standard deviation is presented in Table S2 of supplementary information. Results revealed that while the control mix (0% RSF) achieved a baseline compressive strength of 44.5 MPa, the introduction of RSF at 0.5% dosage resulted in a notable strength reduction to 29.8 MPa, which can be attributed to inadequate fiber-matrix bonding and potential void formation at low fiber concentrations. This pronounced strength reduction at the 0.5% RSF level suggests that a very low fiber dosage can have a net negative effect on compressive performance. In such cases, few fibers present are insufficient to carry significant load or bridge cracks, yet they may act as stress concentrators if they are not well bonded to the matrix. Consequently, when the mortar is loaded, cracks may initiate or propagate along these fiber-matrix interfaces (rather than being arrested by fibers), leading to earlier failure. In essence, 0.5% RSF does not provide enough fibers to reinforce the mortar but is enough to disturb the matrix continuity, which explains why its compressive strength fell below that of the plain control mix. However, as the RSF content increased to 1.0% and 1.5%, the compressive strengths progressively improved to 47.8 MPa and 50.1 MPa respectively, representing 7.4% and 12.6% increases over the control mix. This enhanced performance at higher fiber dosages demonstrates the effectiveness of RSF in providing superior crack-bridging mechanisms and stress redistribution throughout the mortar matrix, ultimately leading to improved structural integrity and load-bearing capacity. Average compressive strength for each RSF dosage showing a U-shaped trend.
4.1.2. Flexural strength analysis
The flexural strength results provide insights into the tensile capacity and post-cracking behavior of RSF-reinforced mortars, which are critical parameters for structural applications where bending stresses are significant. The evaluated flexural strength of the samples is illustrated in Table S4 of the supplementary information. The flexural testing revealed more pronounced benefits from RSF incorporation compared to compressive strength, consistent with the primary mechanism of fiber reinforcement in resisting tensile stresses. The flexural performance results demonstrated a consistent upward trend with increasing RSF content (Figure 7), where the control mix established a baseline strength of 4.8 MPa, followed by a modest improvement to 5.0 MPa at 0.5% RSF addition. More substantial strength gains were observed at higher fiber concentrations, with the 1.0% RSF mix achieving 6.1 MPa and the 1.5% RSF mix reaching 8.1 MPa, representing a 27% and 69% increase over the control, respectively. This progressive enhancement in flexural strength with increasing RSF content demonstrates the effectiveness of fiber reinforcement in improving the toughness and ductility characteristics of mortar composites, thereby validating the potential of RSF as a viable reinforcing material for enhancing post-cracking behavior in cementitious systems. Average flexural strength for each RSF dosage showing a monotonic increase with increased dosage.
The different response patterns between compressive and flexural strength require mechanistic explanation. The one-way ANOVA analysis for the compressive and flexural strength is given in sections S3.3 and S3.5 of the supplementary information, respectively. The control mix exhibits relatively high compressive strength (44.5 MPa) because compressive failure is governed by matrix crushing and aggregate interlock, mechanisms unaffected by fiber presence. At 0.5% RSF, compressive strength decreases substantially to 29.8 MPa (33% reduction, p=0.042) because low fiber content disrupts matrix continuity without providing sufficient reinforcement. The scattered fibers act as stress concentrators rather than load carriers. However, flexural strength shows slight improvement to 5.0 MPa (4.2% increase) because even limited fiber presence provides crack-bridging effect under tensile stress, which dominates flexural failure. At 1.0% and 1.5% RSF, flexural strength shows more distinct gains (27% and 69%) compared to compressive strength (7.4% and 12.6%) because fibers primarily resist tensile stresses through crack-bridging mechanisms that are more effective in tension than compression. The marginal difference between 1.0% and 1.5% compressive strengths (47.8 vs 50.1 MPa) is not statistically significant (p=0.51), falling within measurement error, while their flexural strengths differ significantly (6.1 vs 8.1 MPa, p=0.048). This differential response reflects distinct failure mechanisms: compressive failure is governed by matrix crushing and aggregate interlock (severely impaired by fiber clustering at 1.5%), whereas flexural failure is dominated by tensile crack propagation (effectively bridged by high fiber density at 1.5% despite clustering). Consequently, 1.5% RSF achieves superior flexural performance through crack-bridging.
4.2. Ultrasonic pulse velocity
The UPV measurements revealed minimal variation across all mortar mixes, with values ranging from 3197 m/s (1.5% RSF) to 3368 m/s (control mix), as illustrated in Figure 8 and Table S6 of the supplementary information. The UPV exhibited a slight but consistent decrease with increasing RSF dosage up to 1.0%, declining from 3368 ± 140.32 m/s for the control mix to 3299 ± 110.56 m/s at 0.5% RSF and 3198 ± 200 m/s at 1.0% RSF. Beyond 1.0% RSF content, UPV values plateaued, with the 1.5% RSF mix showing negligible change (3200 ± 130.85 m/s), indicating that additional fiber content did not significantly alter elastic wave propagation. This trend suggests that while initial fiber inclusion introduces microstructural discontinuities that slightly reduce wave speed due to wave scattering and minor interfacial discontinuities, further increases in RSF content beyond 1.0% do not appreciably affect UPV measurements. UPV measurements demonstrated significant variability (±140 m/s standard deviation, 4% scatter) attributed to the inherent heterogeneity of RSF-reinforced mortars and testing inconsistencies including transducer coupling variations. Random fiber distribution creates localized zones that accelerate or decelerate ultrasonic waves, generating measurement variability that reveals microstructural inconsistencies despite minimal changes in mean UPV values with fiber addition. This substantial scatter exposes the fundamental limitation of linear UPV techniques in fibrous composites i.e. insufficient sensitivity to detect subtle internal changes and propensity for inconsistent readings in heterogeneous materials. Thereby validating the implementation of more sophisticated nonlinear (β) and hybrid ultrasonic parameters (SPC-I and SDI) which demonstrated superior consistency in tracking evolving internal microstructure. It should be noted that UPV scatter (measuring absolute transit time) does not proportionally translate to nonlinear parameter scatter, because β, SPC-I, and SDI are all derived from spectral amplitude ratios within the same acquired signal and are further protected by amplitude normalization protocols (A1=1.0). Comprehensive quality control protocols ensuring nonlinear parameter reliability are detailed in Supplementary Sections S8.1–S8.5, including 3D-printed coupling fixture, temperature control at 23±2°C, precision holder (<2° angular deviation), triplicate averaged measurements, aluminum reference block stability verification (measured UPV: 6271 ± 2 m/s vs. literature ∼6300 m/s), and amplitude-dependence validation confirming genuine material nonlinearity rather than instrumentation artifacts. UPV value for each RSF dosage showing that the UPV (linear parameter) is insensitive to increasing RSF dosages.
4.3. Higher harmonic generation (β parameter) analysis
The higher harmonic index (β) showed remarkable sensitivity to RSF content, as shown in Figure 9. The β values were normalized to 1.00 for the control specimen. The 0.5% RSF mixture showed a moderately elevated β value of 0.72 compared to the 1.0% RSF mixture. This suggests microcracking and weak fiber-matrix bonding. The 1.0% RSF mixture produced the lowest β value of 0.34. This significant reduction indicates a structurally improved composite with minimal nonlinearity and strong fiber-matrix interaction. When fiber content reached 1.5% the β value returned to unity and matched the control specimen. This reemergence of nonlinear behavior is likely due to fiber clustering or localized damage at higher fiber concentrations. These results confirm that β serves as a highly sensitive parameter for detecting internal structural conditions that standard UPV measurements cannot identify. β value for each RSF dosage showing a U-shaped trend with the lowest value at 1% RSF.
The U-shaped β response across RSF dosages reflects distinct microstructural mechanisms. At 0.5% RSF the elevated β value of 0.72 indicates insufficient fiber density that creates isolated stress concentrations where fibers cannot bridge crack paths effectively. At the optimal 1.0% RSF dosage β reaches its minimum of 0.34 representing a 66% reduction from the control specimen. This significant decrease indicates superior internal integrity through optimal fiber spacing that enables effective load transfer and crack bridging while maintaining strong fiber-matrix bonding. At 1.5% RSF the β value returns to 1.0 and matches the control specimen. This degradation occurs because excessive fiber content causes clustering and agglomeration where fiber-fiber contacts create new sources of acoustic nonlinearity. Reduced workability at high fiber content introduces micro-voids and incomplete fiber dispersion. The obtained β values, statistical significance, and microstructural interpretation are presented in section S5 of the supplementary information. Statistical analysis validates these trends with the 66% β improvement at 1.0% RSF being highly significant (p=0.003 vs control) while the increase from 1.0% to 1.5% is equally significant (p=0.006).
4.4. Sideband peak count index (SPC-I) analysis
The SPC-I analysis provides comprehensive assessment of material heterogeneity and microstructural complexity in RSF-reinforced mortars. Figure 10 provides compelling validation of the β parameter findings, revealing distinct material responses across different RSF concentrations. The obtained SPC-I values and correlation with compressive strength are given in section S6 of the supplementary information. While the control mix establishes a baseline normalized SPC-I of 1.00, the introduction of 0.5% and 1.0% RSF produces notable reductions to 0.76 and 0.85, respectively, indicating diminished modulation behavior consistent with reduced active microcracking and fewer interface defects. However, the 1.5% RSF mixture exhibits a return to near-baseline performance at 1.02, effectively replicating the unreinforced control’s characteristics. In fiber-reinforced cementitious composites, sideband generation arises from multiple sources: (1) fiber-matrix interfacial zones where acoustic wave modulation occurs at bonding sites, and (2) material defects, including microcracks, voids, and debonded interfaces that produce nonlinear scattering. The interpretation of SPC-I values depends on which mechanism dominates sideband generation. During progressive strength development (e.g., curing process), increasing SPC-I reflects formation of fiber-matrix bonds, where higher values correlate positively with mechanical performance. However, in mature specimens at fixed age with varying fiber dosages, SPC-I variations reflect the balance between beneficial interfaces and detrimental defects. Optimal fiber dispersion creates effective load-bearing interfaces with minimal defects, yielding moderate SPC-I values. Conversely, fiber clustering or excessive dosages produce both interfacial zones and numerous defects (clustering voids, debonding, entanglement), elevating SPC-I without proportional strength gains. The hybrid nature of SPC-I enables assessment of both interfacial density and defect content, making it valuable for comprehensive microstructural characterization. SPC-I value for each RSF dosage showing a U-shaped trend with the lowest value at 0.5% RSF.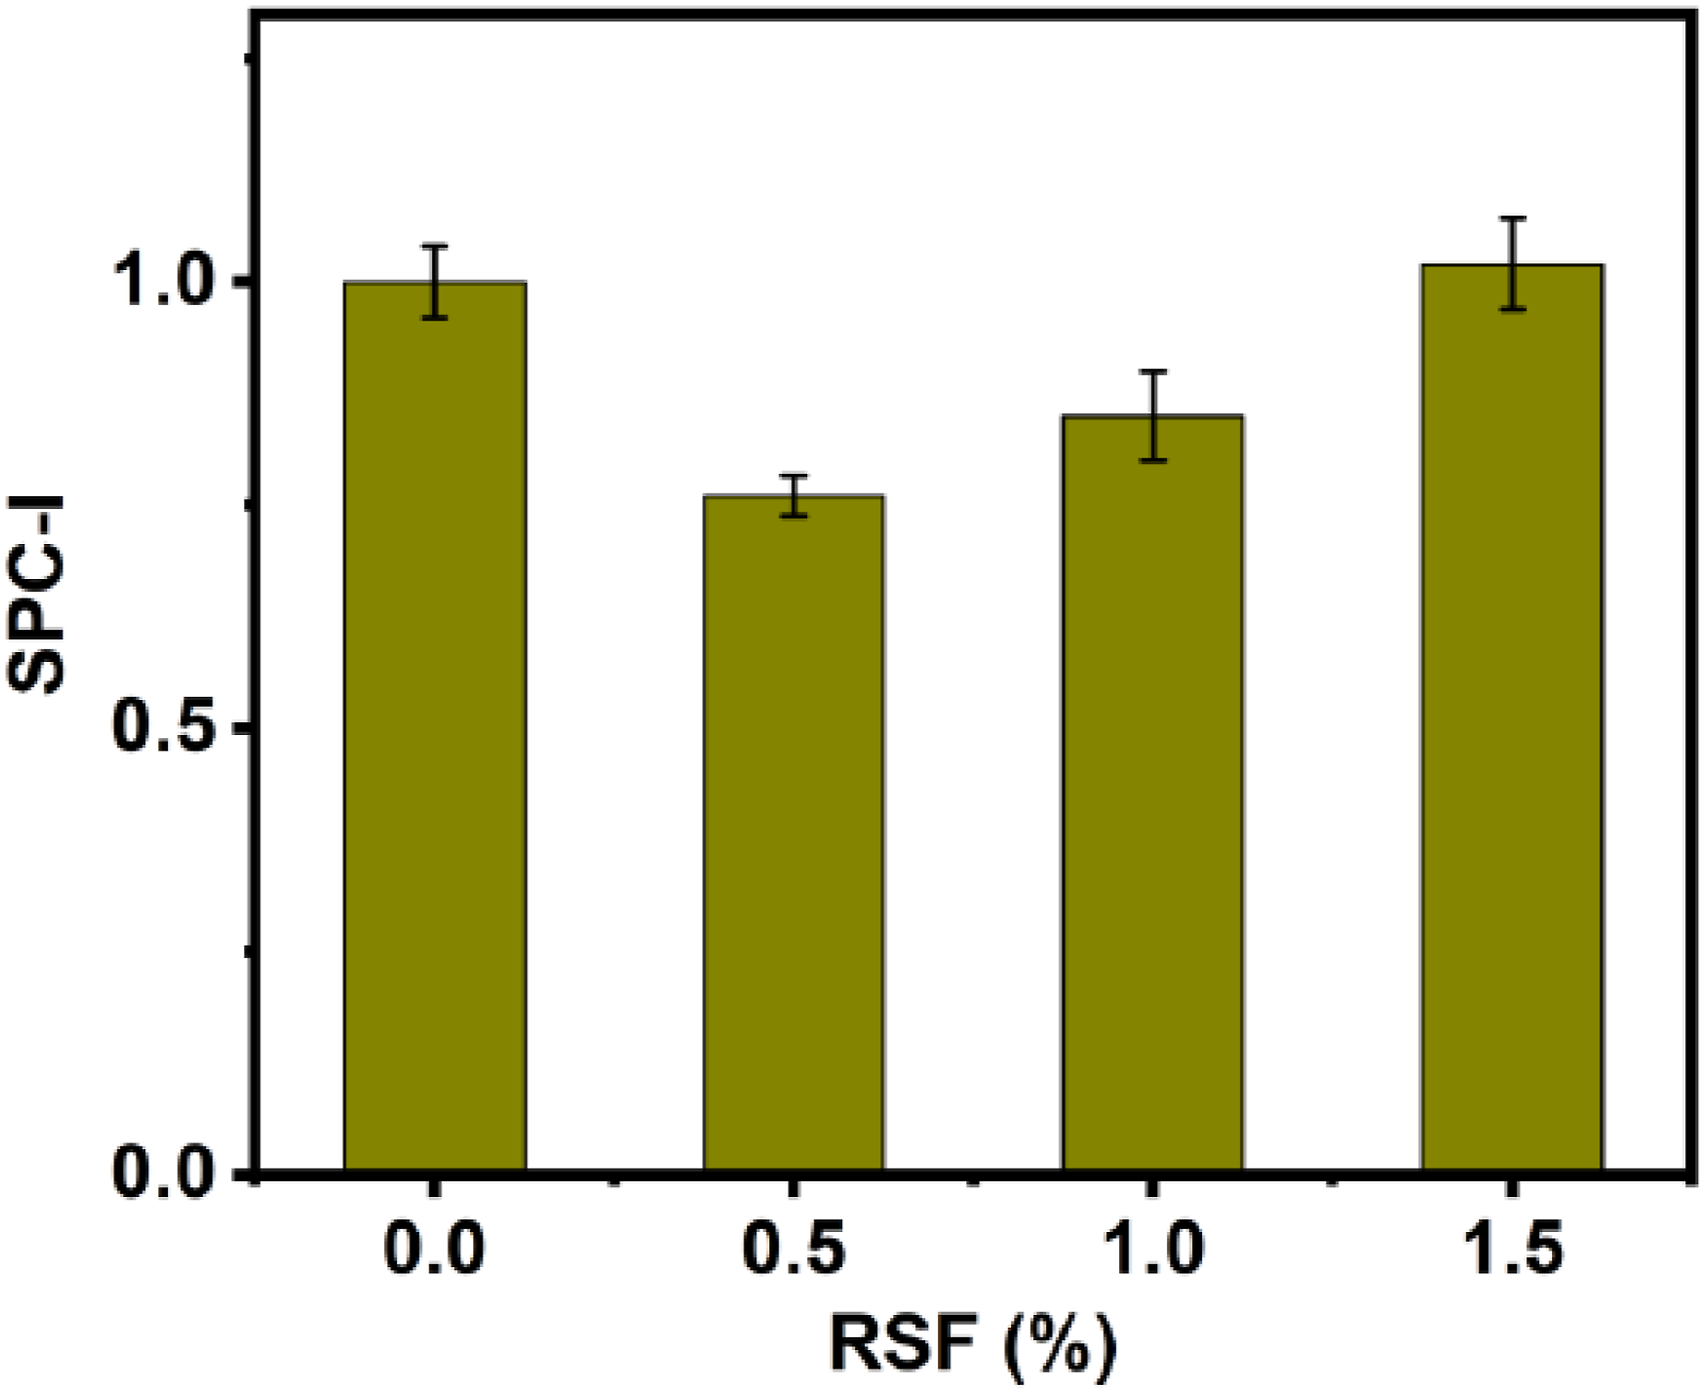
4.5. Spectral dissipation index (SDI)
SDI values presented in Figure 11 verify the trends observed with the β parameter. Specifically, the control mixture exhibited a normalized SDI of 1.00, while the addition of 0.5% and 1.0% RSF resulted in reduced SDI values of 0.68 and 0.63, respectively, indicating a diminished degree of modulation attributed to fewer active microcracks or interfacial defects. The SDI shows a U-shaped trend parallel to β, though with a smaller magnitude of variation: SDI decreases by 37% at 1.0% RSF relative to the control, compared to the 66% reduction in β at the same dosage. This difference in sensitivity magnitude reflects the distinct physical basis of the two parameters i.e. β quantifies peak second-harmonic amplitude and is highly sensitive to localized interfacial nonlinearity, while SDI integrates normalized spectral energy across the full frequency range and is therefore partially buffered by the broader spectral averaging. Both parameters nevertheless converge in identifying 1.0% RSF as the condition of minimum microstructural nonlinearity. As a metric that integrates both linear and nonlinear effects, SDI offers a practical and direct approach to spectral analysis. The obtained SDI values and SDI physical interpretation are given in section S7 of the supplementary information. Notably, increasing the RSF content to 1.5% restored the SDI value to 0.86, closely mirroring the response of the unreinforced control mixture. This consistency between β and SDI strongly underscores the inherently nonlinear material behavior, with both indicators reliably identifying the 1.0% RSF mix as the most structurally stable configuration. SDI value for each RSF dosage showing a U-shaped trend with the lowest value at 1% RSF.
5. Discussion
5.1. Correlation between ultrasonic parameters and mechanical strength
The complementary implementation of mechanical testing and ultrasonic evaluation methodologies revealed significant correlations between RSF dosage, external mechanical performance, and internal microstructural integrity. Compressive strength exhibited a non-monotonic relationship with RSF content, decreasing substantially from the control value of 44.5 MPa to 29.8 MPa at 0.5% RSF, before recovering markedly to 47.8 MPa at 1.0% RSF and reaching a maximum of 50.1 MPa at 1.5% RSF. In contrast, flexural strength demonstrated a consistent positive correlation with fiber content, progressing from 4.8 MPa (control) through 5.0 MPa (0.5% RSF) and 6.1 MPa (1.0% RSF) to 8.1 MPa (1.5% RSF). While these mechanical indicators provided valuable assessments of load-bearing capacity, they proved insufficient for comprehensive characterization of internal material integrity (Figure 12(a) and (b)), necessitating the deployment of nonlinear ultrasonic parameters. The nonlinear and hybrid ultrasonic parameters (β, SPC-I, and SDI) provided crucial insights into microcrack activity and fiber-matrix interaction that remained undetectable through conventional strength measurements. Although linear UPV exhibited negligible variation across all mixes (3197-3368 m/s), confirming its limited sensitivity to microstructural changes, the nonlinear parameters displayed distinctive response patterns that closely corresponded with mechanical performance trends. The SPC-I parameter demonstrated a moderate positive correlation with compressive strength (r=0.60, R2=0.36, Section S6.3), reflecting its sensitivity to fiber-matrix interfacial density. At 0.5% RSF, reduced SPC-I (0.76) and low compressive strength (29.8 MPa) indicate insufficient fiber-matrix interfacial zones due to sparse fiber distribution, where few fibers act as stress concentrators rather than effective reinforcement. At 1.0% RSF, moderate SPC-I (0.85) combined with high compressive strength (47.8 MPa) and minimum β (0.34) and SDI (0.63) values indicate optimal fiber dispersion with well-developed interfacial bonding and minimal defects. At 1.5% RSF, elevated SPC-I (1.02) approaching control levels despite maximum compressive strength (50.1 MPa) reveals that sideband generation is dominated by fiber clustering defects (voids, debonding, entanglement) rather than beneficial interfacial zones alone. The concurrent elevation of β (1.0) and SDI (0.86) at 1.5% RSF confirms internal microstructural degradation. Therefore, SPC-I must be interpreted in conjunction with β and SDI: optimal microstructural quality requires moderate SPC-I (reflecting adequate interfacial zones) combined with minimum β and SDI (indicating minimal defects). The 1.0% RSF mix, which exhibited substantially recovered compressive strength (47.8 MPa), maintained a moderate SPC-I value (0.85), indicating optimal fiber dispersion with minimal microcracking despite enhanced load-bearing capacity. At 1.5% RSF, the further increase in compressive strength to 50.1 MPa was accompanied by an increase in SPC-I to 1.02, approximating the control value and signaling the onset of fiber clustering and associated microstructural defects despite maximum strength attainment. The SDI values paralleled the trends observed with the β parameter, with the control mixture exhibiting a normalized SDI of 1.00, while 0.5% and 1.0% RSF resulted in reduced SDI values of 0.68 and 0.63, respectively, indicating diminished modulation attributed to fewer active microcracks or interfacial defects. Increasing RSF content to 1.5% restored the SDI value to 0.86, closely mirroring the unreinforced control mixture response. (a) Graph of compressive strength, β and SPC-I and SDI showing the optimum dosage of 1%. (b) Graph of flexural strength, β, SPC-I, SDI showing the optimum dosage of 1%.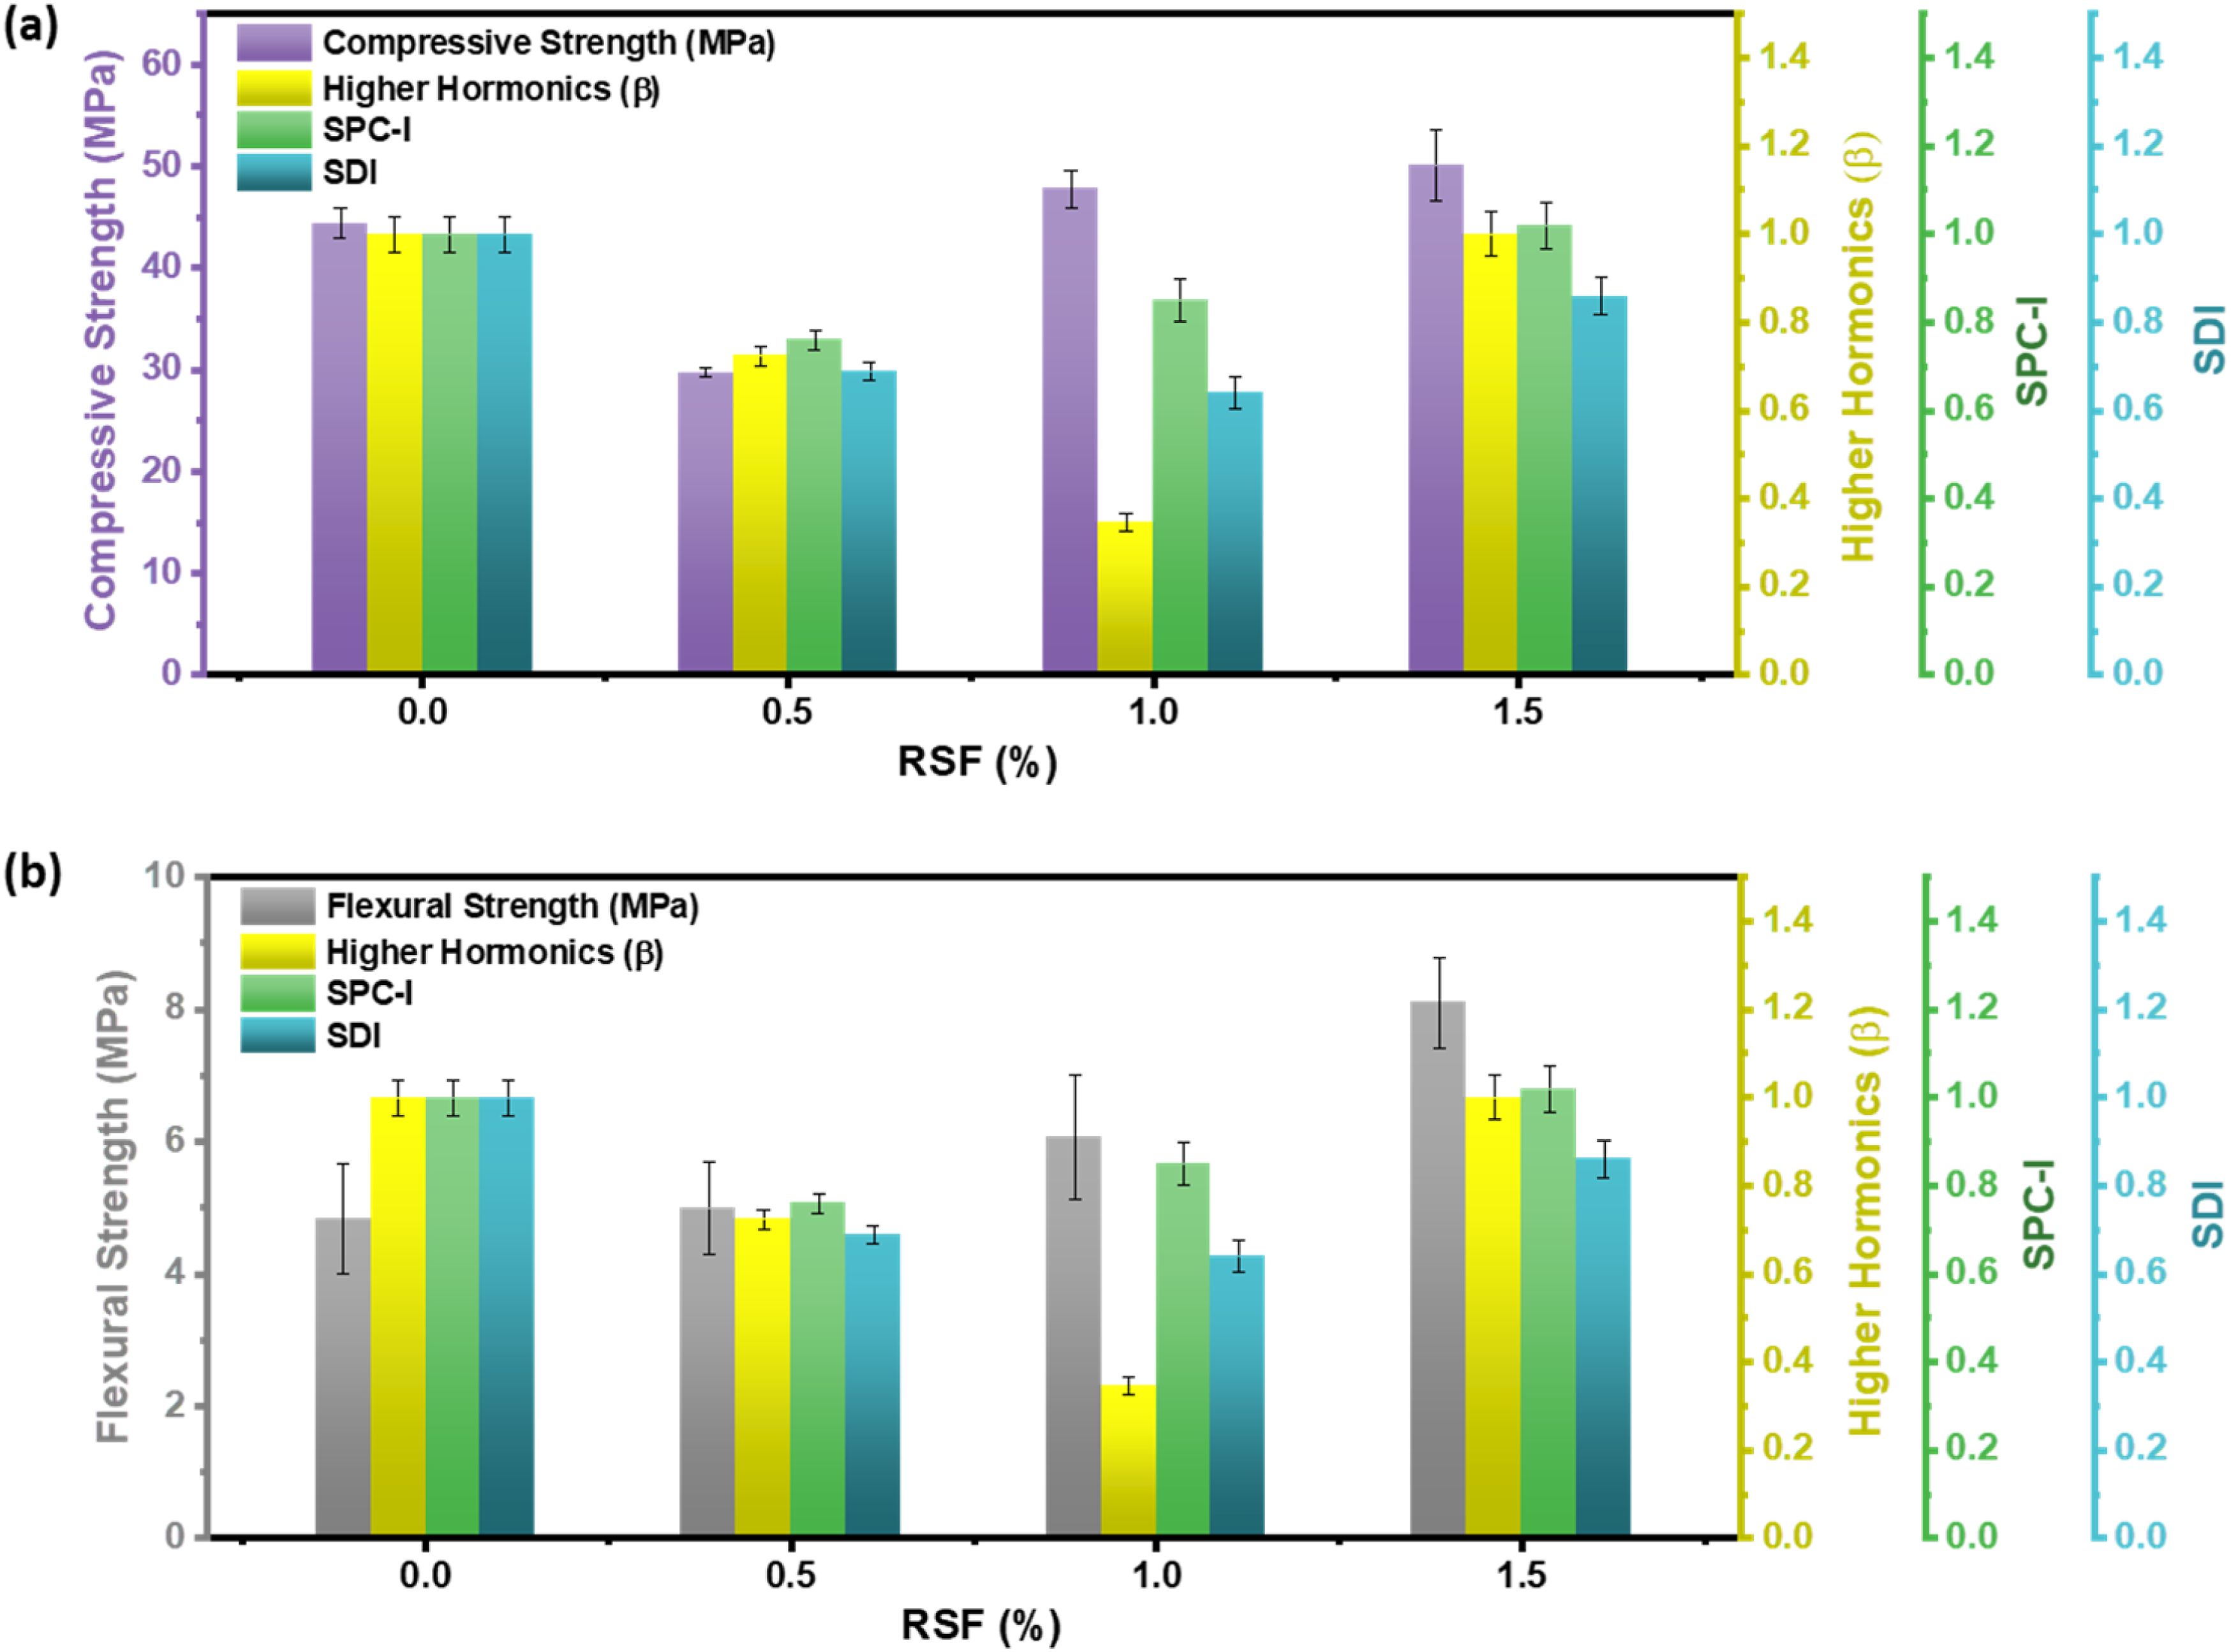
The higher harmonic index (β) exhibited a similar U-shaped pattern, with the 0.5% RSF mix showing a moderately high value (0.72), the 1.0% RSF mix demonstrating the lowest value (0.34), and the 1.5% RSF mix returning to the control level (1.0). This distinctive U-shaped response curve in both nonlinear parameters provides compelling evidence that optimal internal microstructural integrity occurs at 1.0% RSF content, where efficient fiber dispersion and matrix cohesion yield enhanced mechanical performance without introducing detrimental microstructural defects that would manifest as elevated nonlinear responses. These observations establish a critical inverse relationship between nonlinear ultrasonic indices and optimal microstructural configuration, wherein minimal nonlinearity corresponds to optimal fiber-matrix interaction, despite not necessarily coinciding with maximum attainable strength.
5.2. Influence of fiber aspect ratio distribution on composite performance
This investigation revealed that an optimal RSF dosage of 1.0% yielded superior microstructural integrity and mechanical performance.
The aspect ratio distributions shown in Figure 13 were measured from as-received source batch fibers (Batch A, B, and C), and a small number of fibers were also extracted from tested specimens for verification. For each batch, 40–48 fibers were randomly selected and digitally imaged. Fiber length was measured along the fiber axis and diameter at three locations (near each end and at midpoint). Aspect ratio was calculated as the ratio of length to diameter. Analysis used ImageJ software with a calibrated stage micrometer. Measurement uncertainty was estimated at ±2 μm for length and ±0.5 μm for diameter. The complete protocol is detailed in Supplementary Section S2.4 in Supplementary Information. The measured aspect ratio distributions, therefore, reflect inherent geometric characteristics of each batch as supplied by the manufacturer. Batch A (0.5% dosage) exhibited extremely high and variable aspect ratio (280–300), Batch B (1.0% dosage) showed a tightly clustered distribution around aspect ratio (80), and Batch C (1.5% dosage) contained shorter fibers with aspect ratio 50–60. These differences represent batch-specific manufacturing variations within the same supplier’s production. While as-received fibers from all three batches exhibited statistically comparable mean lengths (28.7–35.4 mm, p=0.31, Table 3) and identical mean diameters (0.25 mm), the shapes and spreads of the full individual-fiber AR distributions differed substantially between batches (Figure 13). This is because AR distributions reflect the combined variability of both length and diameter across all individual fibers in a batch (including extreme values at the distribution tails) rather than simply the ratio of mean values (L̄/D̄). The differences in distribution shape and skewness across batches are batch-specific characteristics of each production lot. Individual fiber aspect ratio (AR = L/D) distributions measured from as-received source batch fibers spread on a flat surface prior to mixing (primary dataset: n≈45, 45, 48 for Batches A, B, C respectively; see Supplementary Section S2.4). Distributions represent the full range of individual fiber measurements within each batch; modal AR values differ from mean AR (L̄/D̄) computed from Table 3 due to the skewed shape of the fiber dimension distributions. (a) Batch A (0.5% dosage): Right-skewed distribution with modal AR in the 280–300 range, reflecting the geometric characteristics of this production lot where many individual fibers are near the upper length and lower diameter extremes. (b) Batch B (1.0% dosage): Distribution clustered around AR ≈ 80, reflecting the geometric characteristics of this production lot. (c) Batch C (1.5% dosage): Distribution shifted toward lower AR values of 50–60, reflecting the geometric characteristics of this production lot. All AR differences are batch-specific manufacturing variations. Since each batch was used at one dosage level, batch AR characteristics and dosage are confounded (see Section 5.4).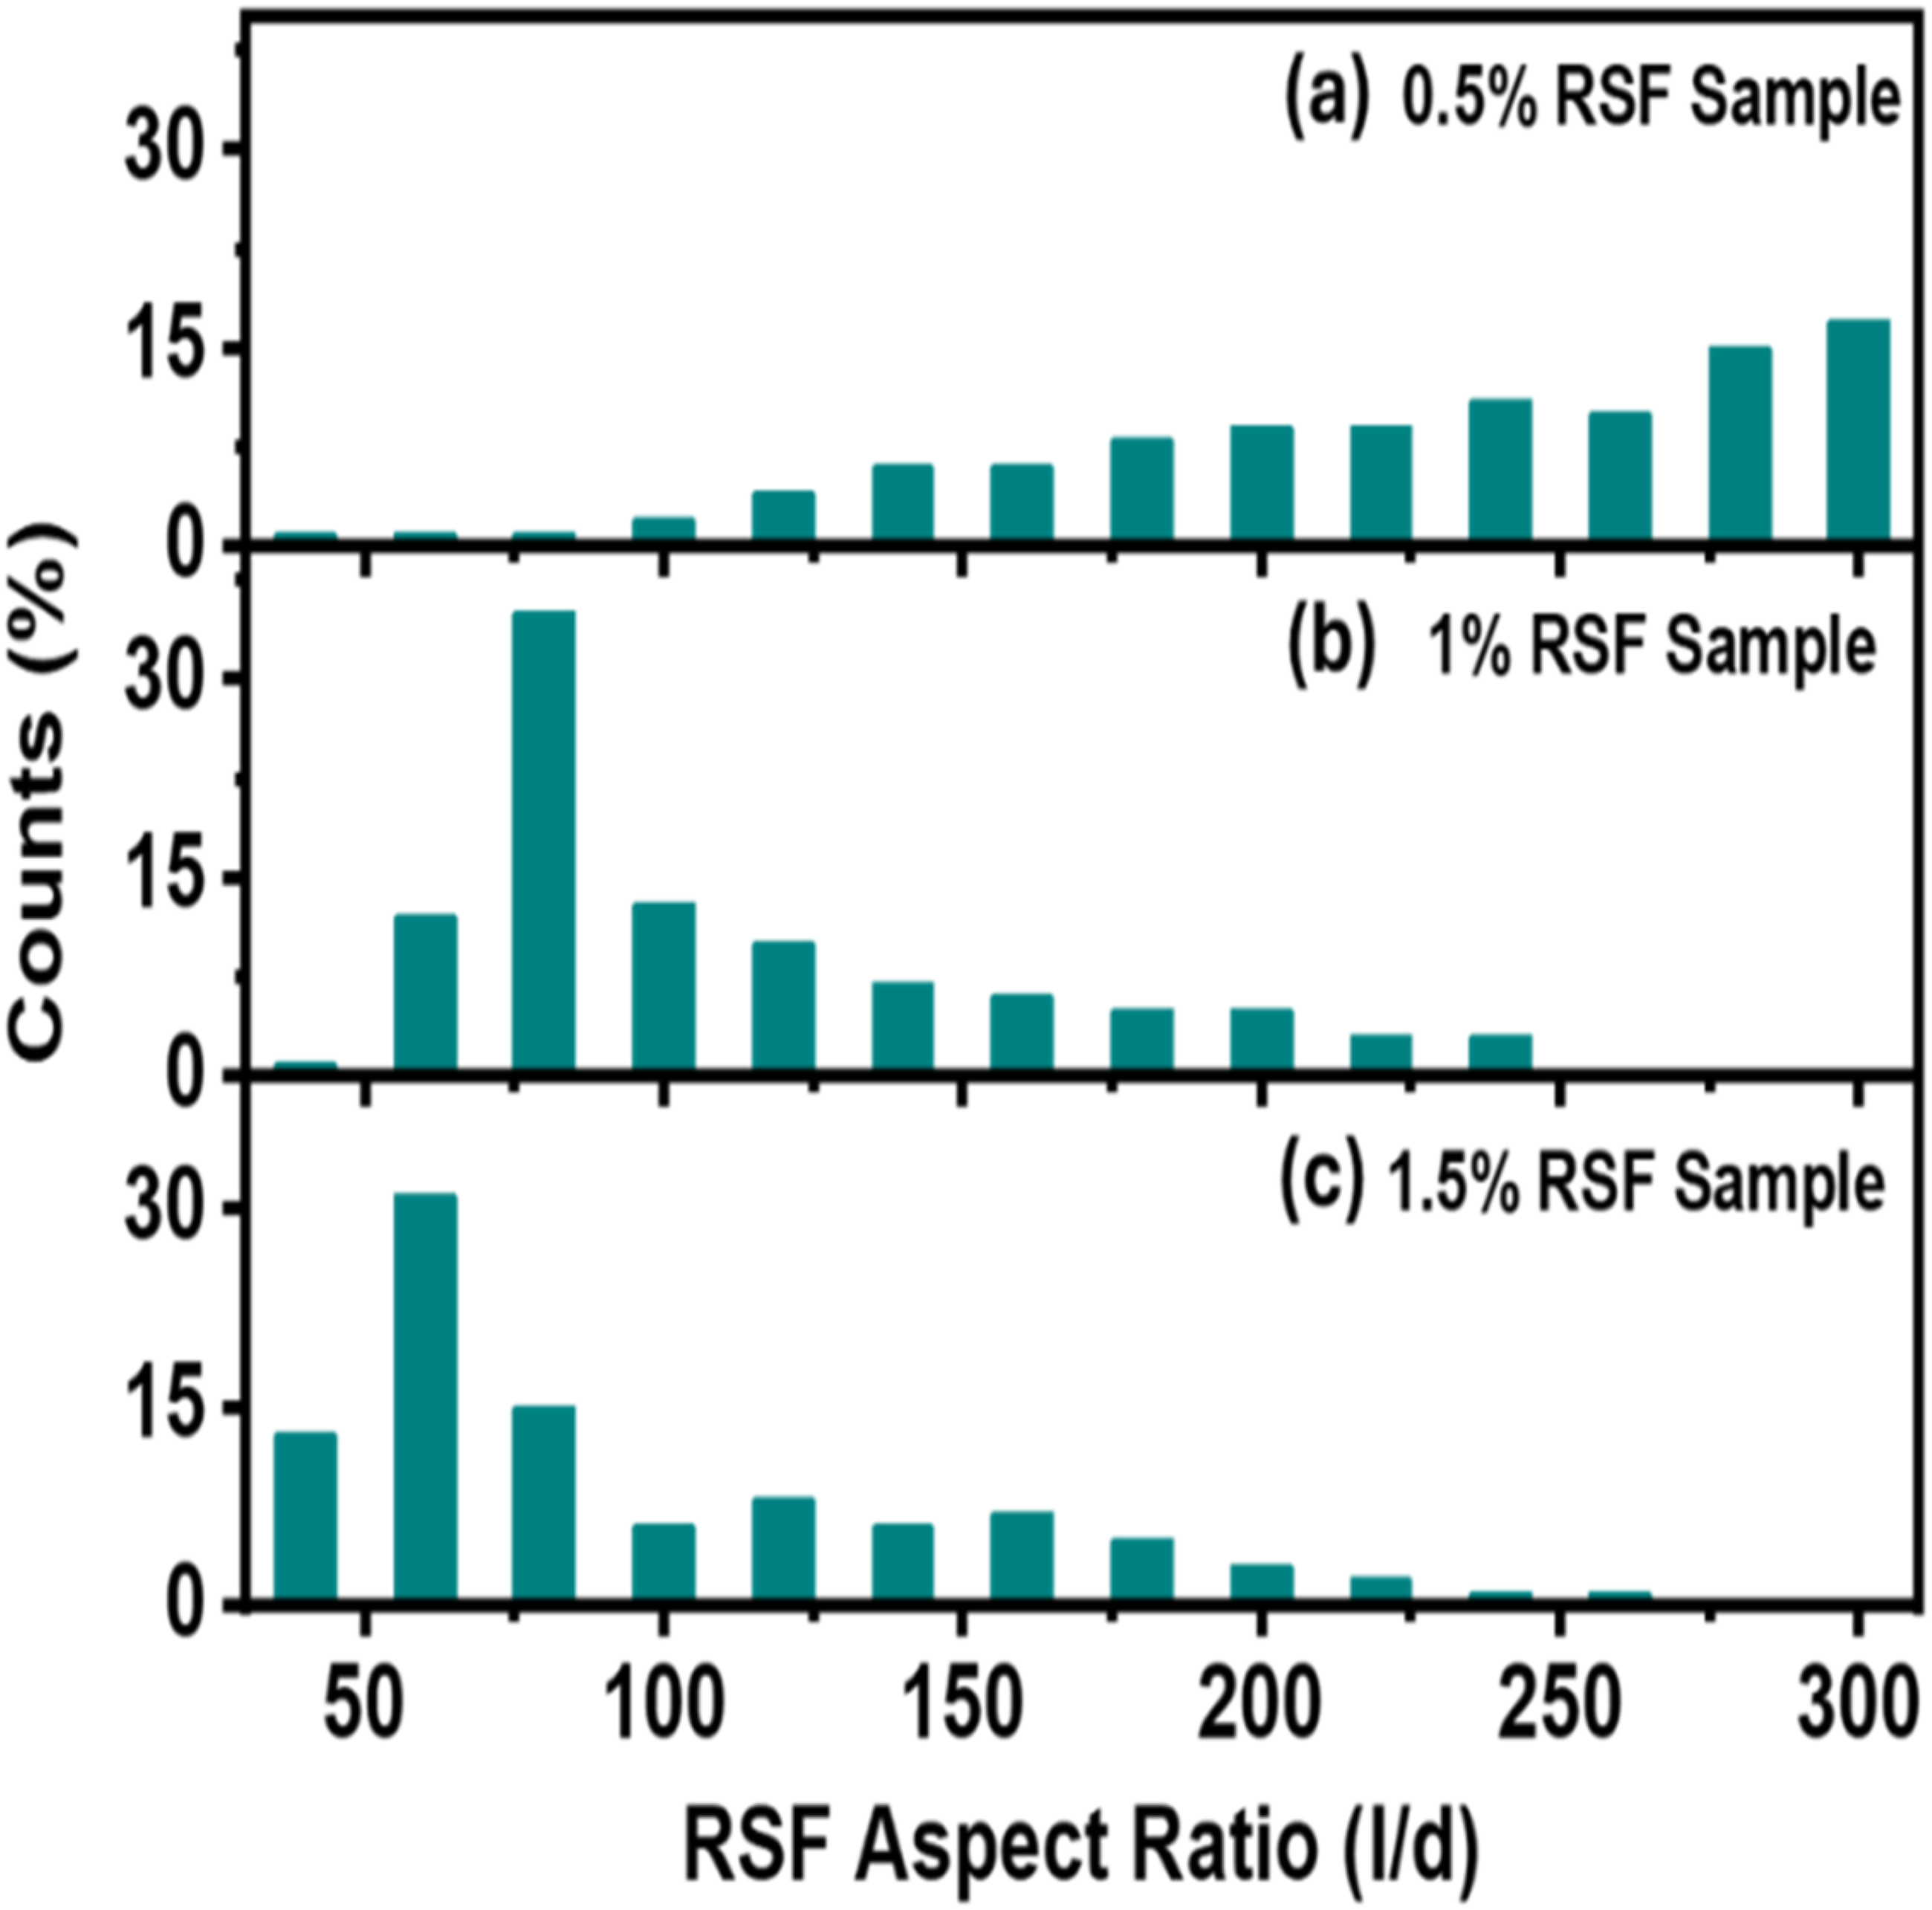
Independent electrical evidence from the study 71 provides additional context: the lowest electrical resistance at 0.5% RSF (749.57 Ω·cm) is consistent with the high-AR fibers (280–300) present in Batch A, which form longer conductive pathways. As dosage increased to 1.0% and 1.5%, progressive fiber packing and the batch-specific shorter fibers in Batches B and C altered the conductive network accordingly. This electrical evidence is consistent with both batch-specific AR differences and dosage effects acting simultaneously, and confirms that the observed AR characteristics are real and physically meaningful. However, since batch identity and dosage are confounded in the present design, the electrical data cannot independently confirm whether the AR differences are primarily dosage-driven or batch-driven. The U-shaped trends in β and SDI therefore reflect a combined influence of fiber dosage and batch-specific fiber geometry, as discussed fully in Section 5.4.
The 0.5% RSF specimen exhibited a highly skewed distribution of fiber aspect ratios i.e. many fibers remained very long (aspect ratio in the 280–300 range) since only a few fibers were added, and those tended to be the full-length fibers with little overlap or breakage. In contrast, the 1.0% RSF specimen showed a much more moderate distribution, with the majority of fibers having aspect ratios clustered around approximately 80 (as seen in Figure 13(b)). This indicates a more uniform and intermediate fiber length profile in the mix. The 1.5% RSF specimen (Batch C) showed a distribution shifted toward lower aspect ratios of 50-60. This reflects the inherent geometric characteristics of Batch C as supplied. It does not imply that fibers were shortened during mixing. The lower modal AR is a batch-specific property of this production lot. Since Batch C was used exclusively at the 1.5% dosage level, the AR characteristics and dosage are confounded and cannot be separated. In comparative terms, the mean fiber aspect ratio drops from the 0.5% mix to the 1.0% mix and drops further in the 1.5% mix. These distribution shifts are consistent with the mechanical findings i.e. a few extremely high-aspect-ratio fibers at 0.5% did not improve compressive strength (and may have acted as flaws), whereas a balanced population of fibers at 1.0% aspect ratio 80 was optimal for crack bridging. At 1.5%, although there were more fibers, their reduced effective lengths (lower aspect ratios) and entanglements led to fiber clustering rather than proportional gains in performance. By quantifying the aspect ratio data in this way, we highlight that it’s not only the quantity of fibers but also their dispersion and effective length distribution that govern the composite’s behavior. The strong correlation between mechanical strength and the nonlinear ultrasonic indices (Figure 12(a) and (b)) underscores the unique sensitivity of this technique to detect microstructural discontinuities that conventional strength tests cannot. The U-shaped behavior of the β parameter reflects the evolving microstructural integrity of fiber-reinforced composites as fiber content varies. In plain mortar (0% RSF), baseline microcracking from drying shrinkage and curing stresses establishes an initial β value, while low fiber dosages (0.5% RSF) fail to form effective reinforcing networks. At the optimal 1.0% RSF content, fibers effectively arrest and bridge cracks throughout the matrix, creating a well-distributed reinforcing network that minimizes microstructural nonlinearity and produces the lowest β value indicating the healthiest composite state. However, excessive fiber content (1.5% RSF) leads to fiber clustering and debonding effects that introduce new sources of nonlinearity through micro-gaps at fiber-matrix interfaces and stress concentrations around fiber clumps, causing β to rise again toward levels comparable to the plain mix. Therefore, this integrated analysis validates 1.0% as the ideal RSF dosage and establishes nonlinear ultrasonics as an essential tool for the precision-driven design of fiber-reinforced composites.
5.3. Justification for optimal RSF dosage
The concept of “optimal” fiber dosage in the present study warrants careful definition. We define optimal dosage as the fiber content that achieves near-maximum mechanical performance while preserving superior internal microstructural integrity, rather than simply the dosage yielding maximum strength at a single test age. This definition recognizes that short-term mechanical performance does not guarantee long-term serviceability if internal microstructural quality is compromised.
The 1.5% RSF mix demonstrates this principle: it achieves the highest flexural strength (8.1 MPa, +69% vs. control, +32.8% vs. 1.0% RSF, p=0.048) due to maximum crack-bridging capacity from high fiber density. However, concurrent elevation of nonlinear parameters (β=1.0, SDI=0.86) to near-control levels and optical microscopy evidence (Figure 14) reveal internal microstructural degradation from fiber clustering, localized void formation, and weak interfacial zones. The differential response between compressive and flexural strength is mechanistically consistent: fiber clustering more severely impairs compressive performance (matrix continuity governs failure) than flexural performance (fiber crack-bridging dominates), explaining why 1.5% RSF shows only marginally higher compressive strength (+4.8% vs. 1.0%, p=0.51, not significant) but substantially higher flexural strength (+32.8% vs. 1.0%, p=0.048). Optical images of mortar specimens comparing fiber distribution across different dosages. The 0.5% RSF specimen reveals poor dispersion and voids acting as stress concentrators, while the 1.5% RSF specimen exhibits visible fiber clustering (arrows). In contrast, the 1.0% RSF dosage demonstrates uniform fiber distribution and effective bonding. Note: Optical microscopy at this magnification clearly resolves fiber clustering and voids but has insufficient resolution to directly visualize interfacial microcracks, which are inferred from nonlinear ultrasonic parameter sensitivity (elevated β and SDI values).
In contrast, the 1.0% RSF mix achieves 75% of maximum flexural strength (6.1 vs. 8.1 MPa) while maintaining minimum β (0.34, representing 66% reduction from control) and SDI (0.63, representing 37% reduction), indicating superior internal microstructural state. Therefore, 1.0% RSF is identified as optimal because it balances near-maximum mechanical performance with preserved internal integrity, whereas 1.5% RSF gains incremental flexural strength at the expense of microstructural quality. Whether this internal degradation at 1.5% translates to reduced long-term durability requires validation through accelerated aging and fatigue testing.
The combined experimental data (see section S9 of supplementary information) demonstrate that 1.0% RSF represents the optimal dosage for achieving superior mechanical performance while maintaining excellent internal structural integrity. This dosage delivers compressive strength comparable to the 1.5% RSF mix, with any marginal strength differences falling within the experimental standard deviation, thereby confirming the statistical insignificance of higher fiber content (Figure 12(a) and (b)). Critically, while the 1.5% RSF mix achieved slightly higher strength values at 28 days, it exhibited significantly elevated nonlinear and hybrid parameters (β, SPC-I, and SDI), indicating the reintroduction of internal structural flaws. While we hypothesize that such internal microstructural defects may compromise long-term durability through accelerated transport of deleterious agents or reduced fatigue resistance, this hypothesis requires validation through accelerated durability testing (e.g., freeze-thaw cycling, chloride ingress, sulfate attack) and long-term exposure studies, which were beyond the scope of the present investigation. This deterioration in internal quality is indicated by two complementary lines of evidence: (1) visible fiber clustering and macro-void formation in the 1.5% mix, observable at the magnification of Figure 14 (optical microscopy), and (2) elevated β and SDI values indicating increased acoustic nonlinearity consistent with interfacial debonding or microcracking. It should be noted that optical microscopy at the magnification used in Figure 14 clearly resolves fiber clustering and voids but has insufficient resolution to directly visualize individual interfacial microcracks; the presence of microcracking is therefore inferred from the nonlinear ultrasonic evidence rather than directly demonstrated. This contrasts sharply with the 1.0% mix, which maintained both mechanical strength and superior internal microstructural state as indicated by minimum β and SDI values. Hence, in our definition of “optimal” dosage, we prioritize the mix that achieves nearly the maximum strength attainable while preserving the material’s internal integrity. The 1.0% RSF mix fulfills this criterion, delivering compressive and flexural strengths statistically on par with the 1.5% RSF mix, yet exhibiting far superior internal integrity (minimal microcracking). In contrast, the 1.5% RSF mix’s slight strength gain (about 5% higher than 1.0%) is offset by its compromised internal microstructure, which could undermine long-term performance. By balancing these factors, we identify 1.0% RSF as the ideal dosage i.e. it provides the best overall performance without incurring the internal damage that occurs at higher fiber content. The UPV measurements further support this conclusion, showing nearly identical values between the 1.0% and 1.5% RSF mixes (differing by less than 4% and within experimental standard deviation), indicating that the marginal strength increase at higher fiber content provides no measurable improvement in overall material quality as detected by linear ultrasonic methods. These findings underscore the critical value of nonlinear ultrasonics in optimizing mix design: while conventional mechanical tests reveal a material’s load-bearing capacity at a specific age, nonlinear parameters (β) and hybrid parameters (SPC-I and SDI) provide essential insights into internal microstructural state, collectively identifying 1.0% RSF as the most effective reinforcement level for achieving the optimal balance between 28-day strength and internal microstructural integrity. Whether superior internal microstructural quality at 1.0% RSF translates to enhanced long-term durability requires validation through accelerated aging tests and multi-year exposure studies in aggressive environments.
The SPC-I parameter demonstrated a moderate positive correlation with compressive strength (r=0.60, R2=0.36), explaining approximately 36% of the variation in compressive strength. Where specimens achieving higher 28-day strength consistently exhibited elevated SPC-I values reflecting greater density of mechanically active fiber-matrix interfaces. This relationship validates that SPC-I effectively captures the progressive development of load-bearing microstructure through quantification of fiber-matrix bonding zones that generate sideband modulation under ultrasonic excitation. However, SPC-I alone is insufficient for optimality determination: the 1.5% RSF mix exhibits the highest SPC-I (1.02) and compressive strength (50.1 MPa), yet concurrent elevation of β (1.0) and SDI (0.86) to control-level values reveals internal microstructural degradation from fiber clustering. Conversely, the β and SDI parameters showed weaker correlation with bulk strength but superior sensitivity for detecting microstructural quality, where minimum β and SDI values at 1.0% RSF (0.34 and 0.63, respectively) indicate optimal internal integrity despite slightly lower strength than 1.5% (p=0.51, not significant). Therefore, optimal dosage requires integrated assessment: 1.0% RSF achieves near-maximum strength (SPC-I = 0.85 supporting strength development) while preserving superior internal microstructural health (minimum β and SDI confirming minimal damage), whereas 1.5% detriments internal quality for marginal strength gain.
The hybrid parameters SPC-I and SDI provide a comprehensive assessment of fiber-reinforced materials that goes beyond standard strength testing. Mortar mixtures with different fiber distributions (well-dispersed fibers and with clustered fibers) may show similar compressive strengths at 28 days and comparable UPV and SPC-I values. However, their SDI values can differ significantly. This reveals that internal energy dissipation patterns vary substantially due to fiber distribution differences even when strength performance appears equivalent. An elevated SDI acts as a critical warning of non-uniform fiber networks even when strength parameters look satisfactory. Meanwhile an increasing SPC-I over time confirms progressive strength gain and matrix maturation regardless of fiber distribution patterns. This dual-parameter approach lets engineers monitor strength development through SPC-I while evaluating fiber dispersion quality through β and SDI. The framework proves particularly valuable for recycled fiber systems where both mechanical performance and fiber utilization efficiency matter.
The study used distinct RSF batches for each dosage level. Statistical analysis confirms the batches are geometrically equivalent. One-way ANOVA tests on fiber length yielded an F value of 1.23. The p value was 0.31. This result shows no significant difference at the 95% confidence level. All batches maintained equivalent mean diameters between 0.20 mm and 0.30 mm (see Table 3). Fiber length variation provided extra validation. Batch B had the shortest fibers at 1.0% dosage. Batch C had the longest fibers at 1.5% dosage. Two mechanical and four ultrasonic techniques identified 1.0% as the optimal dosage despite batch differences. The convergent results across six measurement techniques suggest the finding is robust within the tested material range. However, readers are directed to Section 5.4 for a full discussion of how batch-dosage confounding affects the generalizability of these conclusions, including the specific limitations on extrapolation and recommendations for future unconfounded experimental designs.
An ideal experimental design would use a single RSF batch at multiple dosages to remove any potential confounding effect, and future work should consider randomized batch–dosage assignments or using multiple batches at each dosage level to better separate batch and dosage influences. Nevertheless, the current methodology intentionally uses different supplier batches at different dosages to reflect realistic variability in recycled fiber sources. This choice supports the main aim of the study, which is to evaluate whether advanced ultrasonic parameters (β, SPC-I, SDI) can assess fiber distribution quality in conditions closer to field practice. Even with this limitation, the results remain consistent across several independent indicators. The statistical findings and the underlying mechanisms align well. Together, these outcomes support the conclusion that 1.0% RSF is the optimal dosage for mortar mix design.
5.4. Limitations: Batch-dosage coupling and generalizability
The experimental design employed different RSF supplier batches at each dosage level (Batch A at 0.5%, Batch B at 1.0%, Batch C at 1.5%), which creates potential confounding between batch characteristics and dosage effects. While statistical analysis confirmed geometric equivalence among batches (ANOVA p=0.31 for fiber length; identical diameter distributions 0.20-0.30 mm), unmeasured properties such as tensile strength, residual rubber content, or surface chemistry could theoretically vary between batches and influence results.
Several observations suggest that dosage effects dominate over batch variability in the present study: 1. Convergent multi-parameter identification: Six independent measurement techniques identified 1.0% RSF as optimal or near-optimal, which would be highly improbable if batch differences were the primary determining factor rather than systematic dosage effects. 2. Statistically significant U-shaped behavior: Both β and SDI parameters exhibited U-shaped trends with minima precisely at 1.0% RSF (p<0.001 for transitions), aligning with established fiber reinforcement mechanisms: insufficient fiber density at 0.5%, optimal dispersion at 1.0%, and fiber clustering at 1.5%. 3. Mechanistic consistency: The observed patterns match well-documented fiber reinforcement theory where low fiber content fails to create effective crack-bridging networks, intermediate content achieves optimal dispersion, and excessive content causes clustering and mechanical interference.
However, this limitation affects the generalizability of findings. The reported optimal dosage of 1.0% RSF applies specifically to the tested material sources and may not directly translate to RSF extracted from different tire types, extraction processes, or geographic regions. Future investigations should employ randomized batch-dosage designs where multiple batches are tested at each dosage level, enabling rigorous separation of batch effects from dosage effects through two-way ANOVA or mixed-effects modeling.
Despite this limitation, the present work successfully demonstrates that advanced ultrasonic parameters (β, SPC-I, SDI) provide superior sensitivity compared to conventional UPV for assessing internal microstructural quality in fiber-reinforced cementitious composites under realistic material variability conditions. It is also important to note that the aspect ratio distributions documented in Figure 13 reflect as-received batch fiber characteristics rather than purely dosage-induced configurations. Batch A (0.5% dosage) naturally contained high AR fibers (280–300) and Batch C (1.5% dosage) contained shorter fibers (AR 50–60). These batch-specific geometric differences contribute to the observed composite property differences and cannot be attributed solely to dosage. Future studies using a single fiber batch at multiple dosages would eliminate this geometric confounding and enable clearer attribution of performance differences to dosage alone.
6. Conclusion
This study evaluated mortar reinforced with RSF at dosages of 0%, 0.5%, 1.0%, and 1.5% using mechanical testing and linear, nonlinear, and hybrid ultrasonic parameters. The results identified 1.0% RSF as the optimal dosage,72,73 achieving maximum mechanical performance alongside superior internal microstructural integrity. At this dosage, compressive strength reached 47.8 MPa and flexural strength reached 6.1 MPa. These values were statistically equivalent to the 1.5% mix (p=0.51). The nonlinear parameter β and hybrid parameter SDI both reached minimum values at 1.0% (β=0.34, SDI=0.63), representing 66% and 37% reductions from control levels. These minima indicate optimal fiber distribution, enhanced fiber-matrix bonding, and minimal microcracking. At 1.5% RSF, despite marginal strength gains, β and SDI returned to near-control levels (β=1.00, SDI=0.86). This signals fiber clustering and internal degradation, which was confirmed by microstructural imaging. Linear UPV showed minimal variation (3197-3368 m/s) and failed to distinguish dosage effects. In contrast, SPC-I demonstrated a moderate correlation with compressive strength (r=0.60, R2=0.36, explaining 36% of variation). Statistical analysis using one-way ANOVA confirmed batch equivalence in fiber geometric properties (F=1.23, p=0.31). This validates that observed ultrasonic trends resulted from dosage effects rather than batch variability. The findings demonstrate that nonlinear and hybrid ultrasonic parameters provide superior sensitivity over conventional linear methods for characterizing fiber distribution quality and internal material state at 28 days in fiber-reinforced composites. Future work should investigate whether the superior internal microstructural integrity detected at 1.0% RSF correlates with enhanced performance under durability testing protocols (freeze-thaw, chloride ingress, sulfate attack, fatigue loading). This integrated methodology combining mechanical testing with advanced nondestructive evaluation methods enables assessment of material quality. The approach supports optimization of sustainable construction materials and advances intelligent building practices that align with sustainable development goals for infrastructure design and construction.
Supplemental material
Supplemental material - Advanced ultrasonic characterization of recycled steel fiber-reinforced mortars: Integrating nonlinear parameters for optimal fiber dosage determination
Supplemental material for Advanced ultrasonic characterization of recycled steel fiber-reinforced mortars: Integrating nonlinear parameters for optimal fiber dosage determination by Umar Amjad, Mohammad Refa'at A. Rahim Irshidat, Hamad Alnuaimi, Muni Raj Maurya, Naeem Albeitjali, Riyamol K. Razack, Hashem Y. Kailani, Kishor Kumar Sadasivuni and Tribikram Kundu in Science Progress.
Footnotes
Acknowledgements
This work was supported by Qatar University under high-impact grant # QUHI-CAM-24/25-518 and NCBP-CENG-24/25-439. We are also thankful to Engr. Mohammed Matar, General Manager at Bright Future Tyre Recycling Factory, Qatar for recycled steel fibers. The findings achieved herein are solely the responsibility of the authors. The authors acknowledge the use of Grammarly for improving readability and language enhancement during manuscript preparation. All content was subsequently reviewed and edited by the authors, who take full responsibility for the final publication.
Author contributions
Umar Amjad – Planning of Experiments, Conceptualization, Data analysis, Statistical analysis, drafting and editing of the manuscript; Mohammad Refa’at A. Rahim Irshidat - Planning, Conceptualization, drafting and editing of the manuscript; Hamad Alnuaimi – Analysis, drafting and editing of the manuscript; Muni Raj Maurya – Analysis, drafting and editing of the manuscript; Naeem Albeitjali - Experimental work and analysis; Riyamol K. R.– Analysis and editing of the manuscript; Hashem Y. Kailani – Experimental work; Kishor Kumar Sadasivuni – Planning and editing of manuscript; Tribikram Kundu – Planning and drafting of manuscript.
Funding
The authors disclosed receipt of the following financial support for the research, authorship, and/or publication of this article: This research is supported by Qatar University under high-impact grant # QUHI-CAM-24/25-518 and National Capacity Building Program grant # NCBP-CENG-24/25-439.
Declaration of conflicting interests
The authors declared no potential conflicts of interest with respect to the research, authorship, and/or publication of this article.
Data Availability Statement
Data supporting the conclusions of this article are included within the manuscript. Additional datasets generated during this study are confidential.
Supplemental material
Supplemental material for this article is available online.
References
Supplementary Material
Please find the following supplemental material available below.
For Open Access articles published under a Creative Commons License, all supplemental material carries the same license as the article it is associated with.
For non-Open Access articles published, all supplemental material carries a non-exclusive license, and permission requests for re-use of supplemental material or any part of supplemental material shall be sent directly to the copyright owner as specified in the copyright notice associated with the article.