
Abstract
The structural adequacy challenges of railroad track structures have received considerable attention globally. Track defects and failures due to weak strength and buckling effect account for one-third of all railroad accidents. The current paper provides a comprehensive study of the recent work on the structural adequacy/bearing capacity of rail systems from mechanical engineering perspectives; existing techniques for track stiffness/modulus evaluations, including standstill and continuous methods. Further, this paper demonstrates the current techniques for track stiffness/modulus evaluation. Prevailing track modulus techniques, while accurate but time-taking, effortful, requires a track closure and provides only single-point information. Also, this review provides a suggestion on the non-destructive and non-invasive technologies for example Ground-penetrating radar (GPR) and evaluation of the substructures of tracks as they have great potential for image subsurface features.
Keywords
Introduction
Bearing capacity challenges of railroad track structures have received considerable attention on a global scale. For example, international conferences have been held ten times on the predominant issues related to the bearing capacity of railroad track structures. Also, it provided a forum for promoting efficient design, construction, and maintenance for transportation infrastructure. The Office of R&D - Federal Railroad Administration (FRA) has a specific division dedicated to tracking areas that focus on improving transportation safety; this division comprises track structure and track-train interactions. Track quality is affected by track geometry and track stiffness; railway track evaluation methods and theoretical research determine the constraints in the track quality that are needed to overcome.
To develop robust railway track inspection, maintenance, and design solutions, it is necessary to take appropriate measures to measure railway track performance. To measure the track's performance, railways are using two types of evaluations: Functional and structural. From the user's point of view, functional evaluations relate to the track's version. These related measures include track geometry and driving comfort pertaining to the vehicle track system dynamics. The evaluation of structural conditions is associated with the structural integrity of the track system. It includes track deflection and stiffness related to the track's long-term performance.1–24
The variation of track positions both lateral and vertical is called track geometry. These are related to the longitudinal work; track layout, shape design, or alignment are called design geometry, and irregularities, roughness, and quality of track geometry are called deviations. The stability and the track structure geometry play a significant role in the railway track substructure, especially its ballast and sub-ballast layers.1–24 The track recording or geometry cars are known as the track geometry inspection vehicles. These inspection tools measure critical track geometry such as curvature, gauge, track cant or superelevation, cross-level, alignment, surface profile, and twist or warp which have become a standard inspection procedure of the track, mostly track geometry. Track recording cars may be either rail-bound which are self-propelled/hauled via a locomotive or Hy-rail vehicles with both on rail and on-the-road capabilities. Several evaluation methods are developed to evaluate track stiffness, such as dynamic, impulse, and quasi-static methods, depending on the form of excitation. Strong nonlinearity and frequency-dependent characteristics are seen in the track stiffness, and thus the measured value of stiffness under various amplitudes and frequencies of external load can vary enormously.
Track defects cause almost one-third of all rail accidents. Track problems occur due to weak strength and buckling. In addition to influencing the deformation, strength and stiffness of the track, the track defects can affect the friction coefficient of the rail surface as well as the contact behavior of the structure under the rail and sleeper. For example, the defects of rail surface including corrugation, shelling, spalling and cracking form due to the friction between the train wheel and rail, resulting in an irregular rail surface and further inducing sleeper hanging defects. The vertical stiffness/module of the track, which tests the vertical stiffness of the rail foundation, is one aspect that has a significant impact on the track's efficiency and safety. The prevailing track modulus techniques, while accurate but time-taking, effortful, require a track closure and provide only single-point information. Also, this review provides a suggestion on the non-destructive and non-invasive technologies like ground-penetrating radar (GPR) and evaluation of the substructures of the track as they have a lot of potential for imaging subsurface features. The method is based on the principles of electromagnetic (EM) waves being reflected from and transmitted across separate layers with different dielectric properties. A single EM energy pulse is launched into the ground at a sufficient frequency, and reflections are captured in the form of an image from different subsurface layers.
In the last decade, high-efficiency, non-destructive testing techniques for track inspection such as GPR have developed.25–30 The GPR measuring techniques hold the train-borne advantage, efficient data collection at average train speed over a long section. Since it is an electromagnetic system, it is not affected by the interaction of vehicles and tracks. Besides, the most dominant track stiffness components are the ballast layer and subgrade and GPR implementation offers new possibilities for indirect track stiffness monitoring. GPR is used to classify the ballast layer and investigate the subgrade conditions in laboratory experiments and field evaluations. In general, the relationship between the track stiffness and description parameter shows a strong relationship with the ballast layer GPR calculations and subgrade state, indicating that GPR has a bright future in track stiffness investigations. GPR cannot calculate the ballast layer's state under the crosstie; therefore, the GPR evaluation is taken at the midpoint of the two rail seats. Interpolation is then used to create the supporting layer throughout the entire segment.
The GPR evaluation may determine track stiffness quality at relatively long wavelengths; however, GPR cannot determine the condition of the supporting layer underneath the crossties.
The GPR evaluation is a promising indirect approach for determining track stiffness variance over a relatively wide range of waves. Synthesized the traditional track geometry evaluations, stiffness, and non-destructive testing methods to perform track structural health monitoring and diagnosis, as shown in Figure 1.31,32

Example of root-cause model. 32
The goal is to identify track problem root causes such as
(a) Rail issues (low welding, inadequate joint insulation, and insufficient joint insulation);
(b) Issues related to ballast (ballast fouling and settlement of ballast);
(c) issues related to soil and embankment (settlement of soil/embankment and drainage).
Structural adequacy/bearing capacity of railway track system
A rail system's bearing capacity can be quantified using the conventional advanced stress analysis of concrete composites. Because the railway track comprises a series of subsystems, the system bearing capacity is dominated by the weakest subsystem. As a representative example, it shows the stresses in the respective subsystems in Figure 2.
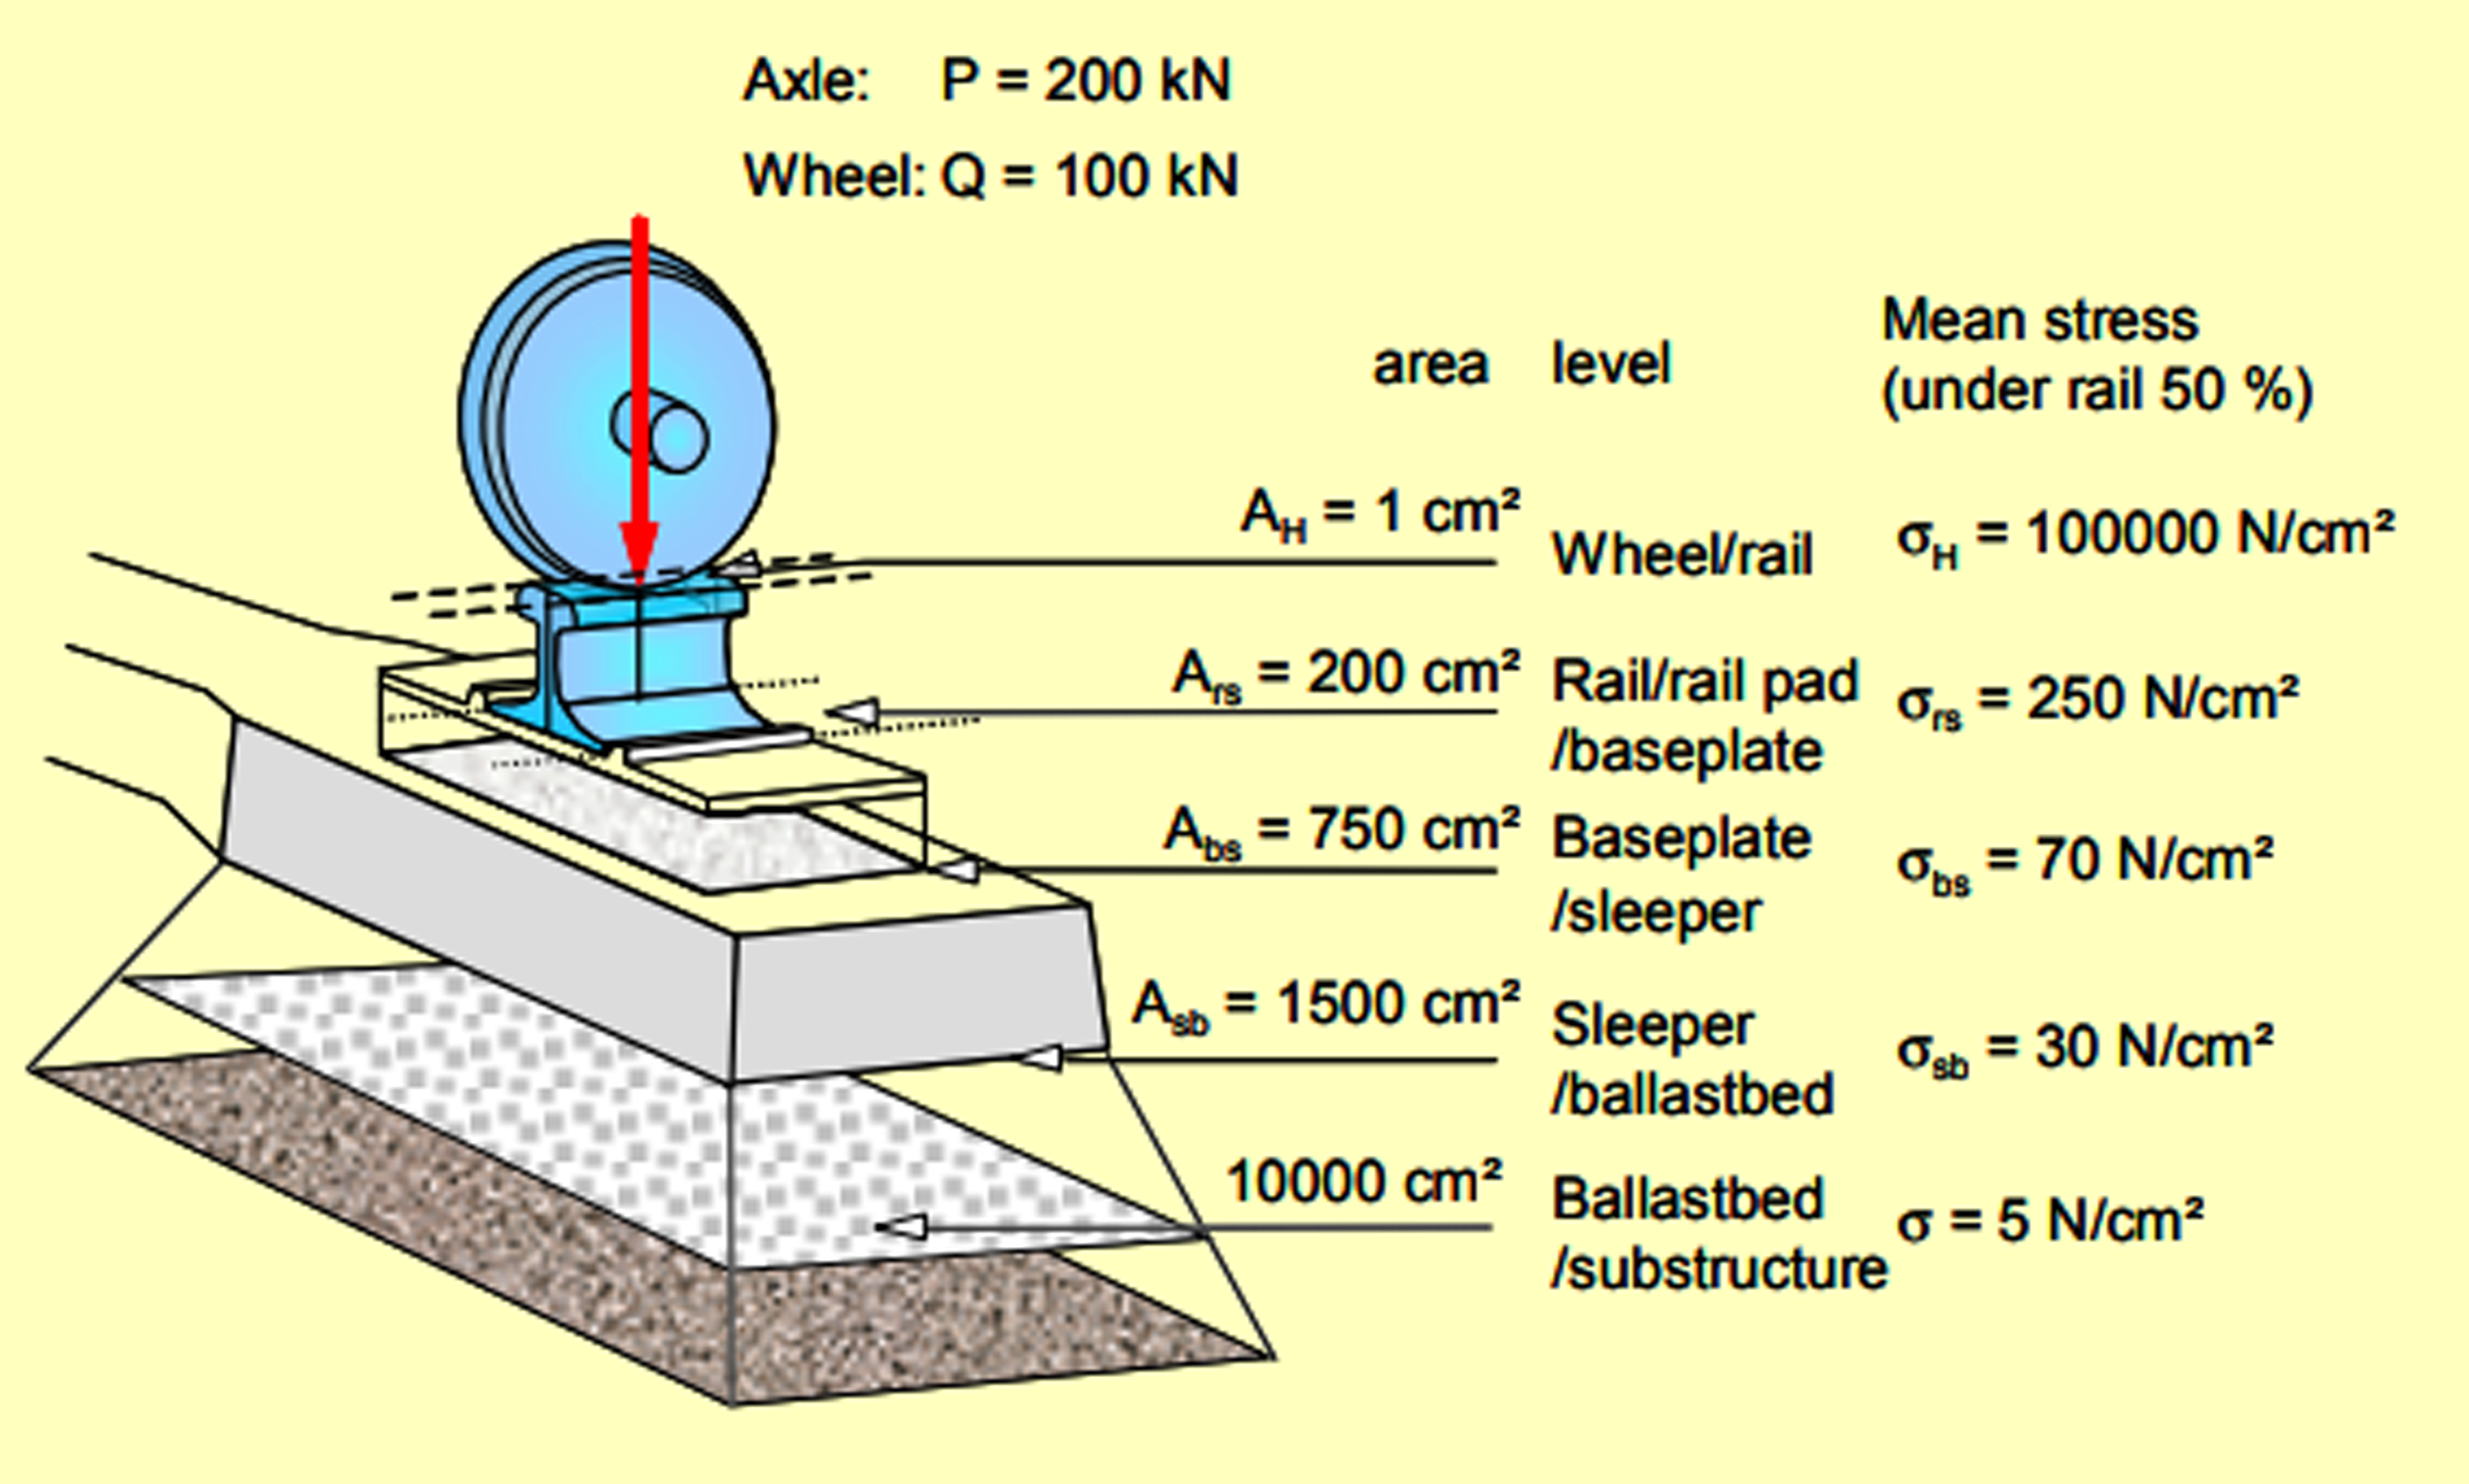
Representation of the stress transfer system. 15
The bearing capacity of the ballast is determined by the threshold

The track modulus is used for general assessment. This coefficient tends to define the track stiffness by the unit of length, resulting in p(x) = k·z(x). Mathematically, k represents the track modulus (N/mm2). It is easy to understand this coefficient as it is equal to a uniform load p(x) applied on the rail that generates an absolute displacement. One of the most used parameters to describe a track's elasticity is the corresponding coefficient of stiffness.

Relations between stiffness-related parameters (teixeira, 2003).

Track stiffness and the dominant portion, i.e., ballast stiffness, are displacement/load-dependent and frequency-dependent. Table 2 summarizes the frequency dependencies of the relevant quantities. Broken rails and track geometry problems cause a mechanical failure with results in the derailment of the train.33,34
Description of cause group (x-axis) for above chart. 33
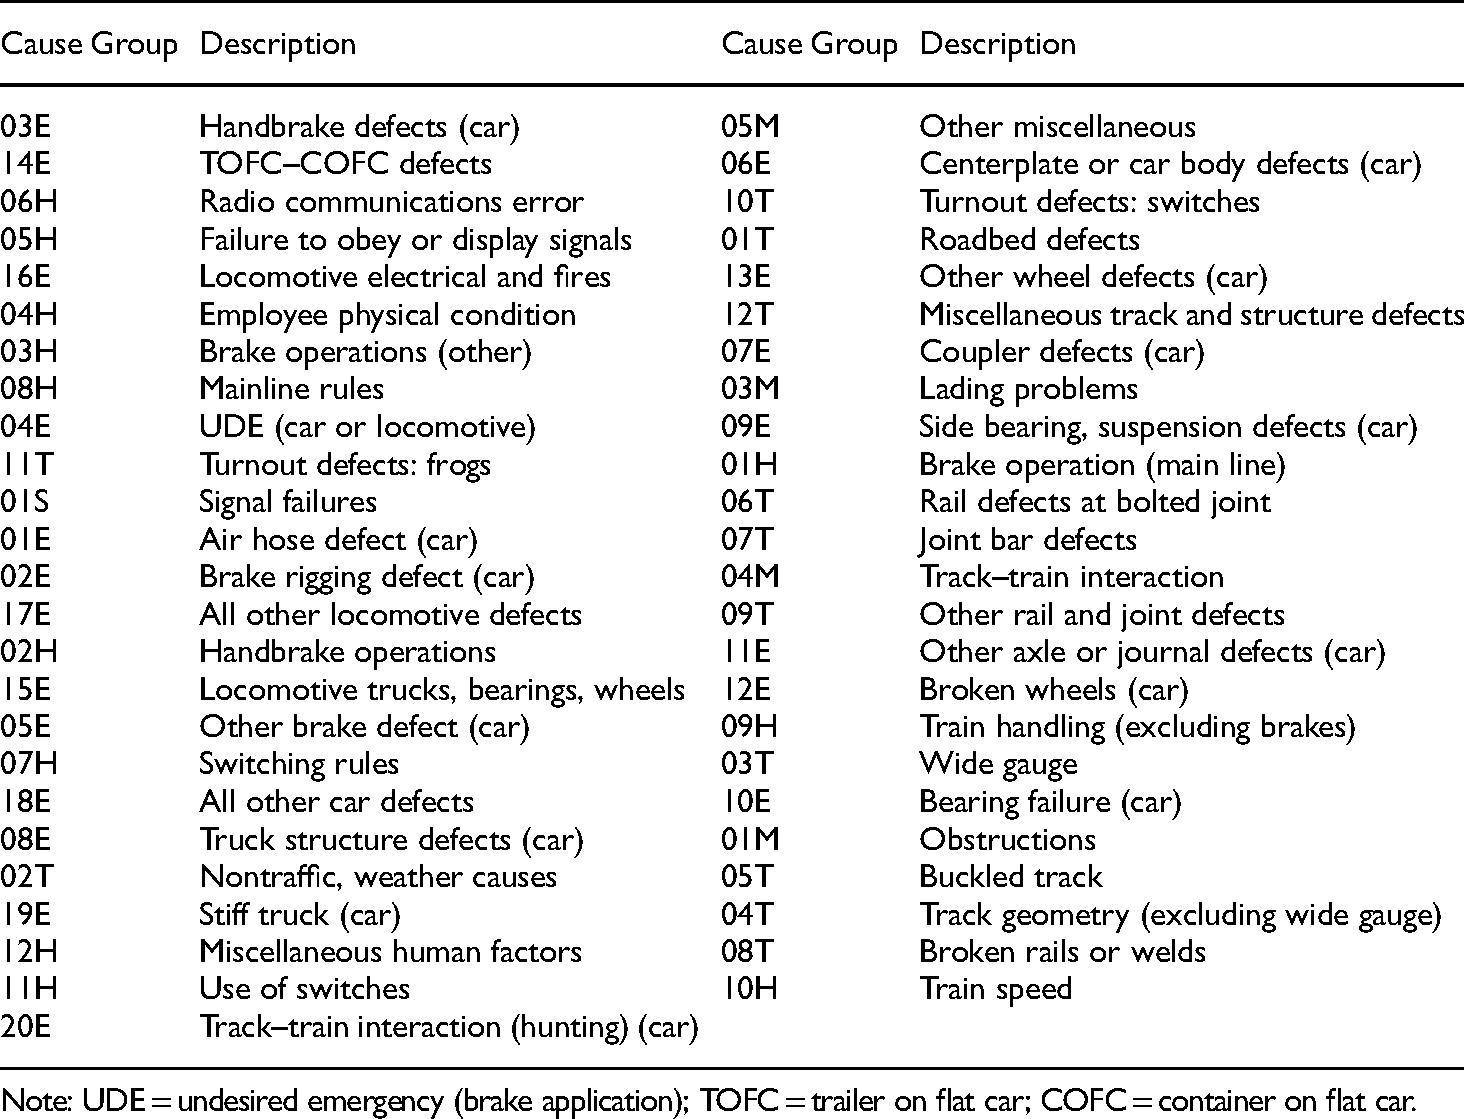
Note: UDE = undesired emergency (brake application); TOFC = trailer on flat car; COFC = container on flat car.
Derailments that cause a broad gauge under dynamic loading are a safety concern. FRA extensive research developed a gauge restraint evaluation system (GRMS) which is used to estimate the track's ability to maintain a gauge under service load conditions. When GRMS data provides an understanding of gage widening derailments and improved level of safety together with the maintenance efficiency from the unbiased evaluation of tie conditions, GRMS technology is adopted widely.
The cutting-edge GRMS equipped vehicle uses a fifth split rail axle that has the capacity to load the two nearby tracks sideways. When a load is added on the rail motion, weak links and fasteners are identified both on the combined vertical and later. Regardless of the roll, pitch, or vertical movement of the car's body suspension, apply continuous perpendicular loads to the rails. For stowage testing, it raises and lowers the split axle. If the track curvature changes, it orients the split axle such that the wheels are tangential to the rails.
FRA's track safety standards have been developed to add the GRMS testing. This initiation is based on data provided by the rail FRA's rail-bound GRMS vehicle. The FRA GRMS vehicle is used to evaluate the track structure's ability to maintain a gauge under service load.
Broken rails have been inspected by several technologies such as ultrasonic, magnetic field techniques, radio graphics, eddy current detection, electromagnetic techniques, magnetic induction techniques, and acoustic emission methods.35–39 The bearing potential of tracks and track subsystems has been calculated in numerous studies.40–44 Typical rail defects are rail corrugation of short and long wavelengths, dipped welds and joints, pitting, and shelling, which can be identified based on the shape of dynamic load signals from the monitoring data. Based on force evaluation, essential to monitor real-time rail defects because the high impact loading caused by these anomalies will reduce the safety levels of a railway track; therefore, capacity is unexpectedly reduced by thermal effects and the occurrence of severe events. For example, high impact loading may drastically reduce the ability of concrete crossties if the crossties deteriorate due to excessive wear, such as abrasion, in the presence of surface moisture. The geotechnical behavior of the ballast, including shear strength, ballast breakage, and container pressure, has been determined through numerical, analytical, and laboratory tests. The subgrade rail track failure mechanisms were summarized as shown in Figure 3.

Cause and effect study of failure mechanisms for railway tracks built on fine-grained subgrades. 45
The results of both theoretical and experimental research aimed to predict the Vibro-dynamic load-bearing capacity of railway track ballast 46 The analysis of the existing ballast strength determination techniques has several disadvantages that lead to significant calculation errors. Limit Equilibrium Theory, by Sokolovsky, developed a mathematical model for describing the critical stress of rail track ballast, by studying how inertial forces affect the ballast and sub-grade as the rolling stock shifts.
When trains are running on a railway track under a crosstie base, both external and internal considerations come into play. The strength of the ballast layer and the subgrade, primarily, determine the resistance to damage under the influence of external forces. The state of limit stress occurs in the ballast layer where a minor increase of dynamic load in the solid surfaces of the ballast layer and subgrade, and shear force holds the exceeding forces caused in the ballast layer. When the shear force exceeds the restraining force, a separate area will form those sliding surface areas. However, the particular sliding area does not have large deformation. Also, they appear in the soil under limited even load. In large areas, surfaces soil shear deformation spreads, when loads are the same or higher than the limit loads. Consequently, under the state of limit stress, the active loads and the limit loads that are dependent on the strength of soil are equal and limit equilibrium. This condition is referred to as a correlation between soil strength and stress tensor. The ballast bearing capacity is dependent on the ballast layer's state of limit stress; the subgrade limit relies on the crosstie's pressure or the ballast47,48
Damping behavior is one of the important factors in dynamic stiffness evaluations of track structures. A novel method is proposed by the authors 49 to solve the damping problems and evaluate the amount of damping in a structure, through the equivalence of friction action to the viscous damping in a spring-friction isolation system, focusing on purely concave friction distribution cases, uniform friction distribution cases, and their combination cases. This offers excellent insight on evaluating the damping of track structure from friction distributions of contact interfaces.
The strength and stiffness of the components around the contact interface will affect the sliding behavior of the contact interface. The authors 50 have successfully constructed a system to realize an accurate analysis under the plane friction coupling effect of friction pendulum system. As the conclusion drew in the paper, when a specific ground motion is input, the shear keys in the structure will cause the friction pendulum system to have unwanted and harmful motions, resulting in the strong nonlinearity and complexity of the time history response of the bridge superstructure and greatly affecting the seismic isolation performance of the structure. To solve this problem, a Spring-Viscous Damping-Coulomb friction plane isolation system with XY shear keys is constructed, which realizes the detailed and accurate mechanical analysis under the plane friction coupling effect of friction pendulum system and realize the calculation of the time history response. This is a quite innovative way to get a better seismic isolation performance and should be applied to more structures like track structure.
Track stiffness/modulus evaluations at standstill condition
Vertical track stiffness is a critical measure of a railway track's structural integrity performance, and it is useful to determine the poor performance of a railway track. New tracks especially those built for high-speed lines must be designed and constructed to appropriate standards to ensure that the track stiffness is within an acceptable range of values. On one hand, if the track stiffness is below the acceptable limits, excessive track displacements can occur. On the other hand, unacceptable track deterioration may occur when the stiffness is higher than ideal.
Vertical railway track stiffness and its spatial variation are essential to measuring the railway track's structural condition. They are essential considerations in the track design and the correct diagnosis of track maintenance problems. Theoretically, there is an optimal track stiffness to which a railway line should be designed, constructed, and maintained. Below this optimal value, extreme track displacement and unacceptable track degradation may occur. If the railway track is not sufficiently rigid, load concentration can occur while the train's weight is spread over fewer supports leading to increased wear of the ballast and track stiffness changes, differential settlement. This differential settlement speeds up the track's deterioration and increases train-induced dynamic forces, worsening track geometry, thus speeding up the entire track structure's deterioration. If a track is not stiff, it affects the adjustment of the track and various subgrade failures. Spatial changes in track cause the disturbance in track/track interactions, leading to the degradation of the track superstructure and substructure. These issues include the problems related to the rail and the crosstie fatigue, including the track settlement because of the ballast's permanent deformation. The rate of deterioration of the track components and settlement depends on the severity of the stiffness difference. Moreover, irregularities in track stiffness trigger vibrations both in the train as well as the track. In many cases, the variation in stiffness along the track is random; longwave variations produce low-frequency random train oscillations, causing passengers to have poor ride comfort; moreover, these track vibrations cause disturbances in nearby buildings. Transitory and high-frequency track vibrations are produced when changes suddenly under track stiffness, such as turnouts and transitions from ballast to slab track. This issue results in localized track deterioration, such as fatigue of rails and crossties, cracks, wear, and plastic deformation. Several methods are adopted to evaluate the vertical track stiffness. The main difference exists between the measuring distance at discrete intervals while standing still and measuring stiffness while moving (rolling evaluation). Standstill evaluations are useful in research, whereas rolling evaluation techniques are in their origin; however, they are more used in production.
As stated earlier, vertical track stiffness is a function of frequency, and for the stiffness of the track must select an appropriate evaluation device based on the frequency of interest Geotechnical and geodynamical problems are related to the track's static and low-frequency characteristics. Track stiffness evaluations at these frequencies may help investigations related to bearing capacity of subgrade, surface vibrations, and soft-soil issues. High-level frequency involves issues related to ride comfort, noise, and train-to-train interaction.
The relationship between the applied force and displacement reaction of the rails is track stiffness. The track stiffness varies depending on the frequency, dynamic amplitude, applied preload, and location along the path. Track stiffness is a vital interface factor with a relationship between the wheel-rail and changes in track stiffness and low and high extreme values that affect the track's deterioration. Track stiffness can be measured both at a standstill and when rolling down the track; there are various approaches to rolling evaluations, all with different pros and cons.
A track impact factor (TIF) evaluates the effect of vehicle dynamics on the track; TIF is a coefficient used to estimate the rise in the dynamic load of the train and a major element in determining the dynamic stability of railway tracks. 51 Many TIFs only consider speed as a vector in various world regions in ballast and slab tracks. The track stiffness felt by a train varies throughout the track; 52 the stiffness difference is often considered within a short span of distance.
An example of an unsupported crosstie dangling from the rail. The strength of the rail would be very low, and the bending stiffness has a discontinuity with insulated joints. The transition from an embankment to a bridge is an added example of a sudden variation in the stiffness of the track. Mass and stiffness change rapidly. Those changes give variation in the track's stiffness; thus, it gives the difference in the contact force of the wheel/rail. Rapid changes can exacerbate track deterioration, such as accelerated wear, fatigue, and track settlement caused by the ballast, and substructure's permanent deformation. The changes in the wheel/rail contact forces will escalate as soon as the geometry of the track begins, which gives the deterioration and eventually the deterioration of the track. The possibility of smoothing out track stiffness variations is discussed here. It has been demonstrated that altering the track stiffness can substantially decrease the variations in wheel/rail interaction forces. Grouting or under crosstie pads are used for those differences along the track.
The track stiffness has been extensively measured. Depending on where the sensors are mounted, these measuring strategies are classified as track-borne or train-borne. The most used sensors are inductive transducers, strain gauges, velocimeters, and accelerometers. For train-borne methods shall collect the deflection, deflection velocity, or track acceleration under train runways or other manually applied loads. The vehicle-track relationship is defined in train-borne methods by vehicle response, axle acceleration, or calculation of the vehicle's track response. When two methods are compared, train-borne evaluation methods can efficiently collect data over long distances. However, this method requires specially equipped vehicles. Track-borne techniques, on the other hand, allow for the investigation of a short segment of the track but are not ideal for long section evaluations.
The standstill evaluation of track stiffness can be done with many methods, as explained below3,14,15,53–60 Conventional hydraulic jack loading approach: In a conventional hydraulic jack, apply a specific force to the rail, then measure rail deflection with a precision displacement dial/meter, and therefore a force-displacement curve obtains. Calculations may be performed using stiffness concepts such as secant or tangent stiffness. Method of impact hammer: This is a simple technique for measuring the track stiffness. Track stiffness can be measured by attaching accelerometers or displacement sensors to any number of crossties or rails and measuring the response during a train's section. If the axle load is specified, the corresponding stiffness for the track segment can be determined. Dynamic loads are considered for better accuracy, so the train's load can be measured with strain gauge sensors on the rail web or the crosstie. The standard result of such a calculation is a load-deflection map, with the stiffness defined using either of the stiffness concepts. A handheld impact hammer is used to strike the rail, crosstie, or ballast To calculate the impulse, a force sensor is attached to the hammerhead, and an accelerometer is attached to the railhead or crosstie. The conversion function between the hammer's impulse force and the rail's acceleration can be determined. Falling-Weight Deflectometer (FWD): It is a device that is commonly used to test the stiffness of the track structure, precluding rails. A weight is dropped from a specific height onto elastic buffers placed on a footplate in the traditional FWD system. The impact in the middle of the plate is measured by the load cell, and the surface velocity at different distances from the footplate is determined by velocity sensors. At that point, Integrate the velocities to obtain vertical displacements. This loading system produces a load pulse equivalent to that employed by a single axle of a high-speed train. At the center of the beam, measure the load applied. Place the velocity sensors on the loaded crosstie and the ballast at different distances from the beam's center. Travel loaded vehicle (TLV) Vehicle loading track method: The TLV method is similar to the traditional method of loading the hydraulic jack. However, this method is more comfortable and can provide greater upward force. A TLV uses the help of hydraulic jacks to load the track. The railheads are loaded, and the crosstie can be loaded with the decoupled rails as well. However, various loads can be applied, depending on the equipment. TLVs are owned and operated by several railway base companies. The Swedish TLV, for example, weighs 49 tons and can load up to 150 kN statically and up to 200 Hz dynamically on each rail. It can further measure the stability and stiffness of the lateral track. The main advantage of a standstill TLV over rolling evaluations is that the evaluations can be significantly more intensive in terms of variance of preload, dynamic load, and frequency spectrum. However, the procedure is more time-intensive and necessitates the closure of the railway track to all vehicles passing by.
The total track stiffness can also be measured using the following methods: the “PANDA” method and by using different types of sensors (devices) such as strain gauges, velocity, accelerometers, displacement, and transducers. Penetration testing (static or dynamic) was also used. The localized track stiffness is measured using a penetrometer known as “PANDA". This penetrometer determines the resistance of the track structure layers to the penetration of the cone. Using field evaluations with “PANDA” combined with endoscopy, different track structure layers can be identified, and layer thickness and cone penetration resistance. Further, track deflection can be measured by the following methods: particle image velocimetry or digital image correlation, and different conventional sensors, optical sensors, geophones, multi-depth deflectometer, and linear variable differential transformers.
The cone penetrometer is a widely used soil testing device adapted for inspecting ballast and subgrade states. A standard cone-shaped probe with a force evaluation tip is used for the evaluation. This tip is continually pushed downward from the ballast surface into the subgrade. Usually, the cone probe is pushed below 15 to 25 feet of the surface to depict the depth of impact of the substructure on track deflection. The cone probe penetration test (CPT) measures the strength, stiffness, and substructure thickness directly. The applications of the CPT at railways are:
Determination of railroad ballast strength, sub-ballast, and ballast subgrade zones Determination of the depth of ballast as well as sub-ballast zones Determination of any differences in strength properties around these zones Examine the thickness of the ballast/sub-ballast to ensure that it is adequate to avoid subgrade failure. Evaluation of the efficacy of subgrade enhancement methods such as lime slurry injection.
Different types of motion transducers were used for track deflection evaluations. Although the displacement sensor is only helpful for relative displacement evaluation. Accelerometers are the most used displacement transducers because of their simple mounting and great dynamic and frequency ranges. In addition, geophones (seismic sensors) are used because of the advantages they have, such as measuring high amplitudes of displacement, easy power source, and relatively inexpensive. Rail deflection can be measured using laser Doppler anemometry and high-speed video cameras. However, these two methods have relatively higher costs compared to that geophone.
On a high-speed railway line between Madrid and Barcelona, both direct and indirect evaluations, laser beam sensors, and geophones respectively are taken. 61 Laser beam receiver and geophones are clamped next to each other on the rail. After signal processing, it was evaluated that the maximum displacement amplitudes measured by the geophones are compared to the laser system's amplitudes.
Track stiffness for preventive maintenance is measured in four ways:
Deficiency of track stiffness: After a certain operation period, railways constructed in delicate soils and poor soil tend to undergo severe rail dislocation and rapid track segment cracking. These disorders are caused by weak soil sub-grade stiffness and should therefore be strengthened. For the safe operations of the train, it is essential to check railway lines in time. Varying track stiffness: Since stiffness varies abruptly, transition zones should be set accordingly.
24
Also, if the geometric irregularity of the track is worsened, the track support would be unequal. Virtual railway track stiffness: Unclean ballast, hanging crossties, and loosen fasteners can cause rail support deformation and holes, resulting in virtual stiffness. Train safety can be jeopardized by virtual stiffness. Assortative stiffness: The right and left rails’ unrivaled supportive rigidity results in the variable displacement of the rail. It can cause crosstie center bending and other abnormal stresses, as well as track component cracking.
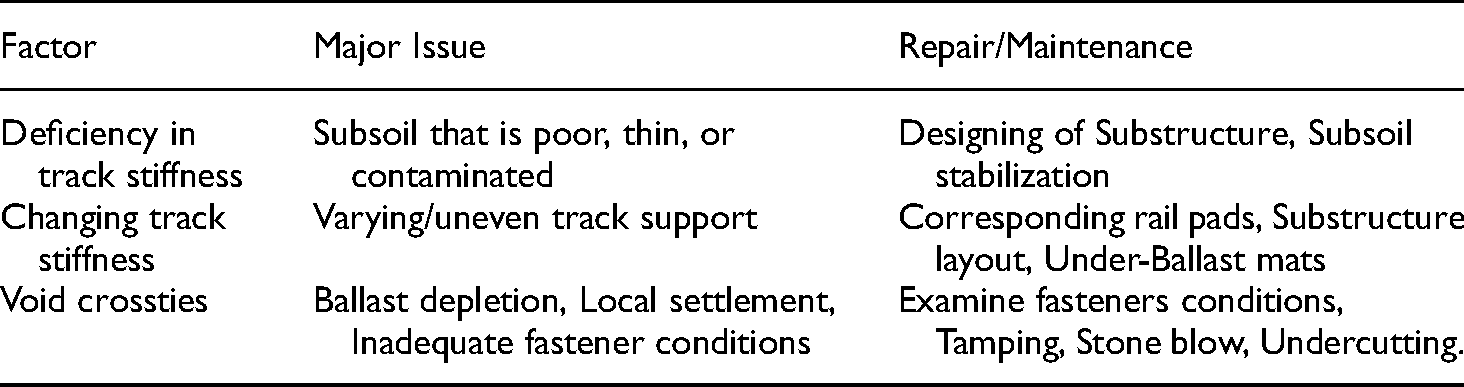
Track stiffness analysis can help guide routine railway line maintenance and provide a consistent foundation for planning optimum preventive maintenance policy. A fundamental track design and maintenance parameter that dominates the bearing capacity is vertical track stiffness (ratio of track load to its deflection). For a long time, vertical track rigidity or track modulus has been considered a critical parameter of the track's structural condition. Different types of track stiffness problems could lead to various maintenance actions.17,62 Table 3 summarizes the findings.
Relationship amid track stiffness and track problems/maintenance. 17
Many methods have been developed for track and subsystem evaluations.63–69 Figure 4 illustrates a diagram of the ballast test using an impact hammer.

Schematic of impact hammer ballast test. 69
The force sensor on the impact hammer measures the pulse, and the accelerometer is mounted on the railhead/crosstie. The conversion factor between the hammer's impulse force and rail acceleration is calculated based on the material used on the hammerhead top. The hammerhead can cover the frequency interval between 50–1500 Hz; for example, rubber has a lower frequency than metal since frequencies below 50 Hz are not registered. The impact hammer test is suitable for problems related to vibration, noise, and wheel-rail interaction forces.
As another example, the deflection of the rail can be measured using the optical method, as shown in Figure 5. 64

Setup of an optical evaluation device and a data collection system. 64
The authors’ methods for estimating the railway track vertical stiffness are discussed below. 65 This is focused on the calculation of the vertical deflections of the track during vehicle travel down the track at a speed of 5 kmph. A non-contact approach was used, which included two high-quality cameras (up to 0.05 mm) and two objectives. Then Place a camera pointing towards the rail and fix the targets to sleep. The train route film was studied, and selected frames were preserved for post-processing. The time gap between film frames in this example is 0.02 s, or 50 frames per second (fps).
A similar control method for evaluating rail displacements was shown. 66 In this case, the authors used a high-speed video camera with a frame rate of 250 fps. So, fix the video camera in the vicinity of the track. A method similar to an accelerometer was used by the webcam. In other words, the accelerometer was mounted along the track in order to increase displacements communicated from the ground to the optical device. 67 According to the contributors, the video camera had to be placed well away from the objective target in order to prevent ground vibrations and deflections. A telescope was fixed to the camera to measure longer distances. Set the speed of retrieval to 30 fps. At a distance of 15 m from the target, the device allows for accuracy of 0.04 mm.
Optical systems that use transmitters and receivers have been an excellent option to measure railway track displacement. An evaluation technique was presented by an author in 68 that consists of a laser and an array of photosensors. During the passage of the train, the laser beams are illuminated by the array of photosensors which provides a digital data collection of the target's relative movement to the laser, resulting in a retrieval rate of 15 Hz. In the INNOTRACK European project, 61 To monitor track displacement, a different optical device was used in which the laser beam receives a signal from a 1-D position-sensitive device/sensor (PSD) mounted in the rail. Based on the laser beam location on the position sensor, a voltage signal was produced. Calculate the rail's vertical movement after analyzing this signal. The equipment has a nominal resolution of 0.001 mm and an accuracy of 0.01 mm, according to this. It also has a 6 m distance between the laser beam and the position sensor. 67
Furthermore, indirect methods for estimating displacements have been developed. The authors devised a method that employs low-frequency geophones which are installed on the crossties to study complex track displacements. Geophone sensors provide a voltage output proportional to motion velocity, which can be filtered and incorporated to derive displacement. However, at low frequencies, the sensors exhibit operating limitations, resulting in displacement amplitude distortions that must be reduced. As a result, for closely coupled bogies, only a single occurrence can be observed. The European project INNOTRACK used a geophone in conjunction with a laser system for rail displacement evaluations. Again, the geophone output signal had amplitude distortions that needed to be corrected.
After studying and contrasting the technology, several flaws in the proposed techniques for assessing railway track displacement were discovered. The Position Sensitive Detector/laser beam systems have fewer benefits because they are not flexible to open platforms. Also, they do not support many sensors. Geophones cannot detect the quasi-static components of displacement. High-speed cameras are comparatively costly, and post-processing steps necessitate a powerful computer with plenty of disk space.
As previously mentioned, railway track stiffness is a frequency function, and it is important to choose a suitable evaluation instrument based on the frequency of concern. Geotechnical and geodynamical problems are mostly related to the track's static and low-frequency dynamics. Evaluation of the frequency is very useful at the track stiffness for investigating the bearing capacity of subgrade, soft-soil issues, and ground vibrations. High frequencies are linked to issues with noise and train-rail contact forces. Similar disturbances are introduced by wheel out-of-roundness and wheel flats. Several organizations have developed rolling devices to measure track rigidity. 70
The track bed's stiffness assessment should include assessing the ballast, sub-ballast, as well as sub-ballast depth and profile of the groundwater.71,72 Research has been conducted to correlate a site investigation that includes GPR, Lightweight Deflectometer (LWD), and FWD testing. The calculated elastic modulus of the LWD was well associated with the calculated elastic modulus of the Dynamic Cone Penetrometer (DCP) at a depth of 0 to 16 inches below the top of the crossties based on the data obtained. For homogeneous ballast properties, LWD evaluations are appropriate for determining rail ballast, when the range is equivalent to the ballast thickness. LWD evaluation may not be suitable if the ballast conditions are not uniform and the ballast between the cribs has different properties than that of underneath the crossties. Railway Maintenance Standing Committee (Transportation Research Board (TRB) Committee AR060) sponsored this report.
A similar study has been conducted; 73 the results are given as an example of a correlation. The strength and stiffness of the sub-grade, as well as sub-ballast layers, determine railway track fulfillment. In the latest days, FWD and other small-scale equipment, such as LWD, have gained popularity for on-site stiffness evaluations, among many other methods. Also, Light Drop Weight (LDW) replaced the German plate-bearing device. Israel believes that the periodic plate bearing test gives the static deformation modulus, which is the same as a surface module. These various devices need the correlation investigation between the LDW device results and conventional methods for instance FWD and DCP. This study concentrates on the similarity amongst these methods and local granular sub-base materials for local silty and clayey soils. Studies have shown that different equipment types can generate different stiffness values; the analytical relationships between the various experiments tend to be complex and possibly location-dependent. Furthermore, this paper explains the DCP test comparison between the stiffness results and California bearing ratio (CBR) values in connection with FWD and LDW tests. The sensitivity of the FWD device's depth of influence was studied for this purpose by (a) a two-layer elastic model's computational study (b) a quantifiable analysis of the FWD results for surface modulus and the variance of CBR values with depth using DCP test methods. The analysis concluded that determining a specific depth of effect is difficult. It is possible to propose approximate responses to establish a unique correlation between stiffness and CBR values 72 shown in Figures 6 to 9.

Relationships between the dynamic deformation modulus (Ev2) measured by the German plate-bearing device and the surface modulus (MLDW) measured by the LDW device. 72

Measured MLDW versus measured MFWD at a chalky-marl embankment construction site [livneh, 2007b]. 72
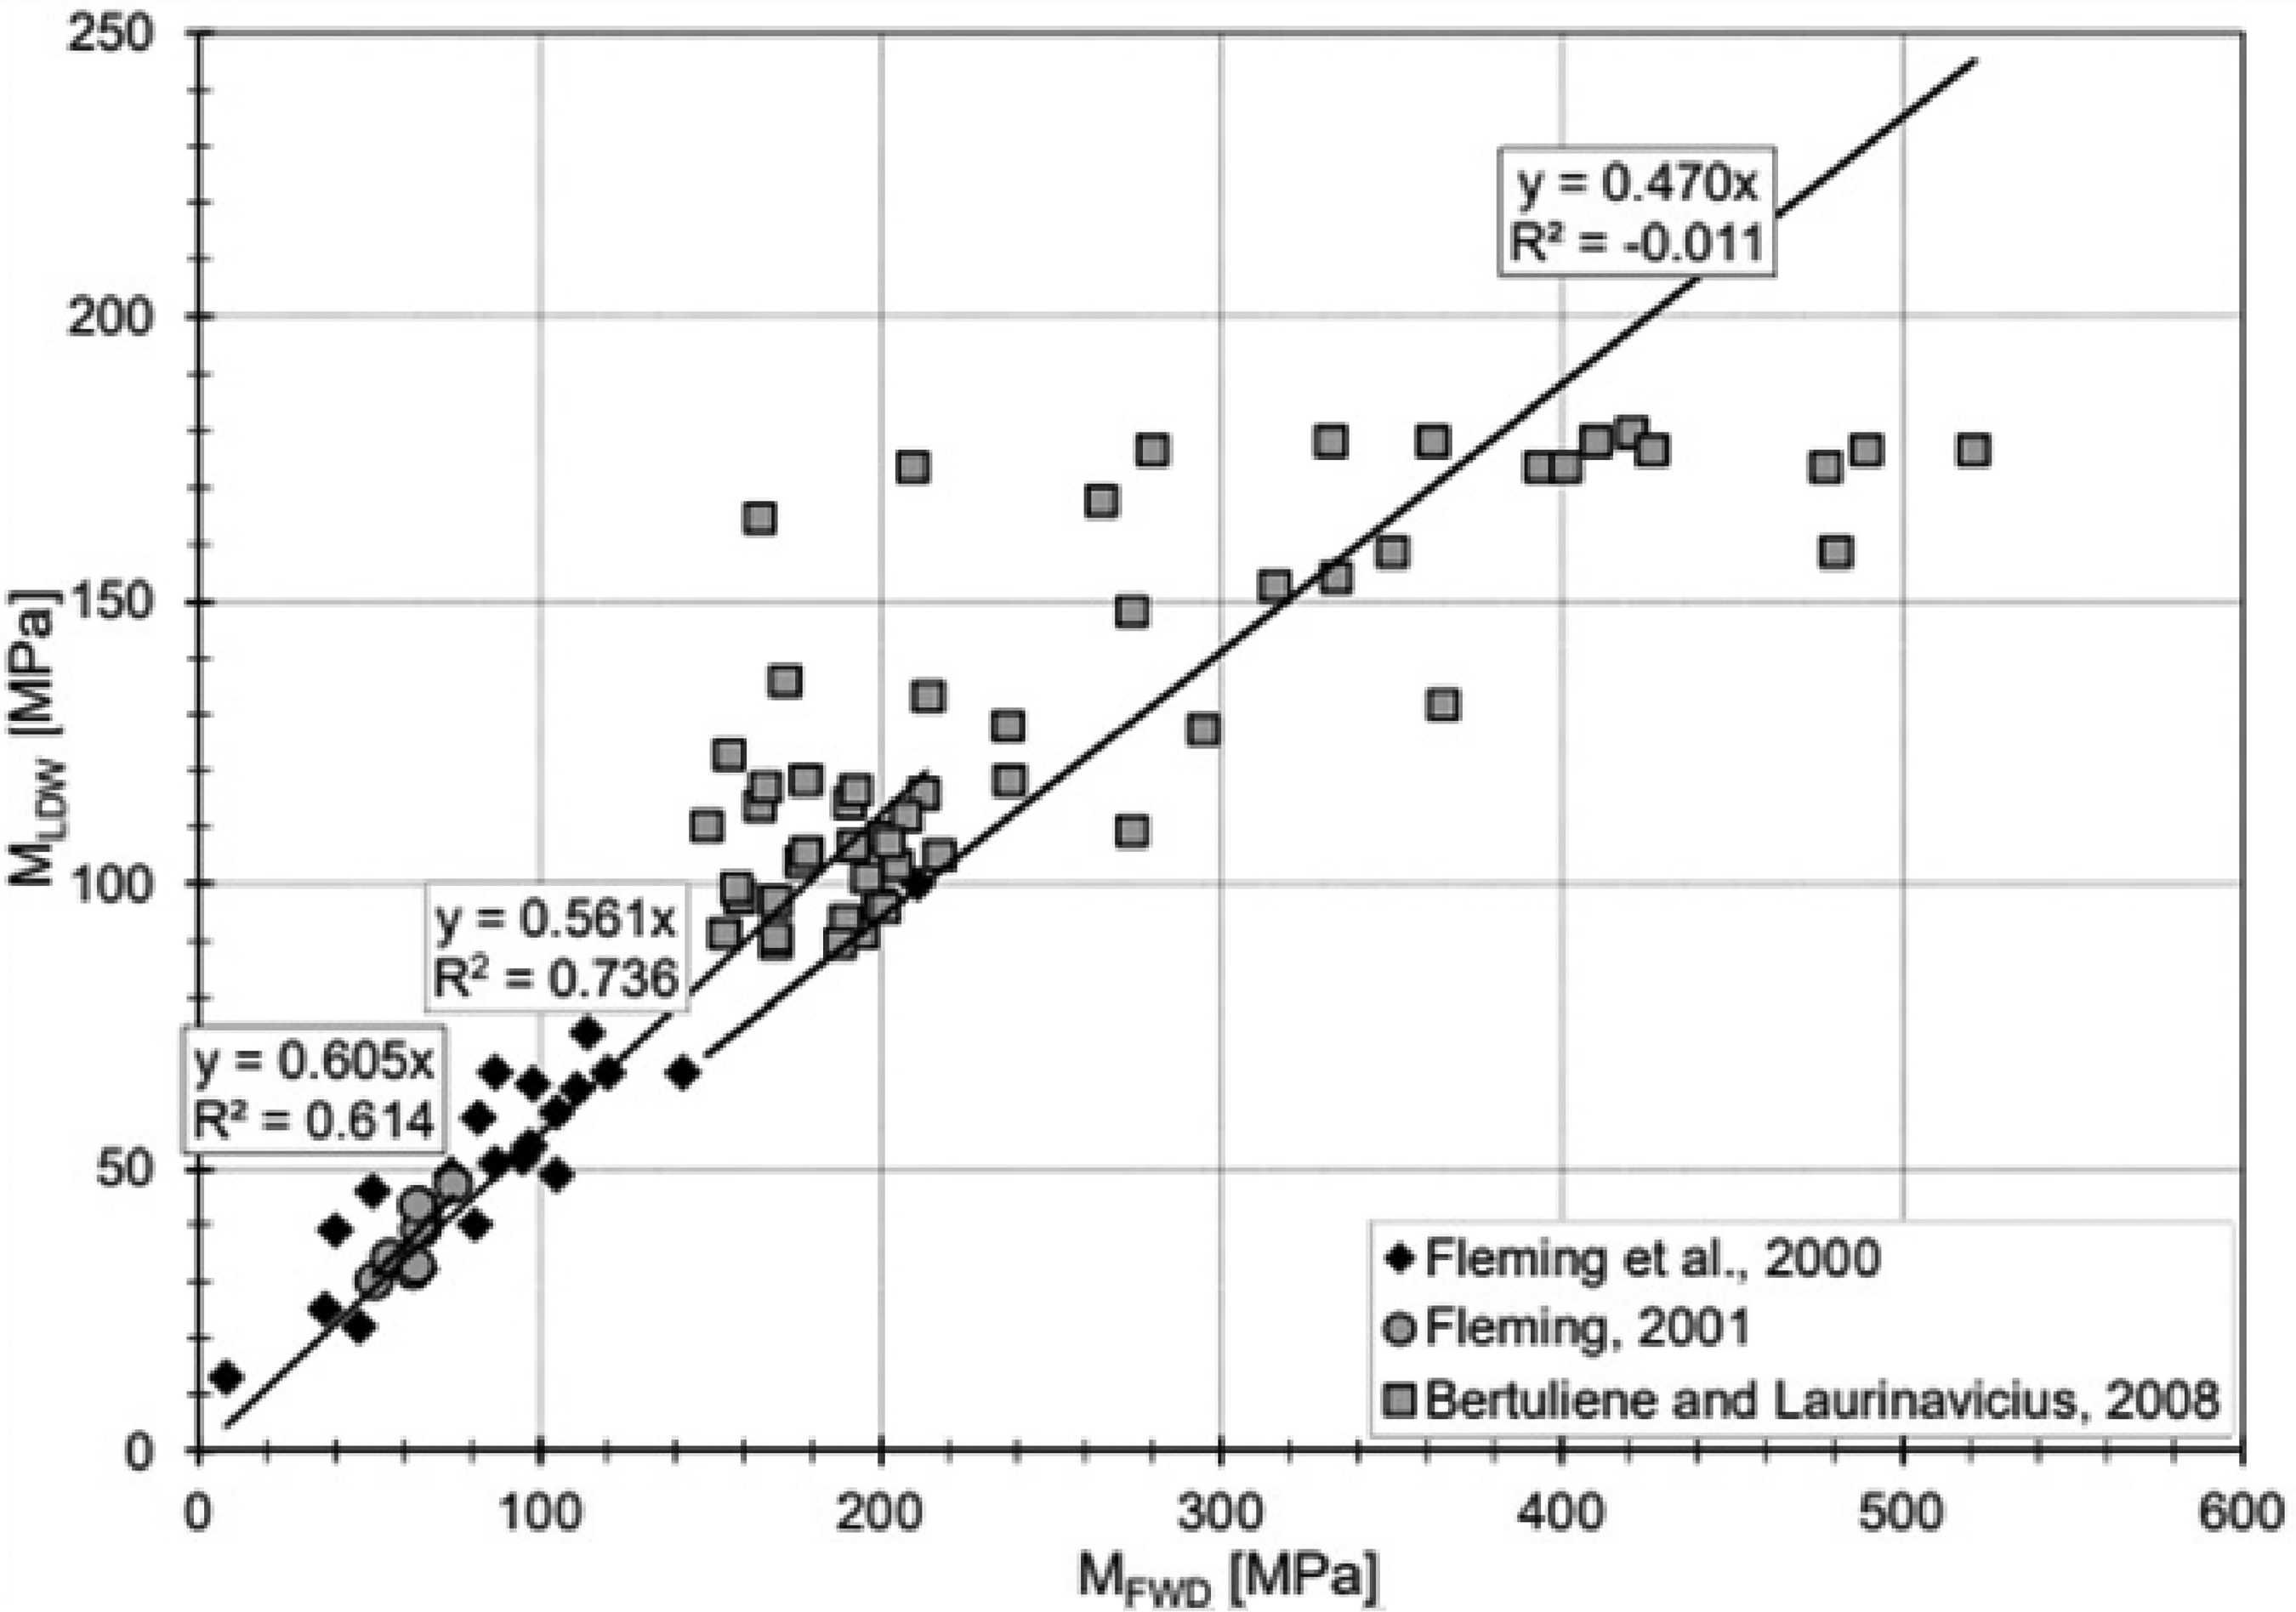
Measured MLDW versus measured MFWD according to [fleming et al., 2000; fleming, 2001; bertuliene and laurinavicius, 2008]. 72

Surface modulus from LDW testing versus in-situ CBR as obtained for local silty and clayey materials. 72
Important maintenance concerns are related to ballast fouling and ballast deterioration. 74 Ballast fouling is connected to ballast stiffness. Fouling happens as a result of the ballast's wear against the bond and other ballast, as well as the disruption of subgrade losses and the removal of soil particles or coal dust from the surface. This study shows the using geotechnical tests, the mechanical properties of fouled ballast Mechanical properties measured include reaction modulus of the subgrade, dynamic deformation modulus, and the CBR values from static plate loading test, Light Weight Deflectometer test, and Dynamic Cone Penetrometer test respectively. 73 The findings reveal similar patterns in these mechanical properties, which are calculated by varying moisture content and fouling. With the increase in moisture content, mechanical properties increased to a certain value and then rapidly decreased after reaching a peak. This study elucidates the similarities that were discovered between these mechanical properties as a result of the experiments.
The potential of railway substructures for fouling and water from ballast was demonstrated. 75 The infiltered fine material settles in the ballast railway system and ballast voids. Fouling is the term used to describe the sand and fine-grained materials found in ballast Reduced hydraulic conductivity and shear strength can be caused by increased ballast fouling. It can also reduce the overall stiffness and modulus of resilience of the track, and eventually, it requires maintenance. The largest ballast fouling occurs when fine materials mix with ballast due to repeated loading. This study uses the strength properties obtained from these test results and uses two frequently used ballast bearing capacity evaluations: Meyerhof and Hanna's model, which considers the track to be a consistent footing over a layered structure. This model identifies two types of failure: punching a single crosstie and a track structure bearing failure. The second model is the slope stability process, which uses a 2-D limit equilibrium technique and slices to quantify a safety factor against slope stability. With the degree of fouling and the water content of the ballast, the Mohr-Coulomb strength properties change, which is likely to influence the track substructure's bearing capacity. These analyses show the impact of water content and the ballast's fouling on the overall track substructure bearing capacity.
Track stiffness/modulus evaluations using continuous methods
Frequently, for maintenance, rolling evaluation or continuous method can be used. Along the track, vertical track stiffness can be measured in a variety of ways, and the majority of the techniques are used for measuring displacement caused by axle load and flexibility of the track under one or two axles. Track stiffness can be calculated by using static axle load. Axle loads behave differently in a two-axle configuration. The lightest loaded axle is then used to remove track anomalies that are affected. Because of the variety of track stiffness evaluation methods that use a moving load, the vertical track stiffness measured by each device for the same track section is unlikely to match due to the reasons described below:
Static preload: In the same section of the track, when static preloads are applied to the wheelset by devices, for the same segment of the track, different stiffness values will be registered. Excitation frequency/speed: To load the track, static moving wheelsets are used, which activate the track at different frequencies based on the vehicle's speed. The frequency content would increase in proportion to the evaluation speed. Since the dynamic track stiffness varies with time, the stiffness specified is likely to vary. Spatial precision: The spatial resolution of the various measuring methods varies. Model dependence: This device measures the deflection of rail at various points near wheelsets because it cannot measure directly under the wheelset. To measure the wheelset directly, use a rail bending model to determine the deflection of the rail. Furthermore, these simulations are not true to practice and may result in ambiguity and inconsistencies. The extent to which track anomalies have an effect: Irregularities like longitudinal level can impact the stiffness evaluation. The deflection transducer used in the device has a deflection combination due to flexibility of track and displacement and anomalies in the geometry of the track. Roundness and flatness give comparable problems.
For example, A moving vehicle that measures the rail bending, a laser Doppler sensor is attached to the TU Delft High-Speed Deflectometer (HSD), which moves at 130 kmph. Also, in HSD, laser position can be observed with an input to a servo system using a 3-axle gyro and accelerometer, as a result, laser beams are perpendicular to the rail. At a standstill and speeds of up to 16 kmph, a track loading vehicle (TLV) has been designed to test the lateral and vertical stiffness. For rolling vertical stiffness evaluation, two rail cabs are used, while the TLV used for static evaluation is coupled with an empty cab (Figures 10 and 11).76,77

Transportation Technology Center, Inc. (TTCI) track stiffness evaluation vehicle. 78
Example of results from TTCI stiffness evaluations. 78
The calculation theory of the Swiss Federal Railways’ (SBB 2007) stiffness evaluation vehicle is identical to the one described above.18,79–85 To test dynamic track stiffness, the Swedish “Banverket” car employs a new technology known as the “Rolling Stiffness Evaluation Vehicle” (RSMV). RSMV can dynamically excite the track with two vibrating masses above a single wheelset. The magnitude of dynamic stiffness is directly related to load applied and deflection of the track. The phase is a comparison of deflection-delay to force. The stage is related to the damping properties and the ground vibration to some extent. The RSMV's repeatability is adequate, and tests at faster speeds (up to 50 kmph) as well as extensive examinations (below 10 kmph) can be performed.
The majority of these approaches evaluate the static stiffness of the track; however, dynamic stiffness up to 50 Hz is measured by RSMV. Two oscillating masses above the normal wheel axle of a RSMV freight wagon dynamically excite the track. The rigidity of the track is calculated on the strength and acceleration measured. With a static axle load of more than 180 Kilo-Newton and a maximum dynamic axle load amplitude of 60 Kilo-Newton, the RSMV can calculate dynamic stiffness up to a maximum frequency of 50 Hz. High-speed evaluations up to 60 kmph of up to three concurrent sinusoidal excitation frequencies are possible, as are more comprehensive investigations at lower speeds below 10 kmph with noise excitation.
During the last few years, Banverket has been used to perform research on rolling dynamic track stiffness evaluations, thereby resulting in a new evaluation car called the RSMV, as shown in Figure 12.
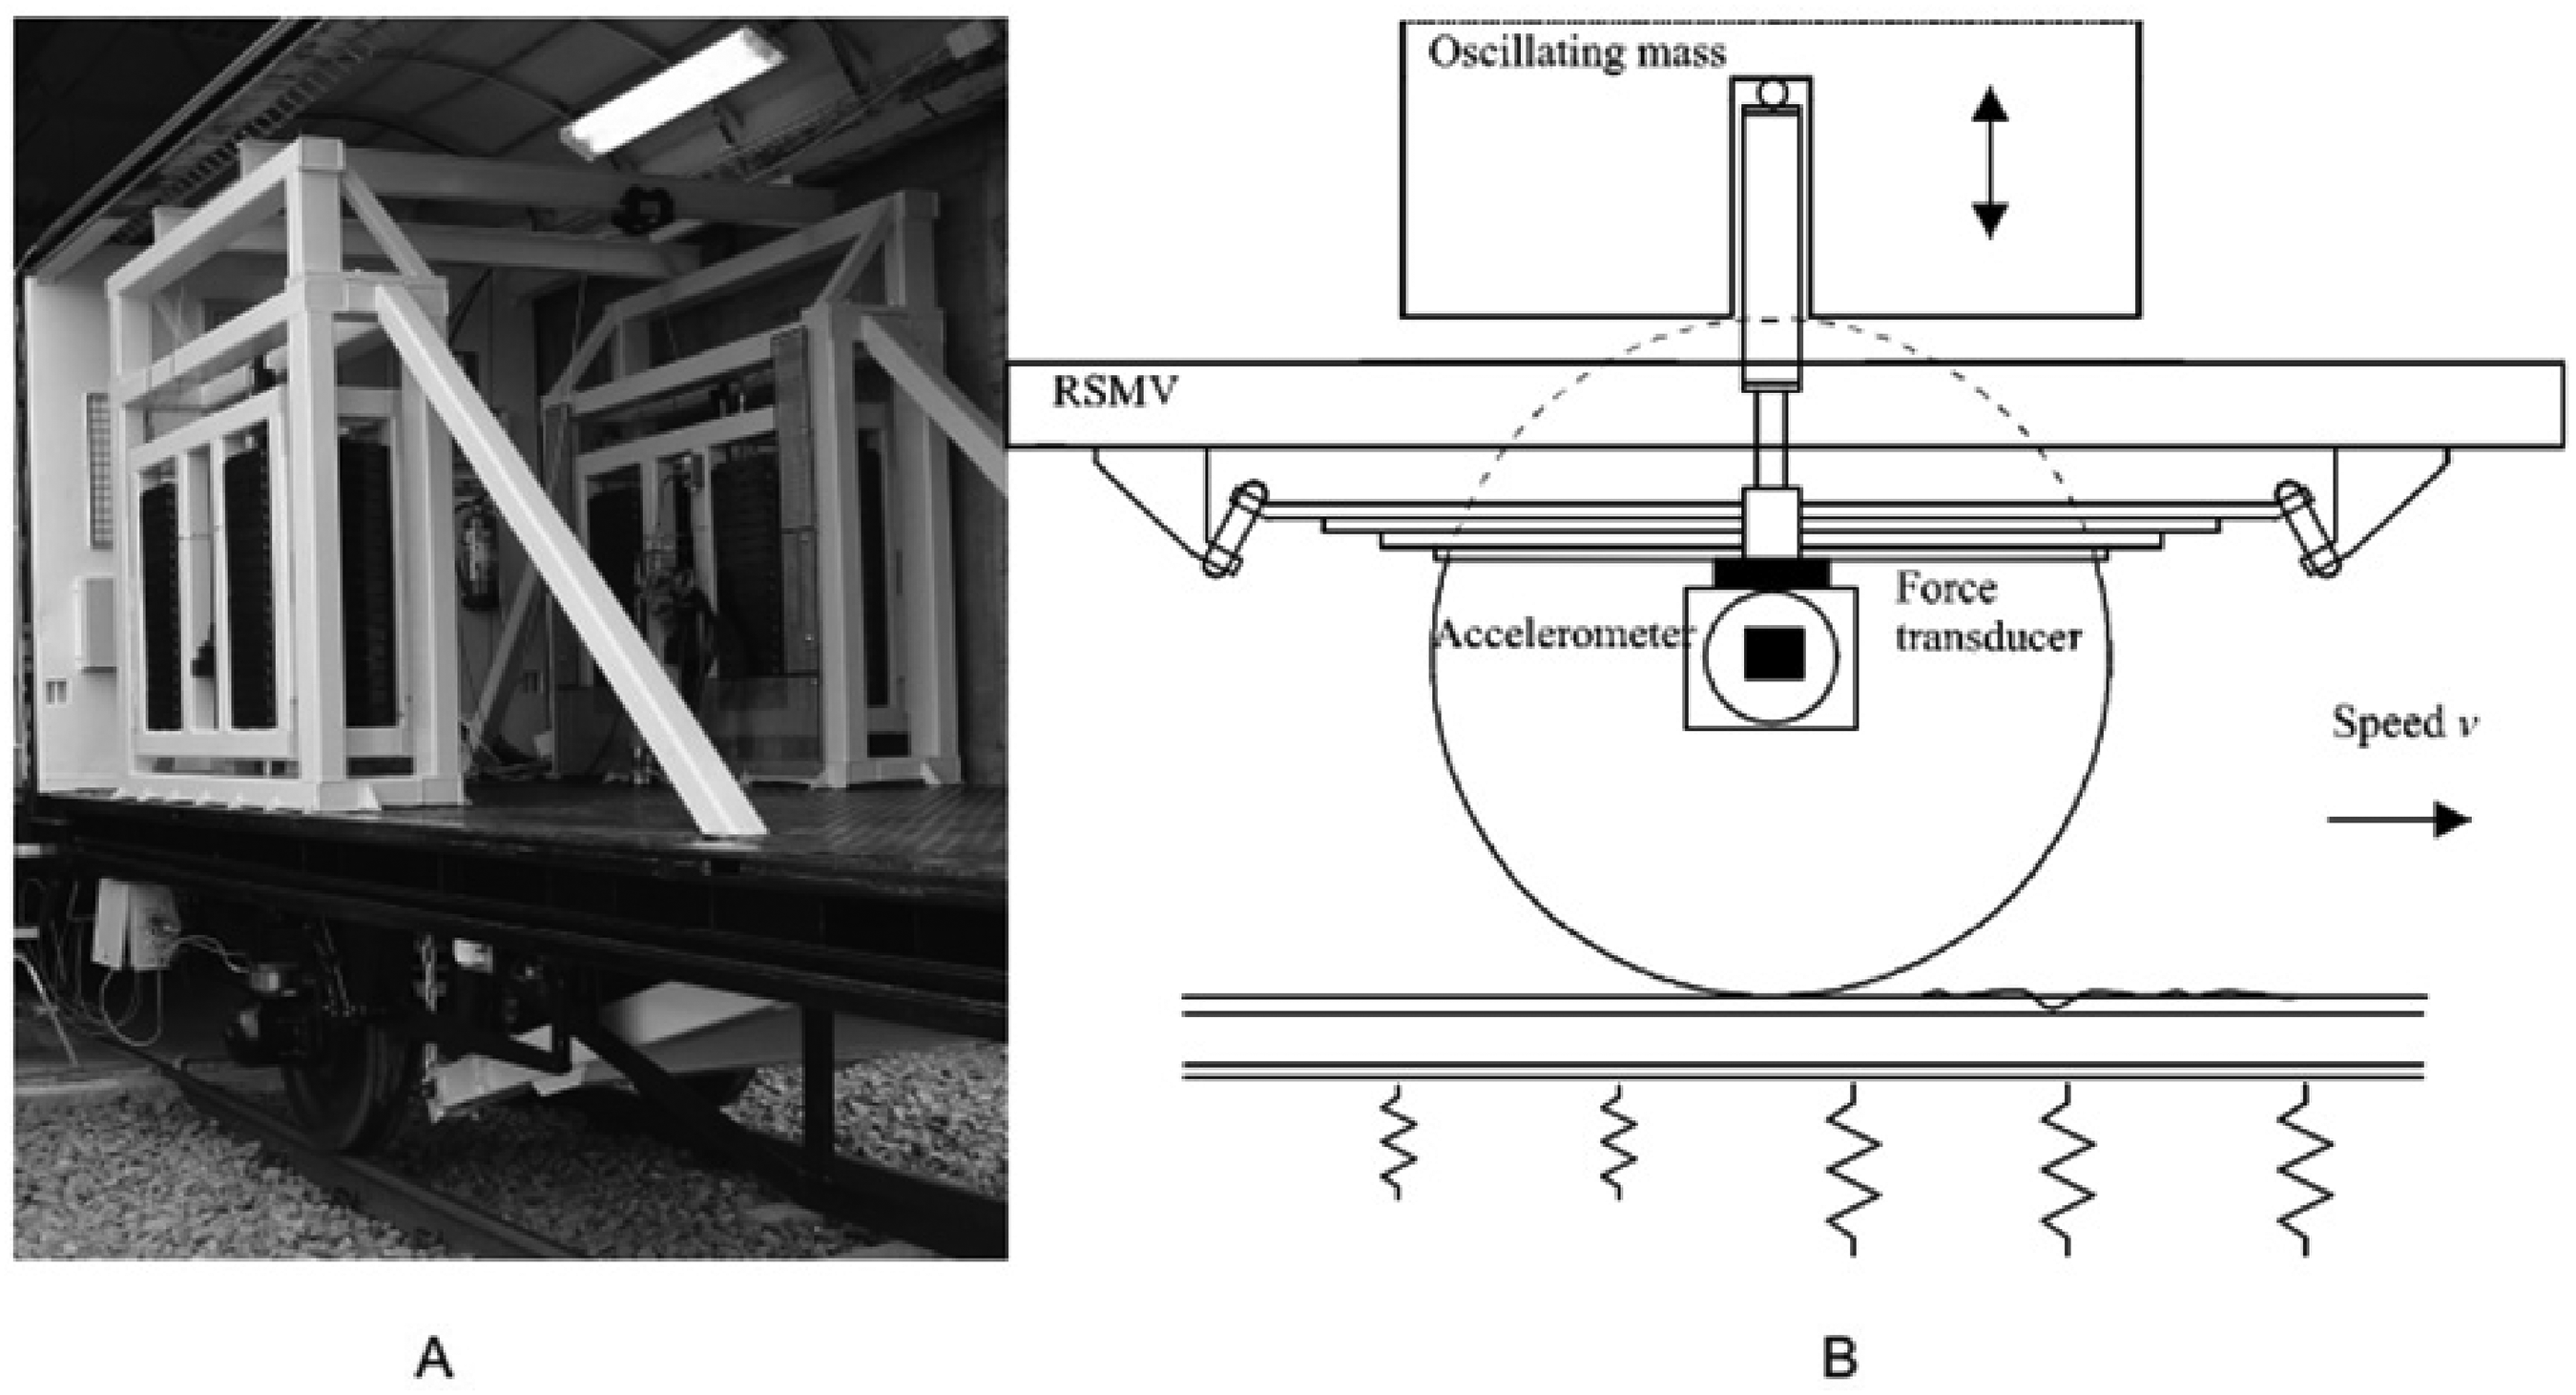
A. RSMV evaluation equipment; B. Schematic picture of evaluation principle (one side only) of RSMV. 10
Research conducted by the Federal Railroad Administration (FRA) in association with the University of Nebraska-Lincoln has developed a string-based deflection evaluation system for measuring track stiffness, as shown in Figure 13. A line laser is used to test the relative deflection of rail between bogie and rail in this technology. Using a camera and laser to determine the deflection between the two lines, and as the sensor travels closer to the surface of the track, the laser lines change positions. The relationship between estimated deflection and track modulus/stiffness is determined by the Winkler model. 86

UNL/FRA track safety research vehicle. 78
The recommended system forms from the relative displacement evaluations within the track and the contact point of the wheel/rail. Comparable displacement measure used the laser-based vision scheme. Then, to assess the modulus of the track, a mathematical model is used. The track modulus is determined by calculating the deflection of the rail applicable to the railcar. The modulus is then calculated using an empirical expression known as the Winkler model, which relates the rail's deflected form to the loads applied. In the reference, 78 the authors marketed the technology with specific details, as shown in Figure 14. Writers enhanced their technology in the reference (Table 4).87,88

Vertical track deflection evaluation system. 78
The analogy of different track stiffness evaluation strategies. 10

CETE- Normandie Center for road structures. They Designed the French Portancemeter, which is a rigidity monitoring tool. CETE currently using it for the railways. 89 A vibrating wheel suspended by a spring and a damper applies a dynamic load to the device's track. A theoretical amplitude of 35 Hz was used in road testing with a static weight of 10 kN. These features can alter the augmented loads, static as well as dynamic to alter the pace of rail testing.
Swiss Railways - Switzerland Schweizerische Bundesbahnen (SBB), has developed a similar approach to Chinese and TTCI devices and employs two geometry evaluation techniques. One of the first institutions to create a track stiffness vehicle for continuous track stiffness assessments was the China Academy of Railway Sciences (CARS). 90 Their method, which can reach speeds of up to 60 kilometers per hour, employs two-track geometry chord assessment systems with separate loading added to each of the evaluation axles. A lightweight car is employed to lower track geometry anomalies on a heavy-weighted car's stiffness evaluation. The load of the heavy-weighted car can be ranged between 80 and 250 kN, allowing nonlinear properties of the same segment of the track to be studied by repeated evaluations of different loads. CARS proposed the concept of a track elasticity evaluation vehicle shown in Figure 15.

CARS-stiffness equipment's track elasticity evaluation principle. (a) On-track evaluation with no wheel load. (b) On-track evaluation of a heavy car-a wheel load. (c) On-track evaluation of a light car-b wheel load. 10
The vehicle evaluates the geometric anomaly of the track in a manner analogous to the chord evaluation process. The vehicle's primary function is to evaluate the track elastic deformation yK. Static (deflection of the ordinary wheelset) Dynamic (vibration due to oscillating mass)
More recent work is found here.91,92 The difference in stiffness across a track stimulates a dynamic response in a train that the variation in stiffness will theoretically use. A new approach for detecting track stiffness heterogeneity is proposed, which involves studying in-service vehicle accelerations caused by dynamic contact with the vehicle track. The technique is described as the algorithm for measuring the stiffness of the track (TSMA), shown in Figure 16. To simulate vehicle track interaction, a two-dimensional half-bogie model was employed. As a simulated evaluation, the resulting vehicle response is used, and a two-dimensional vehicle model uses this simulation to quantify the stiffness profile. The calculated track stiffness data can be used to evaluate the algorithm's capability as an input.

TSMA flowchart. 92
Track scan methods such as GPR and correlation with stiffness
Continuous vertical track modulus/stiffness testing, which identifies the track substructure's capacity to support the track as an aggregate system, has been explored; however, its efficiency is limited. It cannot differentiate the condition of individual components. The GPR technique has been commonly used as a very effective tool for extracting physical and geometric details on railway ballast93–99 It is dependent on the propagation and receiving of electromagnetic (EM) waves for each frequency spectrum into the ground. This approach's main benefit is that drive-by high-speed sampling and minimal or no disruptive sampling are needed to calibrate the system. Variations in the position and amplitude of the signal peaks are caused by material inhomogeneity with different EM characteristics and interfaces between various structural layers. As a result, information about layer thicknesses and material characteristics can be deduced.
Since the GPR system can be placed on a train, it can perform an uninterrupted survey. The track and ballast properties can be tracked and defined using GPS instruments and signal processing methods, and preventive maintenance actions are taken on-site. Interpreting GPR signals and automatically determining ballast state is a challenging problem. Since the GPR frequency spectrum illustrates the material properties along the EM wave direction, it has been used to automatically classify ballast fouling situations. Pre-processing, feature extraction, and classification are the three primary phases of a GPR system's inference, identification, and classification, as shown in Figure 17.

Block diagram of GPR system for inference, identification, and classification.
In existing research, feature extraction employs a Fourier transform to obtain the magnitude spectra, identifies specific salient frequencies utilizing training data and user-specified variables, and yields the feature vector formation based on frequencies. Many attempts have been made to use various GPR probes and spectrum settings within a laboratory experimental setup to classify crucial factors, probes, and core frequencies that are best suited for the investigation of the ballast layer.
Regulated laboratory research was used in this analysis to establish the dielectric constants/relative permittivity of two ballasts, granite, and limestones based on GPR data collected on ballast under different fouling conditions moisture. Also, laboratory-predicted ballast dielectric constants improved the ballast condition evaluation accuracy by using laboratory-predicted ballast dielectric constants. For each scenario's GPR data processing, the impact of varying physical conditions of the ballast on the material's EM response was measured using time-domain and frequency-domain signal processing methodologies.
The GPR is a common geophysical method that enables information to propagate EM fields to inspect relevant subsurface features. The propagation process is dominated by the characteristics of the specific device and the tested material's properties. The evaluation of the trackbed geometry and its overall stability has been investigated. In contrast, the focus has increasingly turned towards studying the trackbed fouling and degradation in the time and frequency-domain signals. Mathematical modeling and simulations used in various new avenues have recently been explored to assess the quality of ballast aggregates. It is suggested that data on the layering characteristics of the track substructure could be used to implicitly predict the modulus of the track. Over various track conditions, a complete collection of GPR coincidences and track modulus evaluations is obtained.
In the reference, 33 the authors correlated GPR data with geotechnical data. They studied a strong link between GPR in combination with the downhole/borehole seismic test (DHT) and geotechnical data such as standard penetrating test (SPT) results and boring reports to analyze geophysical data as an important help in understanding geotechnical factors. GPR data provides continuous layering information to geotechnical engineers. The DHT, on the other hand, provides geotechnical factors including, Young Modulus E, Bulk Moduli, Shear Modulus, and Poisson's Ratio σ. A comprehensive estimation of the geotechnical parameters combines the above data with SPT results and boring reports.
In the reference, 89 the authors correlated GPR data with evaluations of geometry. Cross-correlations with comparisons between various calculated parameters uncovered new facts; resonant frequency of the vehicle was excited by a comparable orientation waveform and 10 to 30 m wavelength cross-level, resulting in unsustainability. Another example, the correlation between the stiffness of the track and the longitudinal level suggests that the issue could be linked to stiffness. A statistical method for determining these correlations is normalized cross-correlation (Figures 18 and 19).

Example of processed 400 MHz GPR antenna data from measured railway section. 100
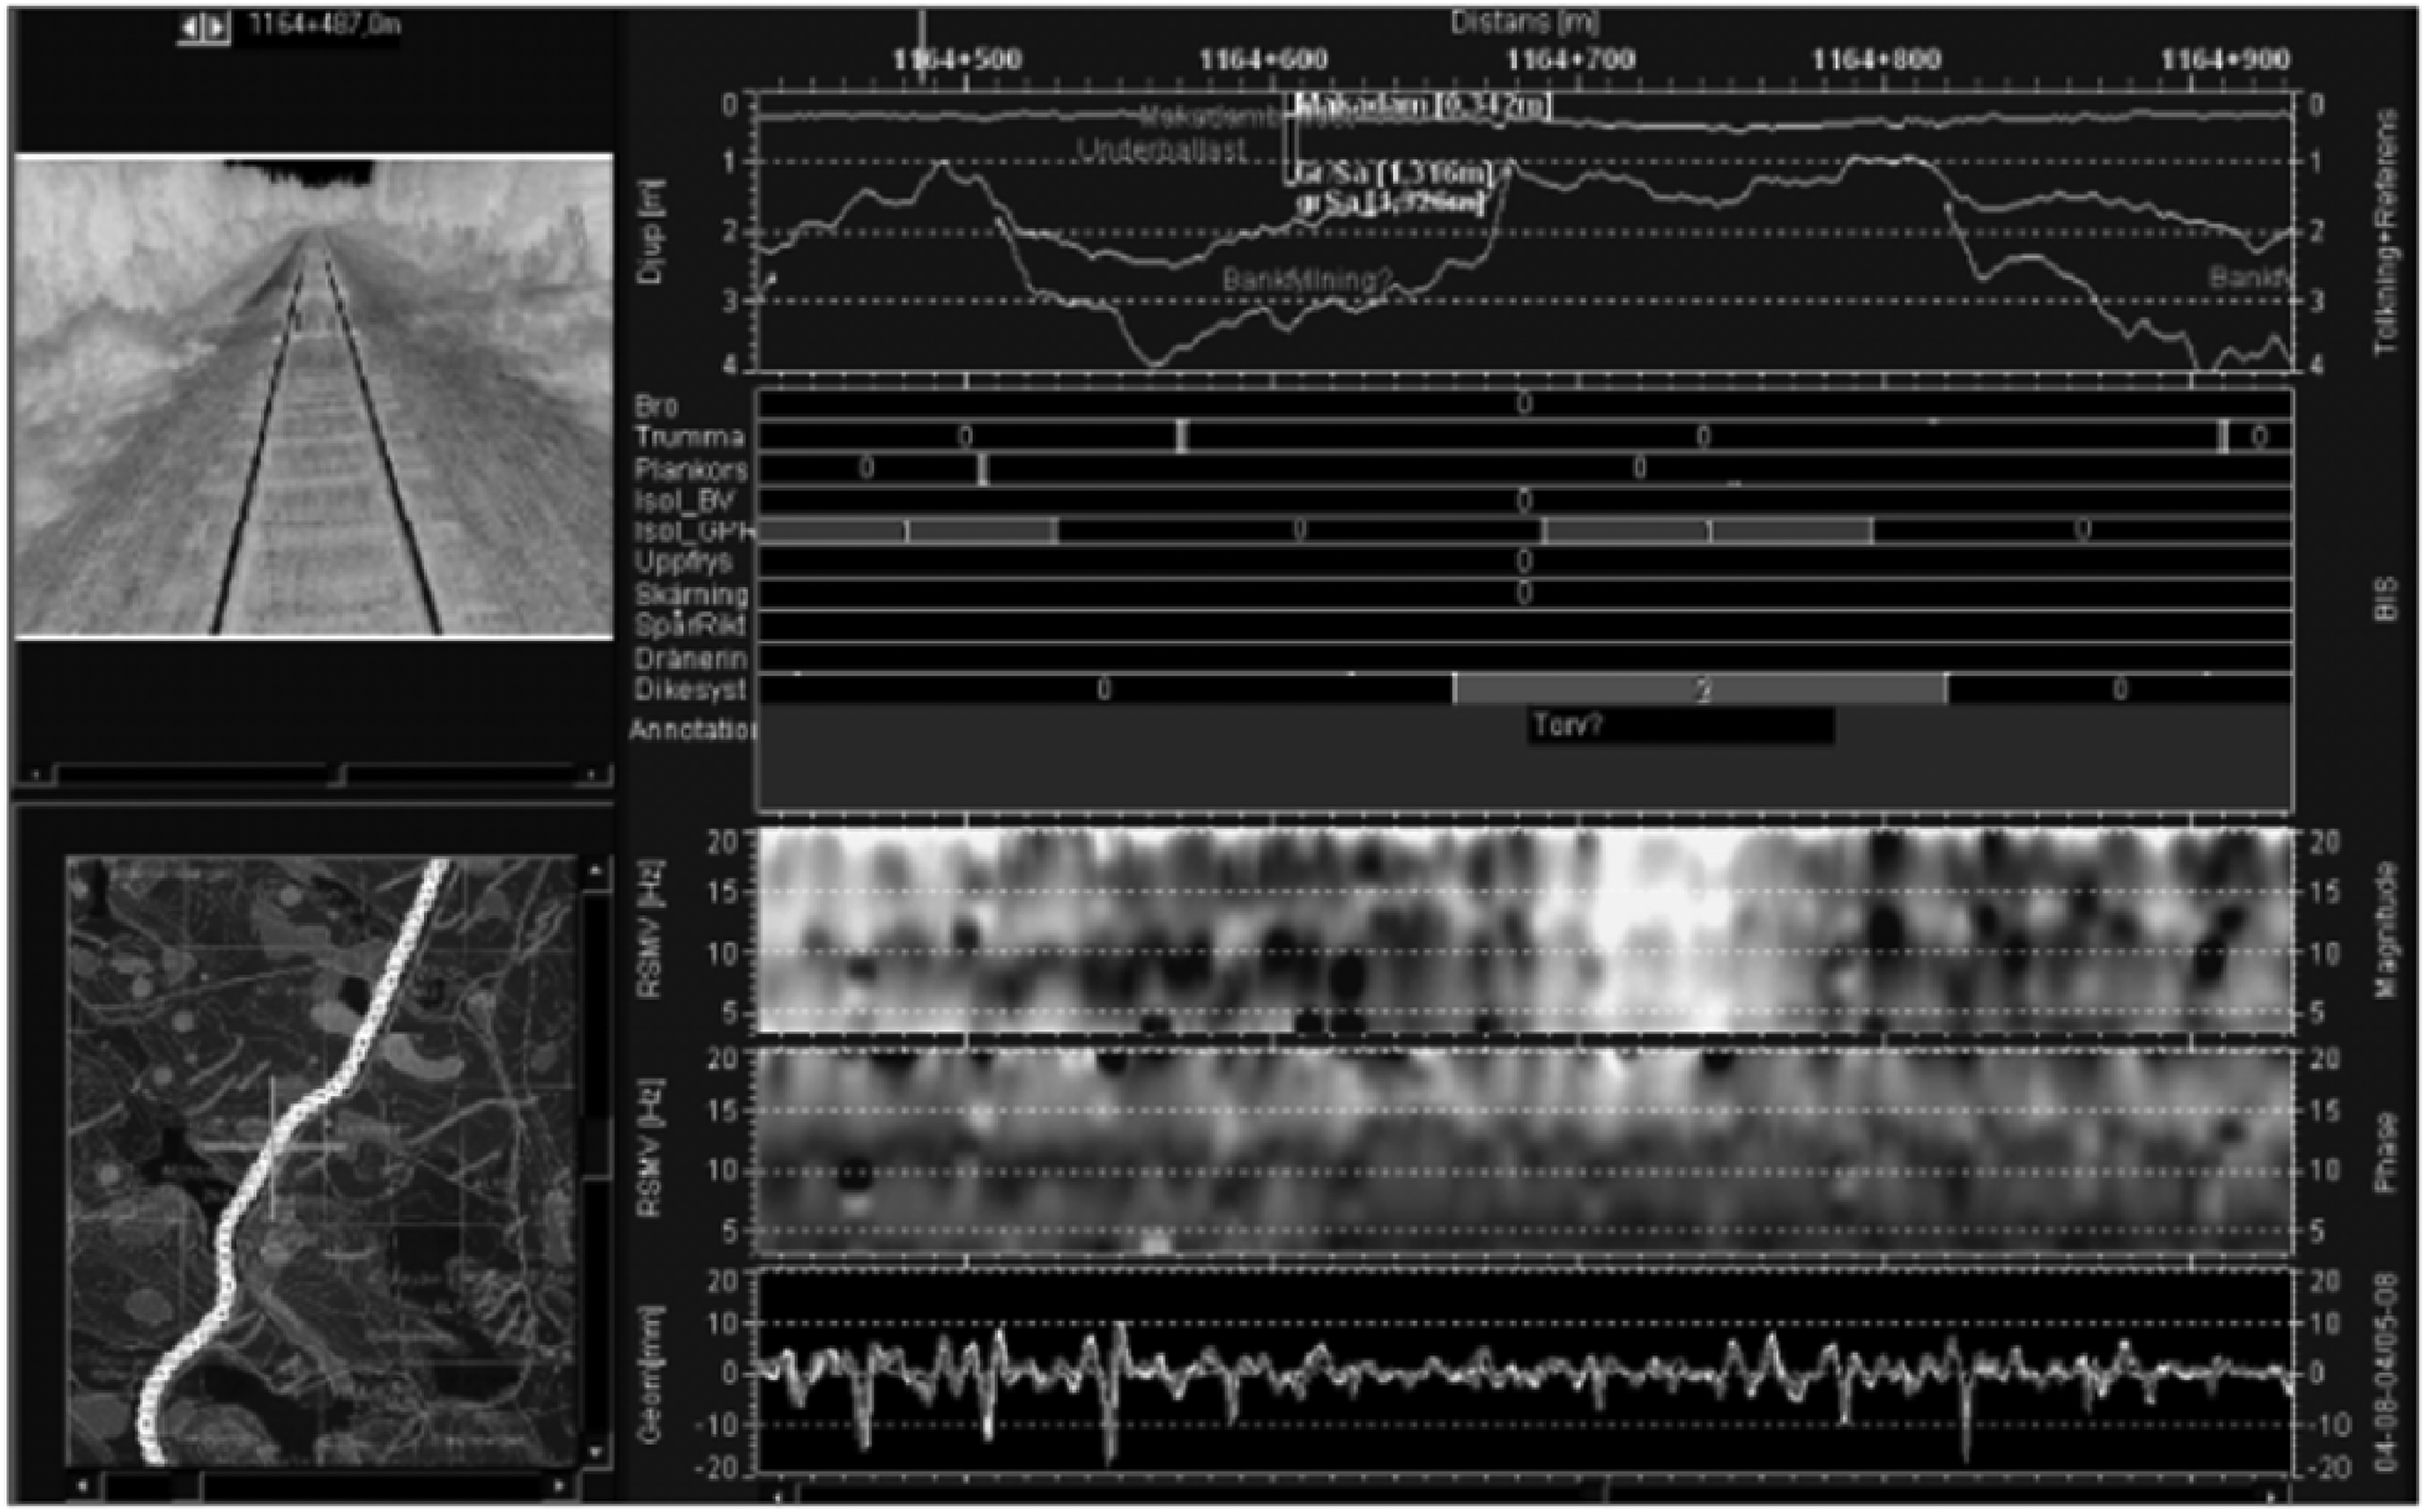
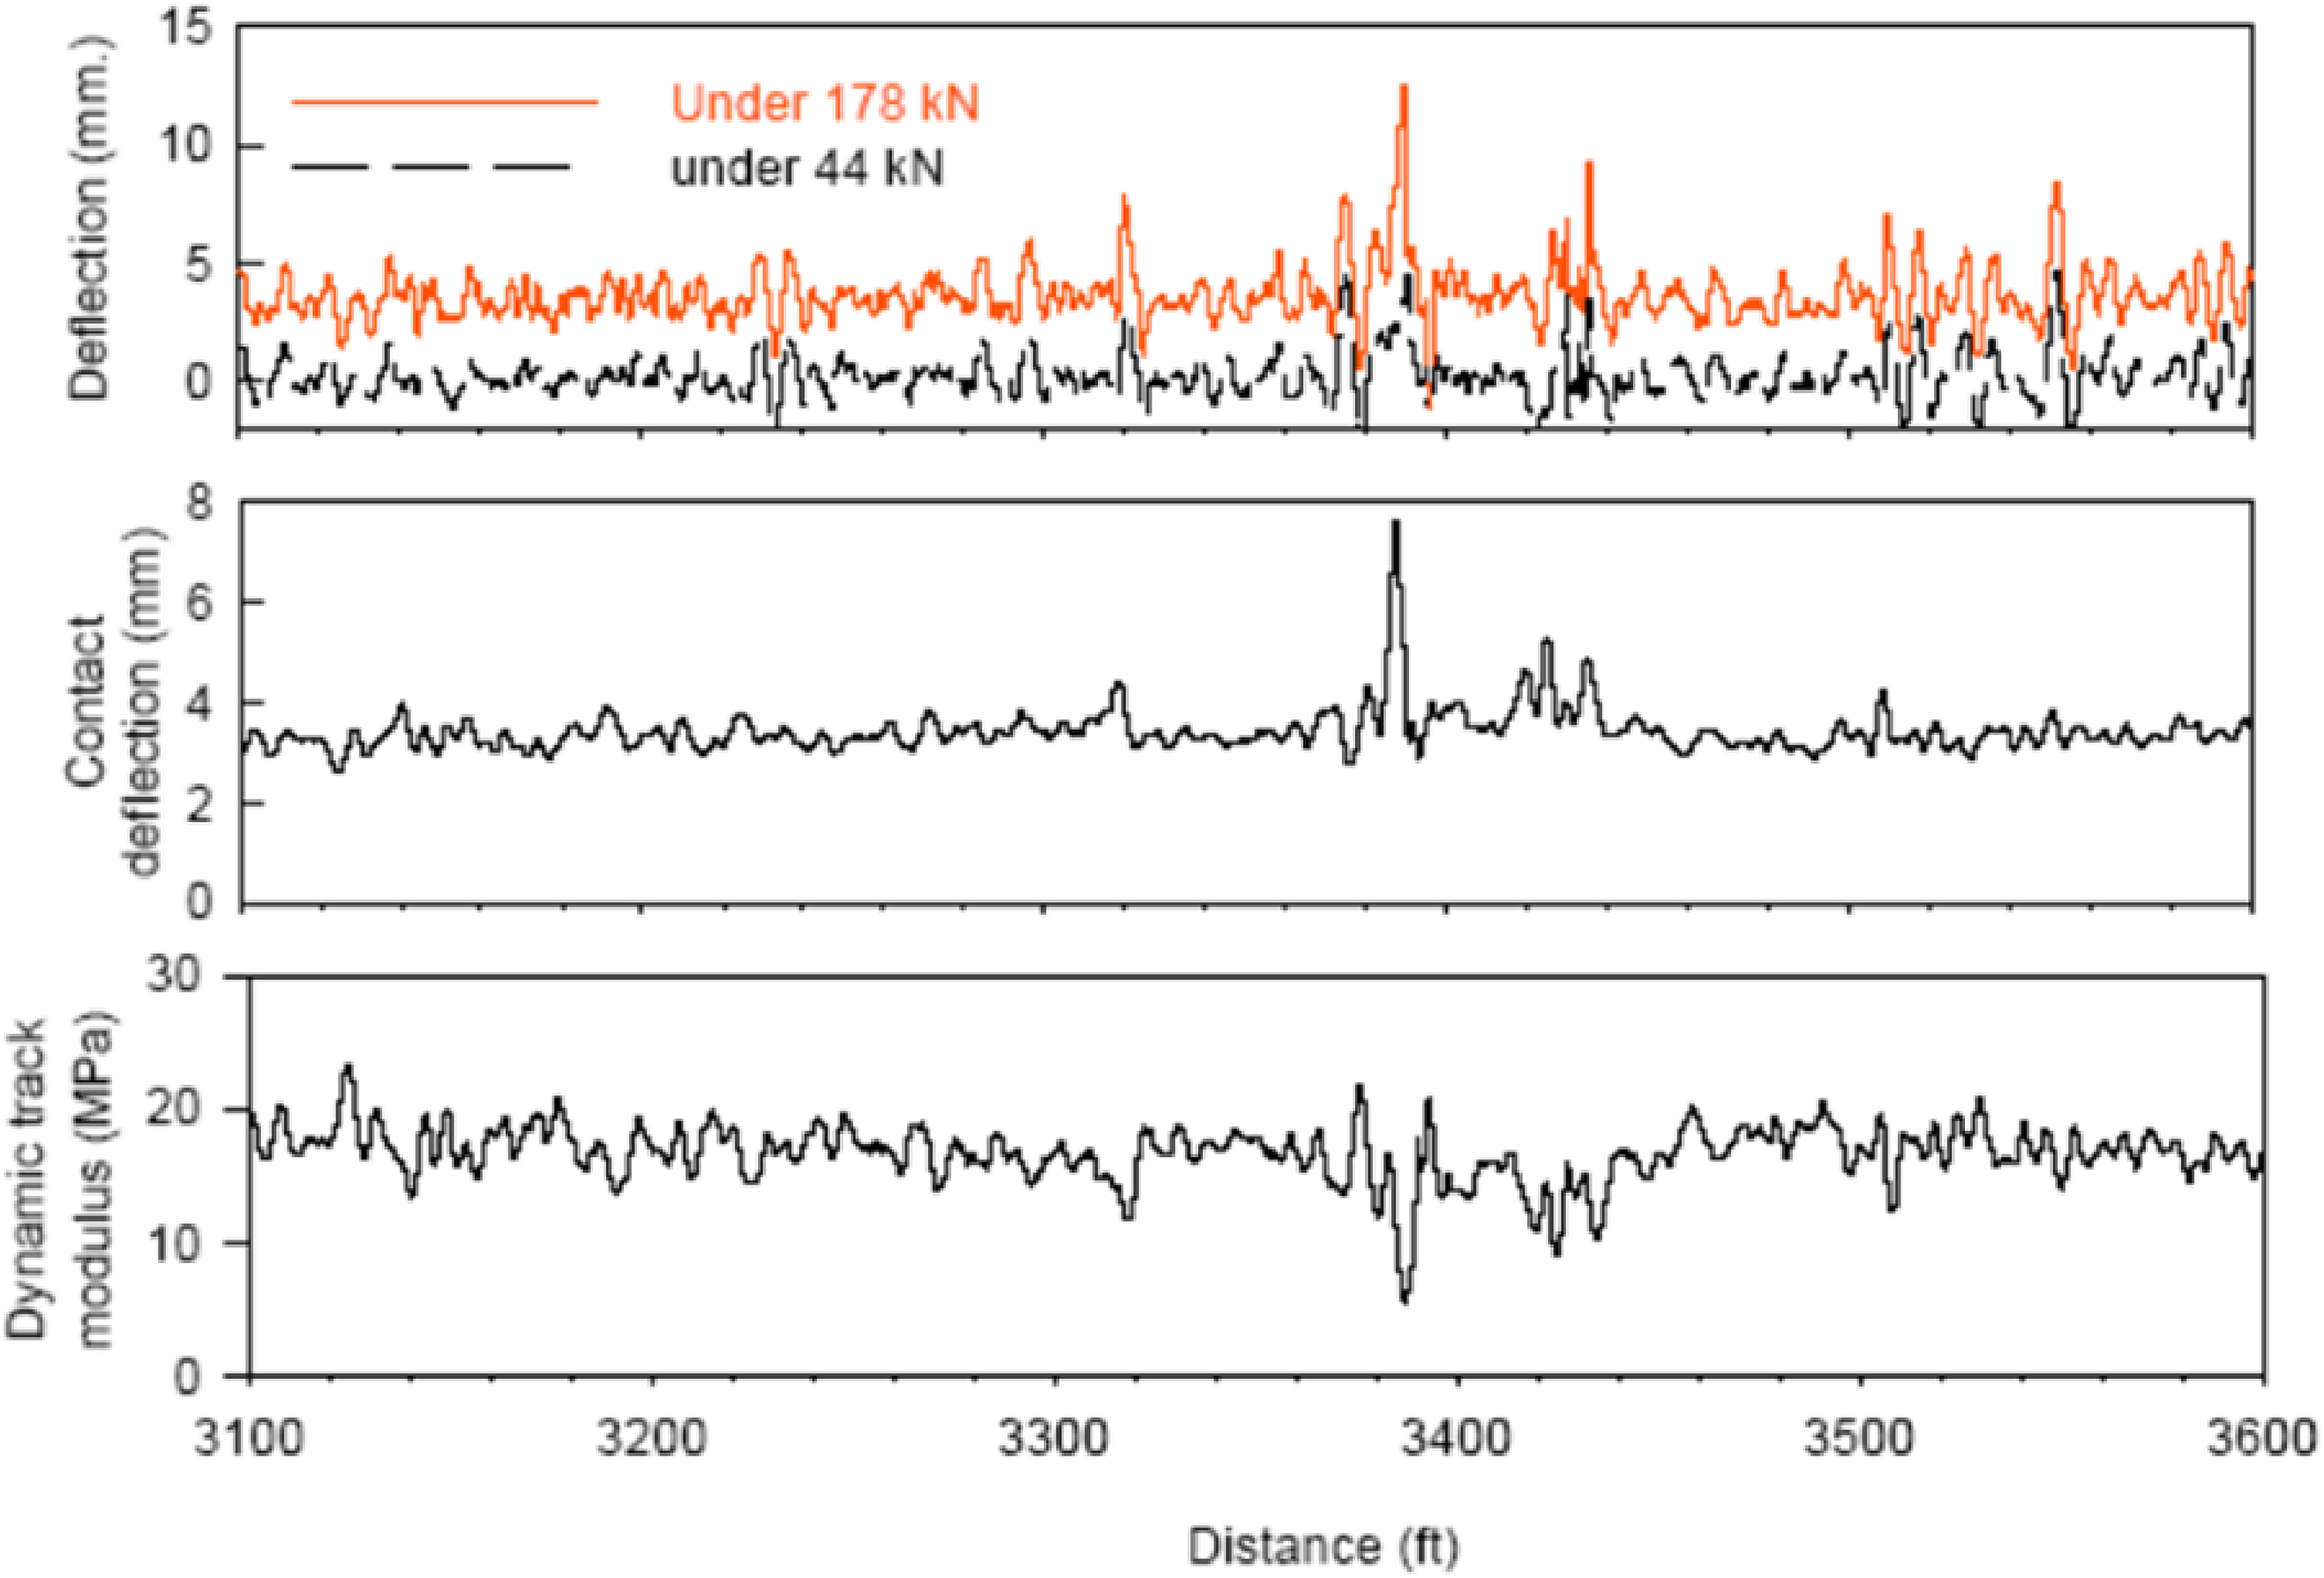
View of the RDMS software. Upper left-Digital video of the track; Lower left-Soil type map; Upper right-Interpreted result from GPR (layer thickness); Middle right, upper part-Database of man-made structures (in this case two areas of frost insulation boards and one with ditch are indicated); Middle right, lower part-Magnitude and phase of dynamic track stiffness; Lower right-Two evaluations of longitudinal level (track geometry quality). 100
In the reference, 100 The authors experimented with stiffness evaluations from track engineering along the track. The experimented track needs the values of stiffness and differences along the track; however, it is tough to solve the questions related to maintenance and design. The track's stiffness is investigated by the track geometry's quality (at the longitudinal level) and GPR evaluations. The multiple assessments complement one another, and cumulative review results in a more consistent condition assessment. Also, models are developed based on the statistical relationship between evaluations of GPR-data and stiffness. The most comfortable quantity to estimate is the embankment thickness, but the other quantities’ indicative results are also presented (shear wave velocity and soil layer thickness.
This article discusses the latest knowledge using pattern recognition techniques; This procedure displays a broad collection of data conditions derived from consistency of track geometry, dynamic stiffness, and GPR. This study provides evidence of the significance of dynamic evaluations of stiffness in determining track problems related to soil and embankment. Issues stemming from the upper portion or track layout, on the other hand, have no significance. GPR demonstrates the technique of a blend of data conditions from track geometry accuracy and dynamic stiffness. It shows that by creating a root-cause classifier, specific track problems are solved. In particular, GPR data, as well as RSMV data, can be used to solve soil-related issues and other issues of rail embankment (Figures 20 and 21).

8–25 m longitudinal level. 33

Stiffness evaluations: solid – measured at 6.8 Hz frequency and dotted – measured at 11.4 Hz frequency; GPR evaluations: solid - depth of ballast layer and dotted - depth of the sub-ballast layer. 33
In the reference,1–3 A non-destructive/non-invasive GPR technique evaluates both integrity of the substructure as well as the modulus of the track. For estimating the modulus of the track using GPR techniques, many authors compare the multivariate linear regression and neural network algorithms. The track substructure composition such as characteristics of layering, inhomogeneities, material migration, etc., and the image generated by GPR have a relationship. However, the track substructure composition affects the strength and so the modulus of the track. Thus, the GPR image can develop the features which are related to the track module based on coincident evaluations of the GPR and modulus.
A model based on multivariate linear regression and neural networks estimates the modulus of the track with a maximum limit of 3.4 Megapascal (500 psi) using GPR reflectivity values at specific depths. 101 When both the techniques are compared, the neural network technique shows better performance of the actual track module than the multivariate linear regression analysis model. Both, however, are beneficial for GPR assessment of the track module and reducing the time and expense of the track's operational strategies.
It contemplates that tracks’ substructure characteristics can indirectly indicate the track modulus. A coincidence between GPR and track modulus evaluation is at various track conditions of the railroad. A multivariate linear regression analysis model improved the precision of the weighted average of subsurface 400-MHz GPR reflectivity's at particular depths of the calculated track module by around 3.4 MPa (500 psi).
They are considering the strength characteristics, which are highly dependent on particle interactions. Also, assuming a relationship between electrical properties (e.g. electrical permittivity) and bulk density of materials, the GPR-based assessment of materials’ strength properties from electrical characteristics suggests that a good correlation is expected between mechanical and electrical parts. In the reference, 102 as explained below, the authors present some details of the correlations. The authors seek to enhance the interrelated analysis of the track superstructure and substructure in the reference.3,103,104 These studies aim to recognize and develop relationships between track geometry inspection parameters measured by a track recording vehicle (TRV) and track substructure as measured by a GPR. These relationships have been extensively debated in the literature, but they have not been established or verified. The positive results would enable infrastructure managers (IM) to derive information and learn from their vast multivariable inspection databases, allowing them to engage in maintenance activities.
Particularly in potential tracks where the conditions to develop, grow, and propagate, preventive maintenance is essential. These conditions form due to the locations of track geometry defects are caused by subsurface. After the preventive maintenance, analyze the results, which show the analysis that has the potential relationship between geometry deviation and poor condition. This condition of the subsurface has been statistically validated. GPR inspection parameters in Table 5, for instance, ballast layer thickness and Ballast Fouling Index (BFI), were used to define the subsurface conditions (BLT). Furthermore, the study findings include multiple statistical models of the probability of a profile variance as a function of the above GPR parameters.
Inspections classification and their parameters. 10

This paper presents the findings of a FRA-sponsored report on the relationship between track geometry defects and track subsurface conditions as calculated by GPR. To include ballast fouling, moisture content, and ballast layer thickness, multiple track geometry runs and the related track geometry degradation behavior were used in the study, which was combined with GPR data. Correlation and statistical analysis were conducted to investigate the relationship between the likelihood of major geometry deterioration and calculated GPR parameters (e.g. BFI, BLT). The findings revealed a statistically significant relationship between elevated geometry deterioration rates and poor subsurface conditions, as established by the GPR parameters. A predictive model was also designed to calculate the likelihood of a high rate of geometry loss as a function of main GPR parameters.
In the reference, 105 using GPR, the authors carried out laboratory experiments to classify and describe the dielectric characteristics of track ballast Experiments with lower-frequency devices yielded greater performance. Wet and dry ballasts, as well as clean and spent ballasts, were distinguished. The GPR technique helps to identify defects in railway track beds. Figure 22 and Table 6 show a comparison of the two moisture profiles.
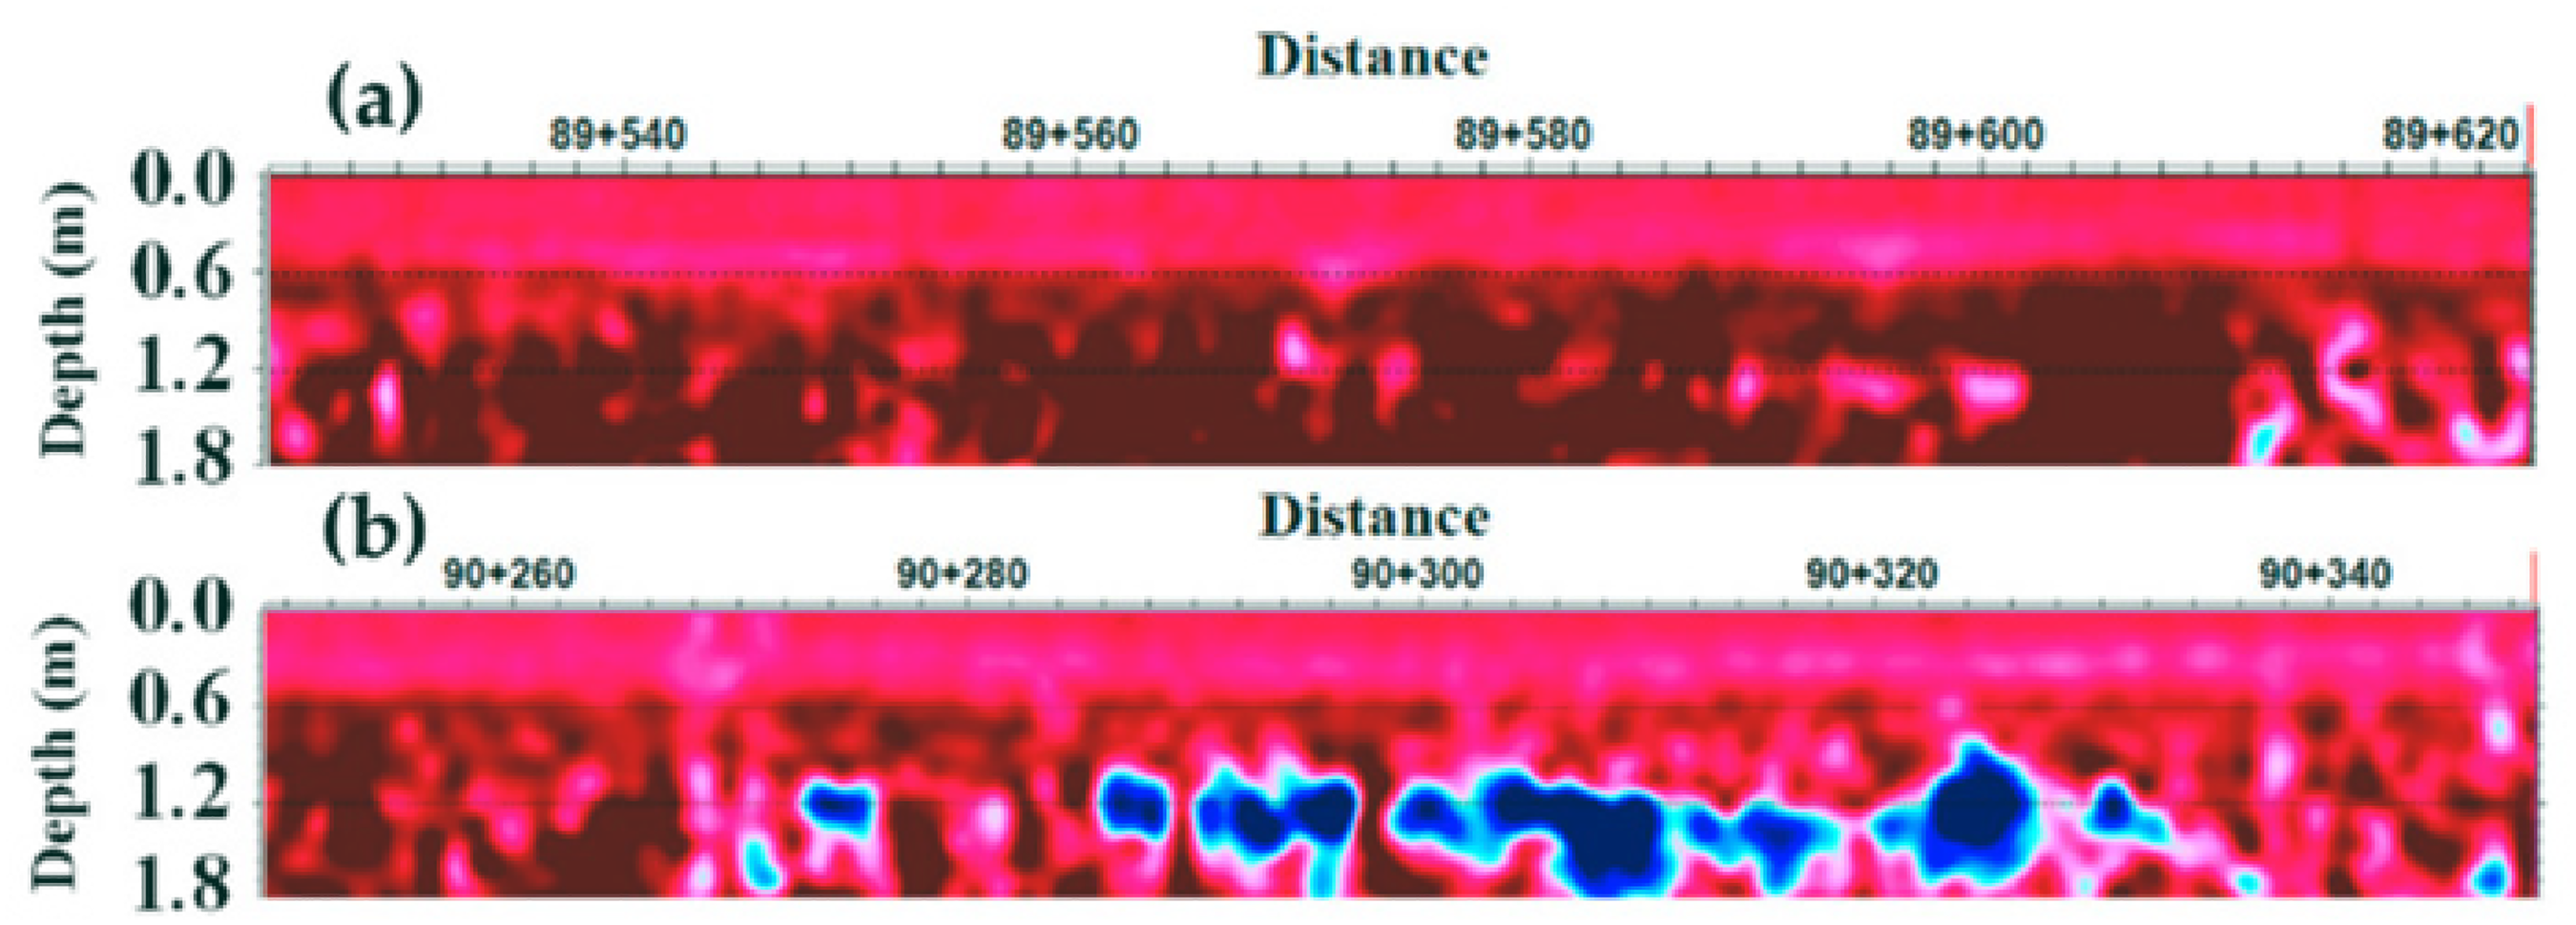
Profiles of moisture content: (a) low (b) high. 33
The dielectric constant and signal velocity in different materials. 105

More relevant research can be found in the reference.106,107 Other techniques have also been applied to evaluate track and ballast108–111 Laser/light Imaging Detection and Ranging LIDAR is a new tool used in the railroad industry to quantify and chart ballast profiles. Through illuminating the target with laser light and observing the backscattered light, LIDAR uses optical remote sensing techniques to determine the distance or other properties of the objects LIDAR innovation has been explicitly applied in the railways to calculate and chart the track terrain, especially the ballast profile, as seen in Figure 23. 3

Picture of a LIDAR ballast profile with insufficient ballast zones highlighted in red. 3
These techniques are correlated with the characteristics of the ballast system. The ballast material should be resistant or free from the individual effect or combined effect of all properties such as chemical (failure comes due to the reactions of, for example, coal dust fines), mechanical (failure comes from moving train and dynamically loaded areas such as train's bolted joints), and environmental (repetitive cycle of weather changes such as intensive wetting, drying, freezing, and thawing). The mechanical property evaluation has been performed for a long time; it is aggregate internal friction that helps transmit the upcoming load to the underlying layer and then to the subgrade; the particle needs to be sufficiently hard to resist crushing, degradation, and wear.
To measure the characteristics of ballast particles, the following test methods are used.
Impact test Deval abrasion test L.A. abrasion test Crushing value of Clay lumps and friable particles Mill abrasion test The load can be applied as required thru expected output; frequency and amplitude vary. The confining pressure of the testing machine can be controlled, and the methods used to apply loads on the confining pressure can be cyclic or constant. The testing machine is accurate enough for measuring the radial and axial strains. Therefore, the testing machine can predict the permanent deformation and resilient modulus.
According to the American Railway Engineering Association (AREA) manual, LAA is the current best method for determining the capacity for railway ballast materials to fail upon loading. However, this test can only estimate the degree of abrasion; the bearing capacity or strength of ballast is quantified using a triaxial test The individual particle strength in the structure influences the overall performance. The cumulative bearing capacity or strength of each ballast particle can be seen and estimated in the laboratory using a triaxial test There will be high stress on the ballast structure when a moving wheel load is applied on the rail. So, the moving wheel stress condition is simulated in the laboratory. The triaxial test method is best suited to predict the stress condition in an actual structure considering the ballast's typical loading condition. It can be either a monotonic or cyclic triaxial test method based on the confining pressure's controlling mechanism. The advantages of the test method are:
The cause of fouling in the ballast structure is attributed to the presence of finer ballast materials. The sources of fine materials can be categorized as external or internal. The external (surface spillage) fines are from freight transportation, coal fouling, upward migration of fine particles from the sub-grade, and fines produced from tie wear (wood or concrete). The internal (mineral fouling from crushed aggregate) fines are generated because of traffic repetition and heavily loaded traffic frequency. Even though there are conditions where one of the above conditions dominates for the formation of fines, ballast fouling is the most frequent cause of ballast fouling from ballast particle breakdown. Many other methods have been developed to evaluate track systems, such as machine vision, seismic surface waves, electrical resistance tomography, and infrared radiometer.
112
Conclusions
This article includes an in-depth examination of mechanical engineering perspectives on rail systems’ structural adequacy/bearing capacity. The track problem root-causes such as rail issues, issues related to ballast and issues related to soil and embankment can be effectively identified by GPR technology. Although the existing technology for frame stiffness/modulus evaluation is accurate, it is time-consuming and laborious, requires track closure, and only a single point of information is provided. Non-destructive and Non-invasive techniques (such as GPR) have shown great potential in imaging underground features and assessing orbital substructures’ integrity, such as being used to automatically classify ballast fouling situations. GPR implementation offers new possibilities for indirect monitoring of track stiffness of which the most dominant components are the ballast layer and subgrade. The relationship between the track stiffness and GPR description parameter demonstrates a strong relationship with the ballast layer GPR calculations and subgrade state, indicating that GPR has a bright future in the evaluations of track stiffness and rail systems’ structural adequacy.
Footnotes
Acknowledgment:
The authors would also like to thank Dr Gang Chen at Marshall University for his help in this research.
Authors' contributions
Conceptualization, X.H. and W.Z.; methodology, X.H. and W.Z.; validation, X.H. and W.Z.; investigation, X.H. and W.Z.; resources, X.H. and W.Z.; writing—original draft preparation, X.H.; writing—review and editing, G.A. and Z.L.; visualization, X.H. and W.Z.; supervision, X.H. and W.Z.; project administration, X.H. and W.Z.; funding acquisition, X.H. and W.Z. All authors have read and agreed to the published version of the manuscript.
Declaration of conflicting interests
The author(s) declared no potential conflicts of interest with respect to the research, authorship, and/or publication of this article.
Funding
The author(s) received no financial support for the research, authorship, and/or publication of this article.