
Abstract
With environmental changes and rapid urbanization, Chinese cities face serious challenges such as disrupted water cycles, frequent flooding, and ecological imbalances. Therefore, China launched the Sponge City initiative in 2013, which evolved into a comprehensive, multiobjective urban management system by 2020. This study focuses on Nanning City, using multisource data from 1990 to 2020 and the Patch-generating Land Use Simulation model to examine land-use changes, driving forces, and future scenarios. Results show that: (1) Construction land increased 5.62 times, spreading from the Chaoyang Creek Basin to flat areas in the east and southeast; (2) Cultivated land and woodland contributed 89.13% and 7.65%, respectively, as main sources; (3) Digital Elevation Model, slope, and transportation were key drivers; and (4) Under ecological protection, woodland and grassland expanded, showing that policy can effectively limit urban growth. This study builds a historical–mechanism–scenario framework to support urban planning and ecological resilience in Nanning.
Introduction
With accelerating global urbanization, disruptions to hydrological processes and ecological imbalances have become increasingly prominent, particularly in rapidly developing regions such as China. 1 Urban expansion alters regional hydrological cycles 2 by increasing impervious surfaces,3,4 reducing infiltration, and intensifying runoff, thereby raising the risk of flooding and waterlogging. 5 Recent extreme rainfall events, such as Zhengzhou (2021) and Beijing (2023) further underscore these threats.6–8 Against this backdrop, the way land-use patterns shape stormwater resilience has received growing attention. China's Technical Guidelines for Sponge City Construction explicitly emphasize that land-use configuration plays a central role in determining urban hydrological responses, and optimizing the spatial layout of blue–green–grey sponge infrastructure has become a pressing research priority. 9
To mitigate stormwater challenges, China launched the Sponge City initiative in 2013. As one of the first pilot cities, Nanning—with an urbanization rate of 68.9%—is a typical subtropical metropolis frequently affected by intense rainfall and waterlogging. Rapid urbanization has driven the expansion of construction land (CL) at the expense of cultivated land and woodland, leading to ecological degradation and fragmentation,10,11 thereby exacerbated stormwater and urban heat island effects,12,13 and contributed to stronger rainfall intensity and frequency in urban centers than in suburban areas.14,15 Recent studies further report that extensive impervious expansion and landscape fragmentation can weaken the hydrological performance of sponge infrastructure and diminish ecological regulation capacity.16,17 These findings highlight the tight coupling between land-use change and stormwater resilience. However, the hydrological impacts of climate, sponge infrastructure, and land-use pattern vary across space and time, 18 underscoring the need to understand the characteristics and driving mechanisms of land-use change in Nanning to inform sustainable sponge-city planning.
Land-use/cover change (LUCC) serves as a critical link between human activities and natural systems, and research has focused on three aspects: analyzing existing spatial patterns, examining driving factors, and forecasting future scenarios with ecological implications. 19 A variety of models have been employed, including Cellular Automata (CA), System Dynamics, 20 Artificial Neural Networks, 21 and CLUE-S. 22 Emerging models such as FLUS, 23 Logistics-CA, 24 and Patch-generating Land Use Simulation (PLUS) 25 integrate multiple drivers to enhance predictive performance. Among them, the PLUS model represents land patches as basic evolution units, enabling fine-grained simulation of land-use transitions and being widely used for forecasting and ecosystem service assessments. 26 Given its patch-level precision and strong adaptability in rapidly urbanizing regions, PLUS has become a preferred tool for analyzing construction-land expansion and evaluating policy-linked landscape changes.
Understanding the drivers of land-use change is vital for predicting development trends, assessing ecological impacts, and guiding policy formulation. 27 Internationally, PLUS has been used to simulate land use under multiple scenarios, such as in Ndola (2022–2042) to assess food security risk. 28 In China, PLUS has been applied to evaluate water-yield dynamics in the Tianshan Mountains (2000–2030), showing that ecological conservation yields the highest water output. 29 These studies highlight the value of scenario-based simulation for urban planning and resource management. However, the applications of PLUS in subtropical basin-type cities such as Nanning—where rapid development, ecological constraints, and Sponge City policies interact—remain comparatively limited, leaving gaps in understanding long-term urban expansion mechanisms in these environmentally sensitive settings.
To address these gaps, this study examines LUCC dynamics in Nanning from 1990 to 2020 and investigates their underlying drivers within the unique context of a subtropical, basin-type Sponge City. Compared with previous PLUS applications, this study explicitly links long-term LUCC trajectories with subbasin-based urban expansion analysis and policy-oriented ecological protection (EP) scenarios in a subtropical basin-type Sponge City, thereby providing a hydrologically informed perspective on urban growth management. This study hypothesizes that construction-land expansion in Nanning is jointly controlled by topography, transport accessibility, and socioeconomic clustering, and that an EP scenario can partly decouple rapid urban growth from ecological degradation. Specifically, the study aims to: (1) characterize historical spatial–temporal patterns and dominant land transformation pathways; (2) quantify the contributions of natural, socioeconomic, and accessibility factors to construction-land expansion; and (3) simulate future land-use patterns for 2025–2040 under natural development (ND) and EP scenarios to support sustainable territorial planning in rapidly urbanizing subtropical regions.
Research areas and data sources
Study area
Nanning (108°07′–108°36′E, 22°38′–23°01′N) is located in the south-central part of Guangxi, with a total area of 1321 km2, encompassing the main urban districts (Figure 1(b)). The city presents a basin-like geomorphology, with alluvial plains surrounded by hills terrain, elevations ranging from 49 to 476 m, and slopes of 0°–53°. The Yongjiang River, a major tributary of the Pearl River Basin, flows east–west across the city and forms a dendritic drainage system that strongly influences surface hydrology and urban spatial structure.

Geographical location of the study area and subbasin delineation.
The study area has a subtropical humid monsoon climate, with a mean annual temperature of 21.8 °C, and average annual precipitation of 1321 mm, more than 80% of which falls between April to October. This combination of concentrated rainfall, basin topography, and rapid urbanization makes the city highly sensitive to land-use change and hydrological disturbances.
As the political and economic center of Guangxi, Nanning exhibits strong population and economic agglomeration dynamics. According to the Guangxi Statistical Yearbook, the city's resident population reached 8.74 million in 2020, and Gross Domestic Product (GDP) ranked first in the Guangxi Beibu Gulf Urban Agglomeration. Regional studies show that population and economic activities tend to concentrate along with the Nanning–Beihai development axis, reflecting pronounced spatial agglomeration that has intensified construction-land expansion and ecological pressure in the metropolitan area. 30
To capture spatial heterogeneity in hydrological and land-use processes, this study used Digital Elevation Model (DEM) data and the ArcGIS hydrological tool to delineate the basin into 17 primary subbasins (B1–B17) and 294 secondary subbasins (Figure 1(d)), which serve as analytical units for assessing land-use transitions and urban expansion pathways.
Data sources
This study utilized multiple datasets, including land-use information interpreted from Landsat imagery, DEM, soil data, basic geographic information, and socioeconomic statistics. All datasets were projected to WGS 1984 UTM Zone 49N and resampled to 30 m resolution in ArcGIS. Detailed data sources and preprocessing steps are provided in Table 1.
Data source and resolutions.

All land-use data were aggregated into six classes: cultivated land, woodland, grassland, water, CL, and unused land, roughly representing farmland, forest, herbaceous vegetation, surface water, built-up areas, and bare or sparsely vegetated land, respectively, and this six-class scheme is used in all subsequent analyses. Although the national land-cover dataset provides maps from 1985 to 2021, the LUCC analysis in this study is restricted to 1990–2020, for which a consistent, quality-controlled time series of land-use maps is available. Socioeconomic indicators (e.g. GDP) are only available as reliable municipal statistics around 2020 and are therefore treated as quasistatic background drivers in the forward simulations.
Research methodology
Patch-generating Land Use Simulation model principles
The PLUS model integrates a Land Expansion Analysis Strategy (LEAS) with a multitype random patch seeding CA (CARS) framework to simulate patch-level land-use transitions.
25
The LEAS identifies newly generated land patches between two periods and employs a Random Forest classifier to learn the relationship between land expansion and multiple driving factors. The expansion probability of pixel i converting to land-use type k is expressed as:
In this study, LEAS was calibrated using multiperiod land-use datasets for 1990–1995, 1995–2000, 2000–2005, 2005–2010, 2010–2015, and 2015–2020 to capture temporal variability in construction-land expansion. Newly converted construction-land pixels (nonbuilt to built) were extracted as positive samples for each period, while unchanged pixels served as background samples. A Random Forest model was trained for each period using the driving factors described in “Driving factors of land use change” section, and spatially explicit expansion-probability maps were generated.
The CARS module simulates the spatial pattern of land use by integrating expansion probability, neighborhood effects, and scenario-specific conversion constraints. The comprehensive transition probability of pixel i converting to class k at time t is:

In this study, CARS was used to simulate land-use patterns for both validation years (1995–2020) and future scenarios (2025–2040). Land-use demand for each simulated year was estimated using a Markov chain based on historical transition probabilities, while the transition matrix, neighborhood weights, and conversion constraints were adjusted according to scenario settings. The overall modeling framework is summarized in Figure 2.
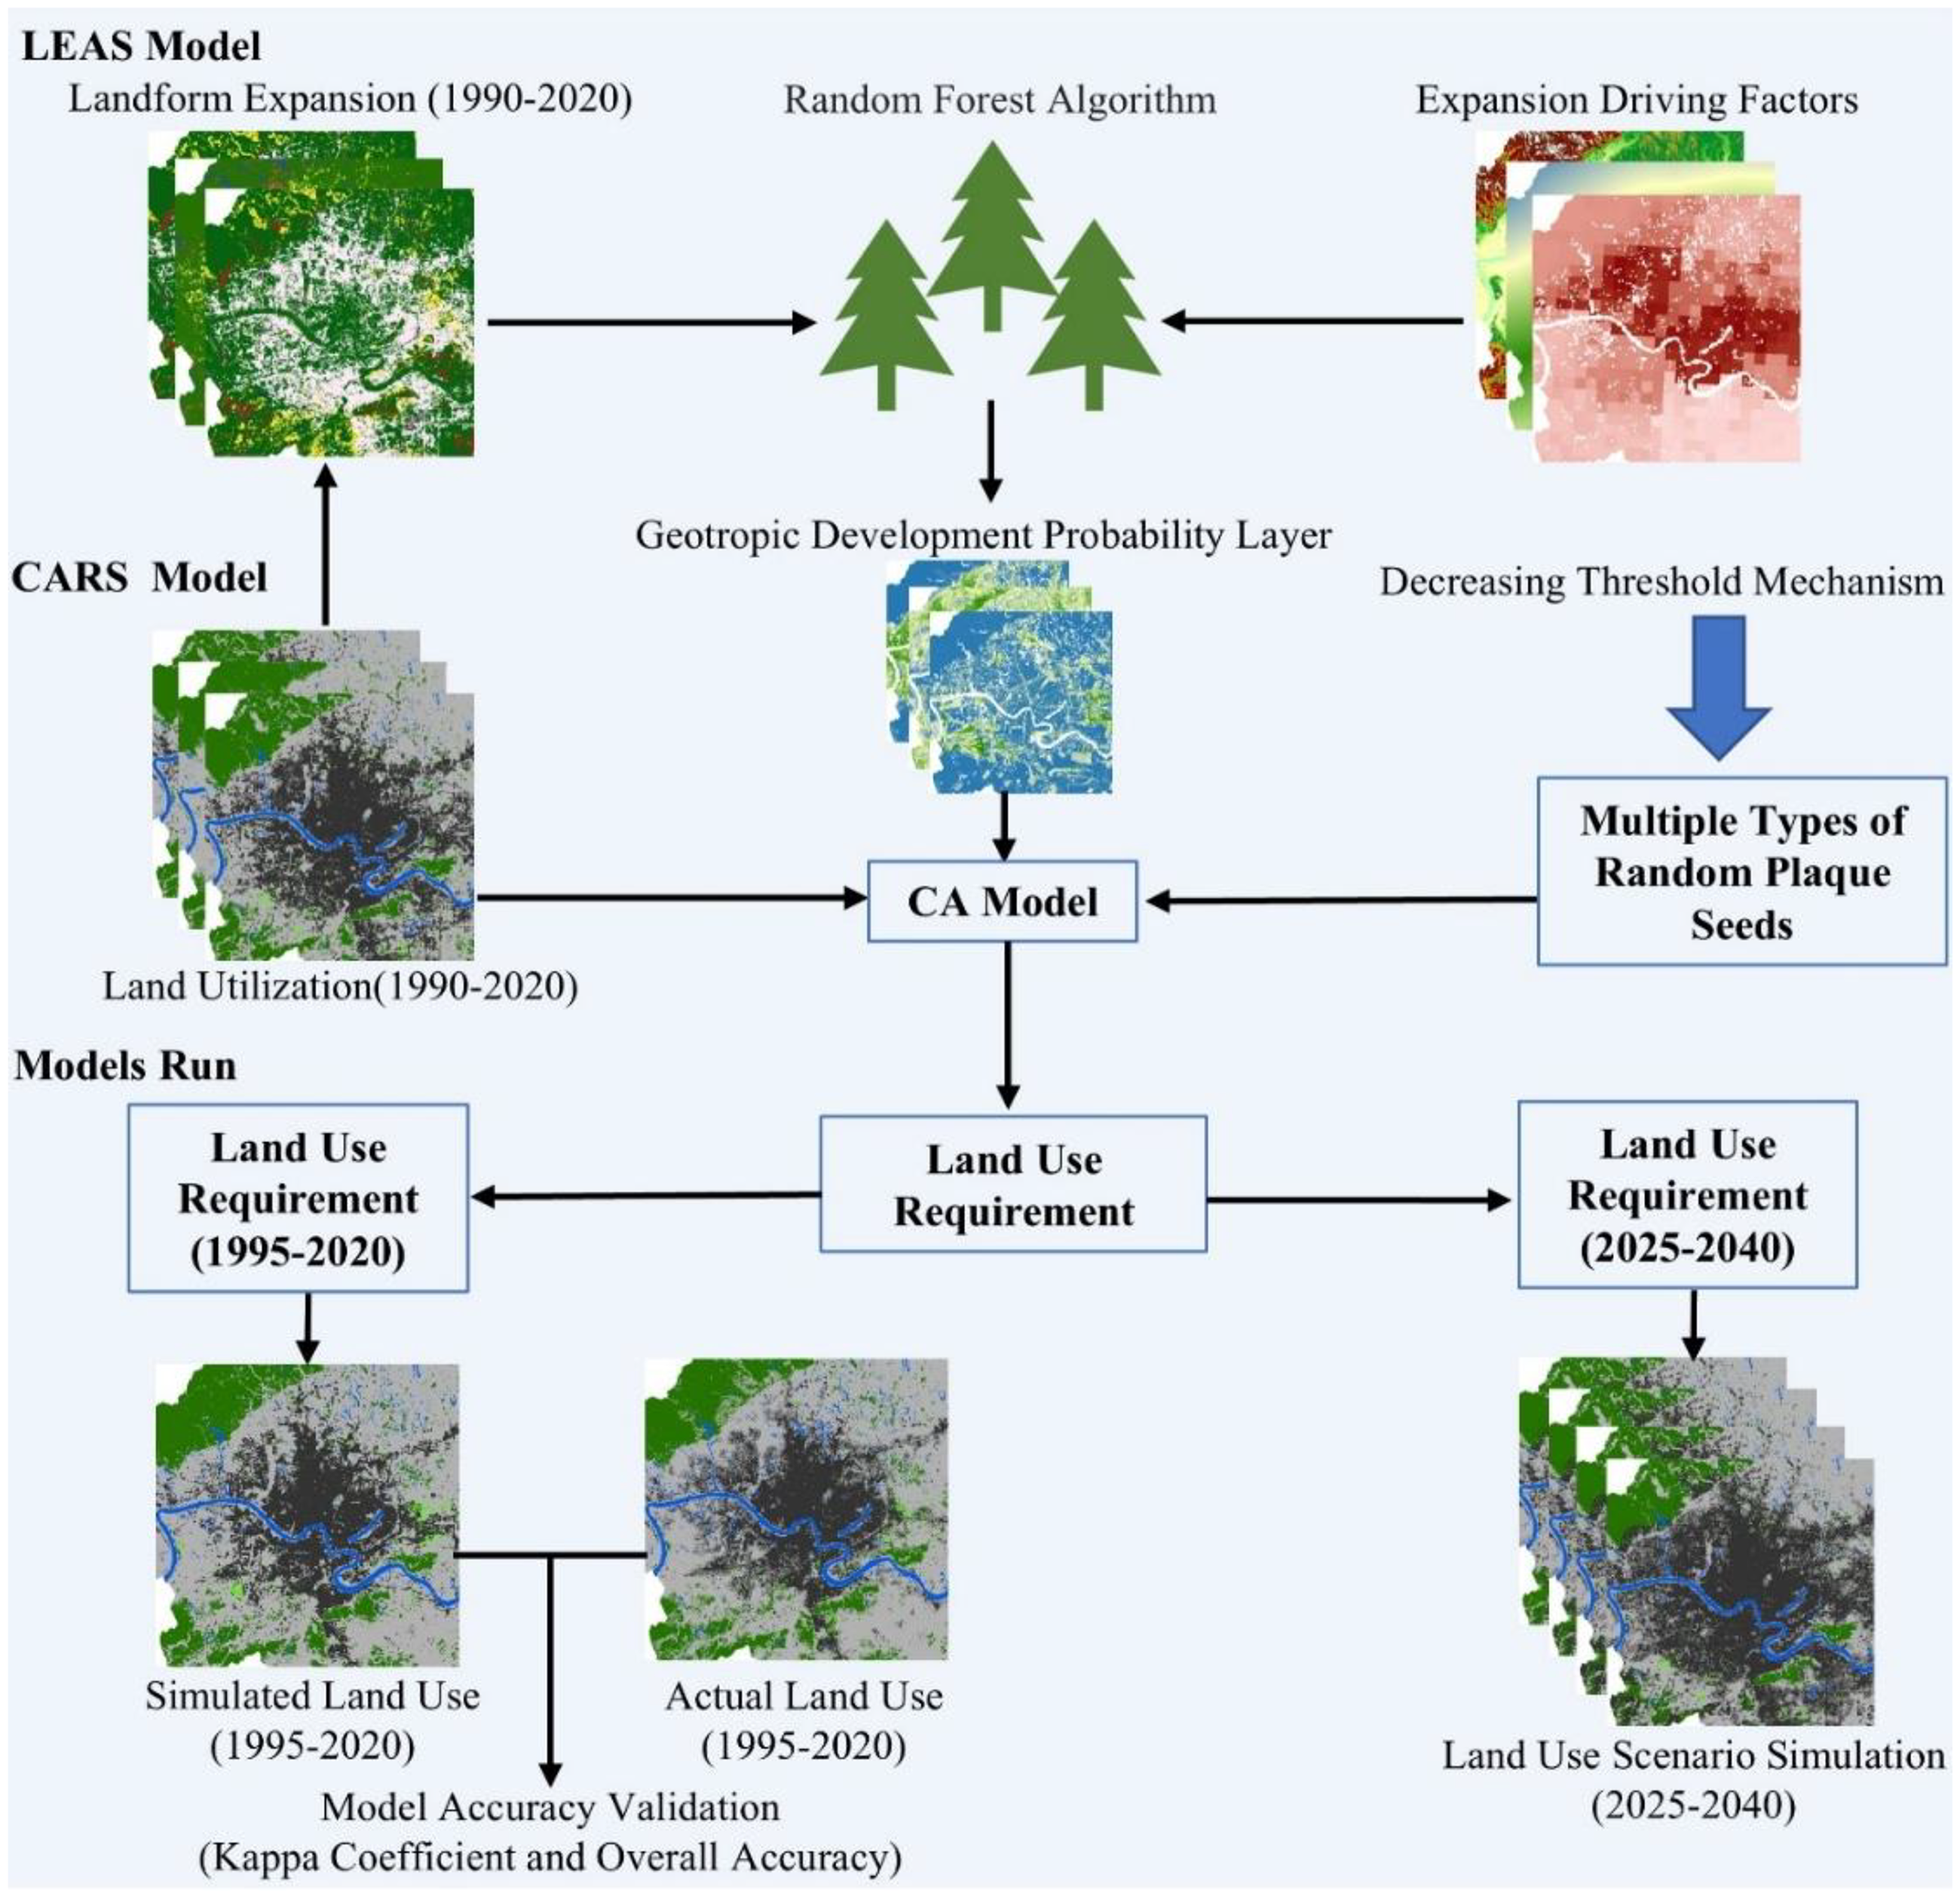
Patch-generating Land Use Simulation (PLUS) model modeling and operation process.
GeoDetector model
To quantify the extent to which natural, socioeconomic, and accessibility factors explain spatial variations in construction-land expansion, this study employed the GeoDetector model.
31
GeoDetector assesses the explanatory power of a driving factor X on a spatially stratified variable Y by measuring the consistency between their spatial distributions. The explanatory power is represented by the q-statistic:
The interaction detecto 32 examines the combined effects of two factors and determines whether their interaction produces enhancement, weakening or independence by comparing single-factor and joint q values.
Construction-land expansion from 1990 to 2020 was used as the dependent variable, and the driving factors in “Driving factors of land use change” section served as explanatory variables. Continuous variables were discretized using the natural breaks (Jenks) method. The GeoDetector results provide complementary evidence for interpreting PLUS-derived factor contributions.
Driving factors of land-use change
Land-use change in Nanning is shaped by natural constraints, socioeconomic dynamics, and accessibility conditions. Following widely adopted LUCC and PLUS-based studies, 25 12 driving factors were selected. Natural factors include elevation (DEM), slope, precipitation (Pre), temperature (Tem), and soil type (Soil). Socioeconomic factors include GDP and population density (POP). Accessibility-related factors include distances to highways (DHi), railways (DRa), metro lines (DMe), primary roads (DPr), and secondary roads (DSr). All distance-based factors were derived using the Euclidean Distance tool in ArcGIS.
Because metro construction in Nanning began after 2008, the DMe layer was excluded from simulations covering the 1990DPr), and secondary roads (DSr). raster were resampled to 30 m resolution and normalized to the range [0,1] using min–max scaling. The spatial distributions of the driving factors are provided in Figure S1 (Supplementary Material).
Model parameter rate determination and accuracy test
The PLUS model was calibrated and validated using historical land-use maps for Nanning. Land-use patterns for 1995, 2000, 2005, 2010, 2015, and 2020 were simulated from the land-use map of the preceding period and compared with the corresponding observed distributions using the Validation module in PLUS. Calibration relied primarily on the Kappa coefficient, complemented by overall accuracy (OA) and the Figure of Merit (FoM). The FoM is defined as
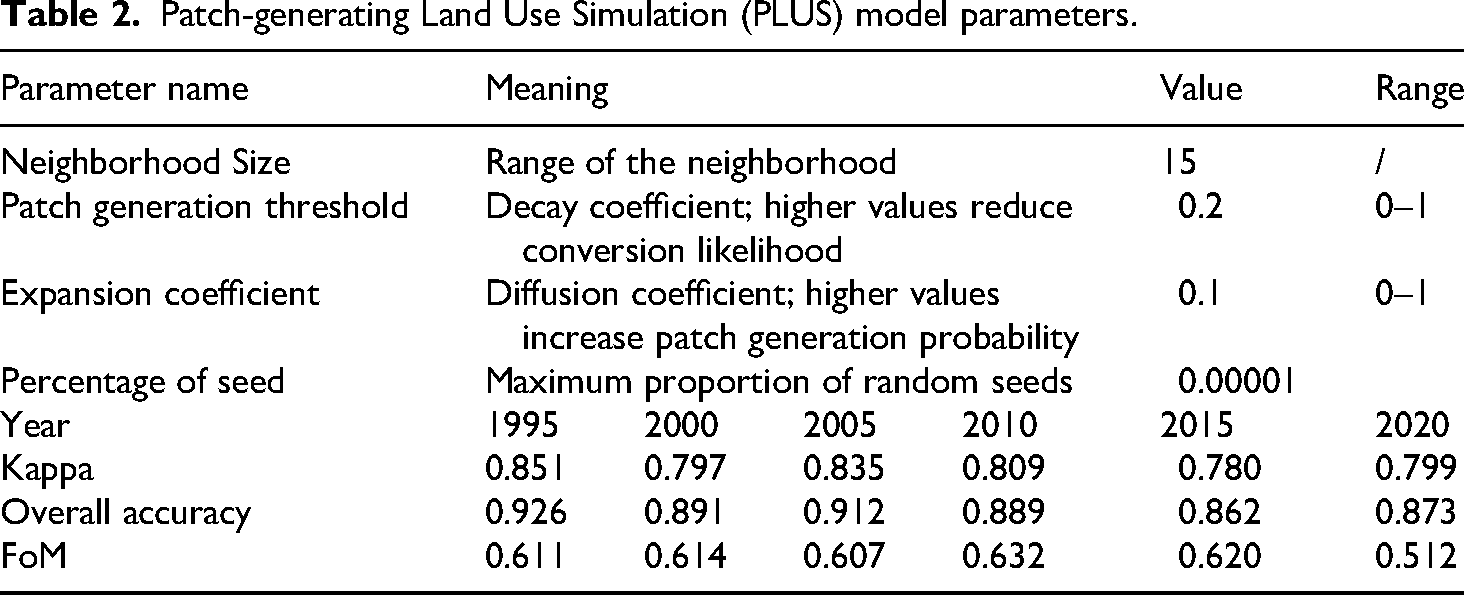
The final settings of the CARS module (neighborhood size, patch-generation threshold, expansion coefficient and percentage of seeds) and the validation statistics are summarized in Table 2 and were selected based on several trial simulations and previous PLUS applications. With this calibrated parameter set, Kappa ranges from 0.78 to 0.85, OA from 0.86 to 0.93, and FoM from 0.51 to 0.63 across the six validation years, indicating that the model correctly reproduces more than half of the observed land-use changes. The spatial comparison between the observed and simulated land-use maps for 2020 (Figure 3) further confirms the good agreement, especially along with the main urban expansion corridors.
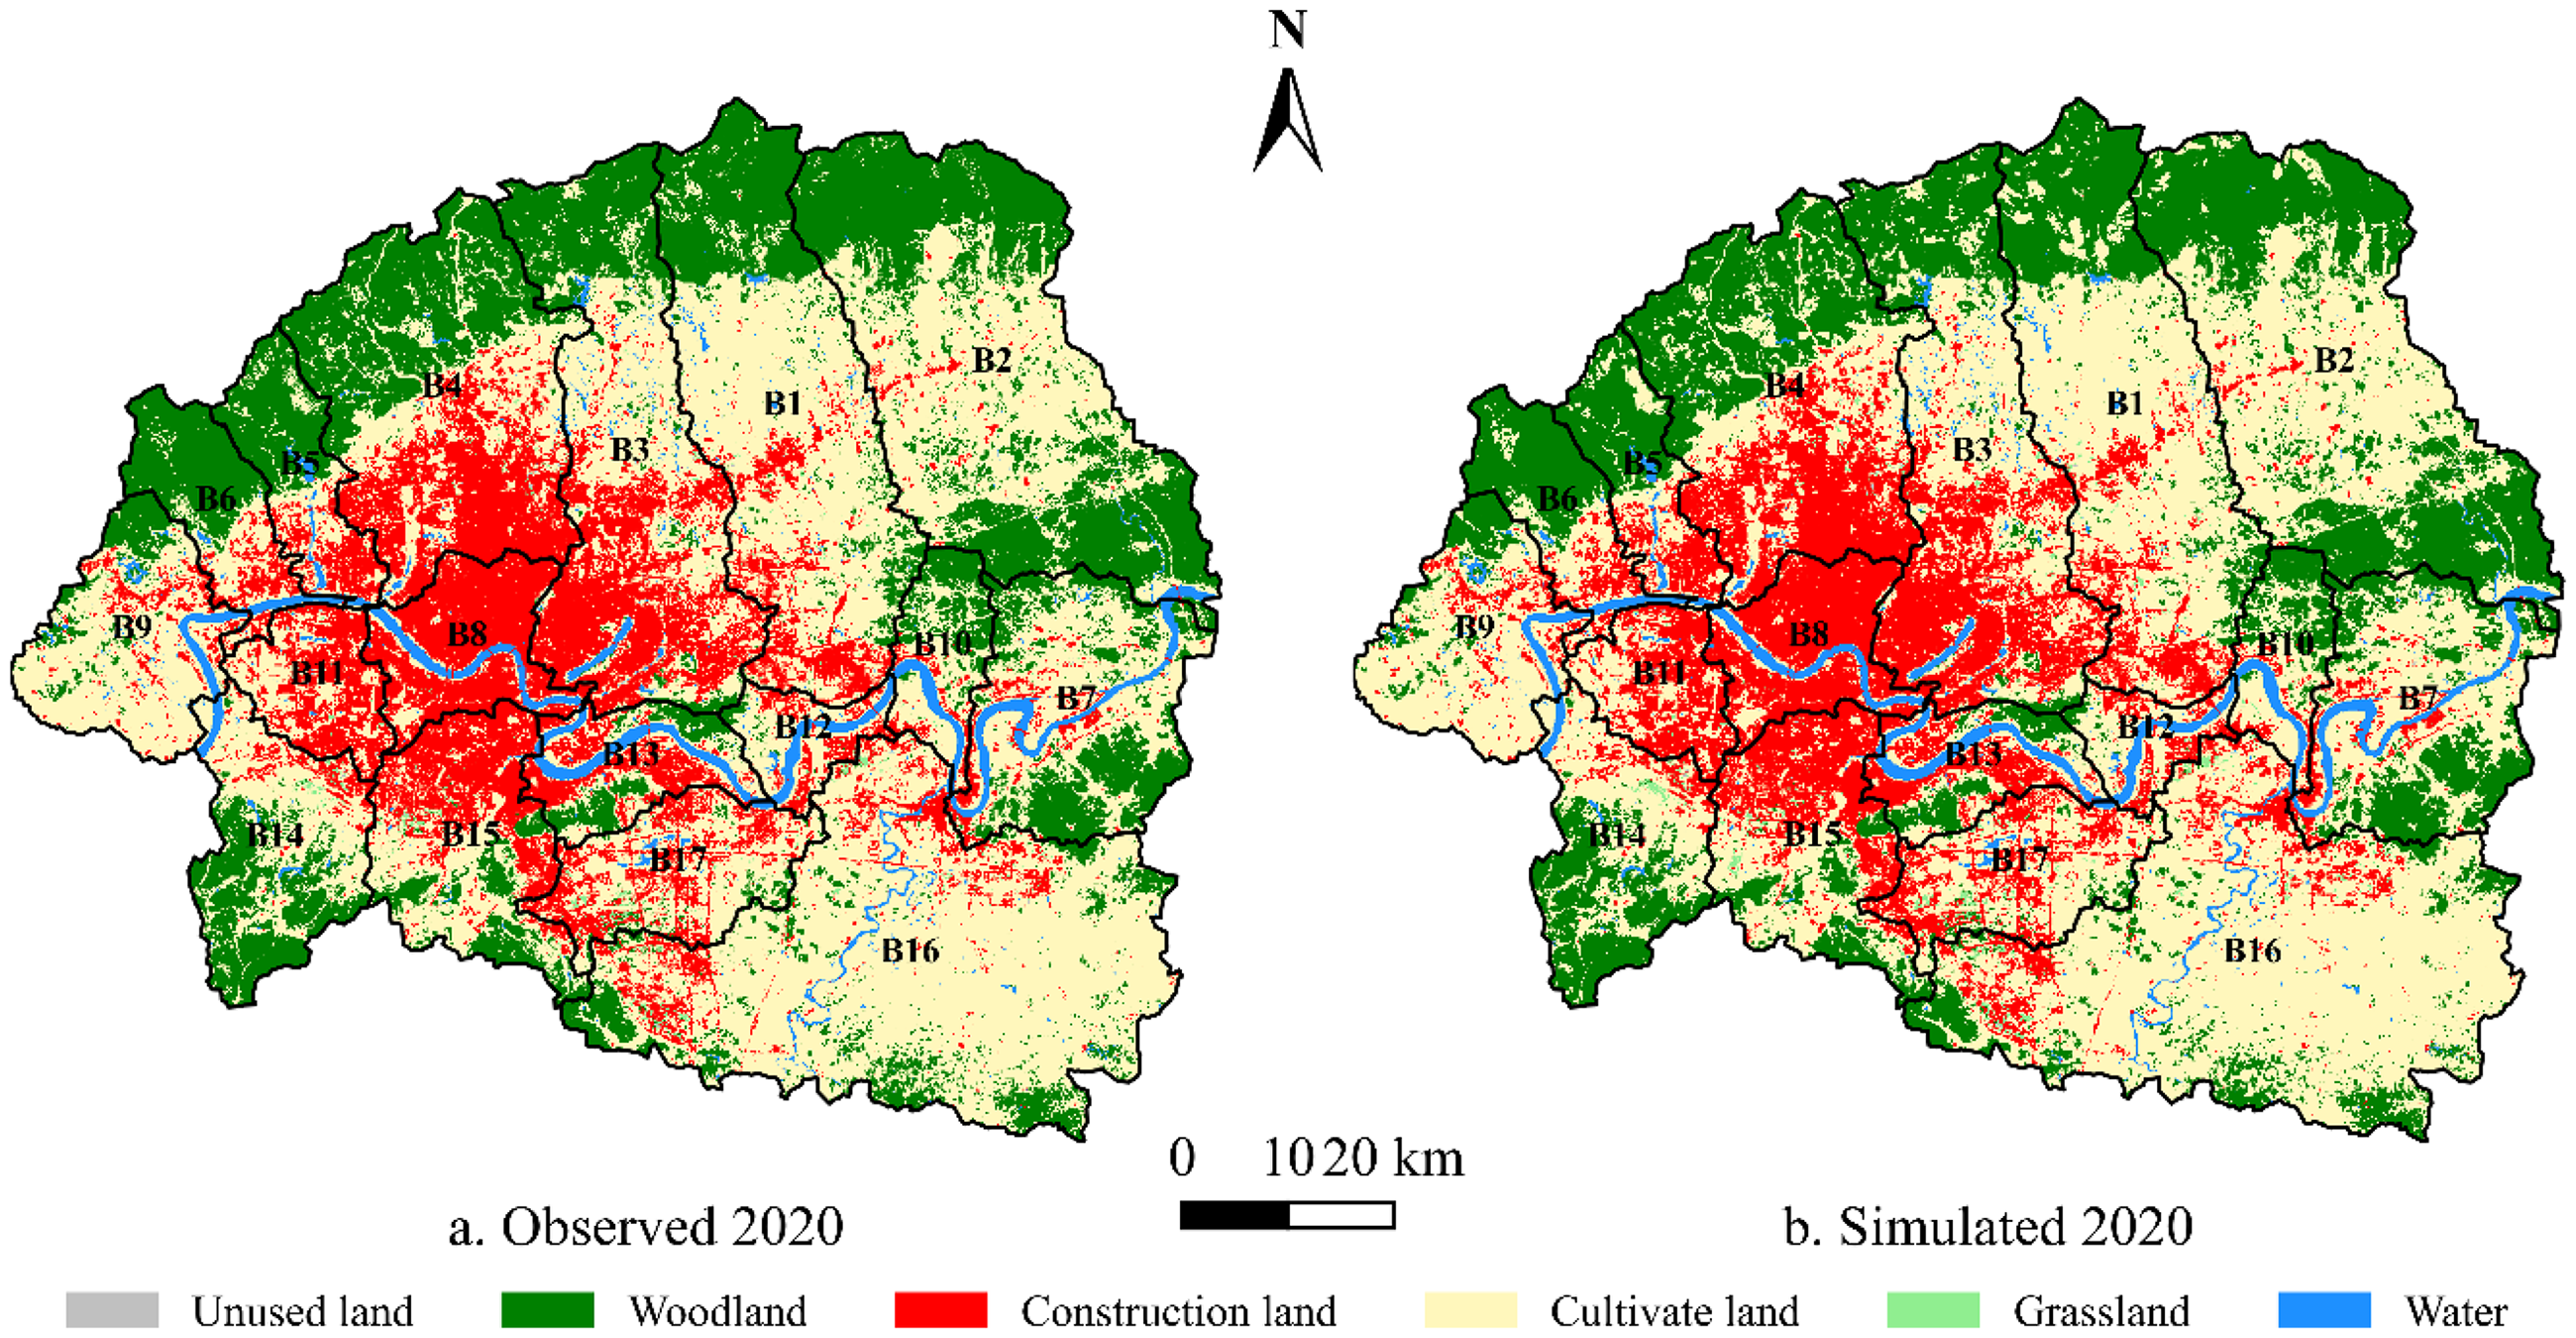
Observed (a) and simulated (b) land use in Nanning in 2020 using the calibrated Patch-generating Land Use Simulation (PLUS) model.
Patch-generating Land Use Simulation (PLUS) model parameters.
Scenario design and land-use demand
Two land-use scenarios were constructed for 2025, 2030, 2035, and 2040: a ND scenario and an EP scenario. In both scenarios, total land-use demand for each class and target year was estimated using the Demand Prediction–Markov Chain module in PLUS, based on transition probabilities derived from land-use changes during 1990–2020. Under ND, the calibrated transition matrix and CARS neighborhood settings were applied directly, so that future land conversion follows recent development trends without additional ecological constraints; the CARS module then allocated the Markov-derived demands spatially according to LEAS-based suitability and neighborhood effects.
Under EP, ecological redline and key conservation zones issued by the Nanning Natural Resources Bureau were mapped as restricted areas. Within these zones, conversion of woodland to other classes was prohibited. Outside the red line, the transition probabilities of woodland and grassland converting to CL were reduced by 30%, while the probabilities of cultivated land and grassland converting to woodland were increased by 10%, and the neighborhood weights for unused land, woodland, CL, cultivated land, grassland, and water were set to 0.2, 0.3, 0.8, 0.5, 0.3, and 0.1, respectively, to promote compact urban growth and ecological restoration. These settings allow the ND and EP simulations to be directly compared in terms of future urban expansion trajectories and trade-offs between construction-land growth and ecological conservation in Nanning.
Results and analysis
Land-use distribution and transfer characteristics in Nanning, 1990–2020
Between 1990 and 2020, land use in Nanning was dominated by cultivated land, woodland, and CL. Rapid urbanization since the early twenty-first century raised CL to 19.63% of the total area by 2020, while green space covered 26.35% (Figure 4). Over the study period, CL increased by 212.88 km2, a 5.62-fold rise relative to 1990, with an average annual growth of 7.34 km2. Woodland and cultivated land showed marked declines of 11.90% and 19.94%, respectively, whereas water bodies remained relatively stable and grasslands showed only minor net change. Quantitative changes in the areas and proportions of each land-use class in 1990, 2000, 2010, and 2020 are summarized in Figure S2 and Table S1 (Supplementary Material).
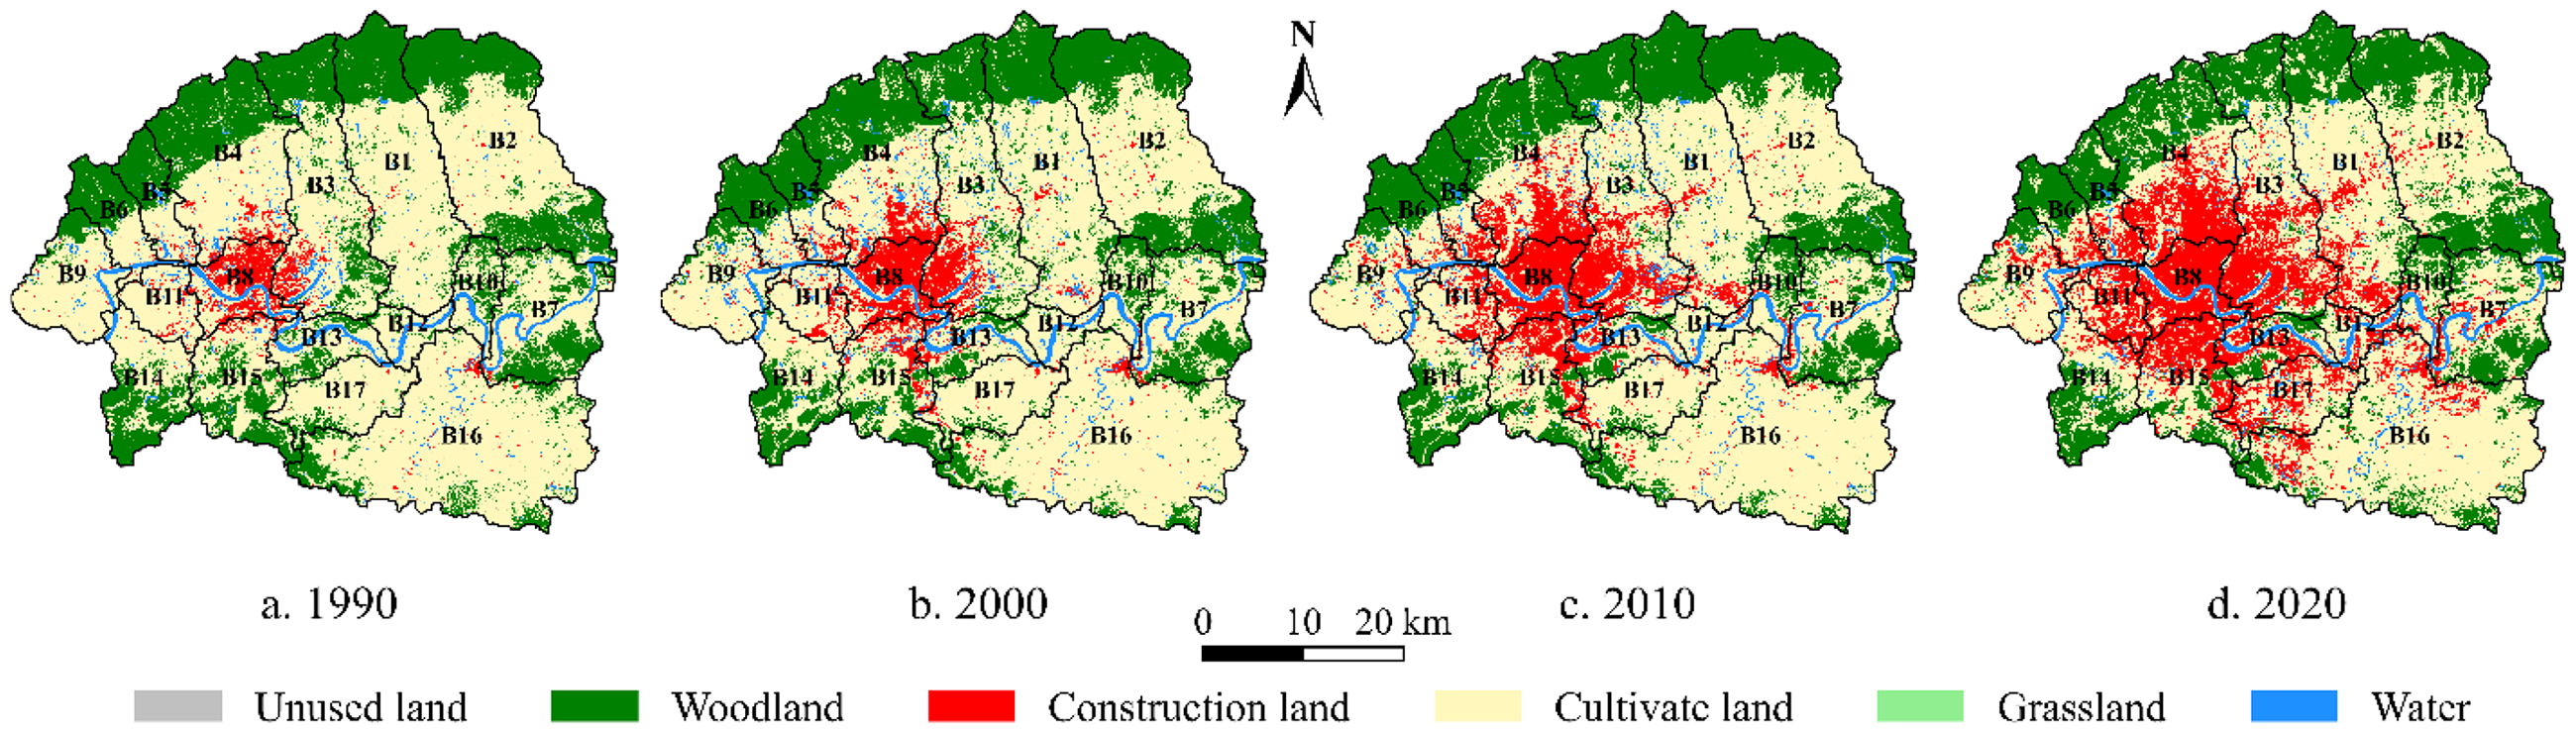
Spatial distribution of land use in Nanning, 1990–2020.
The spatial distributions of woodland and cultivated land largely reflect topography: woodland is concentrated in higher-elevation mountainous areas, while cultivated land is mainly located in low-lying basins and river valleys. As CL expanded, development increasingly occupied low-slope periurban plains around the existing urban core, especially in areas with extensive cultivated land.
Based on land-use data from 1990, 2005, and 2020, transition matrices were generated for the periods 1990–2005 and 2005–2020 (see Figure S3 in the Supplementary Material).
Between 1990 and 2005, woodland, cultivated land, and CL exhibited the most significant exchanges. Woodland experienced the largest conversion (23.0%), shifting mainly to cultivated land and CL. Cultivated land decreased by 11.3%, while CL grew by 72.6 km2, sourced from both woodland and cultivated land. This pattern reflects the early urban expansion stage, when development concentrated along with flat, accessible terrain near the urban core.
Between 2005 and 2020, land-use change followed a similar pattern but at a faster rate and larger scale. Woodland saw 18.3% of its area converted to cultivated land and CL, while 24.8% of cultivated land shifted to woodland and CL. Construction land continued to expand with minimal loss. In terms of inflows, cultivated land increased by 63.8 km2 from woodland and water bodies; woodland grew by 75.2 km2 from cultivated land; and CL expanded by 141.1 km2, primarily sourced from woodland, cultivated land, and grassland. This acceleration aligns with major infrastructure investment and the rapid development of Wuxiang New District, which intensified incentives for land conversion.
Overall, time-series analysis highlights substantial changes in Nanning's land use from 1990 to 2020, with sharp declines in cultivated land and woodland alongside rapid growth of CL. These patterns indicate that woodland and cultivated land served as the main land reserve for CL during rapid urbanization, and that the observed two-way conversions between them reflect staged adjustment of agricultural and forest land around the urban fringe rather than systematic misclassification between the two classes. Both cultivated land and woodland were the major contributors to construction-land expansion, particularly after 2005, providing the empirical basis for the driving-mechanism analysis in “Characteristics and driving mechanisms of construction land expansion in Nanning” section.
Characteristics and driving mechanisms of CL expansion in Nanning
Spatial distribution of CL expansion
From 1990 to 2020, CL in Nanning expanded predominantly at the expense of cultivated land (89.13%), followed by woodland (7.65%), with minor contributions from grassland, water, and unused land (3.22%). In 1990, CL was concentrated in the B8 watershed. Over the subsequent three decades, expansion radiated outward into surrounding flatlands, with substantial conversion of nearby cultivated land (Figure 5).

Sources and spatial extent of construction land expansion in Nanning, 1990–2020.
The three phases of construction-land expansion (1990–2000, 2000–2010, and 2010–2020) exhibit a clear pattern of acceleration and directional concentration (Figure 5(b)–(d)). Between 1990 and 2000, CL increased by 45.8 km2, mainly within approximately 5 km of the B8 watershed. Expansion accelerated to 66.4 km2 in 2000–2010, a 45.1% rise over the previous decade, extending eastward into Qingxiu District and southward toward the B11, B3, B4, and B5 watersheds. From 2010 to 2020, CL grew by 100.7 km2—2.2 times that of the first phase and 1.5 times the second—spreading rapidly eastward and southeastward into Qingxiu and Liangqing districts, while growth to the north, west, and southwest slowed.
Coupled analysis with DEM indicates that mountainous and hilly terrain in the north and southwest restricted expansion, whereas flat terrain and extensive cultivated land in the east and southeast facilitated urban growth. This southeast-oriented pattern is also broadly consistent with Nanning's development direction during this period, where new districts and major infrastructure were preferentially allocated to low-slope areas.
Intensity and speed of CL expansion
Construction land expansion areas of each primary subbasin in Nanning from 1990 to 2020 were extracted, and their expansion intensity and speed were calculated and then classified using the Jenks natural breaks method. The spatial distribution of expansion intensity and speed is shown in Figure S4 (Supplementary Material).
The results show that all subbasins experienced CL expansion during the study period. The three subbasins with the largest expansion areas were B3 (36.64 km2), B4 (32.6 km2), and B15 (23.26 km2). The highest expansion intensities were observed in B11 (50.27%), B15 (36.45%), B17 (33.38%), and B13 (32.25%). By contrast, southwestern subbasins (B9, B14) and eastern subbasins (B2, B7, B10, B16), which are farther from the city center, exhibited relatively low intensities, reflecting slower urbanization.
Marked differences were also observed in expansion speed. The fastest growth occurred in B3 (1.18 km2/a), B4 (1.05 km2/a), and B15 (0.75 km2/a), largely due to their proximity to the urban core and flat terrain. Importantly, the spatial patterns of intensity and speed were not entirely consistent. High-intensity zones were concentrated in central subbasins, whereas the fastest-expanding zones were mainly located in the northern and southeastern regions, including eastern Xixiangtang, southwestern Xingning, northern Jiangnan, and northern Liangqing. These hotspots coincide with Nanning's recent industrial clustering and the outward relocation of urban functions, indicating a shift from core-area densification toward multidirectional peripheral expansion.
Contribution analysis of driving factors for CL expansion
Over the past three decades, Nanning's rapid urbanization has been shaped by both natural and socioeconomic drivers. In this study, seven socioeconomic and five natural variables were analyzed using the LEAS module of the PLUS model. The contribution values of each factor across the three periods are summarized (see Figure S5 in the Supplementary Material).
During 1990–2000, the five most influential factors were DEM (0.170), Slope (0.126), GDP (0.121), POP (0.108), and DSr (0.108), while Soil (0.029) exerted minimal influence. These results suggest that in the early stage of urbanization, topographic constraints strongly shaped the spatial allocation of new CL, and socioeconomic factors—although emerging—remained secondary due to the still-limited scale of economic clustering.
During 2000–2010, the leading contributors were DEM (0.199), DSr (0.147), Slope (0.130), Tem (0.106), and DHi (0.077), with Soil again least influential (0.007). Metro construction began in 2008, and its influence (DMe = 0.069) already ranked sixth, reflecting the transition toward infrastructure-led urban expansion. Road accessibility (DSr, DHi) became increasingly important as Nanning's development shifted toward newly planned growth corridors, particularly in Qingxiu and Liangqing districts.
During 2010–2020, DEM (0.176), Slope (0.132), DSr (0.116), Tem (0.106), and DMe (0.079) remained the dominant contributors. Compared with earlier decades, the relative importance of natural factors declined as built-up areas expanded onto most low-slope terrain. Meanwhile, transportation-related variables gained prominence, consistent with the city's rapid metro expansion and the formation of multicenter development clusters. Soil maintained the lowest influence (0.035), suggesting that as urbanization intensified, soil differentiation became less relevant, and land conversion was increasingly shaped by socioeconomic and accessibility-driven forces.
Interaction detection of driving factors
Urban expansion in Nanning is jointly shaped by natural and socioeconomic drivers. Interaction detection demonstrates that the combined effects of multiple factors generally exceed those of individual factors, highlighting the complexity of CL growth 33 (see Figure S6 in the Supplementary Material).
Economic–natural interactions were particularly strong. During 1990–2000, the individual q-values of GDP (0.192) and Pre (0.231) rose to 0.614 when combined, indicating clear nonlinear enhancement. This suggests that CL expansion tended to concentrate in economically dynamic corridors of the Yongjiang valley and Chaoyang Creek basin, where strong development pressure coincides with humid, low-lying environments. In these areas, GDP mainly captures the intensity of urban development demand, while precipitation acts as a proxy for water-related constraints that planners must consider, so their joint effect on the spatial pattern of expansion is substantially stronger than either factor alone.
Transport–economic interactions intensified over time. The q-value for DRa × GDP increased from 0.683 (1990–2000) to 0.748 (2010–2020), underscoring the growing influence of economic clustering along with railway corridors. Combined effects of DHi, DRa, and Pop were also strong, indicating that transportion infrastructure not only attractcts economic activities but also reshapes population distribution, jointly accelerating CL expansion.
Topographic interactions, particularly Slope × Pre and Slope × GDP, consistently exhibited nonlinear enhancement. These results imply that while flat terrain generally promotes construction, areas with more complex slope conditions are more sensitive to precipitation-related constraints and cost considerations, which in turn affect development timing and feasibility.
A temporal comparison reveals a clear shift in dominant forces. Between 1990 and 2010, interactions involving POP were more prominent, reflecting demographic expansion and rural-to-urban migration. By 2010–2020, GDP-related interactions became more important as Nanning entered a mature urbanization stage characterized by economic restructuring, corridor-oriented development and policy-driven new district construction.
Overall, the interaction results confirm that urban growth in Nanning is not controlled by isolated variables but by their synergies, especially among topography, transport infrastructure, and socioeconomic factors.
Spatial heterogeneity of CL expansion
To further explore spatial heterogeneity, this study examines the influence of a representative factor—distance to secondary roads—on CL expansion between 1990 and 2020. Distance to secondary roads was selected because it consistently ranked among the most influential accessibility drivers across all periods (see “Contribution analysis of driving factors for CL expansion” section). The spatial patterns across three periods are summarized in Figure S7 (Supplementary Material).
From 1990 to 2000, expansion was concentrated in the city center, particularly near secondary roads, while peripheral areas experienced more scattered growth. This indicates that transport infrastructure at this stage primarily shaped development within the urban core and its immediate surroundings.
Between 2000 and 2010, with metro construction initiated, expansion became concentrated on the outskirts of the old city, especially near secondary roads and major corridors such as Kunlun Avenue and Minzu Avenue. This pattern is characteristic of Nanning's basin-type urban structure, where expansion tends to follow low-elevation transport corridors. At the same time, areas along with the proposed metro lines emerged as hotspots of development, reflecting the growing influence of planned rail transit. The city center also continued to expand, highlighting the acceleration of urbanization.
From 2010 to 2020, CL expanded further outward, closely aligned with the distribution of secondary roads. Expansion often terminated at road endpoints, likely constrained by planning regulations or terrain, particularly in the northwest.
Overall, these patterns highlight the combined influence of natural conditions, transport infrastructure, and socioeconomic forces. Flat terrain areas were generally more suitable for development, while secondary roads and the growing metro network increasingly guided spatial growth. Economic development and population growth fueled land demand, particularly in rapidly urbanizing districts such as Wuxiang New District, where government-led initiatives, played a decisive role in shaping expansion trends in the southeast. These spatial differences reflect the multifactor coupling of terrain suitability, infrastructure provision, and government-led development priorities, rather than any single driving factor.
Land-use forecasting for Nanning under multiple scenarios
Land use in Nanning was forecast for 2025, 2030, 2035, and 2040 under two scenarios: ND and EP. Based on the scenario design in “Scenario design and land use demand” section, future land-use patterns were simulated for both scenarios, and temporal changes in land-use area and patch proportions (Figures S8 and S9 in the Supplementary Material), together with spatial patterns (Figure 6), were analyzed to characterize landscape evolution, urban expansion paths, and EP effects. Overall, CL is expected to continue expanding, primarily at the expense of woodland and cultivated land. The EP scenario does not halt urban growth but redirects expansion into a more compact and corridor-oriented pattern, alleviating landscape fragmentation and protecting ecologically sensitive zones compared with ND.

Forecasted land-use distribution in Nanning under the natural development (ND) and ecological protection (EP) scenarios, 2025–2040.
Under the ND scenario, CL continuously expands, particularly toward the eastern and southeastern subbasins (B1, B3, B12, B16, and B17), following the historical “east–south expansion” trajectory of Nanning. By 2040, CL increases by 182.88 km2 relative to 2020, exceeding the 167.11 km2 growth recorded during 2000–2020 and indicating an accelerated trajectory of urbanization. Woodland and cultivated land decline by 101.83 km2 and 75.39 km2, respectively, confirming their roles as primary contributors to urban land supply. Grassland and water areas decrease slightly (by 0.83 km2 and 5.21 km2), while unused land shows a minor increase (0.38 km2). Patch-based trends reveal intensified landscape fragmentation under rapid development, with ecological spaces becoming more isolated around the urban fringe.
Under the EP scenario, CL still grows, increasing by 127.36 km2 relative to 2020, which is 55.52 km2 less than under ND. Woodland and grassland areas in 2040 are 95.76 km2 and 5.99 km2 larger than under ND, respectively, whereas cultivated land loss is actually greater than under ND, with 48.17 km2 less cultivated land remaining in 2040. This indicates a trade-off whereby ecological restoration and woodland conservation are partly achieved at the expense of farmland. Compared with ND, urban expansion under EP becomes more compact and organized along with existing corridors, avoiding key ecological areas, preserving more continuous woodland patches, and reducing fragmentation.
To further examine intraurban differences, three representative regions were selected (see Figure S10 in the Supplementary Material). In Region 1 (Xixiangtang), woodland is largely converted to CL under ND, whereas the EP scenario safeguards woodland and redirects development toward surrounding cultivated land, maintaining a green buffer around the built-up area. Region 2 (near Kunlun Avenue) shows expansion along with a southwest–northeast axis under both scenarios, yet scattered southern woodland is preserved only under EP, which helps sustain ecological connectivity along with the corridor. Region 3 (Liangqing District) experiences strong development demand in both cases, but southern woodland is effectively protected under EP, avoiding encroachment on ecological patches.
Overall, the forecasts indicate that although urban expansion in Nanning remains dependent on the conversion of woodland and cultivated land, the EP scenario reshapes development pathways toward compact, infill-oriented, and corridor-linked growth. By preserving ecological buffers, maintaining corridor connectivity, and reducing fragmentation, ecological zoning substantially enhances regional ecological resilience relative to ND.
Discussion
Rapid urbanization in China has led to substantial land-use restructuring, typically characterized by rapid construction-land expansion, loss of cultivated land, and pressure on ecological systems. 34 Nanning follows this general trajectory but exhibits several distinctive features linked to its basin-type topography and development strategy. From 1990 to 2020, CL expanded more than fivefold, while cultivated land and woodland contracted substantially, a pattern consistent with earlier studies on Nanning.35,36 Transition-matrix analysis further shows that cultivated land and woodland jointly functioned as the core “land reserve” for urban growth: cultivated land formed the predominant outflow type whereas woodland both supplied land for construction and received inflows from cultivated land and unused land through ecological restoration and greening policies. 37 This dual role reflects the coevolution of agricultural restructuring, ecological conservation programs, and urban expansion in a rapidly urbanizing subtropical Sponge City and underlines that “ecological land” around Nanning is not simply being consumed but is also being selectively reconfigured.
Land-use change in Nanning is shaped by multiple interacting factors rather than a single dominant drive. The PLUS model results identify elevation, slope, and transportation accessibility (especially distance to secondary roads) as dominant driver. Expansion was concentrated in flat, low-elevation areas in the central basin and extended toward the north and southeast, enabled by the joint effects of land availability and transport infrastructure. Spatial analysis (Figure S7, Supplementary Material) further shows CL growth intensifying near secondary roads, while peripheral areas exhibit more scattered and gradually weakening expansion. In later periods, the development of railways and metro lines reinforced this corridor-oriented agglomeration pattern. These findings agree with earlier research emphasizing the catalytic role of flat terrain and transportation corridors in guiding contiguous urban development 38 and are consistent with the interaction detection results, which indicate that combinations of topographic and accessibility factors explain CL expansion better than any single variable. Scenario simulations highlight how planning policy reshapes future development trajectories. Model-based simulation provides essential support for managing urban growth and guiding sustainable land-use decisions. 39 Under the ND scenario, CL is forecast to increase by 182.88 km2 by 2040, while cultivated land and woodland are expected to decline by 101.83 km2 and 75.39 km2, respectively, continuing the historical trend of converting nonurban land into built-up areas. Under the EP scenario, ecological zoning and conversion controls reduce the increment of CL to 127.36 km2, that is, about 30% less expansion than under ND, and almost eliminate woodland loss, with woodland area decreasing by only 6.07 km2. By contrast, cultivated land loss increases to 123.56 km2, 48.17 km2 more than under ND, indicating that ecological restoration and woodland conservation are partly achieved at the expense of farmland. These results align with findings that coordinated ecological–economic strategies can not only restrain uncontrolled expansion and preserve ecological space 40 but also reveal internal trade-offs between EP and farmland security. Compared with ND, the EP scenario not only slows the quantitative expansion of CL but also promotes a more compact and corridor-oriented urban form that preserves larger, more continuous ecological patches and maintains key landscape buffers, as shown in “Land use forecasting for Nanning under multiple scenarios” section. For Nanning's Sponge City and urban flood-management initiatives, such adjustments to the spatial pattern of growth are crucial for reserving space for blue–green infrastructure, maintaining upstream and lateral buffer zones, and reducing hydrological and ecological risks in densely built basin areas. However, urban expansion persists even under protection policies, indicating sustained development pressure and the need to reinforce ecological redlines, intensify compact development, and enhance land-use efficiency to reconcile growth with ecological security.
Several limitations should be acknowledged. Land-use change is driven by complex interactions among economic development, social dynamics, planning policies, and ecological constraints. Although the PLUS model provides a powerful simulation framework, factors such as industrial structure, extreme climatic events, and abrupt policy shifts remain difficult to quantify explicitly, potentially affecting forecast accuracy. Moreover, socioeconomic drivers are treated as static due to data availability, so dynamic processes such as migration, investment cycles, and policy implementation intensity are not explicitly represented. The use of 30 m resolution remote-sensing data may overlook fine-scale land transitions. Scenario-based forecasting also simplifies future uncertainty and may not fully capture abrupt or nonlinear system responses. 41 Finally, no consistent, quality-controlled land-use map is yet available for 2025; thus the 2025 pattern in this study is a PLUS-generated forecast rather than an observed state and cannot be used for independent validation. Therefore, future research should integrate high-resolution imagery, field survey data, and enhanced socioeconomic indicators; compare PLUS-based projections with other models (e.g. CA–Markov or SLEUTH) to enhance robustness; and develop adaptive, policy-sensitive scenarios that explicitly account for climate extremes and Sponge City implementation, in order to provide more realistic and operational guidance for land-use management in rapidly urbanizing basin cities such as Nanning.
Conclusion
This study analyzed land-use change in Nanning (1990–2020) with the PLUS model to examine spatiotemporal dynamics, the drivers of construction-land expansion, and to forecast future trends under natural and ecological-protection scenarios. The main conclusions are:
Nanning experienced marked urbanization. Construction land expanded radially from the Chaoyangxi River Basin into eastern and southeastern flatlands, increasing 5.62 times since 1990 to 258.93 km2 (19.63% of the total). Land-use transformation was dominated by conversion from cultivated land and woodland, reflecting the typical urbanization pathway of basin-type subtropical cities. Construction land expansion was driven mainly by the conversion of cultivated land (89.13%). Spatially, growth was most intense in central watersheds and fastest in northern and southeastern areas (max intensity 50.27%, 1.18 km2/year). Natural factors (DEM, slope) constrained expansion, while transportation accessibility (e.g. DSr) guided its direction. Combined drivers—GDP, precipitation, slope, DEM, and proximity to highways and railways—exerted stronger effects than single factors. By 2040, CL under ND will expand by 182.88 km2, largely at the expense of woodland and cultivated land. Under EP, expansion is 55.52 km2 smaller, while woodland and grassland increase by 95.76 km2 and 5.99 km2, demonstrating the effectiveness of policy measures.
Future research should further clarify linkages among urban expansion, ecosystem functions, and environmental quality. Strengthening integrated land-use planning and industrial spatial optimization within a water–ecology–environment security framework will provide stronger scientific evidence for sustainable development. 42
Supplemental Material
sj-pdf-1-sci-10.1177_00368504261417161 - Supplemental material for Urban expansion drivers and land use scenario simulation in Nanning, China, using the PLUS model
Supplemental material, sj-pdf-1-sci-10.1177_00368504261417161 for Urban expansion drivers and land use scenario simulation in Nanning, China, using the PLUS model by Yun-chuan Yang, Xiao-han Huang, Jiao-yin Wei, Li-ping Liao, Guo-qiang Feng, Dong-yuan Sun, Zhi-yi Fu, Chong-xun Mo, Xun-gui Li and Gui-kai Sun in Science Progress
Footnotes
Acknowledgements
This work was supported by: (1) National Natural Science Foundation of China (Grant No. 42261017); (2) Natural Science Fund Project in Guangxi, China (Grant No. 2025GXNSFAA069305, 2025GXNSFAA069583).
Ethical considerations
This study did not involve human participants or personal data. Ethics approval was not required.
Author contributions
All authors contributed to the study conception and design. Material preparation, data collection, and analysis were performed by Yunchuan Yang, Jiaoyin Wei, and Liping Liao. The first draft of the manuscript was written by Xiaohan Huang, and all authors commented on previous versions of the manuscript. All authors read and approved the final manuscript.
Funding
The author(s) disclosed receipt of the following financial support for the research, authorship, and/or publication of this article: This work was supported by: (1) National Natural Science Foundation of China (Grant No. 42261017); (2): Natural Science Fund Project in Guangxi, China (Grant No. 2025GXNSFAA069305, 2025GXNSFAA069583).
Declaration of conflicting interests
The author(s) declared no potential conflicts of interest with respect to the research, authorship, and/or publication of this article.
Data availability statement
The data that support the findings of this study are available from the corresponding author upon reasonable request.
Supplemental material
Supplemental material for this article is available online.
References
Supplementary Material
Please find the following supplemental material available below.
For Open Access articles published under a Creative Commons License, all supplemental material carries the same license as the article it is associated with.
For non-Open Access articles published, all supplemental material carries a non-exclusive license, and permission requests for re-use of supplemental material or any part of supplemental material shall be sent directly to the copyright owner as specified in the copyright notice associated with the article.