
Abstract
The increasing demand for sustainable energy production necessitates the development of innovative technologies for converting municipal waste into valuable energy offering a viable alternative to fossil fuels. This study presents a flexible, portable, and expandable waste-to-energy concept that integrates gasification and pyrolysis processes production of combustible gases and liquid fuels. Particular emphasis is placed on the use of transparent and interpretable modelling approaches to support system optimization and future scalability. The proposed methodology is demonstrated on two experimental systems currently operated at CEET Explorer, VSB – Technical University of Ostrava, Czech Republic: (i) A primary gasification facility equipped with a plasma torch, reactor, hydrogen separator and tank, fuel cells, and renewable grid connections; and (ii) a secondary pyrolysis unit designed to maximize pyrolysis oil production. Both systems are modelled and simulated using in-house software developed in Python, employing stoichiometric balances, symbolic regression, and polynomial regression to represent chemical reactions and energy flows. The findings demonstrate that transparent models – such as stoichiometric modelling combined with interpretable machine learning – can accurately reproduce the operational behaviour of waste-to-energy processes. Gasification is optimized for hydrogen generation and electricity production via fuel cells, whereas pyrolysis favours liquid fuel yield with syngas as a by-product. Molar mass relations are applied to ensure consistent conversion between mass and volume across gasification, pyrolysis, and combustion pathways, maintaining the conservation of mass. Overall, the integration of stoichiometric balance models with symbolic and polynomial regression provides a reliable and interpretable framework for simulating real waste-to-energy systems. The current results, based on bio-wood waste from the Czech Republic, validate the proposed methodology, which is made openly available to promote transparency, reproducibility, and further advancement of sustainable waste-to-energy technologies.
Introduction
The objective of this study is to create flexible, portable, durable, ecologically sustainable, and expandable technology solution for efficient transformation of waste into valuable energy forms (taking care about, e.g. evidence that plasma gasification of municipal and/or industrial waste enables hydrogen production with superior environmental and thermodynamic performance when coupled with CO2 capture, 1 that catalytic pyrolysis of bio-waste enhances product yield and quality while reducing emissions, 2 that pyrolysis and gasification of solid waste can be directed toward high-value outputs such as methanol, hydrogen, and electricity, 3 etc.), especially in combustible gases obtained in gasification facility (primary facility) or in liquid fuel obtained in small pyrolysis facility (secondary facility, i.e. pyrolysis is auxiliary process).
Both systems are modelled and simulated using in-house software developed in Python, employing stoichiometric balances, symbolic regression, and polynomial regression to represent chemical reactions and energy flows. The interactive bilingual Python software is available at https://shinyenet.vsb.cz/. To foster transparency and ensure reproducibility of our research, we provide open-source codes, including an MS Excel tool that integrates key thermochemical processes of the Centre for Energy and Environmental Technologies – Explorer (CEETe, https://ceet.vsb.cz/en/CEETe/). Open-source datasets and code are included in the appendices archived on Zenodo, as described in the Data Availability section. The methodology is fully transparent and based on open-source resources, leveraging both regression and stoichiometric modelling. In addition, an automated reporting tool for gasification analysis is made available as open source. The tool is available as Electronic Appendix A. The present work focuses on technologies currently implemented at CEETe and complements the recent techno-economic analyses of energy supply systems (e.g. Aziz et al. 4 ). Unlike prior studies, all models introduced here are openly accessible in a public repository.
An Excel table that provides raw data sets from repeated gasification measurements to cover the uncertainty of measurements is given as Electronic Appendix B. The repository also includes a Python-based automated regression tool for gasification modelling and reporting, provided as Electronic Appendix C.
Background
A rough schema of facilities and processes in the observed waste-to-energy system is given in Figure 1.
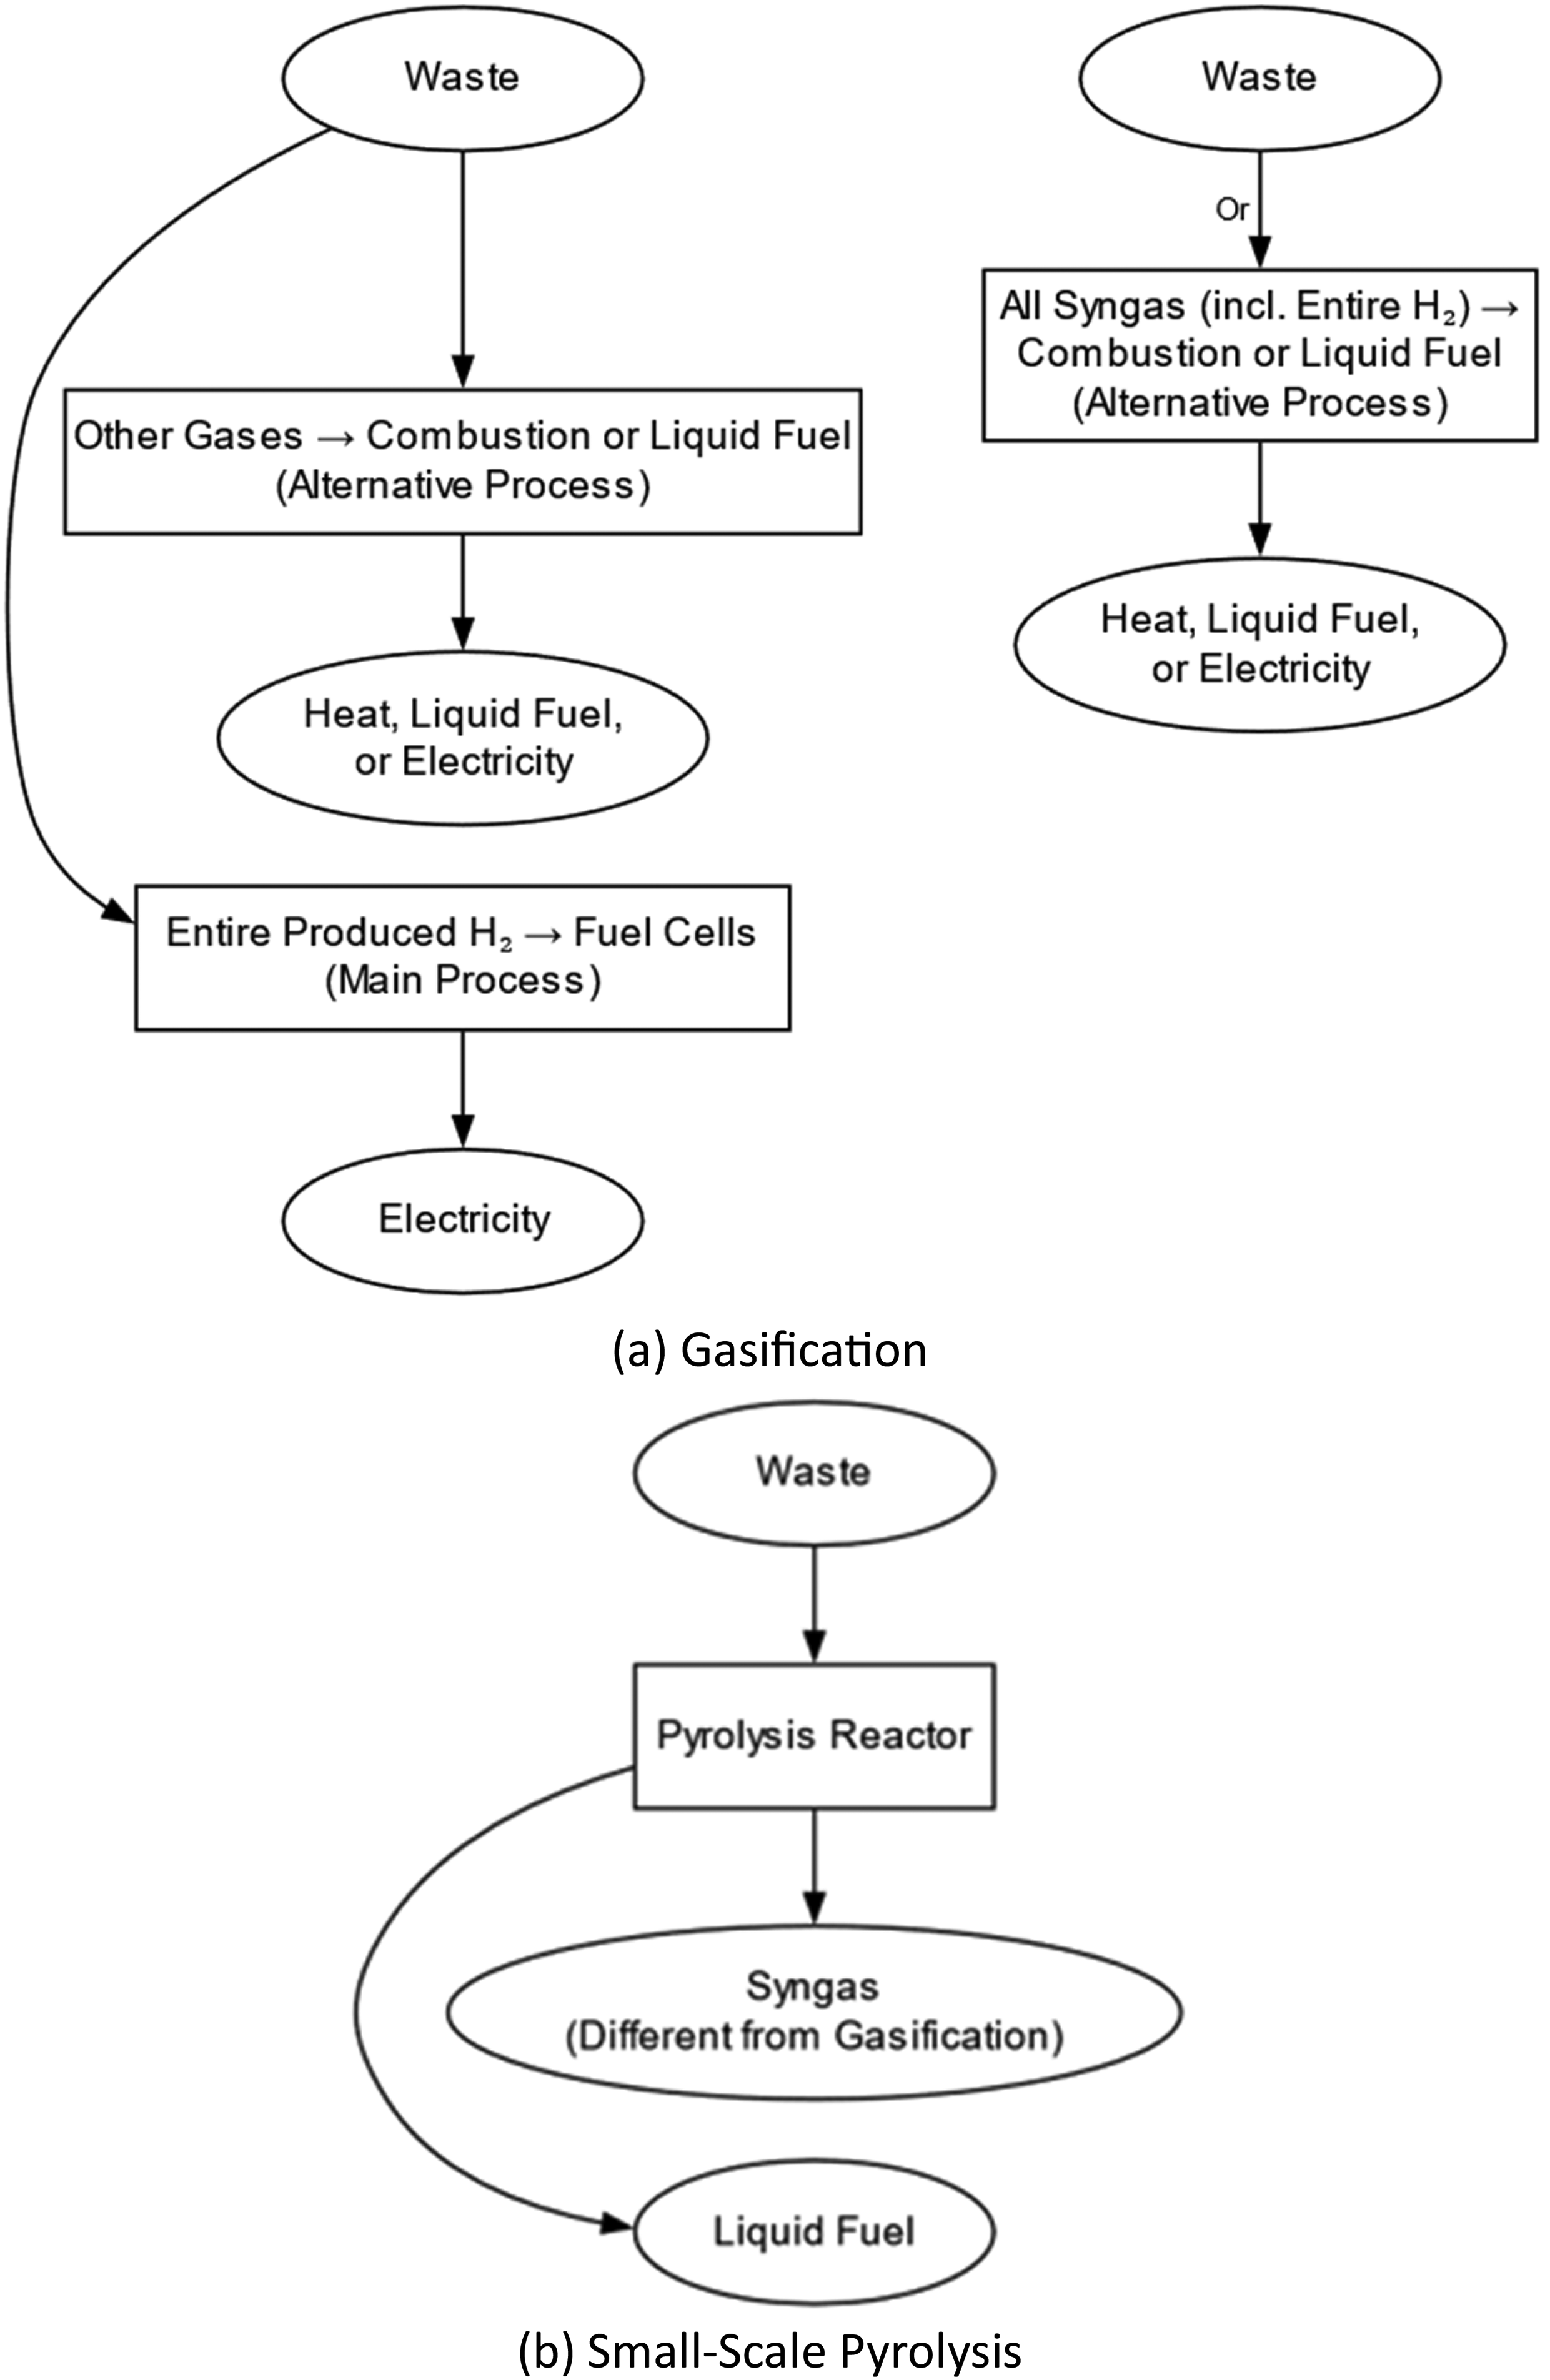
Schematic representation of facilities and processes in the observed waste-to-energy system: (a) Gasification, (b) small-scale pyrolysis. In the gasification process, additional hydrogen may be supplied by an electrolyzer as part of an auxiliary system.
Main products in the facilities examined are:
Primary facility: Gas mixture from gasification, that is syngas, which is mainly composed of nitrogen N2, hydrogen H2, carbon monoxide CO, carbon dioxide CO2, and methane CH4, depends on the type of waste and gasification temperature. Secondary facility: Pyrolysis oil (liquid fuel) is the main product from pyrolysis.
The gasification facility (primary facility) includes a plasma torch, gasification reactor, and fuel cell unit for producing hydrogen in a main process (e.g. Aziz et al. 5 review thermochemical and biological routes for converting biomass and organic waste to hydrogen, highlighting recent progress, key technologies, and challenges for advancing a sustainable hydrogen economy), with auxiliary process for producing hydrogen in an electrolyzer. Combustion for heating (or conventional electricity generation via a turbine), or the production of liquid fuel, is used as an alternative process. 6 This alternative process operates only when the fuel cells in the main process are turned off, or in parallel with other available gases – mainly methane and carbon monoxide, in addition to hydrogen. The entire amount of produced hydrogen is used either in the main process or in the alternative process. Other non-combustible gases are envisaged for the possible production of liquid fuel after chemical treatment. Small pyrolysis is a separate facility (secondary facility).
Literature overview
Synthetic gases had been frequently used before the Second World War, but were later substituted with natural gas due to environmental issues. These issues have since been overcome by using cleaner technologies and by substituting the type of alternative fuel (raw material for both examined facilities), that is to switch from coal to communal waste. For example, dos Santos et al. 7 find that a natural gas-based hydrogen industry with CO2 capture can aid the energy transition but depends on oil prices and CO2 storage capacity. Thomas 8 shows that the manufactured gas industry transformed lighting and safety, expanded to energy and chemicals, and became the first integrated energy network before natural gas replaced it. Melaina 9 shows that the manufactured gas industry, once central to urban lighting and heating, illustrates how innovation, competition, and adaptability shaped energy networks, offering lessons for today's hydrogen infrastructure. Wehrer 10 reviews how legacy manufactured gas plant sites still threaten groundwater with toxic organic and inorganic contaminants, highlighting knowledge gaps in pollutant behaviour and the need for improved risk assessment and remediation. Hamper 11 reviews the history of US-manufactured gas plants, their decline with the rise of natural gas and electricity, and details how different production processes generated distinct gases and residuals, knowledge essential for assessing former plant sites. Albertazzi et al. 12 highlight biomass gasification as a renewable, CO2-neutral energy source and explore challenges in reforming high-sulfur and alkali-rich gas streams for liquid fuel production. Liebs 13 gives an overview about town gas), e.g. different carbon footprint is for hydrogen production from coal, from waste, from water, or from hydrocarbons. Maksimov et al. 14 analyze water use and carbon footprints in hydrogen production, showing that nearly half of the hydrogen from steam reforming originates from water with lower emissions, highlighting water and energy balances as key factors for sustainable hydrogen development. Also, pyrolysis was not always popular because it can form unwanted and toxic hydrocarbons if the process is not controlled with care. For example, Lyu et 15 al. show that biochars produced at higher pyrolysis temperatures (>400 °C) are less toxic and have lower dioxin-like potencies, making them more suitable as soil adsorbents, and Rutkowski and Lewin 16 show that thermal decomposition of certain plastics produces toxic gases, mainly carbon monoxide and hydrogen cyanide, with hazards comparable to other common polymers.
Syngas (gases from gasification or as byproduct of pyrolysis) is different compared to natural gas in which hydrocarbons and especially methane is dominant. Among others, Rahimpour et al. 17 give an extensive overview about syngas production, and Odel 18 overviews facts relating to the production and substitution of manufactured gas for natural gas). Hydrogen from syngas can be used for blending with natural gas as demonstrated in Erdener et al., 19 who examine the potential of blending hydrogen into natural gas grids, highlighting technical, safety, and regulatory challenges while identifying research gaps for wider integration, and in Ozturk et al., 20 who show that blending hydrogen with natural gas improves combustion efficiency and reduces CO2 and CO emissions, though NOx trends fluctuate and some environmental impacts slightly increase. Composition of syngas from pyrolysis is very different from that of syngas from gasification.
This article is organized into two main parts, namely modelling and description of in-house developed software based on developed models which can be used for various testing. A data-driven digital model of waste gasification and pyrolysis includes machine learning methods.21–24 Ascher et al. 21 apply machine learning to model biomass and waste gasification, showing gradient boosting as most accurate and demonstrating that interpretability methods improve trust and insights for process design. Li et al. 22 use machine learning to model biomass gasification, showing gradient boosting predicts product yields accurately and identifies optimal feed and temperature conditions for maximizing H2-rich syngas. Lee et al. develop an Artificial Neural Network-based model for steam methane reforming using extensive operational data, achieving high prediction accuracy and optimizing process conditions to reach 85.6% thermal efficiency. Chu et al. develop regression and neural network models to predict syngas characteristics in plasma gasification of municipal waste, showing key roles of input power, feedstock, and gas flow rates in determining efficiency and composition.
Waste is alternative fuel used instead of fossil fuels, while hydrogen is used here as energy source as a predominant alternative for fossil fuels as presented in Kaheel et al., 25 who review the hydrogen energy landscape, identifying technical, policy, logistical, and infrastructure challenges affecting production, distribution, and deployment of hydrogen energy, and underscores the importance of public–private partnerships, regulation, and strategic planning to accelerate blue and green hydrogen adoption globally.
Waste-to-Energy experimental facilities – models of the system
Gasification and pyrolysis are two complementary thermochemical conversion routes for valorizing waste and low-rank fuels. Gasification, particularly in co-gasification setups, has shown strong potential to address global waste challenges while enhancing hydrogen-rich syngas production and process efficiency. 26 Plastic waste, for example, is increasingly recognized as an energy resource, with co-gasification improving gas yield, cold gas efficiency, and fuel quality compared to single-feed processes. 27 Similarly, blending low-rank coals with refuse-derived fuels has been demonstrated as a feasible strategy to produce hydrogen-rich syngas and improve feedstock usability. 28 Pyrolysis, on the other hand, enables the thermal decomposition of plastics and biomass into liquid fuels, syngas, and char, thereby complementing gasification in integrated waste-to-energy and resource recovery systems.
The main difference between pyrolysis (a secondary facility) and gasification (a primary facility) is that pyrolysis takes place without access to oxygenators, while gasification takes place in presence of ambient air.
The temperature in both examined facilities is set
29
in order to:
maximize hydrogen production from syngas from gasification,
30
that is, from the primary facility for use in fuel cells (main process in the primary facility); alternatively, if fuel cells are out of order, the goal is to maximize the energy value of syngas for combustion and heating purposes (alternative process of the primary facility), maximize the production of liquid fuel (pyrolysis oil),31–33 which is the main optimization goal to achieve in pyrolysis, that is, in the secondary facility.
Gasification (primary facility) takes place in a reactor with a temperature ranging from 750 to 1100 °C, while pyrolysis from 300 to 800 °C.
Gasification facility – primary facility of the observed waste-to-energy system
The gasification is the primary facility in the examined waste-to-energy system, with a diagram given in Figure 2.

Syngas production and utilization in the gasification facility as the primary waste-to-energy unit. Bold green boxes and bold text denote the main process involving hydrogen-to-electricity conversion in fuel cells.
Air is used as the gasification medium in the gasification facility. Fuel (alternative fuel) for the system is waste, mostly municipal waste, which consists mainly of organic materials (biomass or combustibles from communal garbage and industry). It is used to produce synthetic gas – syngas. The main process within the facility goes through a hydrogen separator and tank 34 and fuel cells to produce electricity from hydrogen. It is connected to a battery, electric grid with integrated photovoltaic and wind turbine. 35 An electrolyzer which can produce hydrogen from water through electrolysis, is also part of the system as a support to the main process as an auxiliary process. In addition, a combustion unit (with an envisaged alternative to produce liquid fuel through Fischer–Tropsch synthesis) is added to the gasification system as an alternative process, which operates only when the main process is turned off (i.e. when fuel cells are turned off), and vice versa. For the moment, the entire amount of hydrogen produced goes entirely or in the main process or in alternative process. Alternatively, combustion as a variant of the alternative process can work without hydrogen only with methane and carbon monoxide in parallel with the main process. Combustion can be replaced with the production of liquid fuel where non-combustible compounds of syngas possibly can be used.
Gasification is characterized by the following parameters: Fuel cells with the installed capacity of 40 kW (with 5 stacks of 8 kW), an electrolyzer 14 kW, battery with capacity of 500 kWh with an inverter of 250 kVA, connections to photovoltaic with the capacity of up to 170 kW, and wind power up to 10 kW. Waste is used as an alternative fuel with an input of 60–80 kg/h with calorific values of 21.1 and 27.12 MJ/kg where the energy required for the separation of H2 from syngas is missing, for example, biomass). 36 The energy required for compression from 1 to 200 bars at a flow rate of 0.39 kg/h is about 11.98 kWh if the efficiency of the compressor is 50%.
The input/output relations within the processes of the gasification facility are identified in Table 1.
Process input–output relations in the primary gasification facility.

bold letters signify/indicate the main process within the gasification facility.
when the main process operates, then the alternative process does not operate and vice versa; while combustion can alternatively work in parallel with methane and carbon monoxide.
only because the available raw parameters these values of temperature are expressed in different units: T[K] vs. t [°C].
Grid, battery, photovoltaics, and wind turbine.
The components of the gasification facility, such as Alternative fuel, Gasification reactor, Plasma torch, Hydrogen separation and tank, Fuel cells, Electrolyzer, Combustion or production of liquid fuel, Photovoltaics, and wind turbine, will be explored in more detail in the following text.
Input of waste for gasification is estimated to 20 kg/h, which can give around 17.6–18.33 normal m3 of syngas (or for 100 kg of waste it can give around 88 normal cubic metres of syngas; initially about 150 normal m3 of syngas were estimated for 100 kg of waste production; however, it was extremely ambitious, knowing that mass of waste plus reactants from ambient air need to be equal to the mass of the produced syngas) while further details are given in Table 2.
Waste-to-energy conversion estimates in the gasification facility for an amount of 20 kg of waste at the process temperature of 930 °C.

Volume of 1 mol of ideal gas is 0.0224 normal cubic metres at T = 273.15 K and p = 101325 Pa.
Based on Boyle's law (Boyle–Mariotte law), Charles’ law, and Gay-Lussac's law, pV = nRT, where p is pressure in Pa, V is volume in cubic metres, n is number of mol, T is temperature in K, and the universal gas constant is R = 8.3144598 m3 Pa/(mol K). The following can be concluded, as given in Table 3.
Amount of produced gas for various process parameters in gasification facility.

first three columns are repeated from above.
Alternative fuel
Fuel for gasification and pyrolysis should be communal waste or combustible residuals from industry and biomass (Figure 3). The waste is mechanically preprepared before being sent to the gasification reactor.
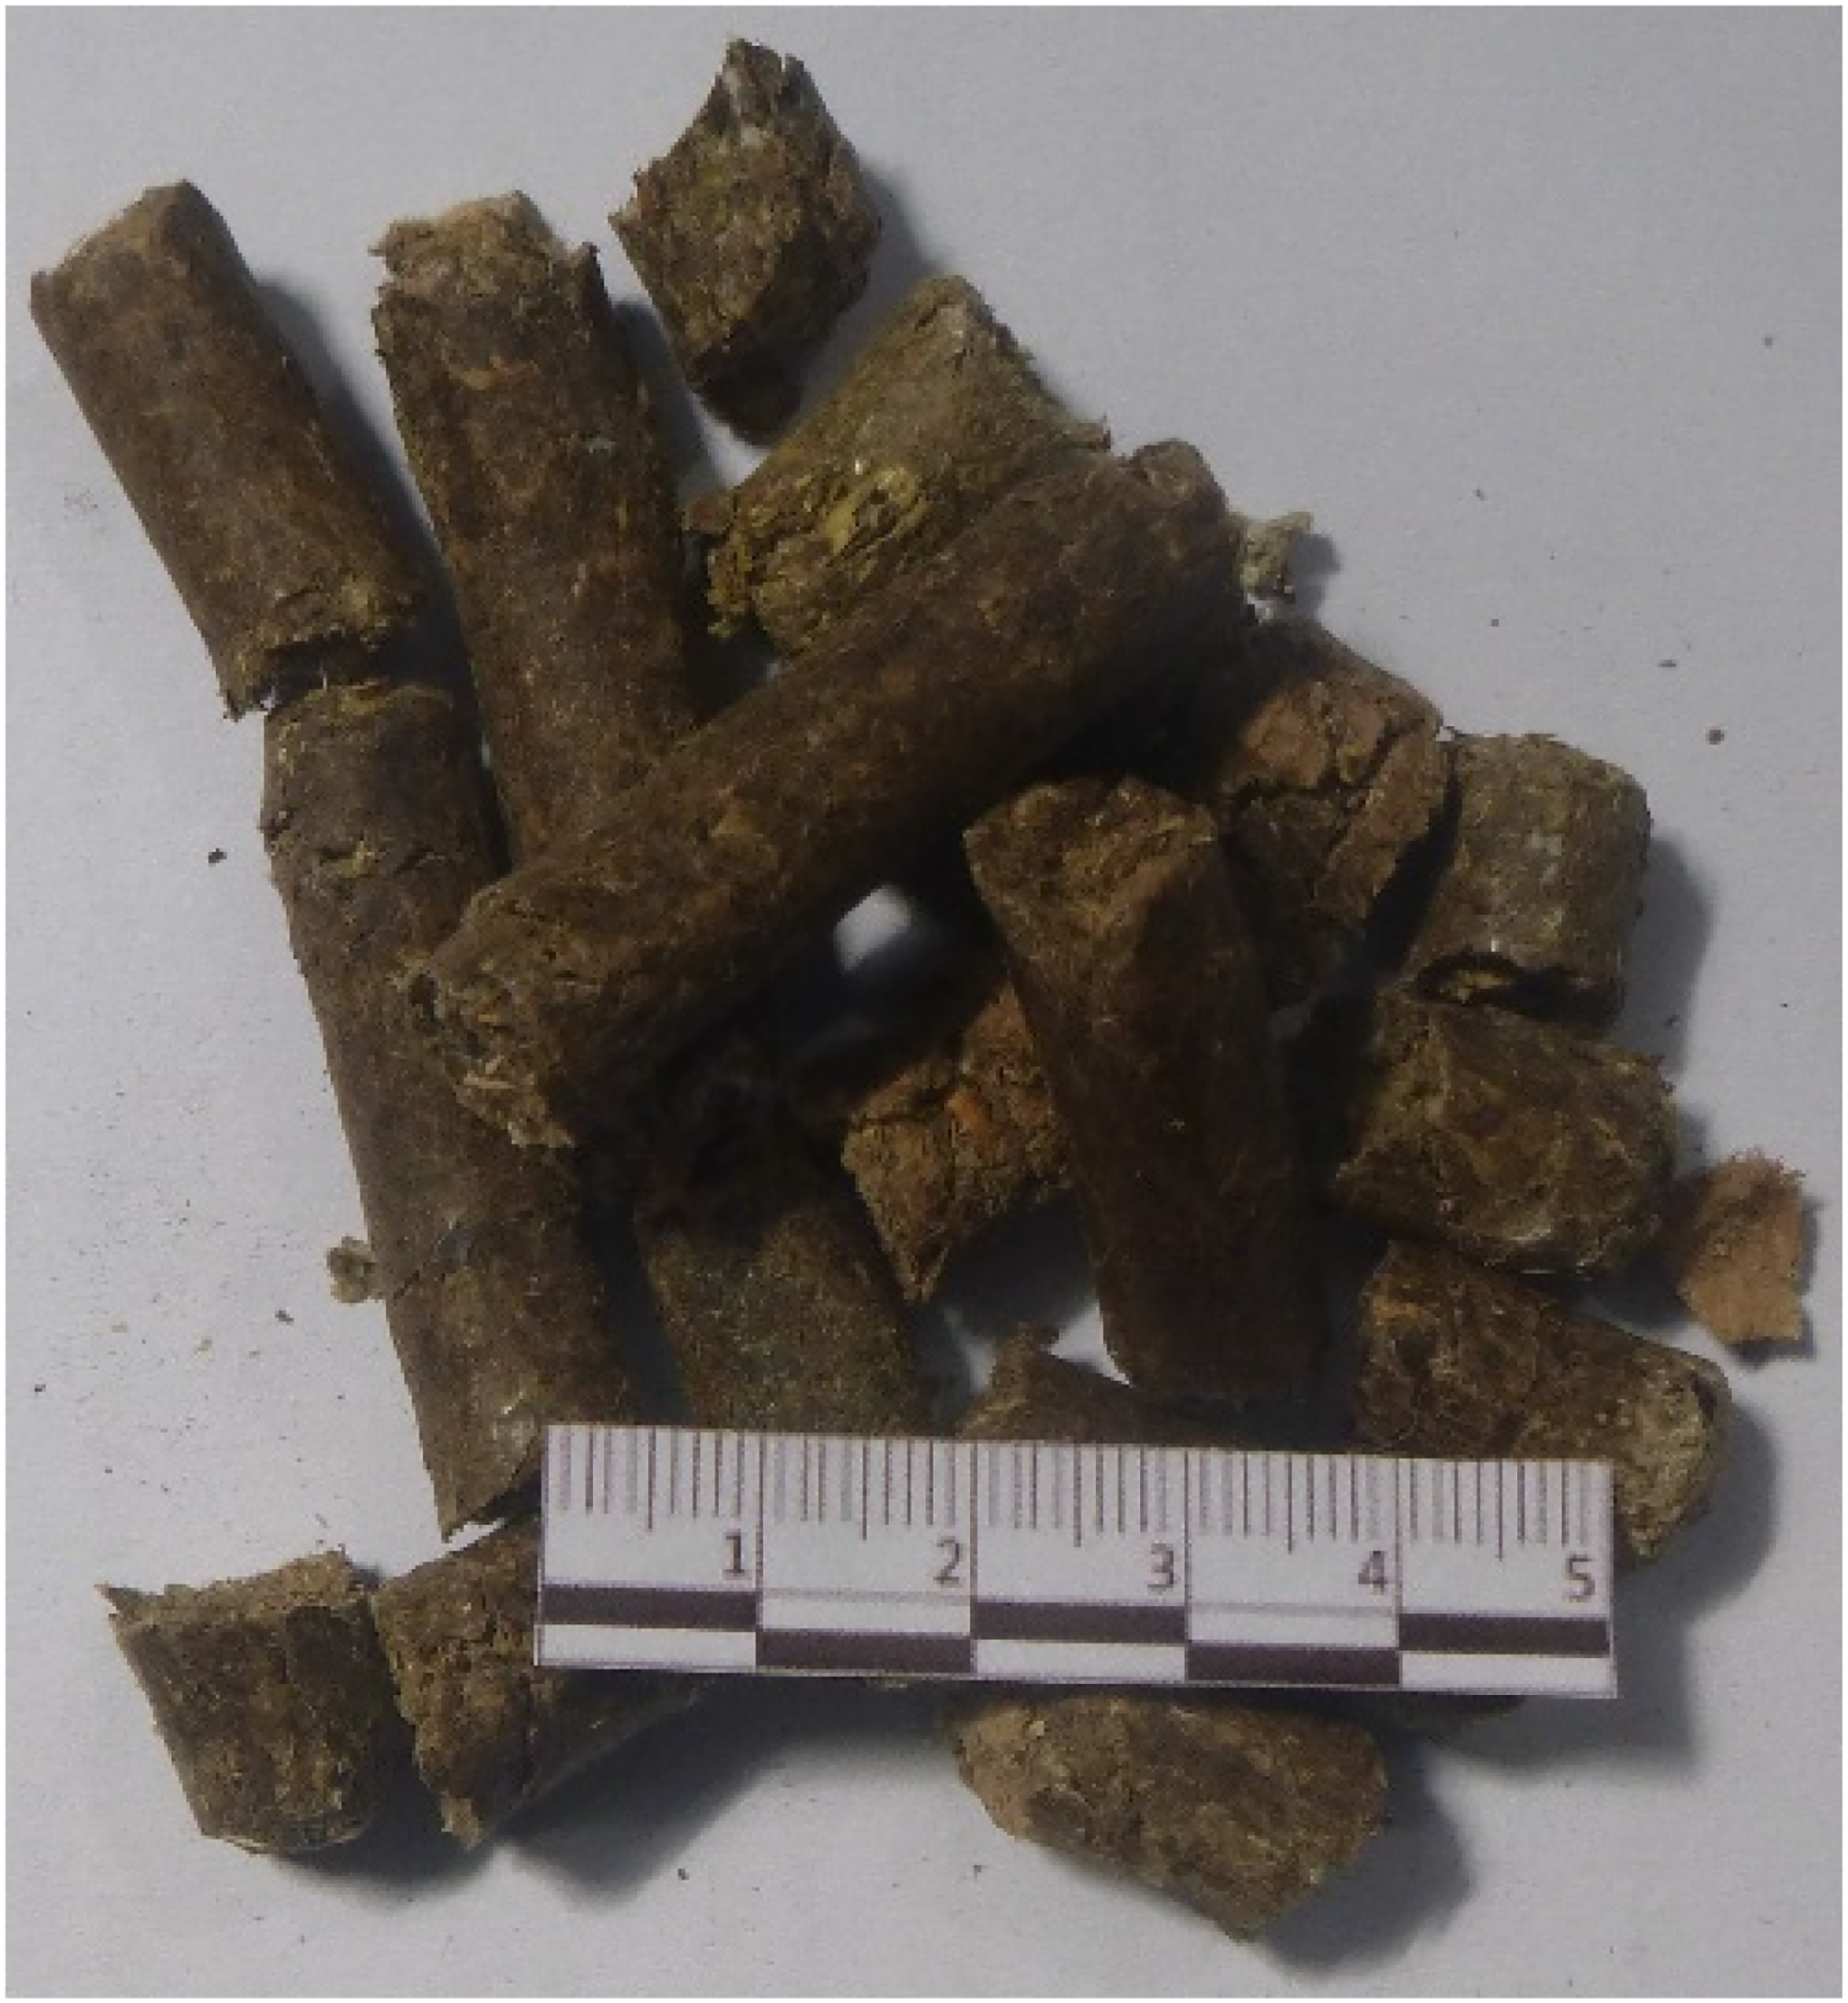
Prepared waste serving as an alternative fuel for gasification.
Plasma torch
A plasma torch enables gasification of municipal waste in the gasifier reactor.
37
A plasma torch is a device for generating a stream of plasma with an appropriate temperature.
38
In this case, the middle plasma torch temperature T [K], which depends on the required power of plasma torch P [kW], the base constant of nozzle k [dimensionless], and the filling pressure fp [bar], is given in Equation (1):
The plasma torch from this study provides low-temperature plasma with a middle plasma torch temperature T ranging from min. 1295.3 to max. 19750.0 K based on real physical experiments.39–42 Equation (1), based on symbolic regression, 39 gives very accurate predictions only in this range, where it is well correlated with experimental data with the relative error that remains below 0.283‰ (0.0283%). 43
Gasification reactor – amount and composition of syngas based on temperature
Gasification is performed in a reactor in the presence of air while heat is provided by the low-temperature plasma torch. In the model, the composition of syngas depends on the temperature in the gas reactor from Equation (1) as given in Table 4. The gasification facility with the reactor in its core is given in Figure 4.
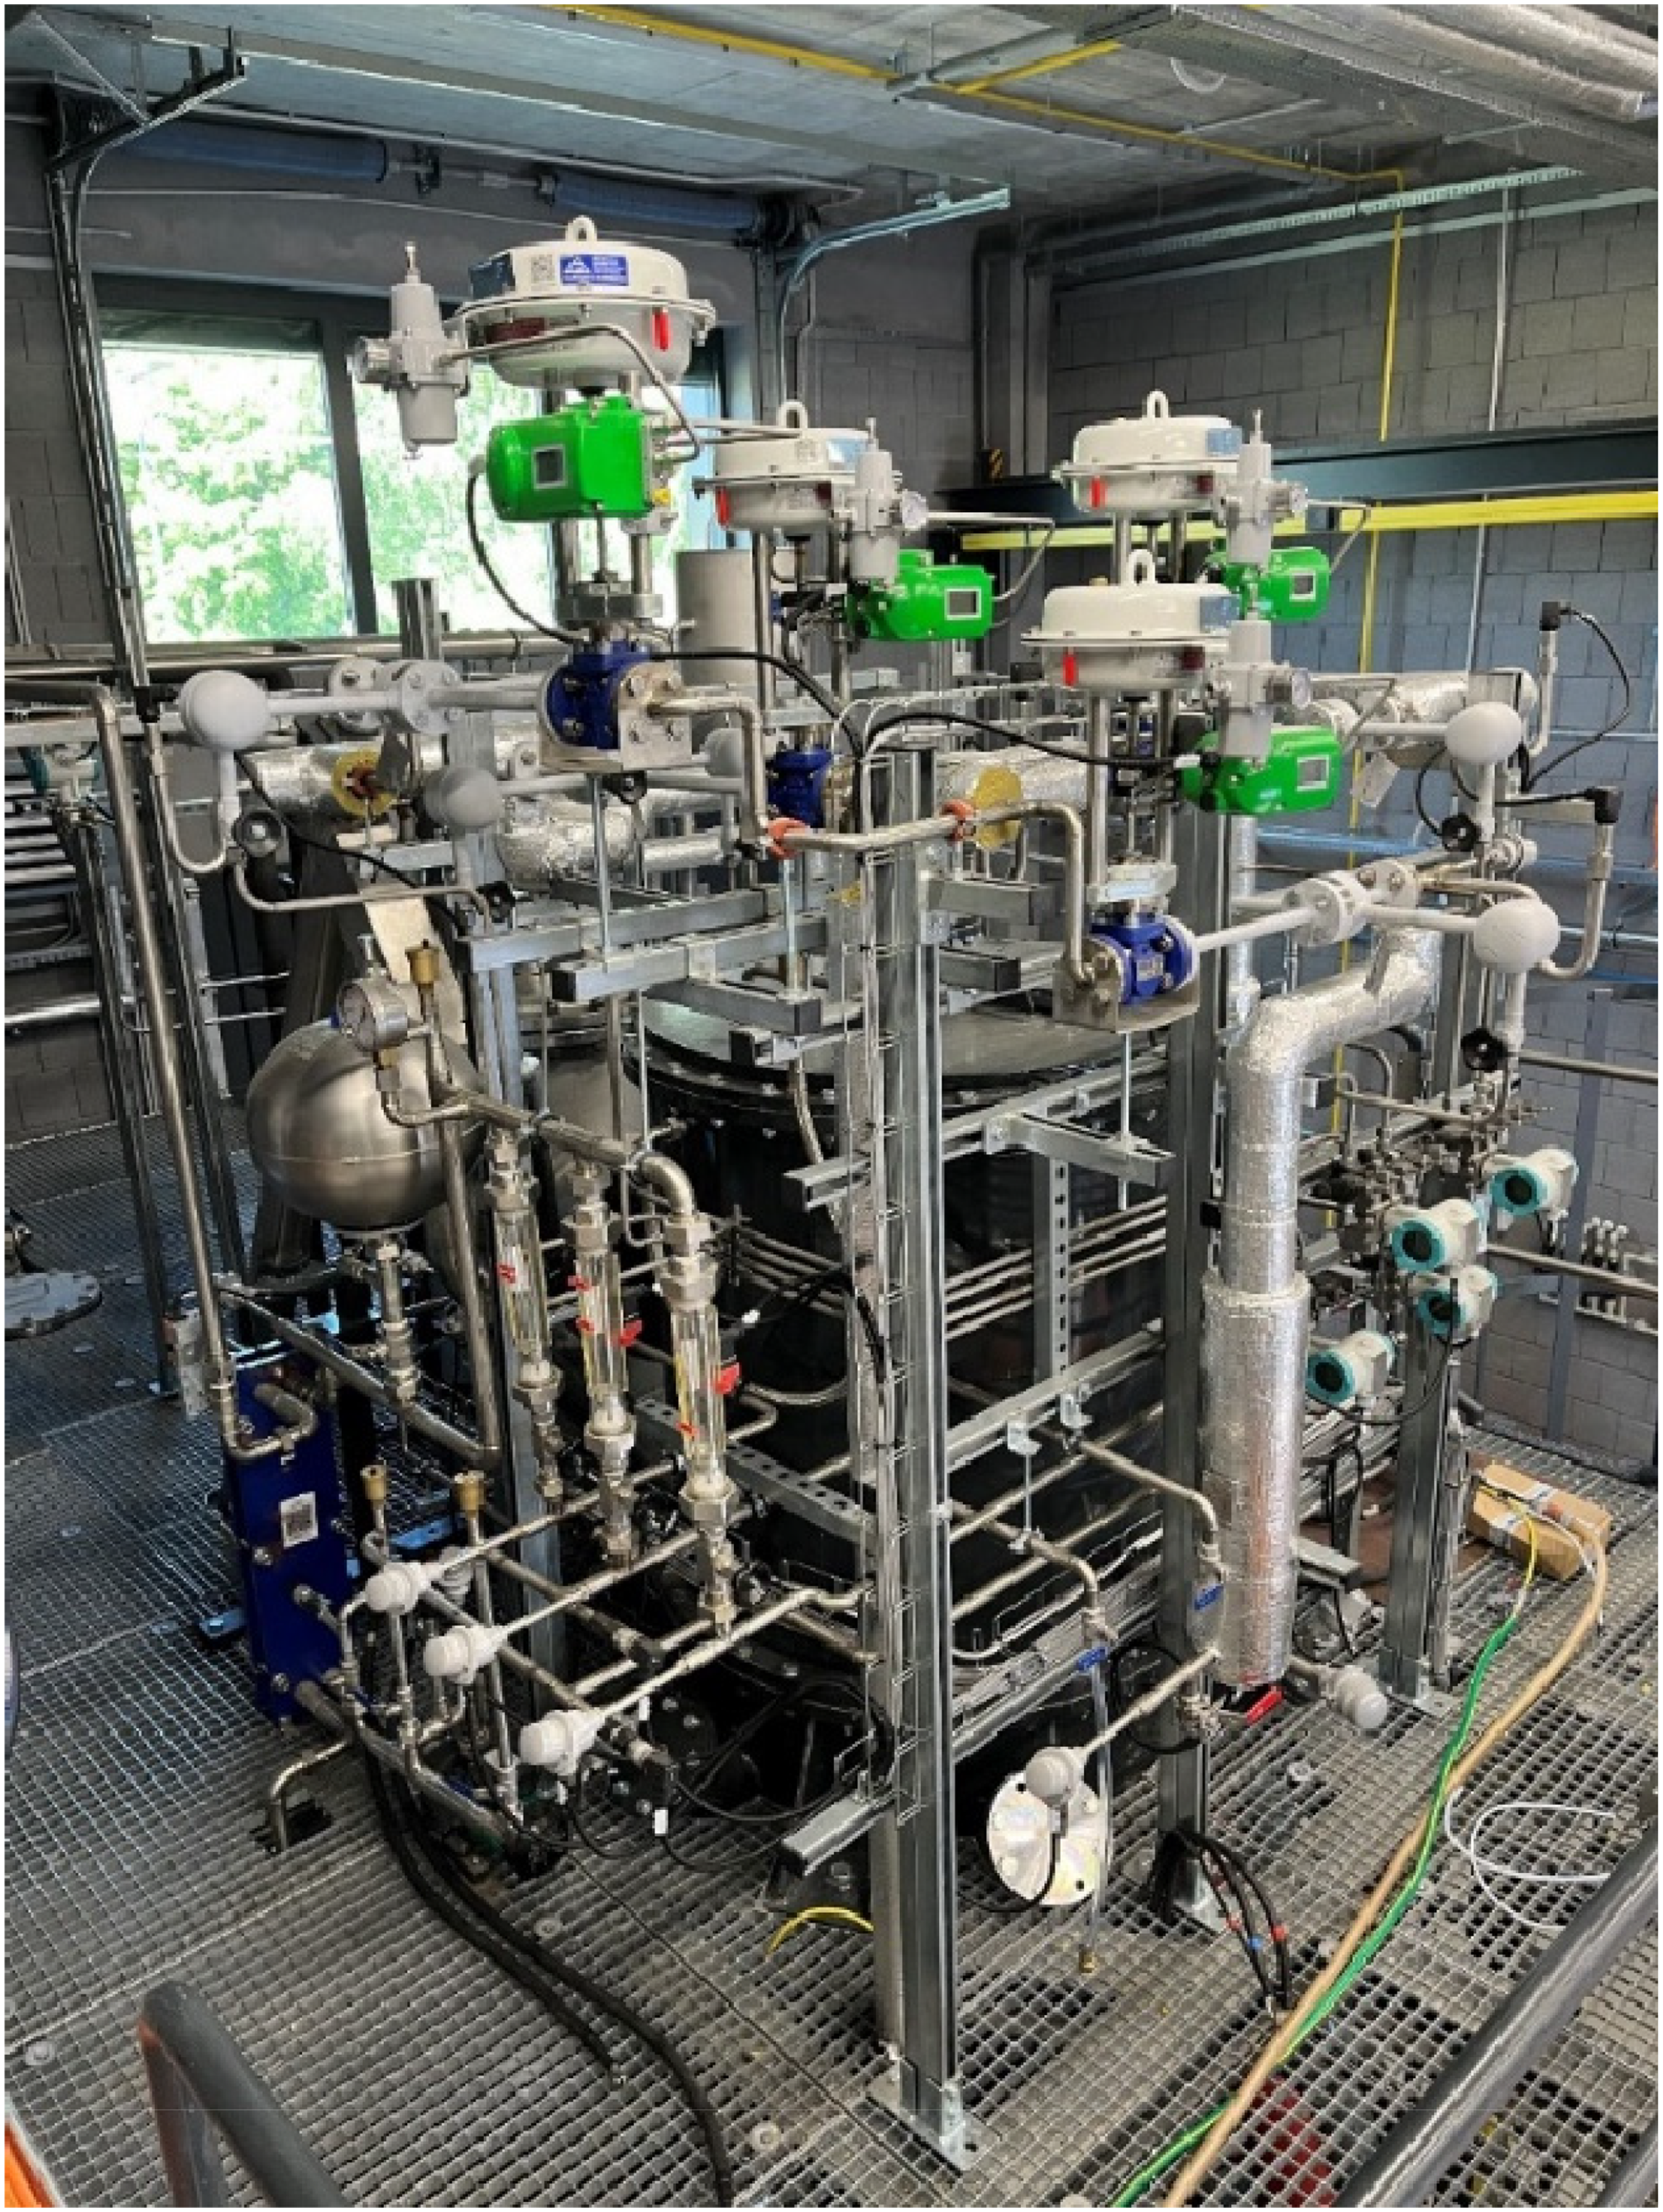
Gasification facility with the reactor at the core of the process.
Syngas composition dependence on temperature.
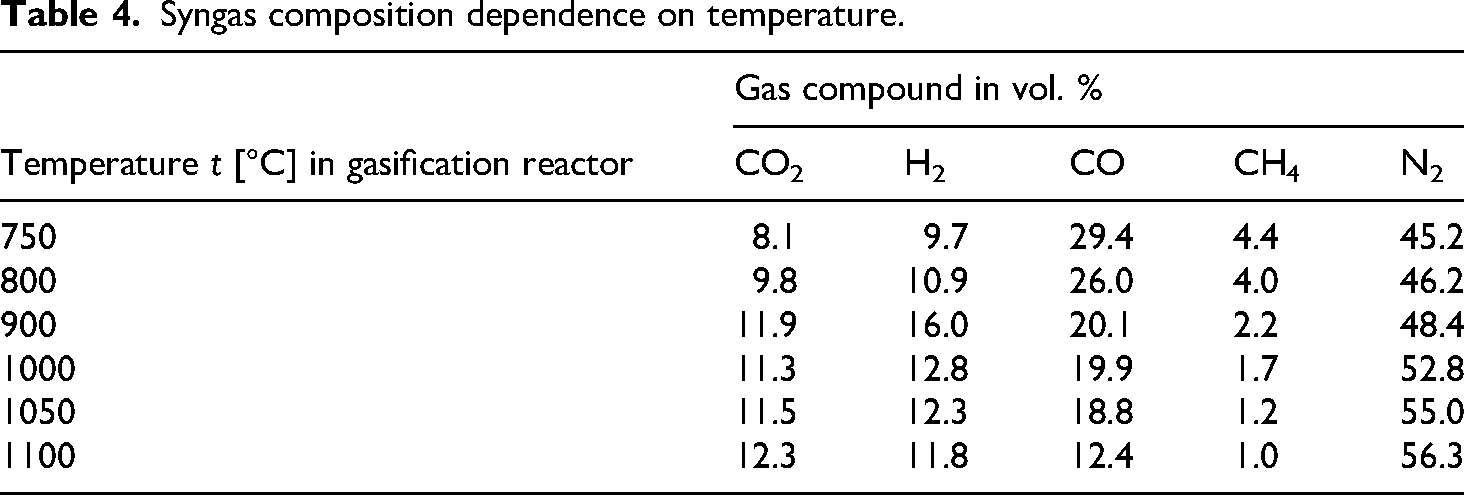
Waste gasification is performed in a reactor with temperature t ranging from 750 to 1100 °C in the presence of air that is used as the gasification medium. The plasma torch, which is used for this study, provides plasma with a middle plasma torch temperature T ranging from min. 1295 to max. 19750 K based on real physical experiments which further should be reduced to the required temperature prescribed for the gasification reactor as given in Equation (2):
The composition of syngas depends mostly on the temperature in the gasification reactor, oxidation medium, and the composition of waste, while the most desired component is hydrogen because the main purpose of the facility is to produce electrical energy from hydrogen in fuel cells. The desired components of syngas are also methane and carbon monoxide, which can be further used for direct combustion (for heating or for the production of electricity) or for the production of liquid fuels through Fisher–Tropsch synthesis.45,46 Carbon dioxide can also be used for carbon production. 47
Gasification is simulated using two types of regression, symbolic and polynomial (based on a similar analysis as in Praks et al., 48 polynomial formulations can be recommended for use in this case) Extended analysis is given in Appendix A. Symbolic regression is a technique based on artificial intelligence with the ability to explore appropriate mathematical expressions for identifying the best-fit models for a given dataset. 49
Based on data from Table 4 and using regression, both symbolic and polynomial, continual functions of five gases with largest volumetric percentage in syngas in dependence of temperature t [°C] in the gasification reactor are established (these five gases give in sum around 100%).
Symbolic regression functions for gasification are developed using the open-source tools AI Feynman 50 – previously applied in gasification modelling 51 – and High-Performance Symbolic Regression in Python and Julia (PySR), 52 alongside polynomial expressions. The resulting formulas are presented in Table 5.
Regression relations between middle reactor temperature (t [°C]) and syngas compositiona.

polynomial models maintain the conservation of syngas volume better compared to symbolic models
The maximum production of hydrogen is around 900 °C in the reactor, while the temperature of the plasma torch is around T = 10887.2 K. The goal is to maximize the production of hydrogen for further use in fuel cells. It is discovered after entropy analysis through Occam's Razor 48 that the results obtained in the AI Feynman software from 51 are not stabile, that is these symbolic regression formulas show oscillatory behaviour between the points given in Table 4 as shown in Figure 5. In Figure 5(a), the red line presents expected behaviour, while in Figure 5(b), the green line presents oscillatory behaviour between the black dots. In both Figures 5(a) and 5(b), these black dots represent real data from Table 4.

Suitable formulas for volumetric percentages are given in Figures 6 and 7.
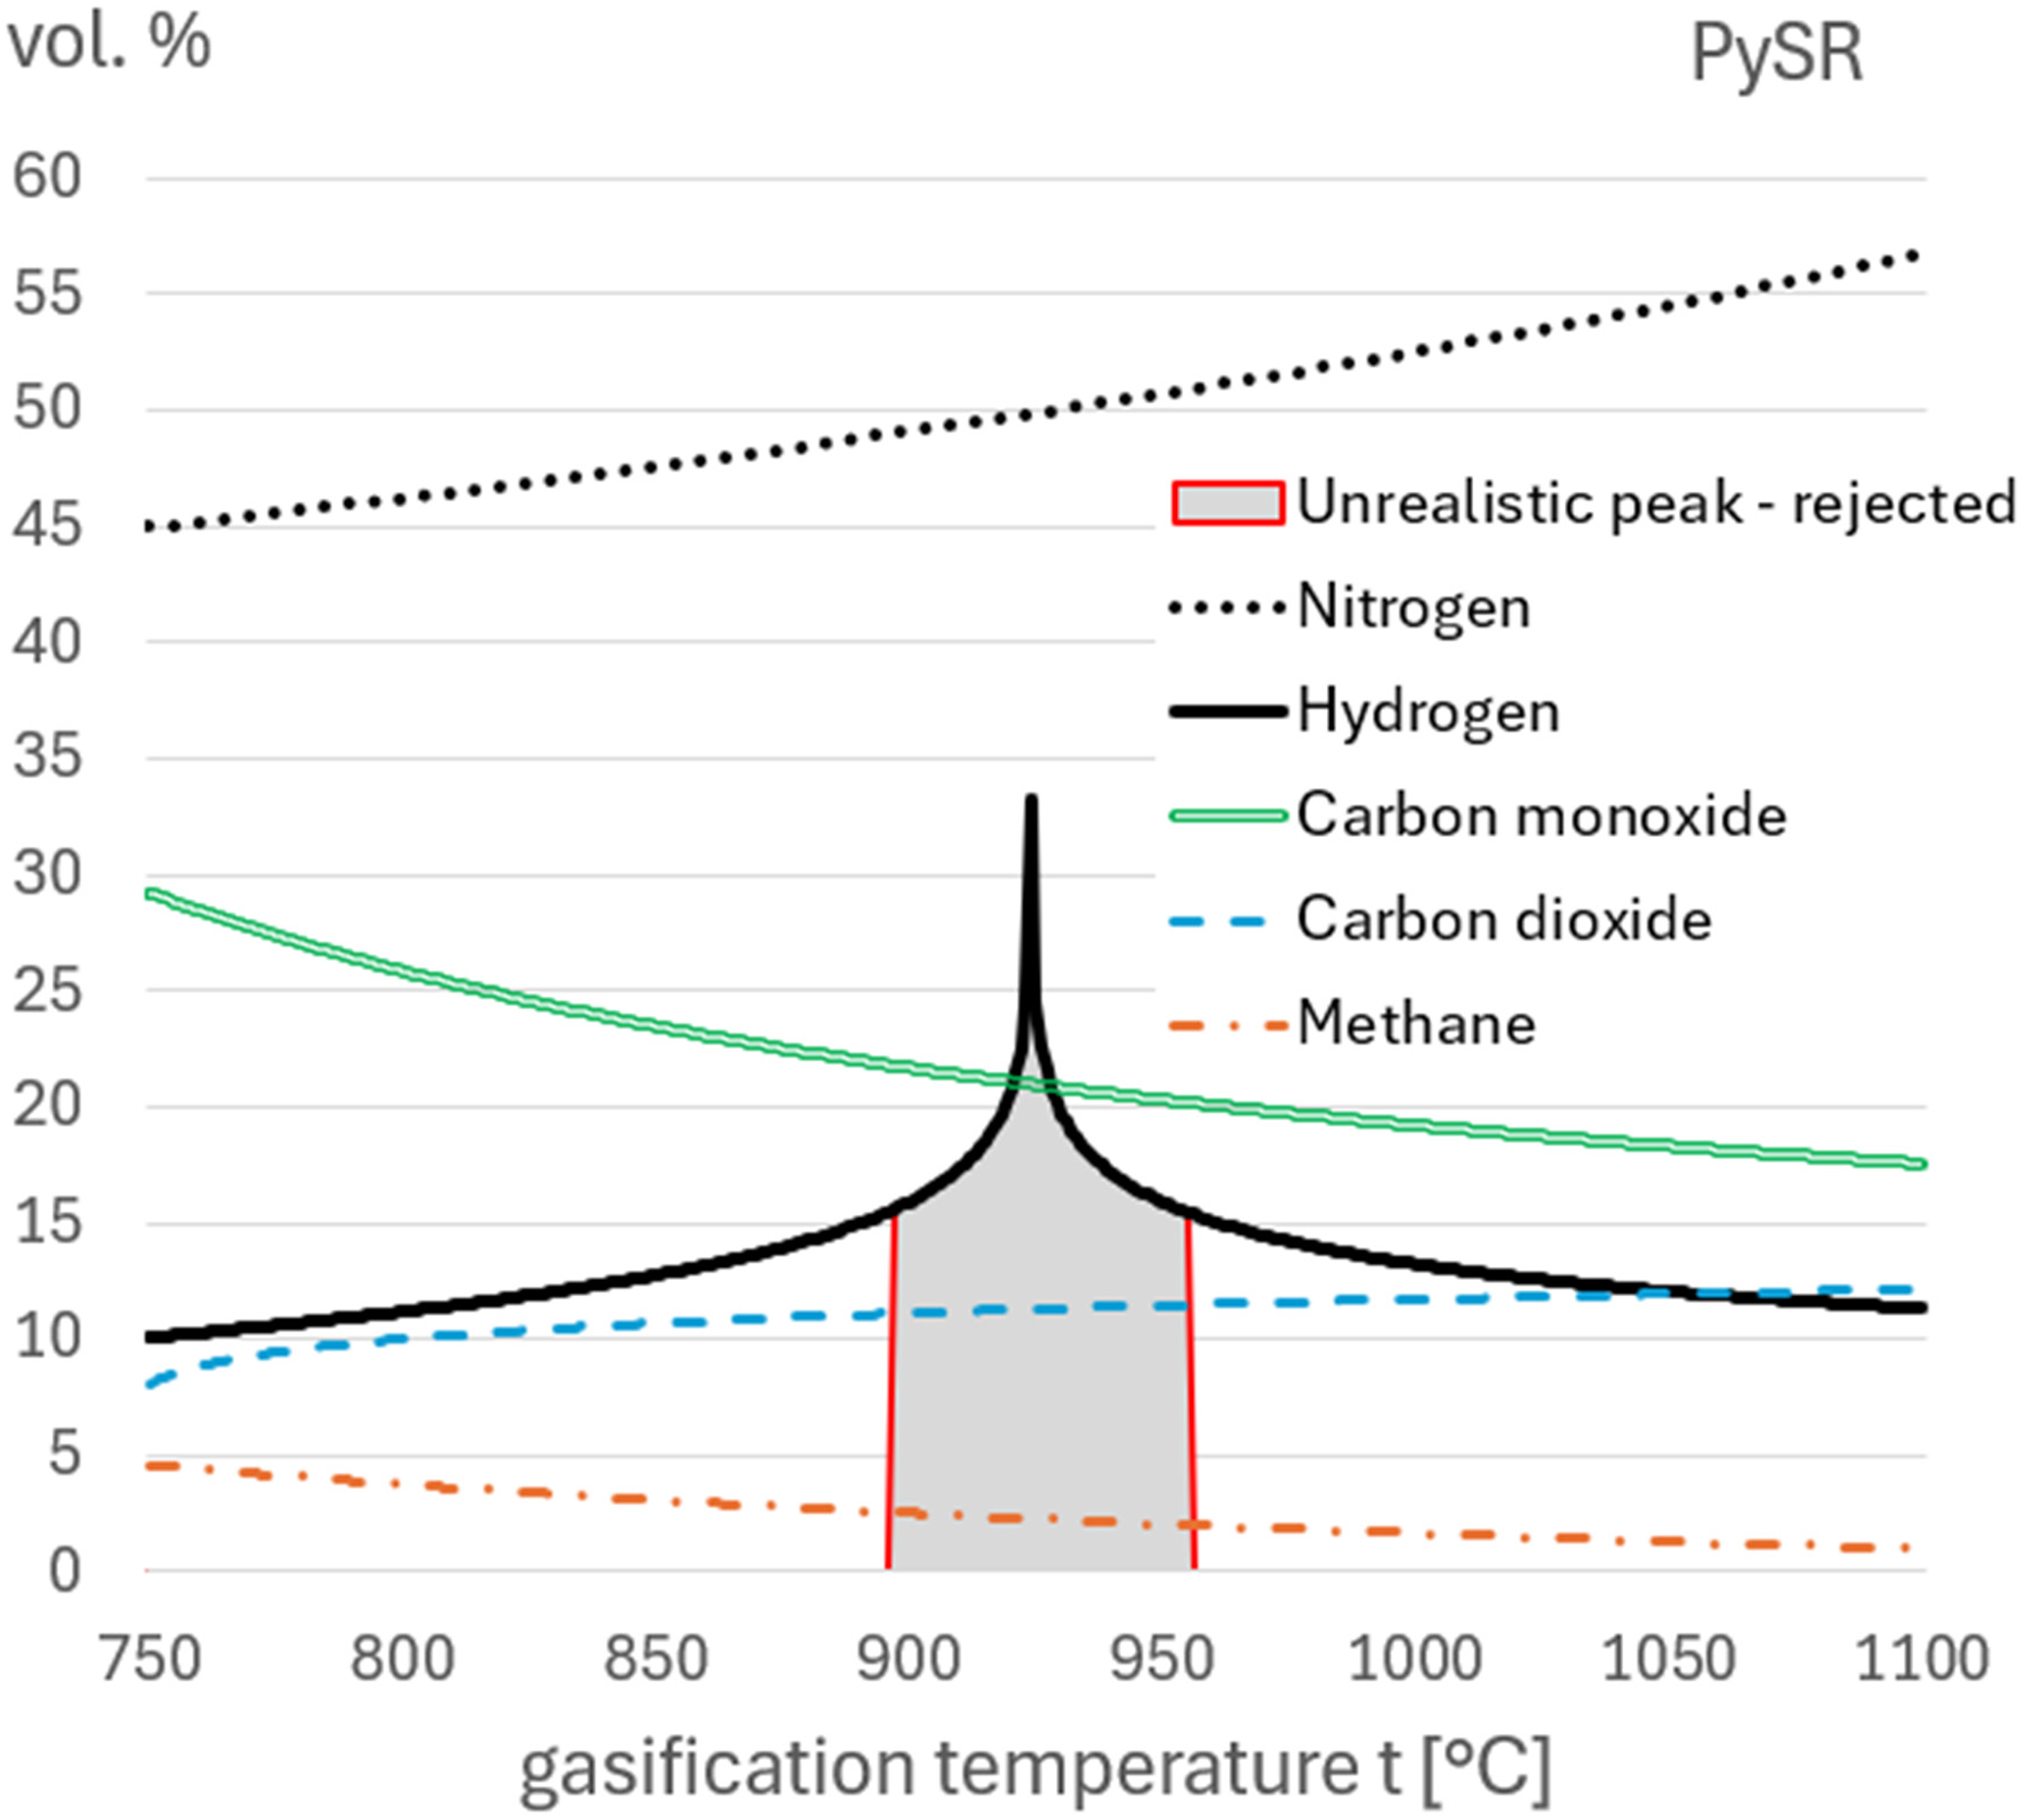
High-performance symbolic regression in Python and Julia (PySR)-derived symbolic regression models for hydrogen, carbon dioxide, carbon monoxide, methane, and nitrogen (table 5); volumetric percentage vs. gasification temperature t [°C].

Polynomial regression models for hydrogen, carbon dioxide, carbon monoxide, methane, and nitrogen (table 5); volumetric percentage vs. gasification temperature t [°C].
According to the symbolic regression models obtained in PySR, for t = 928 °C, an unrealistic peak for hydrogen occurs which is not confirmed in practice. An unreliable amount of hydrogen is predicted by PySR between 897 and 955 °C. However, this peak does not appear in polynomial regression models, where the sum of the entire amount of the produced syngas always remains below 100%, as can be seen in Figure 8. Therefore, polynomial models maintain the conservation of syngas volume better compared to symbolic models.

Sum of all syngas components: discrepancy >100% with high-performance symbolic regression in Python and Julia (PySR), while polynomial model yields a sum <100%; volumetric percentage vs. gasification temperature t [°C].
Models obtained in symbolic regression – PySR and polynomial regression can be combined with the exception hydrogen, for which only polynomial regression model should be used. In more detail:
Polynomial regression: For the middle temperature in the gasification reactor t ranging from 879 and 966 °C, the production of hydrogen is maximal with an amount larger than 15% and never reaches 16%. The absolute peak for the production of H2 is for t = 923 °C. For t = 923 °C, CO2 11.87%, CO 19.76%, CH4 2.11%, and N2 49.3%, which gives a total of 98.78% while the rest are other gases. Symbolic regression – PySR: A model for all components of syngas can be used except for hydrogen, for which polynomial regression formulation should be used instead.
Polynomial regression models perform better than symbolic regression models as confirmed by statistical and entropy analyses grounded in Occam's Razor.
48
Therefore, the polynomial regression approach will be further developed in more detail:
The recommended model for hydrogen H2 is a polynomial of degree 4, as given in Table 6. Its mean squared error is as low as 0.3.
Optimized polynomial formulations between middle reactor temperature (t [°C]) and the amount of produced hydrogen H2.

Figure 9 shows optimized models of volumetric percentage of H2 in dependence on temperature t [°C] in the gasification reactor obtained in polynomial regression.

Volumetric percentage of hydrogen in the gasification reactor: Polynomial regression models valid for 750–1100 °C; volumetric percentage vs. gasification temperature t [°C].
The recommended model for carbon dioxide CO2 is a polynomial of degree 4, as given in Table 7. Its mean squared error is as low as 0.4.
Optimized polynomial formulations between middle reactor temperature (t [°C]) and the amount of produced carbon dioxide CO2.

Figure 10 shows optimized models of volumetric percentage of CO2 in dependence on temperature t [°C] in the gasification reactor obtained in polynomial regression.

Volumetric percentage of CO2 in the gasification reactor: Polynomial regression models valid for 750–1100 °C; volumetric percentage vs. gasification temperature t [°C].
The recommended model for carbon monoxide CO is a polynomial of degree 4, as given in Table 8. Its mean squared error is as low as 0.21.
Optimized polynomial formulations between middle reactor temperature (t [°C]) and the amount of produced carbon monoxide (CO).

Figure 11 shows optimized models of volumetric percentage of CO in dependence on temperature t [°C] in the gasification reactor obtained in polynomial regression.

Volumetric percentage of CO in the gasification reactor: Polynomial regression models valid for 750–1100 °C; volumetric percentage vs. gasification temperature t [°C].
The recommended model for methane CH4 is a polynomial of degree 4, as given in Table 9. Its mean squared error is as low as 0.04.
Optimized polynomial formulations between middle reactor temperature (t [°C]) and the amount of produced methane CH4.

Figure 12 shows optimized models of volumetric percentage of CH4 in dependence on temperature t [°C] in the gasification reactor obtained in polynomial regression.

Volumetric percentage of CH4 in the gasification reactor: Polynomial regression models valid for 750–1100 °C; volumetric percentage vs. gasification temperature t [°C].
The recommended model for nitrogen N2 is a polynomial of degree 4, as given in Table 10. Its mean squared error is only 0.49.
Optimized polynomial formulations between middle reactor temperature (t [°C]) and the amount of produced nitrogen N2.
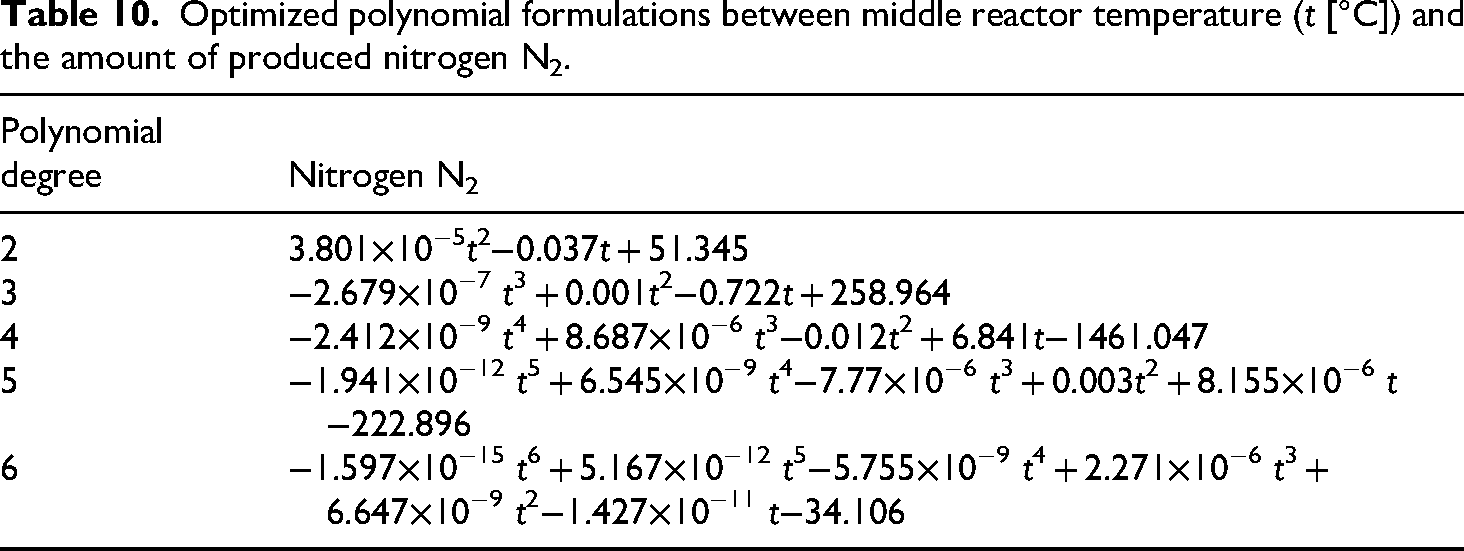
Figure 13 shows optimized models of volumetric percentage of N2 in dependence on temperature t [°C] in the gasification reactor obtained in polynomial regression.

Volumetric percentage of N2 in the gasification reactor: Polynomial regression models valid for 750–1100 °C; volumetric percentage vs. gasification temperature t [°C].
In summary, recommendations for the optimized models obtained in polynomial regression are presented after analyzing regression polynomials of degrees 2, 3, 4, 5, and 6 with respect to maximum absolute error, maximum relative (percentage) error, and mean squared error, as given in Table 11.

recommended for use.
Hydrogen separation
Separation of hydrogen is very important because fuel cells require very clean fuel.
The maximum production of hydrogen is achieved for different combinations of inputs for the plasma torch as given in Table 12. Different combinations of the input parameters can give the same output values.
Input combinations for the plasma torch optimized for maximum hydrogen production H2.

the base constant of nozzle k [no units] from 5 to 20, required power of plasma torch P [kW] from 5 to 15, and filling pressure [bar] from 3 to 8 Used unrealistic peak in symbolic regression is 22.5% vol. of hydrogen.
T [K] is the middle temperature of the plasma torch, while t [°C] is the temperature in the gasification reactor.
for waste input 20 kg/h (e.g. waste input 5 kg/h gives 4.4 m3/h of syngas).
The actual physical method used for separating hydrogen and its purification is not relevant for this evaluation.
Hydrogen tank
After separation and compression, the hydrogen is stored in bundles of high-pressure cylinders forming a hydrogen tank. The hydrogen tank attached to the gasification facility has volume of 2.2 m3, with pressure of 20 MPa (200 bar), and with the temperature in the tank of 298 K. In this tank with these parameters, n≈17758 mol can be placed inside, which means ∼ 35.52 kg of hydrogen. If the production of hydrogen is 0.39 kg/h, then around 92 h or around 3.84 days are needed to fill the tank. 53 This tank is shown in Figure 14; the white bottles are filled with hydrogen produced in the facility, while the red bottles are filled with pure hydrogen with certified cleanliness bought on the market for comparison with the produced one.
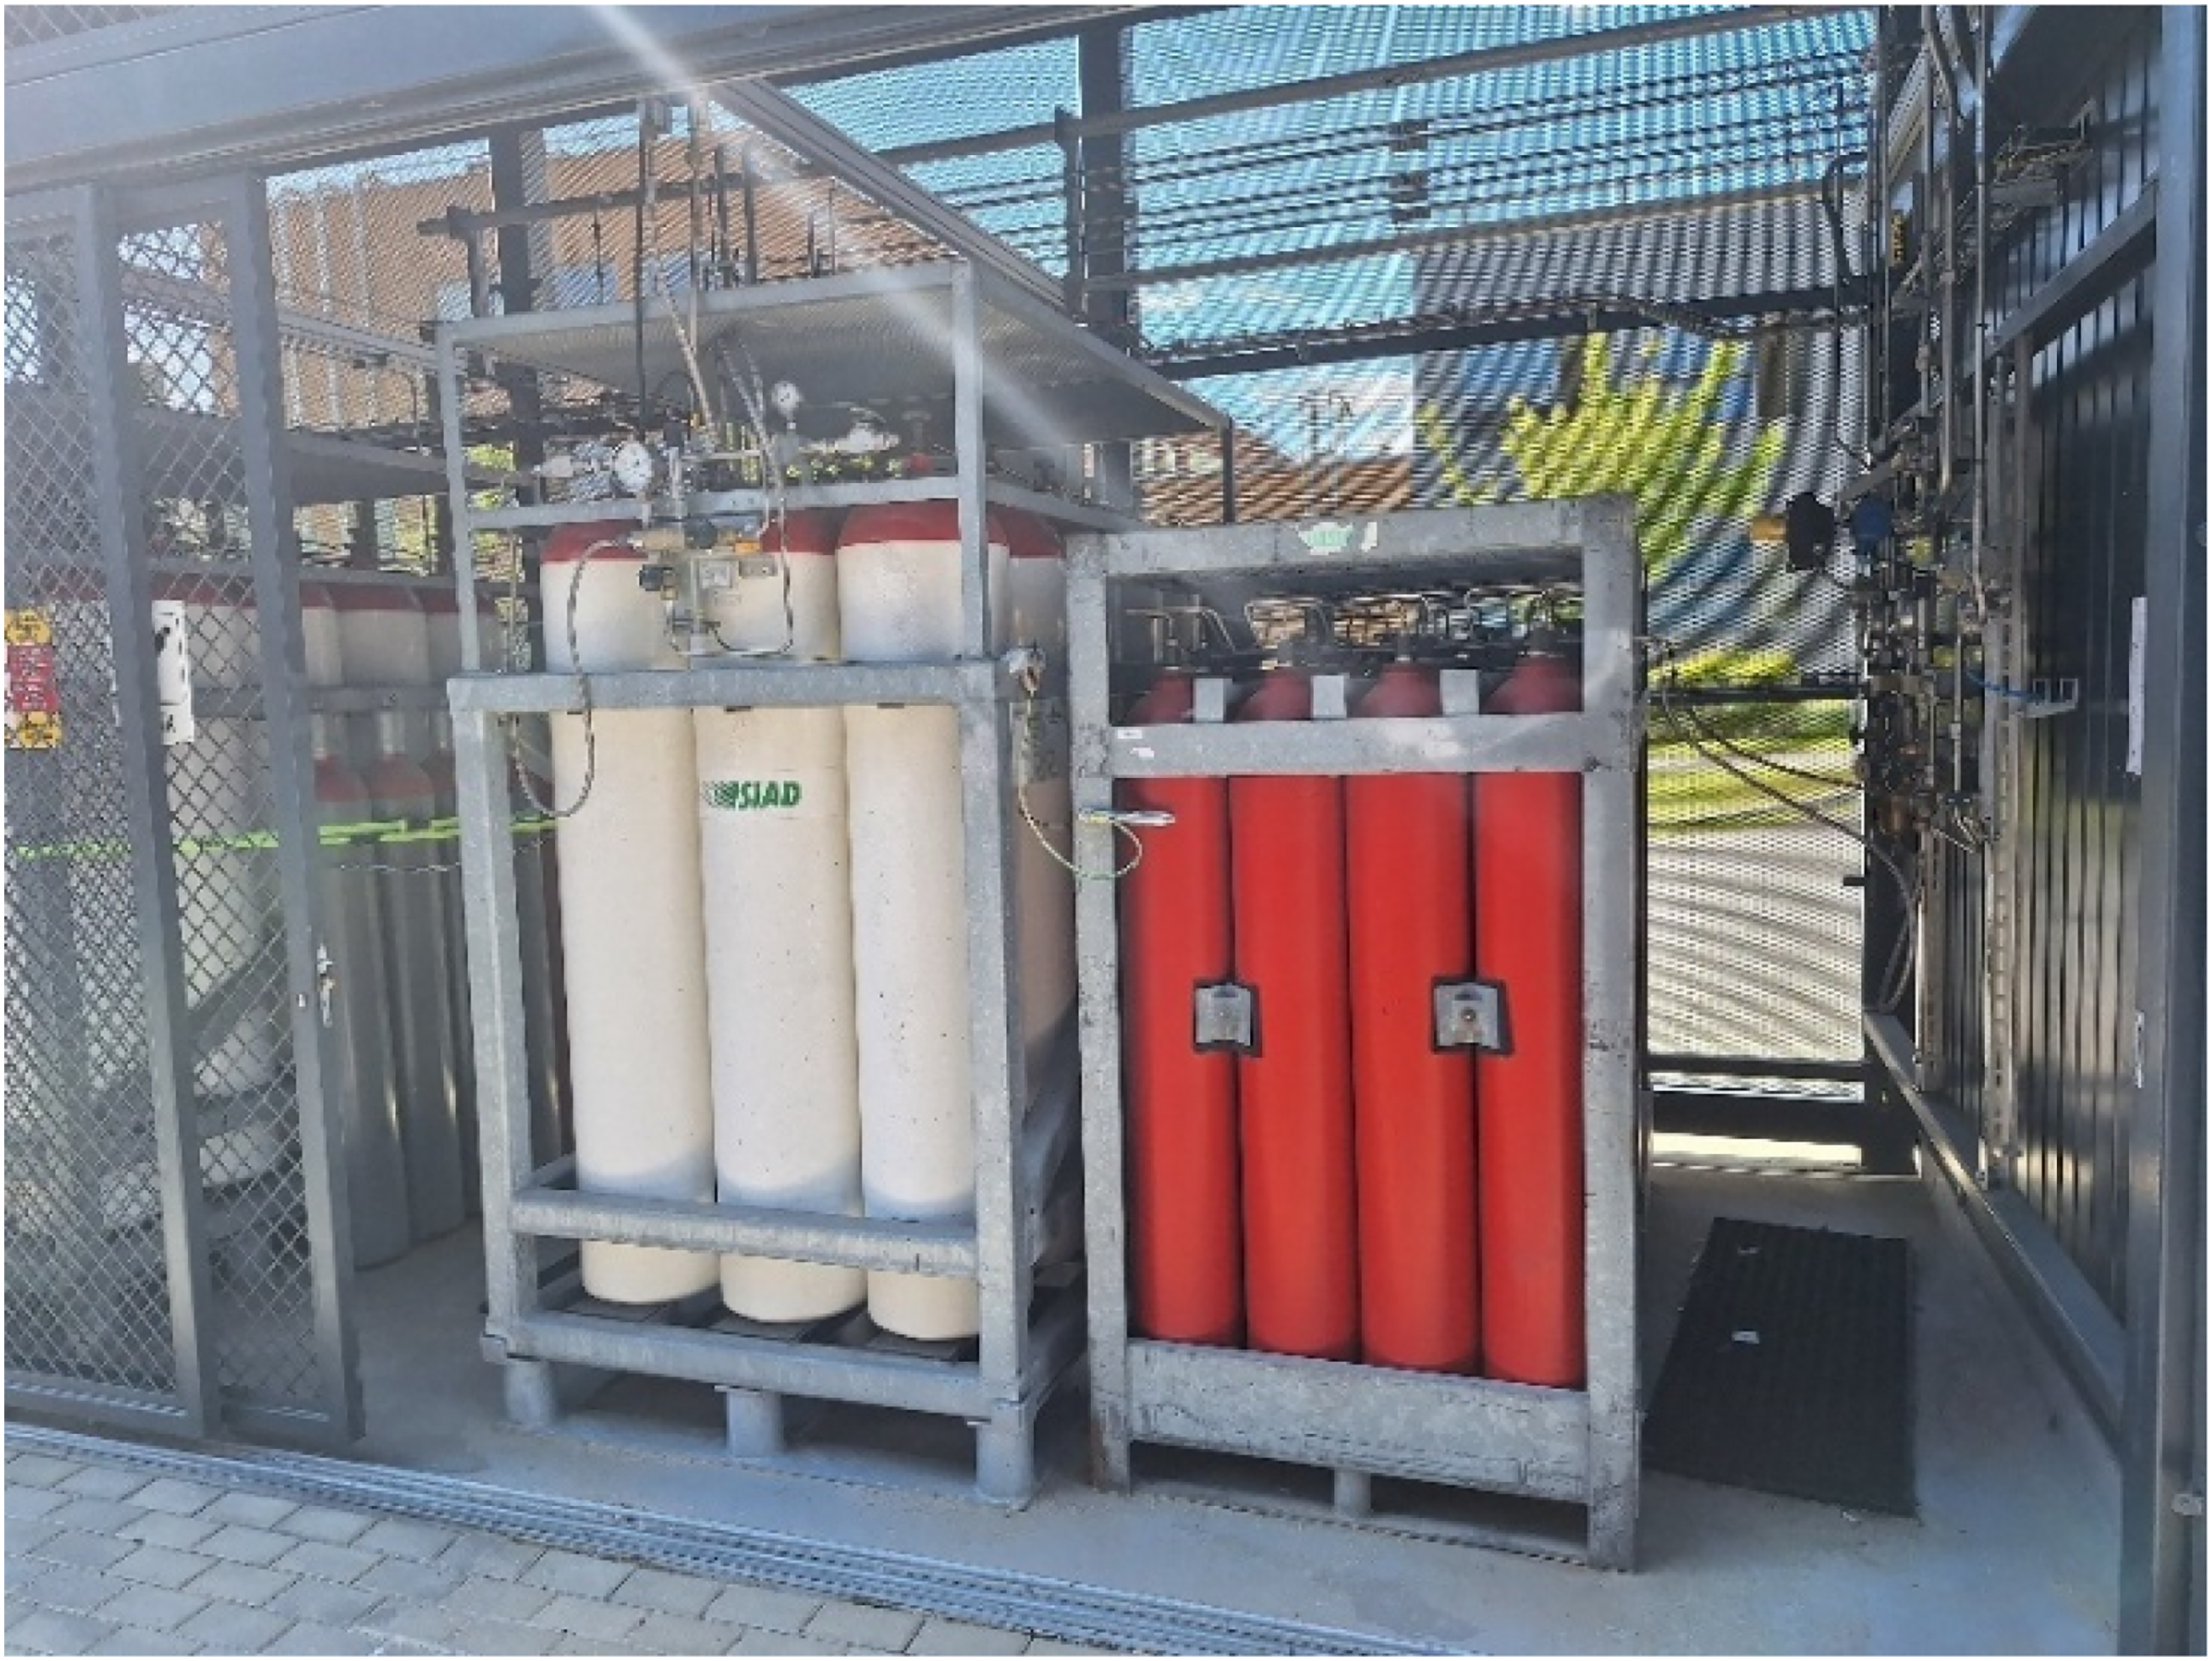
Hydrogen storage tanks installed in the gasification facility.
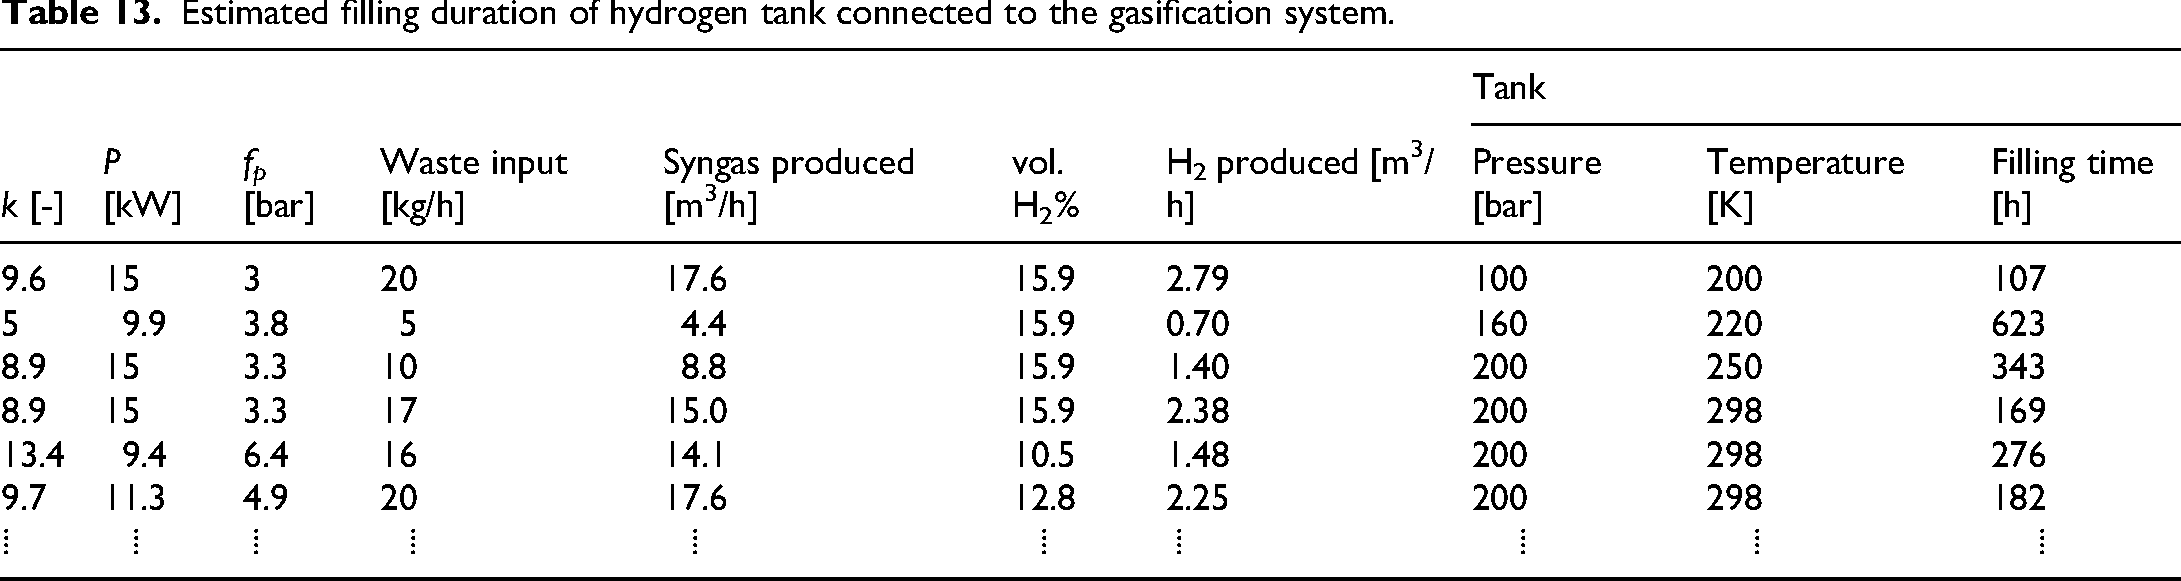
An example of the filling duration of a hydrogen tank is given in Table 13.
Estimated filling duration of hydrogen tank connected to the gasification system.
Fuel cells and electrolyzers
Fuel Cells
Fuel cells are electrochemical devices that convert the chemical energy of a fuel, typically hydrogen, directly into electricity through a reaction with oxygen (from ambient air), producing water and heat as byproducts. They are highly efficient and environmentally friendly, with applications ranging from powering vehicles to providing electricity for buildings and portable devices.
It is estimated that around 0.3 kg of hydrogen which can be produced per hour from the gasification facility can give around 10.2 kWh of electrical energy (lower heating value – LHV) or 12.2 kWh of electrical energy (higher heating value – HHV). These values are for 100% fuel cell efficiency. When used as part of a fuel cell, 1 kg of hydrogen can produce 33 kWh/kg of electrical energy (LHV) for high-temperature fuel cells if the product is steam, or 39.38 kWh/kg (HHV) for low-temperature fuel cells if the product is water in liquid phase. In a low-temperature fuel cell, where the product is liquid water, the HHV should be employed in efficiency calculations, while for high-temperature fuel cells, it may be permissible to use the LHV if the product steam is put to good use. 54 Efficiency (35%-60%): 3.57 kWh of electrical energy (LHV), 4.26 kWh of electrical energy (HHV) – Both in real conditions 55 (Table 3 of 55 gives also specific types of low- and high-temperature fuel cells and their efficiency).
The installed fuel cells are in 5 stacks of 8 kW and are connected directly to the electric grid.
The examples of work of fuel cells installed within the observed gasification facility are given in Table 14.
Operating inputs and outputs of the fuel cell unit.

In up to 5 stacks of 8 kW.
LHV is lower heating value.
HHV is higher heating value.
The installed fuel cells are shown in Figure 15.

Installed Nedstack FCS 8-XXL fuel cell stacks as part of the system for hydrogen-to-electricity conversion.
Electrolyzer
An electrolyzer is a device that uses electricity to split water into hydrogen and oxygen through a process called electrolysis.56,57 The technology in fuel cells and electrolyzers is related but operates in reverse mod. While fuel cells generate electricity by combining hydrogen and oxygen, producing water as a byproduct, electrolyzers use electricity to split water into hydrogen and oxygen.
Typically, 52 kWh are required to produce 1 kg of hydrogen (Electrolyzer modeling for green hydrogen: https://www.gridcog.com/blog/electrolyser-modelling-for-green-hydrogen (accessed on June 28, 2024)). Therefore, 3.57 kWh produced typically per hour in fuel cells can produce 0.069 kg of hydrogen. This means that around 22.21% of hydrogen can be recovered if the hydrogen is used to produce electricity in fuel cells and then to use this produced electricity to produce hydrogen in the electrolyzer.
The implemented models are general and, therefore, offer calibration according to the requirements of researchers.
The electrolyzer has power of 14 kW. It is shown in Figure 16. The installed electrolyzer is not connected to the electric grid, but the electric energy is instead supplied through photovoltaics of 170 kW and wind turbines of 10 kW.

Acta AES 1000 electrolyzer integrated into the facility to produce hydrogen from water electrolysis.
The installed electrolyzer is used as an auxiliary process for producing hydrogen in addition to the gasification of waste, which is the main process for producing hydrogen. The examples of work of the electolyzer are given in Table 15.
Operating inputs and outputs of the electrolyzer unit.
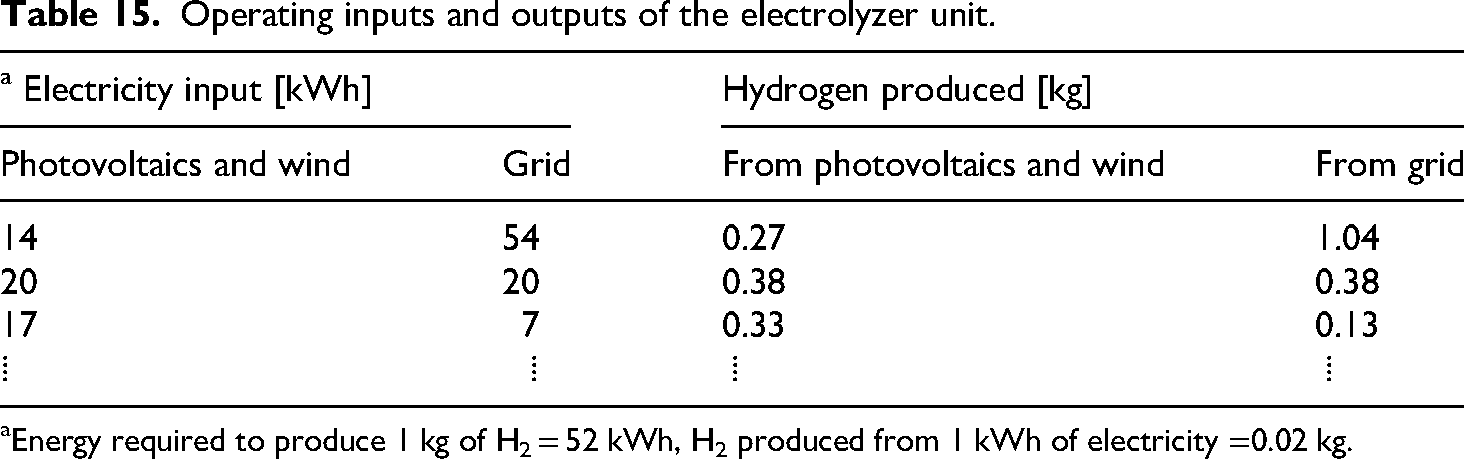
Energy required to produce 1 kg of H2 = 52 kWh, H2 produced from 1 kWh of electricity =0.02 kg.
Purge Process of Fuel Cells and Electrolyzers
The purge process for fuel cells has also been developed (it is valid for electrolyzers as well). Validation of fuel cells and electrolyzers was performed in R programming language, and a script for fuel cell validation (detection and prediction of purge) and a script for electrolyzer validation (detection and prediction of pressurization and hydrogen generation) were implemented in-house (These scripts are given in Appendix B).
The purge is a cleaning process whereby the short-term opening of the hydrogen valve at the output of the fuel cell modules washes away impurities from the anode side of the cells, thus stopping the gradual drop in their operating voltage.
Pressurization occurs in the production of hydrogen, when a constant increase in pressure is sharply reduced at some point. In addition to finding where this reduction occurred, the total amount of hydrogen produced between two moments of pressurization is also of interest. In both cases, it is a problem of detecting changes in time series. In order to automate and facilitate the work, it was also necessary to create a set of custom scripts in the R language to ensure that the results could be easily retrieved and converted into a user-friendly form and saved to a disk.
The selected methods for both fuel cell purge time detection and electrolyzer pressurization detection are of two types, with the first one being based on the use of sliding windows and the calculation of the average values in these windows. The difference of these values in two adjacent windows is then used to identify the change. The second method relies on the widely used Bayesian approach and the use of Markov Chain Monte Carlo (MCMC) simulation. This modern method produces a probabilistic time series profile based on the input data and using MCMC simulation. From this profile, the change points are extracted using the created scripts, which are then displayed to the user.
Figure 17 shows the results of the algorithm for detecting fuel cell purges. The results show that the fuel cell purge detection is highly reliable for the detection task, as it produces only three false positives.

Results of the fuel cell purge detection algorithm. Purple indicates the known start and end of purges, while green shows the algorithm-predicted values.
Table 16 shows the comparison of the known values with the values predicted by the algorithm electolyzers.
Electrolyzer pressurization detection: Algorithm performance results.
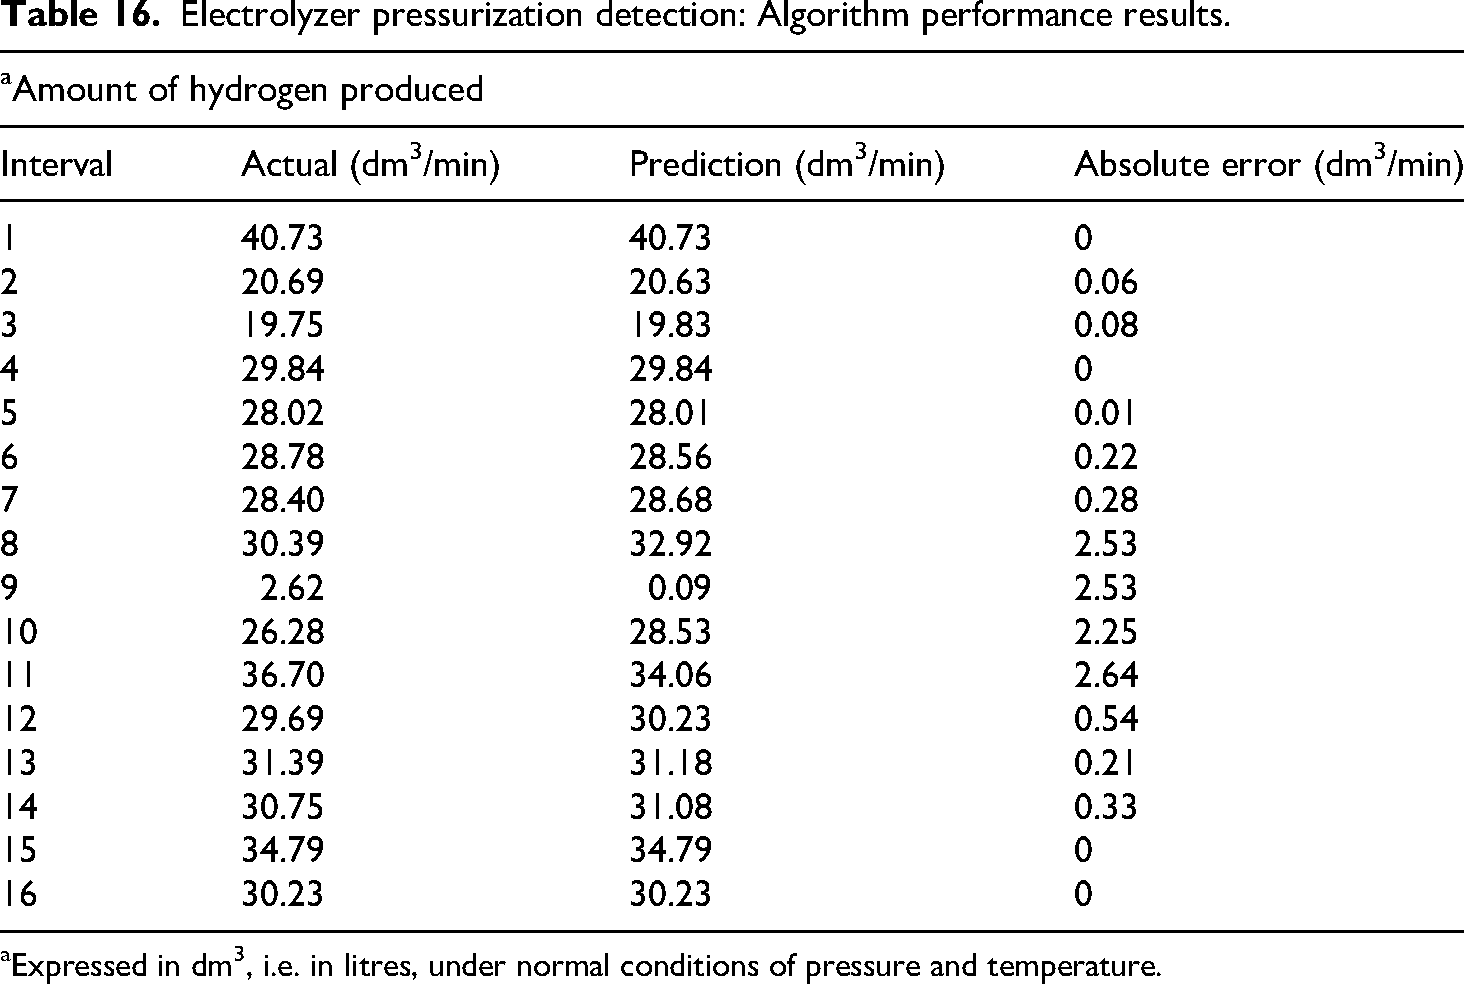
Expressed in dm3, i.e. in litres, under normal conditions of pressure and temperature.
The calculated absolute error shows that the algorithm can predict the values of hydrogen produced quite accurately: Out of 16 intervals, in 12 cases the algorithm predicted the amount of hydrogen produced with an absolute error of less than 0.54 dm3/min (cases are shown in green). The maximum error of the algorithm was in 11 intervals: The algorithm predicted the amount of hydrogen produced to be 28.53 dm3/min, while the reality was 26.28 dm3/min. This corresponds to an absolute error of 2.64 dm3/min.
Combustion or production of liquid fuel – an alternative process in the gasification facility
The synthesis gas produced can be used in two ways. The first is its energy recovery. That is, it is burned in a suitable energy device (burner, turbine, boiler, etc.) and thus, the chemical energy is converted into chemical energy.
Table 17 shows the amount of gases and related energy if all combustible components of syngas produced from 60 kg of waste per hour (if the entire produced amount of all combustible compounds of gas, including hydrogen, go into combustion).
Amounts of gases and associated energy from syngas generated from 60 kg/h of waste.

HHV: higher heating value: H2 = 142.08 MJ/kg, CO = 10.16 MJ/kg, and CH4 = 55.38 MJ/kg; LHV: lower heating value: H2 = 120.08 MJ/kg, CO = 10.16 MJ/kg, and CH4 = 49.85 MJ/kg – The higher and lower heating values are the same if their hydrogen compound content is zero because no water is produced neither in vapour nor in liquid phase. 58
The second option is to use syngas to produce liquid fuel. The liquid fuel is most often prepared by the synthesis of CO and H2 on a suitable catalyst.59–61 Since syngas contain components other than CO and H2, these components must be suitably separated from the gas and subsequently transformed to CO and H2 using reforming (steam or dry). The N2 component, which comes from the gasification medium, must be separated as it has no energy value.
Photovoltaics and wind turbine
Photovoltaics of up to 170 kW and wind power of up to 10 kW are installed to provide power for the electrolyzer. Surpluses of electric energy are stored in the PYLONTECH LiFePO4 battery with the capacity of 500 kWh.
The installed photovoltaics and wind turbines are shown in Figure 18. Time to fill up the battery from such photovoltaics and wind turbines is given in Table 18.

Photovoltaic and wind energy systems installed in the facility.
Electricity input and output of the system with the corresponding times required to fully charge the battery.

The electolyzer consumes 17 kWh.
Small pyrolysis
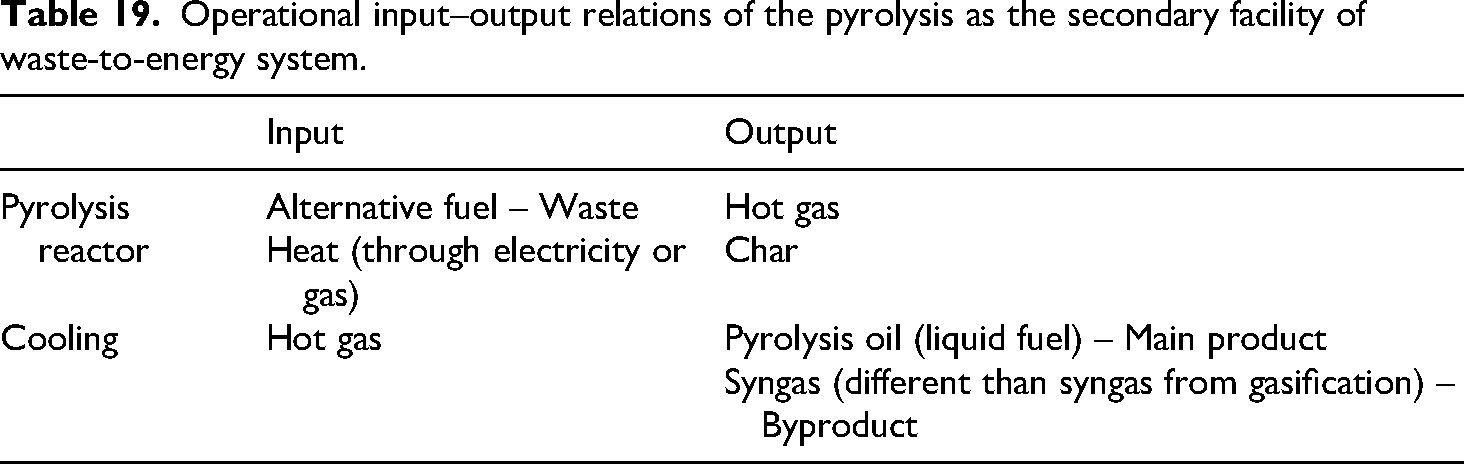
An additional separate facility, that is the secondary facility in the examined waste-to-energy system includes small pyrolysis, the diagram of which is given in Figure 19. The main product of pyrolysis is liquid fuel – pyrolysis oil,62–64 while the byproduct is gas and char, the composition of which is very different compared with the gas produced in the gasification facility, that is in the primary facility.

Diagram of the small pyrolysis unit, the secondary facility of the waste-to-energy system.
Pyrolysis oil is a very heterogeneous substance consisting of many compounds, 65 which can be dangerous for the environment and humans.66,67 However, with appropriate handling, this danger can be eliminated so that pyrolysis liquid can be a valuable source of raw materials.68,69
Small pyrolysis is designed for 2–5 kg of waste per hour with the maximum outputs for 5 kg of waste: Char up to 1.9 kg/h, liquid fuel, that is pyrolysis oil 1.6 kg/h, and gases 1.5 kg/h (very different composition of gas compared with gasification). The volume of this produced gas under normal conditions of pressure and temperature is around 0.9 m3.
The diagram of the installed small pyrolysis is shown in Figure 19 and a photo of the installed small pyrolysis is in Figure 20.

Installed small-scale pyrolysis unit.
The input/output relations within the processes of the pyrolysis facility are identified in Table 19.
Operational input–output relations of the pyrolysis as the secondary facility of waste-to-energy system.
The temperature of pyrolysis is given in Equation (3):
Five kg of waste gives 3.06 m3 of gas in pyrolysis if all mass is transformed into gas (it is based on the logic from gasification for mass balance) – 100% of mass in gas is not possible in practice because gas is a by-product. Based on the work of Chojnacki et al., 32 this amount of gas is corrected giving 0.91 m3 of gas: CO = 0.287 m3, CO2 = 0.548 m3, CH4 = 0.075 m3, and H2 = 0.0006102 m3. 1.489 kg of the total mass of input waste is transformed into gas.
Mass percentage of gas G is given in Equation (4):
Mass percentage of gas compounds is given in Table 20.
Mass percentage of individual gas compounds produced by pyrolysisa.

t is pyrolysis temperature [°C].
Mass percentage of liquid fuel (pyrolysis oil) L is given in Equation (5):
The examples from small pyrolysis are given in Table 21.
Sample results from laboratory-scale pyrolysis.

Table 22 examines, in more detail, Examples 1 and 2 from Table 21 for by-product Gas G.
Examples 1 and 2 demonstrating by-product gas composition from Table 21.

Conclusions
This study developed and deployed open-source regression-based software tool for simulating compact, mobile, and user-friendly waste-to-energy facilities. The objective was to support planning, development, management, and optimization of waste management in the Czech Republic and beyond. All detailed results are archived on Zenodo, as described in the Data Availability section.
Key quantitative findings
Gasification: Regression methods provided interpretable and robust approximations of thermochemical processes of transforming waste to syngas, contrasting with black-box deep learning approaches. Furthermore, polynomial regression models perform better in this case compared to symbolic regression models. Optimal reactor temperature range was determined as 879–966 °C, with a peak hydrogen yield at 923 °C (H2 = 15.1%, CO2 = 11.87%, CO = 19.76%, CH4 = 2.11%, N2 = 49.3%, total 98.78%). The developed regression models were evaluated using 5‑fold cross‑validation to assess out‑of‑sample performance (Electronic_Appendix_C.zip). In these analyses, degree‑4 polynomials generally achieved the best bias–variance trade‑off, whereas for N₂ a degree‑2 polynomial generalized slightly better (average MSE = 0.8335 vs. 0.965 for degree 4). Entropy‑based diagnostics (approximate entropy and sample entropy) were additionally computed with the EntropyHub library
70
to validate the dynamical behavior71–73 of key gasification models (Appendix_A.zip - Evaluation of gasification models using entropy). Pyrolysis: The developed model identified an optimal power of 3.3 kW, converting 3 kg/h of waste input into 0.97 kg/h of liquid fuel.
Limitations
Current validation is limited by the availability of experimental datasets.
The results are based on wood pallets typical of Central Europe; feedstock variability may affect accuracy when extending to other waste types.
Scaling up from laboratory to industrial operation may introduce additional uncertainties related to reactor performance, energy efficiency, and emissions.
Potential environmental and health impacts of different waste-to-energy processes require further investigation.
Practical and technical implications
The developed tools are open-source (Python, MS Excel) and accessible through web browsers, enabling interactive scenario analysis. The software supports community-scale applications, including industrial enterprises and municipalities, and may be integrated with renewable energy sources (PV, wind) or fuel cell systems.
Future work
Extend datasets and validation across different waste feedstocks to improve generalizability. Conduct a comprehensive techno-economic analysis (similar as Rizqi
5
) to assess feasibility at different scales. Integrate cost analysis. Integrate environmental impact assessments (e.g. life-cycle analysis, emission control studies) into the modelling framework. Facilitate further transparency by releasing additional open-source data and codes.
Supplemental Material
sj-zip-1-sci-10.1177_00368504251412556 - Supplemental material for A data-driven model of waste gasification and pyrolysis: One tailored approach for an experimental facility from the Czech Republic
Supplemental material, sj-zip-1-sci-10.1177_00368504251412556 for A data-driven model of waste gasification and pyrolysis: One tailored approach for an experimental facility from the Czech Republic by Dejan Brkić, Pavel Praks, Judita B Nagyová, Michal Běloch, Martin Marek, Jan Najser, Renáta Praksová and Jan Kielar in Science Progress
Supplemental Material
sj-zip-2-sci-10.1177_00368504251412556 - Supplemental material for A data-driven model of waste gasification and pyrolysis: One tailored approach for an experimental facility from the Czech Republic
Supplemental material, sj-zip-2-sci-10.1177_00368504251412556 for A data-driven model of waste gasification and pyrolysis: One tailored approach for an experimental facility from the Czech Republic by Dejan Brkić, Pavel Praks, Judita B Nagyová, Michal Běloch, Martin Marek, Jan Najser, Renáta Praksová and Jan Kielar in Science Progress
Supplemental Material
sj-zip-3-sci-10.1177_00368504251412556 - Supplemental material for A data-driven model of waste gasification and pyrolysis: One tailored approach for an experimental facility from the Czech Republic
Supplemental material, sj-zip-3-sci-10.1177_00368504251412556 for A data-driven model of waste gasification and pyrolysis: One tailored approach for an experimental facility from the Czech Republic by Dejan Brkić, Pavel Praks, Judita B Nagyová, Michal Běloch, Martin Marek, Jan Najser, Renáta Praksová and Jan Kielar in Science Progress
Footnotes
Nomenclature
Author contribution roles
Funding
The authors disclosed receipt of the following financial support for the research, authorship, and/or publication of this article: Ministry of Education, Youth and Sports of the Czech Republic through the e–INFRA CZ (ID: 90254) project; EU funds under the project “Increasing the resilience of power grids in the context of decarbonisation, decentralisation and sustainable socioeconomic development”, CZ.02.01.01/00/23_021/0008759, through the Operational Programme Johannes Amos Comenius; Technology Agency of the Czech Republic through the CEET project – “Center of Energy and Environmental Technologies” TK03020027; This article has been produced with the financial support of the European Union under the REFRESH - Research Excellence For REgion Sustainability and High-tech Industries project number CZ.10.03.01/00/22_003/0000048 via the Operational Programme Just Transition. Dejan Brkić additionally wants to acknowledge Ministry of Science, Technological Development and Innovation of the Republic of Serbia, grant number: 451-03-136/2025-03/200102.
Declaration of conflicting interests
The authors declared no potential conflicts of interest with respect to the research, authorship, and/or publication of this article.
Data availability
All data required to repeat this research is provided in the text. Open-source datasets and code to foster transparency and encourage reproducibility of this research are available under the CC BY 4.0 license at Zenodo; https://doi.org/10.5281/zenodo.17411891. The final version of the reviewed manuscript accepted for publication is available online at DOI: 10.20944/preprints202512.1609.v1.
Supplemental material
None.
References
Supplementary Material
Please find the following supplemental material available below.
For Open Access articles published under a Creative Commons License, all supplemental material carries the same license as the article it is associated with.
For non-Open Access articles published, all supplemental material carries a non-exclusive license, and permission requests for re-use of supplemental material or any part of supplemental material shall be sent directly to the copyright owner as specified in the copyright notice associated with the article.