
Abstract
Objectives
Grassland net primary productivity (NPP) in the Ili River Basin Grasslands, as Earth's largest terrestrial ecosystem, are crucial for global carbon cycling and ecological stability. Clarifying the spatiotemporal patterns and driving factors of grassland NPP is key to optimizing conservation strategies and enhancing productivity.
Methods
Using MODIS data (2000–2022) and the CASA model, this study estimated grassland NPP in the Ili River Basin, and explored its dynamic characteristics and responses to climate and human activities through trend analysis, correlation analysis, and the Hurst index.
Results
(1) NPP increased annually by 0.14% from 2000 to 2020, but decreased by 15.4% from 2020 to 2022, with an overall 12.95% decline over 23 years; extreme climates in 2008, 2014, and 2021 caused NPP to drop by 27.24%, 28.01%, and 21.31%, respectively, compared to the previous years. (2) High-NPP areas were concentrated in eastern mountainous regions (Nileke, Zhaosu, Tekes, etc.), while low-NPP areas were distributed in central urban zones and high-altitude regions, showing an “east-high-west-low” pattern. (3) Temperature was the main climatic driver (affecting 91,253 km²); human activities led to NPP decline in 55.94% of the area (far exceeding the 2.81% where NPP increased). (4) The Hurst index projected that 79.5% of the area would shift from decline to increase, 8% would continue to decline, and 9.81% would reverse from increase to decline.
Conclusions
NPP showed a downward trend from 2000 to 2022 but is expected to rise significantly in the future, providing references for conservation efforts.
Introduction
Grasslands are mainly found in arid and semi-arid regions, covering about 25% to 30% of the Earth's land. 1 Grassland is highly sensitive to environmental changes and temporal dynamics, 2 and plays an important role in the global carbon cycle, soil and water conservation, windbreak and sand fixation, and climate stability. A good and healthy grassland ecosystem has a certain degree of self-recovery, renewability, and stability, and can provide good ecological services for the ecological environment and human survival and development. 3 Net primary productivity (NPP) is defined as the net organic matter production in ecosystems, calculated as gross primary productivity (GPP)—the total carbon fixed through photosynthesis—minus carbon losses from plant autotrophic respiration.4,5 As a fundamental component of ecosystem energy flows and biogeochemical cycles, it serves as a robust indicator of ecosystem functioning and ecological health, 6 which can reflect the growth status of vegetation and the stability of the ecosystem. 7 As a key element of material cycling and energy flow in terrestrial ecosystems, NPP is one of the important indicators for measuring the growth status of vegetation, 8 an increase in NPP typically indicates: (1) greater vegetation biomass accumulation, (2) enhanced ecosystem carbon sequestration capacity, and (3) improved ecosystem service capabilities, particularly in soil conservation, water retention, and climate regulation. 9 Conversely, it often signals ecosystem deterioration, manifesting as grassland degradation, 10 land desertification, 11 and diminished ecosystem service functions.
As one of China's four major pastoral regions, Xinjiang has approximately 57,258,700 hm² of natural grasslands, with 48,006,800 hm² available for use. However, due to climate change and human activities, the total area of degraded grasslands in Xinjiang exceeds the area of grasslands that have improved. 12 As part of Xinjiang, the Ili River Basin, known as the “Saiwai Jiangnan,” covers an area of 3,104,300 hm², accounting for 6.47% of Xinjiang's available grassland area. 13 It serves as a high-quality livestock base in China, but with climate change and the expansion of human economic activities, issues such as grassland productivity decline, degradation, and desertification are becoming increasingly severe.14,15
Zhou et al. showed that 65.75% of grassland degradation was caused by human activities and 19.94% was caused by interannual climate change. In contrast, 32.32% of grassland restoration was caused by human activities, while 56.56% was caused by climatic factors 16 ; In 2004, Evans et al. 17 found that human activities and climate change were the main reasons for the decline of grassland NPP in Syria. In 2013, Davis et al. 18 proposed that temperature is a key factor contributing to grassland degradation. Qin et al. 19 concluded that the rapid population growth and the destruction of grassland by human social activities are important factors affecting the stability of grassland ecosystems. In 2015, Li et al. 20 used NDVI data from 1982 to 2013 to show that precipitation is a major climatic factor affecting vegetation degradation; Hasbagan et al. 21 found that grassland degradation was inversely correlated with precipitation in winter and spring, but not with temperature. Research conducted by Naeem, and other scholars on the vegetation in China has revealed that the influence of climatic factors on grasslands outweighs that of human activities. Moreover, precipitation exhibits a higher degree of sensitivity to changes in NPP. 22
Jiao et al. analyzed the spatial and temporal variation of vegetation NPP in the Ili River Basin from 2000 to 2014 and found that NPP exhibited a downward trend throughout the study period. Spatially, its distribution was influenced by the vertical zonality of the river valley, while precipitation was identified as the primary climatic factor controlling the interannual variation of NPP. 23 However, the time scale of this research was insufficient, and there was a lack of prediction of future changes. Chen Chunbo et al. studied the spatiotemporal changes of NPP in natural grasslands in Xinjiang from 2000 to 2018, analyzing its trends and categorizing the grasslands into 11 types to examine the interannual variation of NPP. Their findings indicated that NPP exhibited spatial and temporal heterogeneity, showing a fluctuating but overall increasing trend during the study period. Additionally, the annual average NPP of natural grasslands in northern Xinjiang was higher than that in southern Xinjiang. 24 Similarly, Fan Jun's study found that from 2001 to 2020, NPP in northern Xinjiang showed a fluctuating upward trend, with the highest grassland NPP observed in Yili Prefecture and the lowest in Karamay City. 25 However, the resolution of the remote sensing data used in this study was relatively low.
Using MOD13Q1 Normalized Difference Vegetation Index (NDVI) and other datasets (vegetation type data, and meteorological data of the Yili River Basin), the CASA model was applied to estimate the grassland NPP in the Yili River Basin. The estimation results were validated with measured biomass data, followed by trend analysis to assess the change trends and their significance. The spatiotemporal variation characteristics of grassland NPP in the Yili River Basin were explored and analyzed. Finally, the Hurst index was used to predict the future change trends of grassland NPP in the basin.
Building on previous studies, this article extends the time scale and employs high-resolution data, utilizing MOD13Q1 NDVI and other datasets. The CASA model was applied to estimate grassland NPP in the Ili River Basin, with the estimation results verified using measured biomass data. First, trend analysis was conducted to assess significance, and finally, the temporal and spatial variation characteristics of grassland NPP in the Ili River Basin were explored and analyzed using the Hurst index and other methods.
Overview of the study area
As shown in Figure 1, Ili River Basin is situated at the western end of the Tianshan Mountains in the Xinjiang Uygur Autonomous Region, surrounded by mountains on three sides and opening from a narrow eastern section to a wider western expanse. Geographically, it lies between 80°09'–84°56'E and 42°14'–44°50'N, extending 360 km from east to west, with its widest point reaching 275 km from north to south. The total area of the basin is 57,550.80 km². The Ili River Basin features diverse landforms, with an overall topographic pattern of higher elevations in the east and lower elevations in the west, commonly described as “two mountains and one basin.” The region is vast, with fertile land and a mild, humid climate, classified as a temperate continental semihumid desert climate. The Yili River Basin is rich in land resources, including 1,591,968 acres of forest land, 1,512,251 acres of cultivated land, and 7,784,758 acres of grassland. According to the factors such as climate, altitude, and soil in the Yili River Basin, the grassland types in the basin are roughly divided into nine categories, namely low-lying meadows, mountain meadows, temperate deserts, alpine meadows, temperate meadows, temperate deserts, alpine grasslands, temperate grasslands, and swamps. In terms of climate, there are significant differences in the distribution of precipitation and temperature within the basin, annual precipitation ranges from 200 to 500 mm in plain areas, 600–800 mm in mountainous areas, and exceeds 800 mm in high-altitude regions. The average annual temperature is around 10.4°C, and the average annual sunshine duration is 2776.3 hours. Due to its overall humidity, abundant precipitation, and well-developed vegetation and pastures, the basin supports a thriving ecosystem. While most of the basin is located in Kazakhstan, a smaller portion lies within China. It is considered one of the best-preserved semi-arid regional ecological landscapes in the world. The Yili River Basin covers multiple counties and cities, including but not limited to: Huoguo’ershi City, Yining City, and other counties such as Gongliu County, Xinyuan County, and Tekes County. These counties have distinct development characteristics in agriculture, animal husbandry, tourism, and other fields. The administrative division of the Yili River Basin is characterized by its complexity and diversity, including prefecture-level cities, county-level cities, and autonomous counties, which reflects the characteristics of China's ethnic regional autonomy system.

Topographic map of the Ili River Basin.
Data source and preprocessing
This study aims to analyze the changes in grassland NPP in the Ili River Basin of Xinjiang from 2000 to 2022 and examine its correlation with meteorological factors. To achieve this, the following data is used in this article:
NDVI data: The Normalized Vegetation Index (NDVI) data is derived from the MODIS NDVI dataset (MODIS/061/MOD13Q1), and the spatial resolution of the data is 250 m. The NDVI data from 2000 to 2022 were filtered from this dataset, the NDVI band was selected, and the annual average NDVI for each year was calculated, which was cropped to the Ili River Basin in Xinjiang. Meteorological data: The precipitation data and temperature data are from the National Tibetan Plateau Data Center, including the monthly precipitation dataset with a resolution of 1 km in China and the monthly average temperature dataset with a resolution of 1 km in China (https://data.tpdc.ac.cn/). The total radiation data is derived from the annual radiation dataset released by the Earth Resource Data Cloud Platform (www.gis5 g.com), with a spatial resolution of 1 km. Natural grassland type data in Xinjiang: The grassland type data used in this article are from the Grassland Station of Xinjiang Uygur Autonomous Region. Yili map data: The dataset is provided by Geospatial Data Cloud site, Computer Network Information Center, Chinese Academy of Sciences (http://www.gscloud.cn).
Models and research methods
CASA model
The CASA model, namely the Carnegie-Ames-Stanford Approach model, is a widely used model for estimating vegetation NPP at the regional scale.
26
Initially proposed by scientists from the Carnegie Institution of Washington, this model is based on light use efficiency and estimates NPP through remote sensing data and meteorological data,
27
and it is also the most used and mature model for NPP estimation worldwide. In this article, the improved light energy utilization model of Zhu et al. is used to calculate NPP:

Formula for calculating photosynthetically active radiation:

Light energy utilization efficiency (ɛ) is calculated by the following formula:

It is difficult to obtain simulated measured NPP, so the NPP converted from the measured aboveground biomass data is used to verify the model accuracy. The data selected for verification are the biomass data collected in July, August, and September (the growing season) of 2014 and 2015. Calculations show that the two have a strong correlation (R²=0.57, P < 0.01), indicating that the CASA-simulated NPP data of grasslands in the Yili River Basin, Xinjiang, selected in this article has high accuracy and can be used for estimating the grassland NPP in the Yili River Basin, Xinjiang.
Residual analysis
Residual analysis can distinguish the relative importance of climate change and human activities on vegetation impacts.


NPP trend analysis
Based on the univariate linear regression analysis of pixels, the change trend of vegetation in the study area was simulated for 23 years, and the calculation formula was as follows:
The F-test was used to test the significance of the interannual trend change of vegetation NPP.

Partial correlation analysis
Partial correlation analysis can be used to remove the effect of one independent variable and analyse only the effect of the other independent variable on the dependent variable. The calculation of the correlation coefficient is the first step in the partial correlation analysis:

The formula for calculating the partial correlation coefficient is as follows:
The t-test was used to test the significance of the partial correlation coefficient:

Complex correlation analysis
Complex correlation analysis mainly examines the influence of multiple factors on one factor, assuming that y and z are independent variables and x the dependent variable, the complex correlation coefficient between them is calculated as follows:

Tested using the F-test:

Hurst index
The Hurst index is an indicator used to analyze the long-term memory of time series. Specifically, it can determine whether a time series exhibits persistence, antipersistence, or randomness,27,28 can effectively predict the future trend of time series and is widely used in ecology and other fields. The calculation process is as follows:
For the time series NPP(n), n = 1, 2, …, n, and any positive integer
Define the cumulative dispersion sequence NPP(n,p) as:


Define the range sequence R(p) as:

Define the standard deviation sequence s(p) as:

Hurst index calculations:

Results
Interannual variation trend of grassland NPP in the Ili River Basin
Interannual variation of total grassland NPP
NPP serves as an effective indicator of grassland ecosystem productivity. The changes in grassland NPP in the Ili River Basin was analyzed using the grassland NPP data from 2000 to 2022. As shown in Figure 2, over the 23-year period, the grassland NPP in the Ili River Basin showed a fluctuating trend, with an overall downward tendency. The average NPP reached 449.68 gC·m⁻²·a⁻¹. The variation range of grassland NPP was between 510.02 and 358.75 gC·m⁻²·a⁻¹, with a variation amplitude of 151.27 gC·m⁻²·a⁻¹. Among them, the maximum NPP value, reaching 510.02 gC·m⁻²·a⁻¹, occurred in 2016, and the minimum NPP value, only 358.75 gC·m⁻²·a⁻¹, occurred in 2008. Looking at the overall trend, from 2000 to 2016, it showed a fluctuating upward trend. After reaching the peak, it began to decline in 2016. The grassland NPP reached its minimum value in 2008. According to the data of the Xinjiang Meteorological Observatory, it is speculated that due to the continuously abnormally high temperatures in most areas of Xinjiang in 2008 and a significant decrease in precipitation, which was 24% less than the same period of normal years, the natural grasslands suffered severe drought, resulting in the grassland NPP in Ili reaching the lowest value in the past 23 years in 2008.
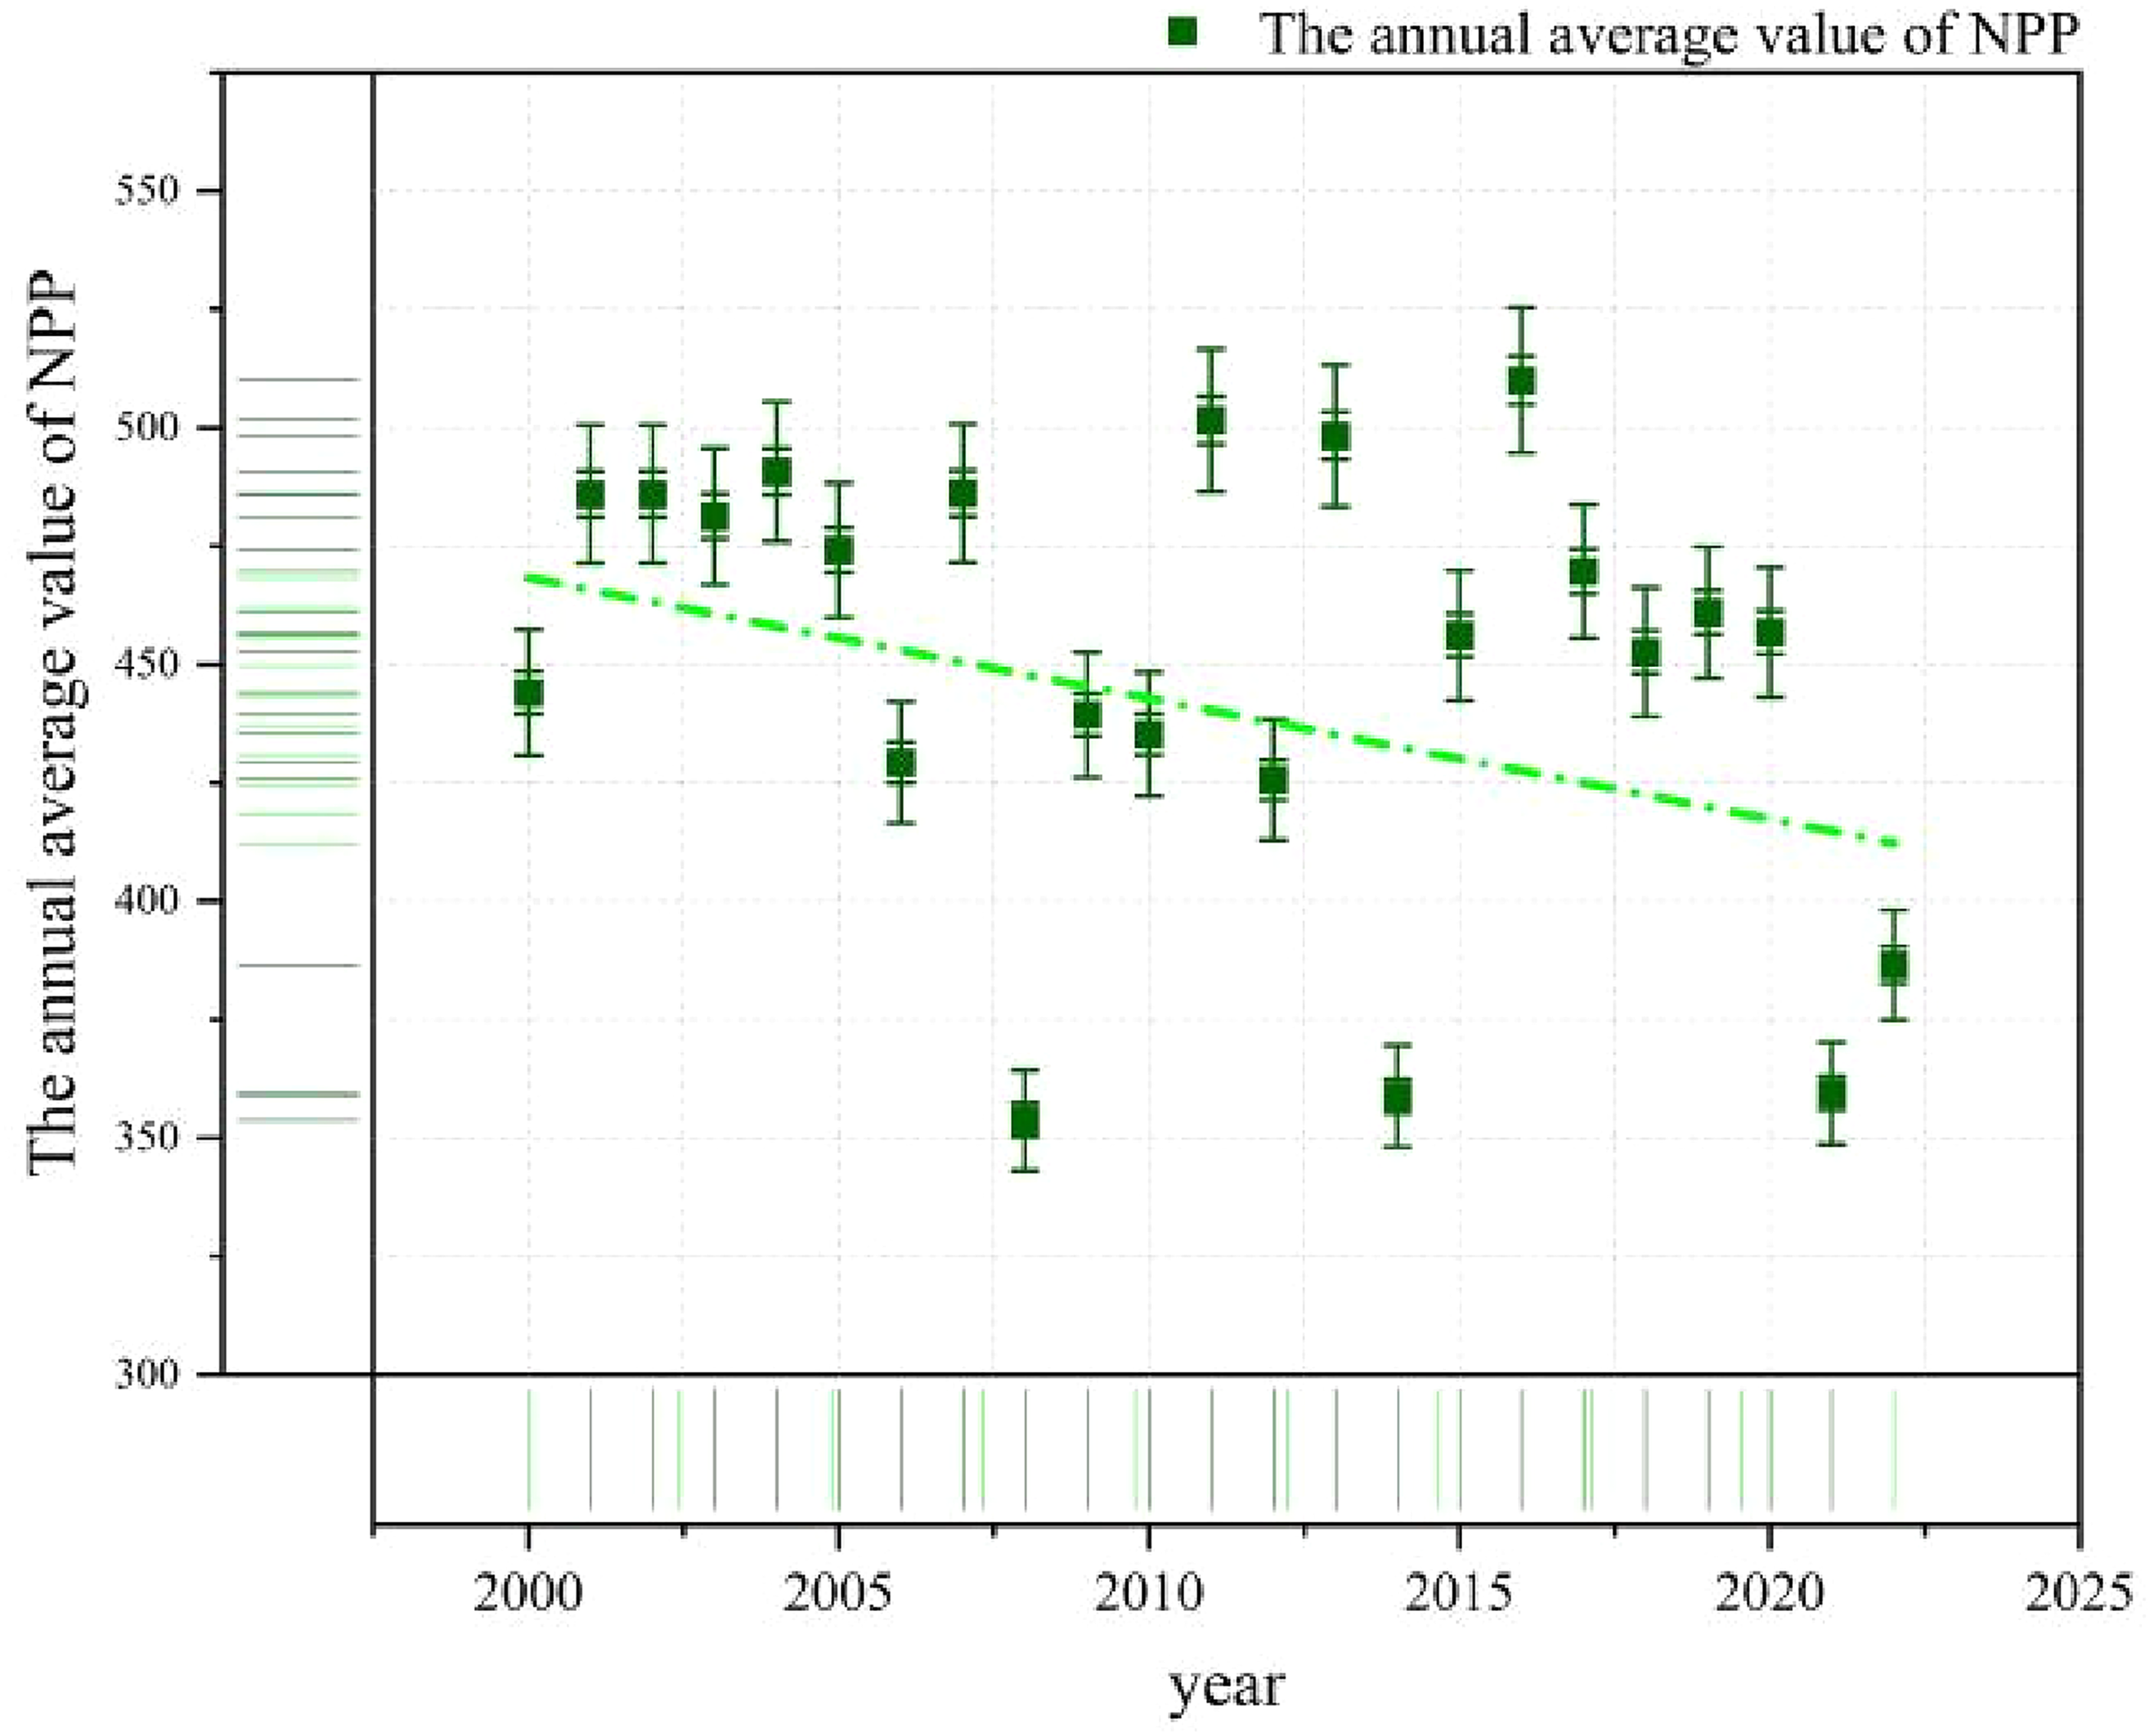
Variation trend of NPP in natural grasslands of the Ili River Basin from 2000 to 2022. NPP: net primary productivity.
Interannual variation of grassland NPP in each administrative region of Ili Prefecture
The interannual variation trends of NPP in each administrative region of Ili Prefecture are shown in Figure 3, presenting an overall fluctuating pattern. According to the “Top Ten Natural Disasters in China in 2008” released by the Ministry of Natural Resources of the People's Republic of China, 2008 was the second severe drought year in the history of Xinjiang. The temperature in most parts of Xinjiang remained abnormally high, and precipitation decreased significantly. The affected grassland area in the Ili River Valley reached 1.855 million hectares, accounting for 54% of the total grassland area. According to the “Top Ten Weather and Climate Events in Xinjiang in 2014” and the “Top Ten Weather and Climate Events in Xinjiang in 2021” released by the Xinjiang Meteorological Bureau, the Ili River Valley experienced the most severe spring–summer consecutive drought in nearly 60 years in 2014. In 2021, the whole Xinjiang witnessed the warmest February since meteorological records began, and some areas in the Ili River Valley suffered from severe meteorological drought. During the strongest drought period, the severely drought-affected area reached 64,000 km2. Therefore, the NPP of natural grasslands in each administrative region of Ili showed an obvious downward trend in 2014, 2018, and 2021. Among them, the grassland NPP in Qapqal Xibe Autonomous County, Gongliu County, Huocheng County, Tekes County, Yining County, Yining City, and Huocheng County (Huocheng County is repeated here, might be a mistake, it should be Horgos City) reached the lowest values in 2008, which were 175.84, 304.00, 264.07, 379.49, 269.93, 162.32836, and 274.21 gC·m⁻²·a⁻¹, respectively. The lowest values of grassland NPP in Nilka County and Zhaosu County occurred in 2021. The lowest value of grassland NPP in Xinyuan County occurred in 2022, which was 399.62 gC·m⁻²·a⁻¹, only 2.18 gC·m⁻²·a⁻¹ higher than that in 2021.

Interannual variation trends of grassland NPP in each administrative region of Ili prefecture. NPP: net primary productivity.
Interannual variation of NPP of different grassland types in the Ili River Basin
As shown in Figure 4(a), the grassland types in the Ili River Basin can be roughly divided into nine categories: low-flat meadow, mountain meadow, temperate desert, alpine meadow, temperate meadow, temperate sandy desert, alpine land, temperate steppe, and swamp. The mountain meadow has the largest area, followed by the temperate meadow, and the temperate sandy desert has the smallest area proportion. As can be seen from Figure 4(b), from 2000 to 2022, the nine grassland types showed basically the same changing trend. The NPP of all grassland types presented a significant downward trend in 2008, 2014, and 2021, but the years when the minimum values occurred were different. In 2008, the NPP of low-flat meadow, temperate meadow, temperate steppe, temperate desert, temperate sandy desert, and swamp reached the lowest values in the past 23 years. Among them, the NPP of the temperate steppe decreased the most compared with that in 2007, dropping by 211.02 gC·m⁻²·a⁻¹. The NPP of the mountain meadow reached the lowest value of 501.87 gC·m⁻²·a⁻¹ in 2021. The alpine meadow and alpine land had the lowest NPP values in 2022, but compared with the NPP values in 2021, the decline was not significant.

(a) Proportion map of natural grassland distribution in the Ili River Basin and (b) interannual variation trend map of natural grassland in the Ili River Basin.
Spatial distribution pattern of grassland NPP in the Ili River Basin
Mean value and spatial distribution characteristics of total grassland NPP
Due to the favorable topographical conditions in the Ili River Basin, it has the highest grassland NPP in Xinjiang. As shown in Figure 5, which is the spatial distribution map of grassland NPP in the Ili River Basin from 2000 to 2022. It can be seen from Figure 5 that the spatial distribution of grassland NPP in the Ili River Basin generally shows the characteristic that the eastern part is greater than the western part. Among them, the area with grassland NPP values less than 200 gC·m⁻²·a⁻¹ accounts for 15.55% of the entire study area, the area with NPP values of 200 to 350 gC·m⁻²·a⁻¹ accounts for 16.31% of the study area, the area with NPP values of 350 to 500 gC·m⁻²·a⁻¹ accounts for 16.10% of the entire study area, the area with NPP values of 500 to 650 gC·m⁻²·a⁻¹ accounts for 31.09% of the study area, and the area with NPP values greater than 650 gC·m⁻²·a⁻¹ accounts for 20.95% of the study area.
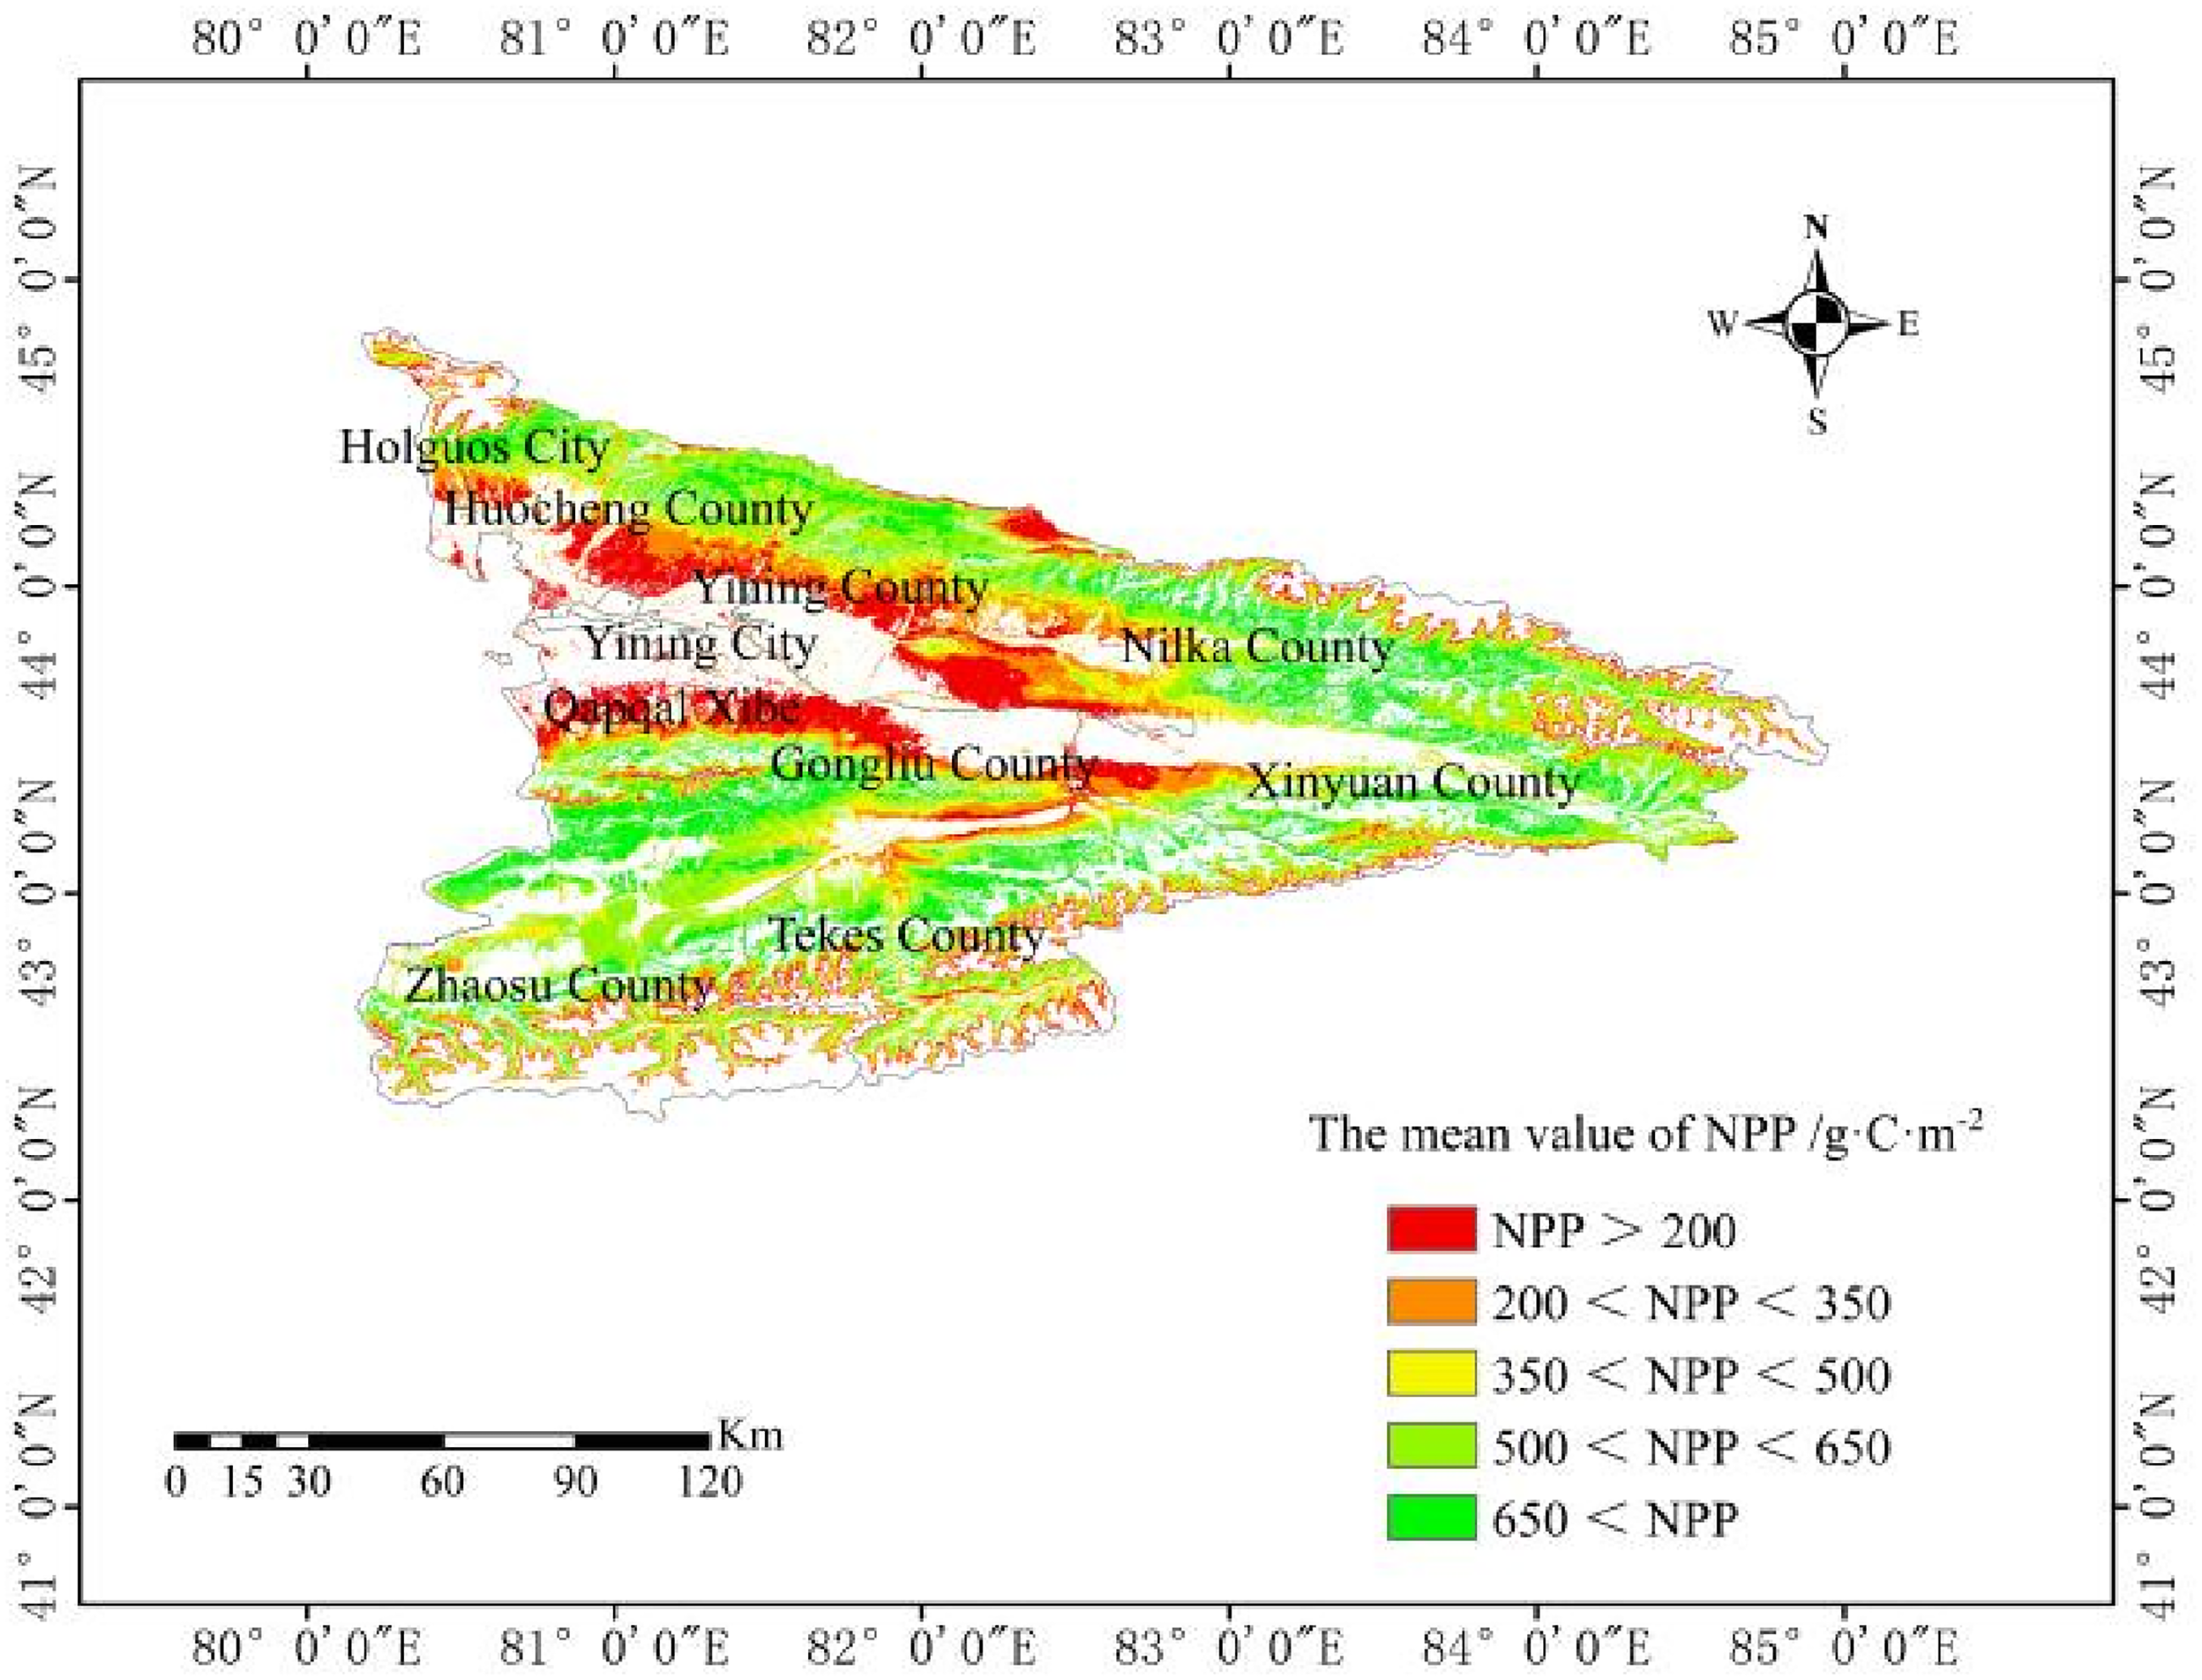
Spatial distribution of grassland NPP in the Ili River Basin from 2000 to 2022. NPP: net primary productivity.
As shown in Figure 6, from 2000 to 2011, the total grassland area in the Ili River Basin was 414,821.875 km². The area with an NPP of less than 200 gC·m⁻²·a⁻¹ accounted for 18.03% of the study area. The area with an NPP in the range of 200 to 350 gC·m⁻²·a⁻¹ accounted for 15.35% of the study area. The area with an NPP between 350 and 500 gC·m⁻²·a⁻¹ accounted for 14.45% of the study area. The area with an NPP in the range of 500 and 650 gC·m⁻²·a⁻¹ accounted for 28.25% of the study area, and the area with an NPP of over 650 gC·m⁻²·a⁻¹ accounted for 23.92% of the study area. When compared with the grassland NPP in the Ili River Basin from 2000 to 2011, the grassland NPP in the Ili River Basin from 2011 to 2022 decreased significantly. Specifically, the area with an NPP of less than 200 gC·m⁻²·a⁻¹ accounted for 15.99% of the entire study area, representing a decrease of 21,338 gC·m⁻²·a⁻¹ compared to the grassland NPP area in the Ili River Basin from 2000 to 2010. The area with an NPP in the range of 200 and 350 gC·m⁻²·a⁻¹ accounted for 15.35% of the study area, an increase of 3052 gC·m⁻²·a⁻¹ compared to the area in the Ili River Basin from 2000 to 2011. The area with an NPP between 350 and 500 gC·m⁻²·a⁻¹ accounted for 14.45% of the study area, an increase of 9589 gC·m⁻²·a⁻¹ compared to that from 2000 to 2011.

Spatial distribution of grassland NPP in the Ili River Basin during 2000–2010 and 2011–2022. NPP: net primary productivity.
Response of grassland NPP in the Ili River Basin to temperature and precipitation
Response of grassland NPP in the Ili River Basin to precipitation
As shown in Figure 7, which is the change trend diagram of the annual average precipitation and the annual average grassland NPP in the Ili River Basin. It can be seen that during 2000 to 2022, both precipitation and grassland NPP had large variation ranges. Overall, the change trend of grassland NPP in the Ili River Basin was roughly the same as that of its annual average precipitation. With the increase of precipitation, the grassland NPP mostly showed an upward trend. A moderate decrease in precipitation could also lead to an increase in grassland NPP. However, in most cases, a decrease in precipitation significantly reduced the value of grassland NPP.

Diagram of the changing trends of annual average precipitation and annual average grassland NPP in the Ili River Basin. NPP: net primary productivity.
Partial correlation analysis between NPP and precipitation
As shown in Figure 8(a), in the Ili River Basin, the area where annual precipitation has a positive correlation with NPP rxz,y>0)is 630.6875 km², and the area where annual precipitation has a negative correlation with NPP(rxz,y<0)is 575.625 km². The area where precipitation has a positive correlation with the change of NPP in the Ili River Basin is significantly larger than the area with a negative correlation. From this, it can be seen that an increase in precipitation in the Ili River Basin has a strong promoting effect on NPP. As shown in Figure 8(b), the area where NPP and precipitation have a significantly negative correlation (rxz,y<0,0<p<0.01) is 117.125 km²; the area with a negative significant correlation (rxz,y<0,0.01<p<0.05) is 458.5 km²; the area where NPP and precipitation have a significantly positive correlation (rxz,y>0,0<p<0.01) is 120.5 km², and the area with a positive significant correlation (rxz,y>0,0.01<p<0.05) is 508.5 km².

Partial correlation coefficient between NPP and annual precipitation (a) and distribution of partial correlation (b) in the Ili River Basin. NPP: net primary productivity.
Response of grassland NPP in the Ili River Basin to temperature
As shown in Figure 9, it represents the response of grassland NPP in the Ili River Basin to the local temperature. It can be observed that the changing trends of grassland NPP and temperature are roughly the same. In 2014, a severe cold wave swept across Xinjiang, and there was a snowstorm in the Ili region. The cold wave weather led to a significant drop in the annual average temperature, and the grassland NPP also showed a substantial downward trend. In the later period, as the annual average temperature increased, the grassland NPP increased accordingly, indicating that the change in the annual average temperature in the Ili River Basin has a certain impact on the grassland NPP. In 2020, the Yili River Basin experienced a situation where air temperature increased while grassland NPP decreased. This seemingly contradictory phenomenon may actually be caused by the combined effect of multiple factors. As precipitation significantly decreased and temperature significantly increased in 2020, the comprehensive influence of these factors led to the reduction of grassland NPP in the Yili River Basin.

Diagram of the changing trends of annual average temperature and annual average grassland NPP in the Ili River Basin. NPP: net primary productivity.
Partial correlation analysis between NPP and temperature
As shown in Figure 10(a), in the Ili River Basin, the area where the annual temperature has a positive correlation with NPP (rxy,z>0) is 3328.2 km², and the area where the annual temperature has a negative correlation with NPP (rxy,z<0) is 3106.1 km². In the Ili River Basin, the area where the temperature has a positive correlation with NPP is larger than the area with a negative correlation. Thus, it can be inferred that an increase in temperature may promote the increase of NPP. As shown in Figure 10(b), the area where NPP and temperature have a significantly negative correlation (rxy,z<0,0<p<0.01) is 640.2 km², and the area with a negative significant correlation (rxy,z<0,0.01<p<0.05) is 2465.9 km². The area where NPP and temperature have a significantly positive correlation (rxy,z>0,0<p<0.01) is 657.6 km², and the area with a positive significant correlation (rxy,z>0, 0.01<p<0.05) is 2670.6 km².

Partial correlation coefficient between NPP and annual temperature (a) and distribution of partial correlation (b) in the Ili River Basin. NPP: net primary productivity.
Composite response of precipitation and temperature
As shown in Figure 11(a), the range of the composite correlation coefficient between the annual temperature, annual precipitation and NPP in the Ili River Basin of Xinjiang is approximately [0.86, 0]. This indicates that there is a strong composite correlation between temperature, precipitation and NPP within the Ili River Basin, and the combined changes of temperature and precipitation have a significant impact on NPP. As shown in Figure 11(b), the area with an extremely significant correlation (0<p<0.01) in the Ili River Basin is 1902km², and the area with a significant correlation (0.01<p<0.05) is 6983 km². By comparing the partial correlations of the above-mentioned meteorological factors, it can be seen that the comprehensive impact of temperature and precipitation on NPP is relatively weaker than the impact of temperature or precipitation acting alone.

Multiple correlation coefficient between NPP, annual temperature and annual precipitation (a) and distribution of multiple correlation (b) in the Ili River Basin. NPP: net primary productivity.
Zoning of driving types of grassland NPP changes based on climatic factors
Based on previous research experience and the actual situation of grassland NPP changes, this article divides the driving types of NPP changes caused by climatic factors in the Ili River Basin. The specific zoning criteria are shown in Table 1. As can be seen from Figure 12, in the Ili River Basin of Xinjiang, the area of the temperature-driven type region is the largest, approximately 5703.3 km². Next are the precipitation-driven type and the composite-driven type, with areas of 910.9 and 888.5 km², respectively. The combined effect of precipitation and temperature also has a certain impact in some areas. However, the area of the precipitation-driven type region alone is smaller than that of the temperature-driven type region, indicating that the impact of precipitation changes on NPP is secondary to that of temperature in some areas. The area of the composite-driven type region is the smallest, suggesting that the area where temperature and precipitation act together is relatively small. Therefore, the area of the temperature-driven type region in the Ili River Basin is significantly larger than that of the other two driving-type regions. So, temperature is the main climatic factor affecting the NPP changes in the Ili River Basin.

Distribution of driving types of NPP changes based on climatic factors in the Ili River Basin. NPP: net primary productivity.
Zoning of NPP change-driving types of climatic factors.
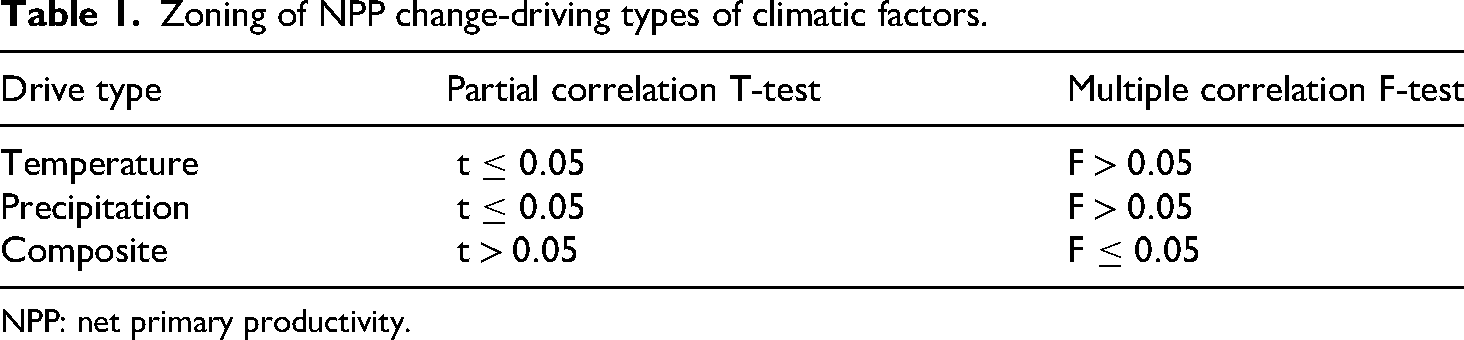
NPP: net primary productivity.
Driving effect of human activities on grassland NPP
Through the residual analysis of grassland NPP and meteorological data from 2000 to 2022, the changing trend of the impact of human activities on grassland NPP in the past 23 years was obtained (Figure 13). As can be seen from Figure 13, in Ili, 55.94% of the area shows a significant decreasing trend, and the area where the grassland NPP shows no significant change accounts for 40.81% of the total grassland area. Spatially, the areas where the grassland NPP shows an extremely significant and significant increase account for 2.81% of the total grassland area, respectively, mainly distributed in the northern part of Qapqal Xibe Autonomous County and the central part of Gongliu County.

Trends of grassland NPP changes induced by human activities. NPP: net primary productivity.
Spatiotemporal dynamics and future projections of grassland net primary productivity in the Yili River Basin
As can be gleaned from Figure 14(a) and (b), during the 2000 to 2022 period, the expanse within the Ili River Basin in Xinjiang where the NPP did not exhibit a significant change measured up to 766,411 km2, constituting approximately 78.95% of the total basin area. Conversely, the area with significant NPP changes amounted to 204,312 km2. Among these areas with notable alterations, the region demonstrating a significant increase in NPP covered 6338 km2, accounting for around 0.65%. The area with a highly significant NPP increase was 11,458 km2, representing approximately 1.18%. The area registering a significant decrease in NPP was 123,933 km2, making up roughly 12.77%, and the area with a highly significant NPP decrease was 62,584 km2, which was about 6.45%. The fact that NPP in the majority of regions remained insignificantly changed from 2000 to 2022 implies that the productivity of most vegetation in this area remained relatively stable, untouched by marked climatic or environmental shifts. The area with a significant NPP increase was 6338 km2, taking up 0.65% of the total area, while the area with a highly significant increase was 11,458 km2, accounting for 1.18%. This indicates that while NPP increased in some areas, the overall proportion was rather small. The area with a significant NPP decrease was 123,933 km2, accounting for 12.77%, and the area with a highly significant decrease was 62,584 km2, representing 6.45%. Evidently, within the areas experiencing significant changes, the area of NPP decrease far outweighed that of increase, suggesting that the overall vegetation productivity in this region was on a downward trajectory.

Diagram of NPP change trends (a) and proportion diagram of change types (b) in the Ili River Basin from 2000 to 2022. NPP: net primary productivity.
As can be seen from Figure 15(a) and (b), in the Ili River Basin, the area where the future NPP will continue to increase is 26,097.6 km², accounting for approximately 2.69%; the area where the NPP will continue to decrease is 77,676.8 km², accounting for approximately 8.00%; the area where the future NPP will change from increase to decrease is 95,262.4 km², accounting for approximately 9.81%; and the area where the NPP will change from decrease to increase is 771,683.2 km², accounting for approximately 79.50%. The NPP in most areas is expected to change from decrease to increase, indicating that the overall environmental conditions or management measures are improving. However, although the NPP in most areas is expected to improve, there is still 8.00% of the area where the NPP is expected to continue to decrease, and 9.81% of the area will experience a change from increase to decrease. At the same time, only 2.69% of the area is expected to have a continuous increase in NPP.

Diagram of future NPP change trends (a) and proportion diagram of future change types (b) in the Ili River Basin from 2000 to 2022. NPP: net primary productivity.
Discussion
The spatial distribution of grassland NPP in the Ili River Basin generally follows a pattern of higher values in the east compared to the west. High-NPP areas are primarily concentrated in the mountainous regions of the eastern basin, particularly in the northern and eastern parts of Nilka County, as well as in the northern and southern regions, including areas north of Zhaosu County and Tekes County, forming a semicircular distribution. In contrast, low-NPP areas are mainly located in the central basin, farther from the two banks of the Ili River, where towns are relatively concentrated. These include regions north of Qapqal Xibe Autonomous County and Gongliu County, as well as south of Yining City, Yining County, and Nilka County. Additionally, low-NPP values are observed in mountainous areas with relatively high altitudes, This conclusion is consistent with the understanding of the impact of terrain on NPP in other studies. 29
By analyzing the change trend of grassland NPP in the Ili River Basin from 2000 to 2022 over 23 years, it is found that the grassland NPP in the Ili River Basin generally shows a downward trend, with relatively low values in 2008, 2014, and 2021. Most scholars have studied the NPP of grasslands in Xinjiang during the period from 2000 to 2020, and the research results all indicate that the NPP of grasslands in Xinjiang shows an upward trend.30,31 Some scholars have also studied and shown that the NPP of grasslands in Xinjiang fluctuates greatly every year, and it generally showed a downward trend from 2001 to 2010. 32 Through this study, it is found that from 2000 to 2022, over a 23-year period, the grassland NPP in the Ili River Basin generally showed a fluctuating downward trend. Among them, the declines in grassland NPP in 2008, 2014, and 2021 were particularly obvious. Analysis of the years with declines revealed that climatic anomalies led to a significant decrease in grassland NPP across all administrative regions of Yili Prefecture. From 2000 to 2018 and even from 2000 to 2020, the overall NPP of grasslands in the Ili River Basin did show a slow upward trend. However, in 2021, according to the data released by the Xinjiang Meteorological Observatory, Xinjiang suffered the warmest February, the hottest July, the strongest cold wave, and extreme rainstorms in history. As a result, the NPP of Ili grasslands decreased significantly in 2021. Although there was some growth in 2022, the overall trend is still downward.
The NPP of nine types of natural grasslands shows a fluctuating downward trend, among which the temperate grassland has the most significant decline, while the alpine meadow shows almost no change. This indicates that temperature and precipitation have a greater impact on temperate grasslands, which is consistent with the research results of Ma and Sun.33,34
Through prediction, it is expected that in the future, the NPP of most areas in the Ili River Basin will change from decrease to increase, and the areas with continuous decrease and change from increase to decrease are relatively small. This trend indicates that the ecosystem of the river basin is undergoing structural improvement. The comprehensive effects of multiple environmental and socioeconomic factors behind this trend still need further exploration.
Climatic factors emerge as the predominant determinants governing the variations in the NPP of grasslands in the Yili region. Precipitation exerts a notably positive influence on the NPP of grasslands within the Yili River Basin, as clearly illustrated in Figures 7 and 8. Additionally, the positive impact of temperature on these grasslands far outweighs its negative effects. Research by Naeem 22 has demonstrated that vegetation across China exhibits a higher sensitivity to precipitation. Similar findings have also been reported in the studies by Zhu et al. 35
Through prediction, the NPP of most areas in the Ili River Basin is expected to shift from decrease to increase in the future, while the areas experiencing continuous decrease or transitioning from increase to decrease are relatively small. This trend indicates that the ecosystem of the basin is undergoing structural improvement. However, the combined effects of multiple environmental and socioeconomic factors underlying this change still require further investigation.
Human activities, on the other hand, also play a crucial part in the fluctuations of vegetation productivity. Some studies have indicated that human activities have a substantial bearing on the grasslands in Xinjiang, significantly influencing their productivity. Nevertheless, it is evident that the impact of climate change on vegetation NPP surpasses that of human activities.22,31
In the study on the spatiotemporal dynamic changes of natural grassland productivity and its influencing factors in the Ili River Basin of Xinjiang, the 2021 extreme climate event was incorporated from the temporal perspective, revealing the impact of short-term extreme weather on the long-term NPP trend. From the spatial perspective, the refined pattern of “higher in the east and lower in the west + semicircular high-value areas” was clarified. This study supplements the research on the “NPP trend in local areas of Xinjiang” and revises the one-sided perception that “Xinjiang's overall NPP shows an upward trend”; it also provides regional empirical evidence for “the impact of extreme climate on NPP” and enriches the research cases of “climate-vegetation relationships.” However, the current study still has limitations, such as insufficient spatial accuracy and the lack of a comprehensive analysis of the influencing factors of natural grassland NPP from multiple perspectives.
The Ili River Basin is the ecological core area of the Ili River Valley in Xinjiang and also an important animal husbandry base. Changes in its grassland NPP are directly related to regional ecological security (e.g. soil and water conservation in the river valley) and the sustainable development of animal husbandry. The research results can provide a scientific basis for the formulation of regional ecological protection policies. In the future, further research is needed to integrate multiple influencing factor indicators and analyze the impacts of different meteorological factors, human factors, and other elements on the vegetation coverage of natural grasslands from multiple aspects.
Conclusions
Ili River Basin grassland NPP shows a general east-high-west-low spatial pattern.
Grassland NPP in the Ili River Basin generally trended downward with fluctuations over 2000–2022 (23 years).
In the Ili River Basin, the area where precipitation and temperature positively correlate with grassland NPP is larger than the area with a negative correlation. Temperature is the primary factor driving regional NPP changes. Human activities have caused a large area of significant reduction in grassland NPP in the Yili River Basin, with a smaller area of increase.
Future NPP of most natural grasslands in the Ili River Basin is expected to shift from decreasing to increasing.
Footnotes
Acknowledgements
The authors sincerely thank the LAADS DAAC, the Chinese Tibetan Plateau Data Center, and the Xinjiang Meteorological Stations for their assistance in terms of data. The authros would also express our appreciation to the reviewers and the Academic Editors of Remote Sensing.
Authors’ contributions
Conceptualization was carried out by SL and XM; the research methodology was the responsibility of SL, CZ, and XL; the validation work was conducted by SL, YM, and MW; the formal analysis was carried out by SJ and ZH; the original draft was written by SL, XM, CZ, XL, YM, MW, and ZH; and the manuscript review and editing were undertaken by SL and XM All authors have read and agreed to the published version of the manuscript.
Funding
The authors disclosed receipt of the following financial support for the research, authorship, and/or publication of this article: This research was funded by a subproject (Project No.: 2022xjkk0400) under the Third Comprehensive Scientific Investigation Project of Xinjiang (Project No.: 2022xjkk04002).
Declaration of conflicting interests
The authors declared no potential conflicts of interest with respect to the research, authorship, and/or publication of this article.
Data availability statement
The MOD13Q1 dataset and related products can be accessed at the website https://ladsweb.modaps.eosdis.nasa.gov/. The monthly average temperature data set of the National Tibetan Plateau Data Center can be obtained through the website ![]() .
.