
Abstract
Currently, research on the effect of operating parameters and their optimization on the performance and cost-efficiency of NOx removal using active coke remains limited. Therefore, this study designs a simulation model using COMSOL software to analyze the denitrification process in a pipe packed with active coke particles. The effects of key operating parameters are investigated. The results indicate that, varying the temperature from 110°C to 150°C, the flow velocity from 3 to 5 m/s, the pipe length from 800 to 3000 mm, or the inlet NO concentration from 0.02 to 0.04 mol/m³, affects the denitrification efficiency by 42.23%, 19.39%, 43.6%, and 3.54%, respectively. In contrast, increasing the pipe diameter from 50 to 80 mm results in a negligible change of 0.41%, but directly increases the flue gas processing capacity from 0.0059 to 0.0151 m³/s. Additionally, a neural network-based predictive model is developed and trained using simulation results. A genetic algorithm is then applied to minimize operating costs and maintain effective denitrification. Key parameters, including temperature, flow velocity, and pipe length, are optimized, resulting in a reduction of operating costs by up to 25% while ensuring compliance with denitrification efficiency standards.
This is a visual representation of the abstract.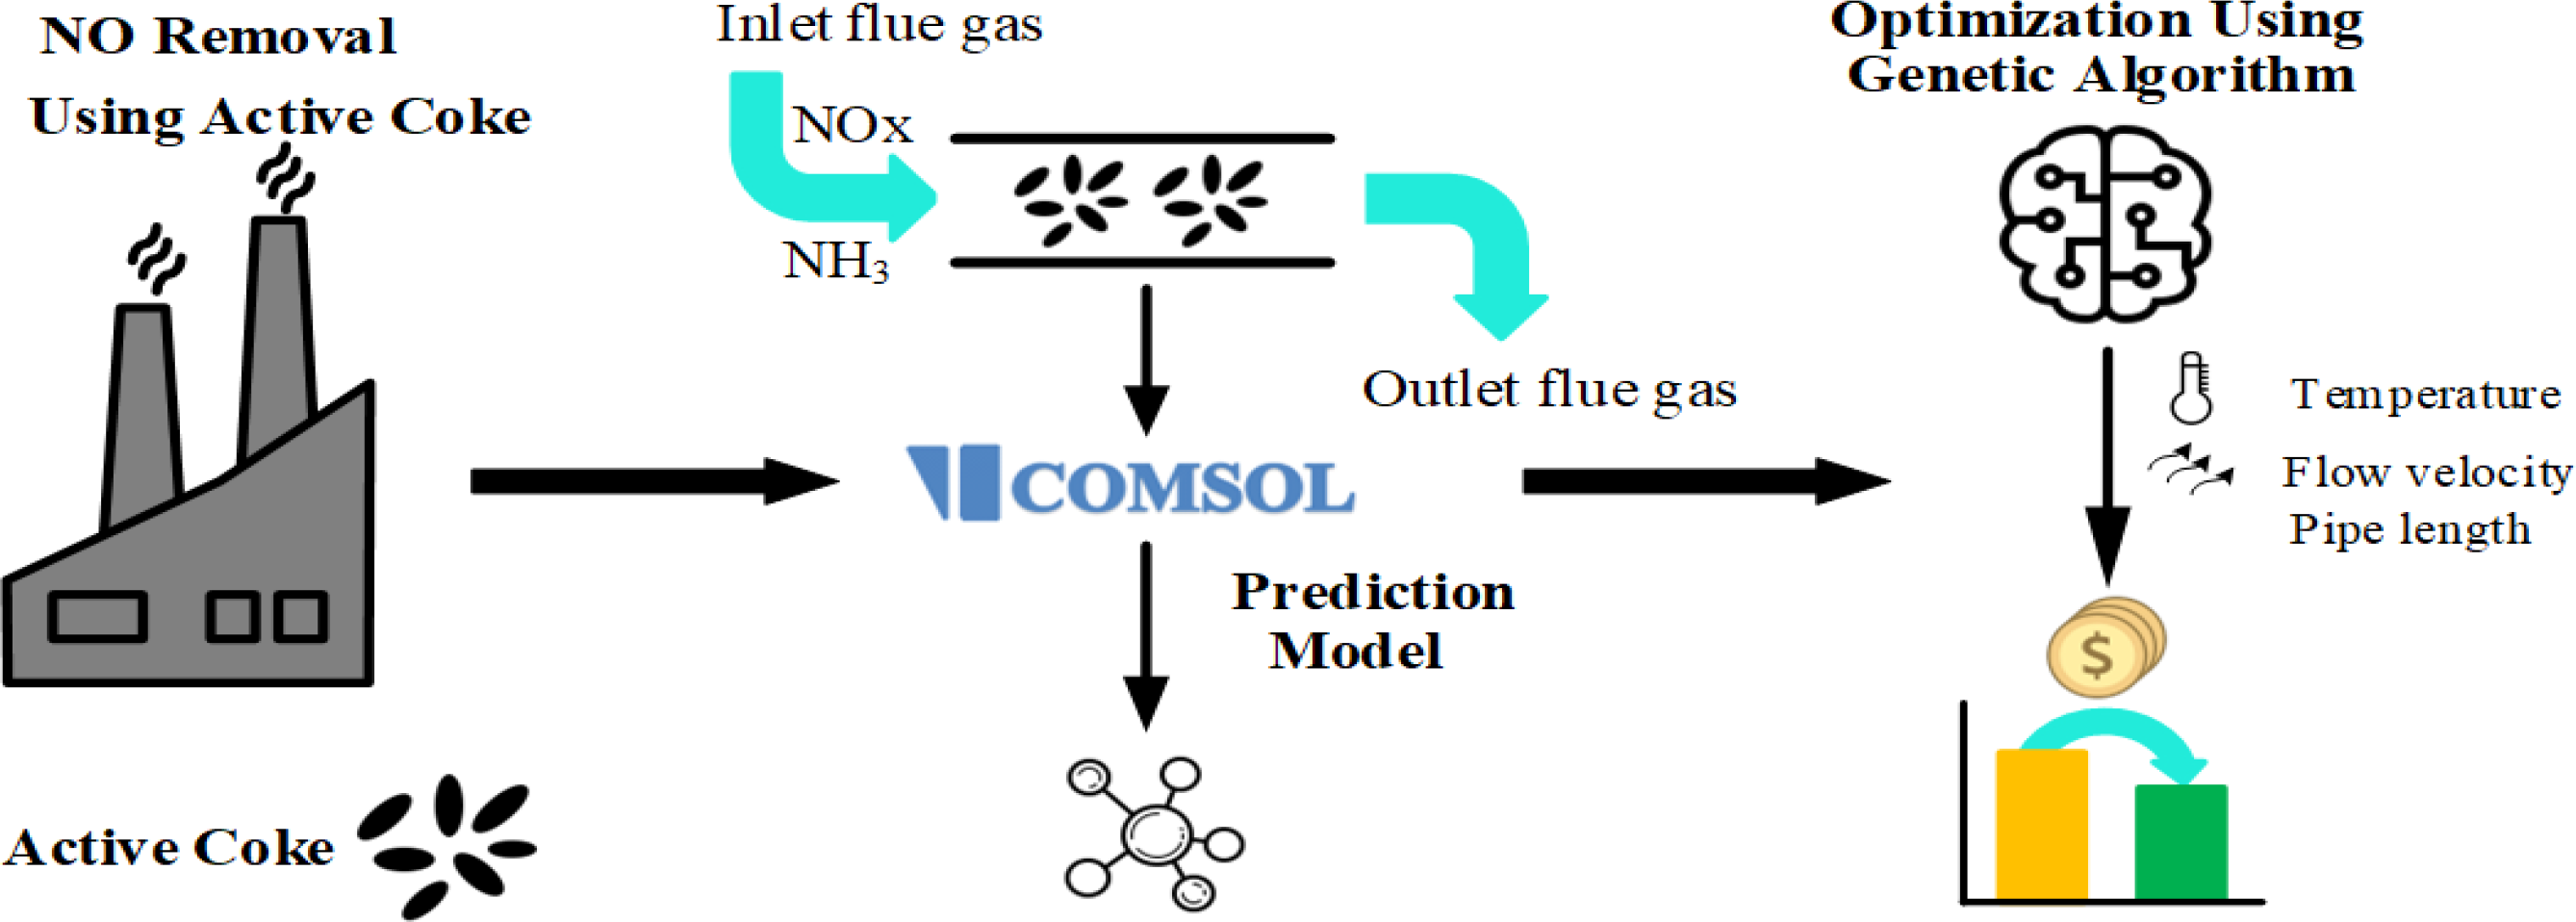
Highlights
NO removal using active coke particles was investigated via numerical simulations.
A neural network model was developed to predict denitrification efficiency.
Key operating parameters were optimized to enhance denitrification performance.
The optimization significantly reduced costs and maintained effective denitrification.
Introduction
Nitrogen oxides (NOx) are one of the major pollutants in industrial emissions.1–4 These oxides are chemically diverse5–7 and pose significant risks to both environment and human health. 8 Therefore, the control and reduction of NOx emissions remain a key challenge in environmental engineering and are crucial for achieving clean, sustainable development. Currently, NOx control techniques include selective catalytic reduction (SCR), 9 selective noncatalytic reduction (SNCR), alkaline absorption, acid absorption, O3 oxidative absorption, plasma activation, 10 active coke denitrification (ACD), 11 carbothermal reduction, 12 low-temperature plasma technology, 13 biological denitrification, 14 and photocatalytic oxidation. 15
In industrial NOx control, SCR, SNCR, and ACD are the main techniques adopted. SCR is a well-established flue gas denitrification method in which ammonia or urea solution is injected into the flue gas in the presence of a catalyst. This process facilitates the reduction of NOx into nitrogen and water. SCR achieves high denitrification efficiency (often exceeding 90%) and effectively operates at low temperatures (typically 250°C–400°C). SCR systems exhibit long catalyst lifespans (up to 2–3 years) and produce minimal toxic byproducts. However, SCR faces certain limitations, including high catalyst costs, significant operating and maintenance expenses, and the need for additional equipment to supply ammonia or urea solutions. Moreover, the presence of pollutants can impair catalyst performance in SCR, leading to variability in denitrification efficiency. In contrast, SNCR involves the direct injection of ammonia or urea solution into a high-temperature zone. The injected solution reacts with NOx in the flue gas, which reduces NOx to nitrogen and water. SNCR has low equipment and operating costs, requires no catalyst, and features simple operation. SNCR is easy to implement and maintain, making it suitable for high-temperature flue gas environments in coal-fired power plants. However, SNCR exhibits lower denitrification efficiency (typically 30%–60%) than SCR. Additionally, SNCR requires stable high flue gas temperatures (typically 850°C–1100°C) and may produce NOx during operation, potentially causing air pollution. 16 These limitations hinder the broader application of SNCR. ACD is an integrated flue gas purification technique that combines adsorption and catalytic properties to remove SO2 and NOx. ACD enables low-temperature denitrification, which significantly reduces energy consumption. Therefore, ACD is increasingly recognized as a promising technique for NO removal. 17
With the widespread application of the ACD technique in industrial flue gas purification, its economic performance has become a key research focus. Yang et al. 18 conducted a comparative study of two efficient NOx control methods (ACD and SCR). A cost-benefit analysis model was developed to assess the economic viability of typical systems using these techniques. The study provides insights into the specific effects of key factors, such as operating hours and material costs, on overall performance. Brozinčević et al. 19 focused on reducing costs in biological denitrification using conventional and alternative carbon sources. The study systematically investigated the use of different organic carbon sources (e.g. wood chips and corn cobs) in the denitrification process and comparatively analyzed their cost-effectiveness. Yang 20 estimated the initial investment for flue gas denitrification techniques using active coke and limestone-gypsum. Moreover, operating costs were calculated based on raw material and product prices in China. The economic performance of active coke and limestone-gypsum denitrification was compared and analyzed across different usage periods. Wu et al. 21 investigated cost reduction and resource recovery strategies through cross-flow adsorption of active coke, optimization of waste heat recovery, regeneration gas treatment, and high-temperature regeneration techniques. These methods contributed to the reduction of ACD costs. Liu 22 designed equipment to further reduce ACD costs by integrating resource recycling, automated control, and optimized adsorbent materials into a streamlined system. Chen et al. 23 simplified the desulfurization and denitrification process by combining dedusting, cooling, ammonia injection, and adsorption regeneration functions into a single unit, thereby reducing equipment complexity and cost.
However, current studies have not sufficiently investigated the complex interactions among key operating parameters, including temperature, flow velocity, pipe length, and inlet conditions. Yang et al. 18 compared the economic performance of two different denitrification technologies. Similarly, Yang 20 estimated the initial investment costs for flue gas denitrification technologies using activated coke and limestone-gypsum processes, and calculated operating costs based on prevailing Chinese prices for raw materials and products. Brozinčević et al. 19 focused on the selection of carbon sources. Moreover, Wu et al., 21 Liu, 22 and Chen et al. 23 proposed methods to reduce costs. While numerous studies have been conducted on the economic evaluation of ACD technologies, further research is still required to investigate the effects of operating parameters on both denitrification performance and operating costs, as they are critical for optimizing the ACD technique and maximizing its economic benefits.
In recent years, numerical simulations and machine learning techniques have proven highly effective in addressing complex optimization challenges in denitrification processes. For example, a genetic algorithm-optimized Back Propagation neural network was used to design catalyst volume in an SCR system. The model, trained on operational data under different operating conditions, accurately predicted the required catalyst volume for efficient SCR operation. 24 Additionally, neural network-based predictive control methods have been applied to monitor and regulate NOx emissions in power plant tail gas. Ammonia injection was regulated through model calibration and predictive control strategies to meet emission standards, reduce ammonia consumption, and minimize ammonia slip. These measures improved the economic efficiency of the NOx control system. 25
Genetic algorithms have been used to optimize operating parameters in SCR systems. For example, a combination of neural networks and genetic algorithms was used to predict the control structure and optimize catalyst volume for ammonia injection control. Simulation results revealed that this combined approach can reduce denitrification costs, adapt to a wide range of boiler conditions, and ensure compliance with emission standards. 26 Additionally, ultra-low-temperature (<150°C) SCR denitrification technology has emerged as a key research focus. Although China has developed SCR systems and corresponding catalysts with good performance in the 180°C to 420°C range, further advancements are needed to ensure effective operation at lower temperatures. Ultra-low-temperature SCR denitrification systems can be installed downstream of the dust remover and desulfurization tower owing to their simpler flue gas composition, lower energy consumption, and reduced retrofit costs. 27 Therefore, the low-temperature operation of ACD provides a distinct advantage.
Overall, despite advancements in ACD technology, numerical simulation, machine learning techniques, and the application of genetic algorithms in the denitrification process, existing studies still lack a comprehensive optimization of operating parameters and evaluating their combined impacts on denitrification and economic performance. This study aims to address these gaps by constructing a denitrification model for active coke packed beds, analyzing the influence of key operating parameters on denitrification efficiency, and using neural network prediction models and genetic algorithms to optimize operating parameters, thereby maximizing the economic performance of denitrification technology.
First, a denitrification model is developed using COMSOL software to simulate flue gas flow through a pipe filled with active coke. The effects of key operating parameters on ACD system performance are analyzed. The resulting large dataset is used to train a neural network predictive model. Moreover, an economic assessment model is constructed to evaluate the operating costs of the denitrification process. Finally, the predictive model, economic assessment model, and genetic algorithm are integrated to optimize the configuration of operating parameters and maintain high denitrification efficiency.
The article is structured as follows: first, the COMSOL model, neural network predictive model, genetic algorithm, and economic assessment model are introduced. Subsequently, the effects of key operating parameters—pipe diameter, temperature, flow velocity, pipe length, and inlet NO concentration—on denitrification performance are analyzed. The neural network predictive model is developed and validated. Optimal operating parameters are identified under different conditions using a cost-minimization objective, ensuring compliance with NO emission limits in the outlet flue gas. Finally, the main conclusions of the study are summarized.
Methodology
ACD simulation
In the ACD simulation, only NO is considered the target product. NO in the flue gas is first adsorbed onto the surface functional groups of the active coke. In the presence of active coke as a catalyst, NO undergoes a redox reaction with ammonia and oxygen, forming nitrogen and water. The oxygen required for this reaction is supplied by the flue gas. Before the flue gas enters the active coke reactor, ammonia is injected into the flue gas stream to ensure thorough mixing of the reactants.
28
In this study, the ACD process is numerically simulated using COMSOL Multiphysics software. The chemical reaction
29
for NO removal is as follows:

A pipe packed with active coke serves as the reactor. The pipe (Figure 1) has a standard nominal diameter D and a length L. The flue gas, containing NO and mixed with ammonia, flows into the pipe at the left end and exits at the right end. The inlet NO concentration is denoted as Cin, and the simulated outlet NO concentration is denoted as Cout, sim.

Schematic of the denitrification pipe.
The denitrification pipe (Figure 1) is packed with spherical active coke particles, with a radius r of 4.5 mm. 30 These particles are randomly arranged using a distribution algorithm that assigns coordinates (x, y) to form a packed bed of active coke (Figure 2).

Schematic of the randomly distributed active coke bed.
During the random placement of active coke particles, ensuring spatial separation and complete confinement of the particles within the reactor boundaries is crucial. The specific constraints are as follows:

A two-dimensional (2D) model is developed in COMSOL Multiphysics 6.2 software using the free and porous media flow, dilute species transport, and multiphysics coupling modules. In this model, free and porous media flow is analyzed under steady-state conditions. The dilute species transport and multiphysics coupling are simulated through transient analysis. 31 The parameters used in the COMSOL simulations are fully specified in reference, 29 including the physical model settings, material properties, boundary conditions, and meshing strategy.
Simulations are conducted to investigate the effects of inlet flow velocity, inlet NO concentration, temperature, 32 pipe diameter, 33 and pipe length on denitrification performance. The specific parameter ranges are shown in Table 1.
Simulation parameter ranges.

After simulation, the outlet NO concentrations are obtained from data extracted along the centerline defined in the 2D model 31 (Figure 3).

Schematic of the centerline path.
The centerline is positioned between the midpoints of the inlet and outlet of the denitrification pipe and is aligned with the pipe axis (Figure 3). This alignment is oriented in the direction of flue gas flow, enabling detailed observation of NO concentration distribution. Therefore, variations in NO concentration during denitrification can be further analyzed.
Neural network models
The MATLAB Neural Network Toolbox is widely used by researchers and engineers to develop advanced models. The toolbox provides a comprehensive set of modules, including feedforward neural networks, radial basis function networks, and deep neural networks, making it suitable for various applications. 34 Notably, MATLAB neural network fitting models are effective for modeling nonlinear and multidimensional input–output systems. 35 Additionally, MATLAB Deep Learning Toolbox extends its functionality to support the efficient construction of advanced neural network architectures, such as convolutional neural networks and recurrent neural networks. These architectures provide strong technical support for addressing complex issues. 36
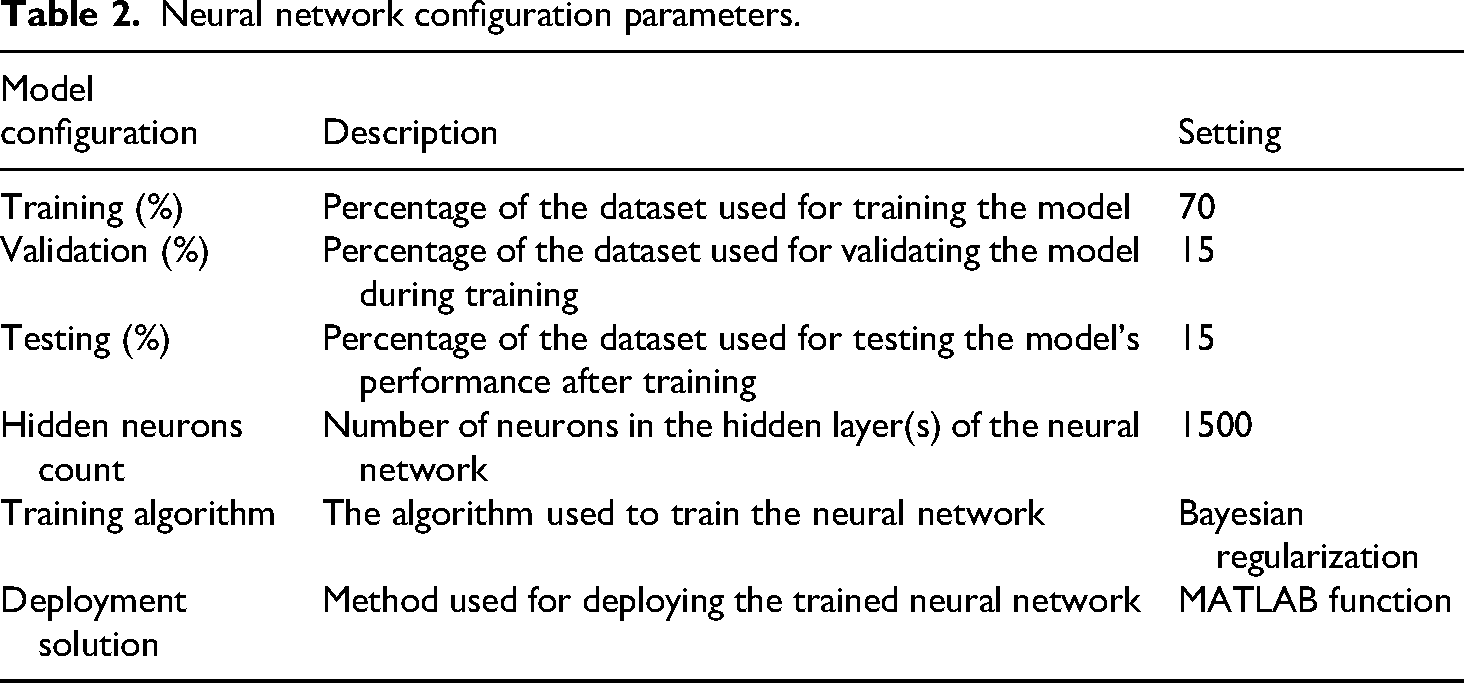
In this study, a predictive model for outlet NO concentration was developed using the Neural Network Fitting Toolbox in MATLAB R2018a. A large amount of training data was generated from simulations conducted in COMSOL software. The model (Figure 4) utilizes a feedforward neural network architecture trained using the backpropagation algorithm, the specific parameters of which are shown in Table 2. To improve prediction accuracy, the number of hidden layers and neurons in the network was carefully optimized. During training, the dataset was split into three subsets: 70% for training, 15% for validation, and 15% for testing. This data partitioning ensured the generalization ability and predictive performance of the model.

Schematic of the neural network model.
Neural network configuration parameters.
Genetic algorithm optimization
The MATLAB Genetic Algorithm Toolbox is widely used in optimization research. The toolbox provides core genetic algorithm operations (such as population initialization, selection, crossover, and mutation) and supports custom fitness function design for adaptable optimization. 37 Owing to its flexibility, the toolbox is effective for solving complex, high-dimensional, nonlinear optimization tasks. 38 MATLAB genetic algorithms are recognized for their global optimization capability, scalability, and computational efficiency. 39 These algorithms have been widely used in engineering optimization, 40 chemical process optimization, 41 computer simulation, and modeling. 42 With continuous advancements in computational technologies and algorithm theory, genetic algorithms exhibit strong potential for addressing complex optimization challenges, particularly in machine learning, data mining, and big data analysis.43,44
In this study, the outlet NO concentration is limited to a maximum of 50 mg/m³ (equivalent to 0.00167 mol/m³ denoted as Cstd) according to the national emission standard. 45 Given pipe diameters and inlet NO concentrations, a MATLAB-trained neural network model optimized with a genetic algorithm is used to determine the optimal temperature, inlet flow velocity, and pipe length. Additionally, the operating parameters are optimized to ensure a cost-effective ACD process. The specific parameters used in the genetic algorithm are listed in Table 3. Figure 5 shows the genetic algorithm optimization process through an intuitive flowchart, which outlines the key steps to achieve this goal.

Overview of the genetic algorithm optimization process.
Genetic algorithm configuration parameters.

The operating parameters of the denitrification system were optimized using a genetic algorithm to minimize the hourly operating cost (P) and the cost per unit mass of processed flue gas (P′). The optimization variables include the operating temperature (T), inlet flow velocity (v), and pipe length (L). The objective function and constraints are presented below:
1. Hourly cost of active coke supply (P1) 2. Hourly heating cost of active coke P21 3. Hourly heating cost of flue gas P22 4. Hourly operating cost of the fan P3 5. Penalty cost for exceeding emission standards P4 6. Total hourly operating cost P 7. Cost per unit mass of processed flue gas P′ 8. Constraints
where A represents the cross-sectional area of the pipe (m²), calculated as A = 
where h denotes the heat transfer coefficient between the pipe reactor and the environment (W/(m²·K)), which is set to 18 W/(m²·K) for a 50 mm diameter pipe and 16.5 W/(m²·K) for an 80 mm diameter pipe. Pelec signifies the industrial electricity price (0.725 CNY/kWh), T represents the operating temperature (°C), and T1 indicates the ambient temperature (25°C). ƞ1 denotes the efficiency of electromagnetic heating (95%). cFeMn represents the specific heat capacity of the active coke (1.1 kJ/(kg·K)), MFeMn, sup denotes the mass of active coke replenished per hour (kg), and ρFeMn signifies the density of the active coke (800 kg/m³). The hourly replenished mass is calculated as: MFeMn,sup = ρFeMn·A·L·RFeMn.

where v denotes the flow velocity of the flue gas (m/s), ρAir represents the density of the flue gas (1.293 kg/m³), and cAir represents the specific heat capacity of the flue gas (1.006 kJ/(kg·K)).

where Pfan denotes the fan wind pressure (15 kPa) and ƞ2 indicates the fan efficiency (80%).

where max denotes the maximum value function, ensuring the penalty remains non-negative, Cout, pred represents the NO concentration in the flue gas at the outlet after denitrification, which is predicted using a neural network model (mol/m³), calculated as Cout, pred = myNeuralNetworkFunction ([T, D, L, Cin, v]), and Cstd denotes the NO emission standard (mol/m³). MNO indicates the molecular weight of NO, and Pfine signifies the penalty cost per mass of NO. In this study, Pfine is set to 10,000 CNY/kg to highlight the economic impact of exceeding emission limits and promote compliance with environmental standards.

where P represents the total hourly operating cost, consisting of the hourly cost of active coke supply P1, the hourly heating cost of active coke P21, the hourly heating cost of flue gas P22, the hourly operating cost of the fan P3, and the penalty cost for exceeding emission standards P4.

Where P′ represents the cost per unit mass of processed flue gas, calculated as the total hourly operating cost P divided by the hourly flue gas treatment volume.

The constraints related to the genetic algorithm are presented in Table 4.
Optimization constraints for the genetic algorithm.

COMSOL simulation and neural network training
Validation of COMSOL simulation
Experimental verification of simulation results
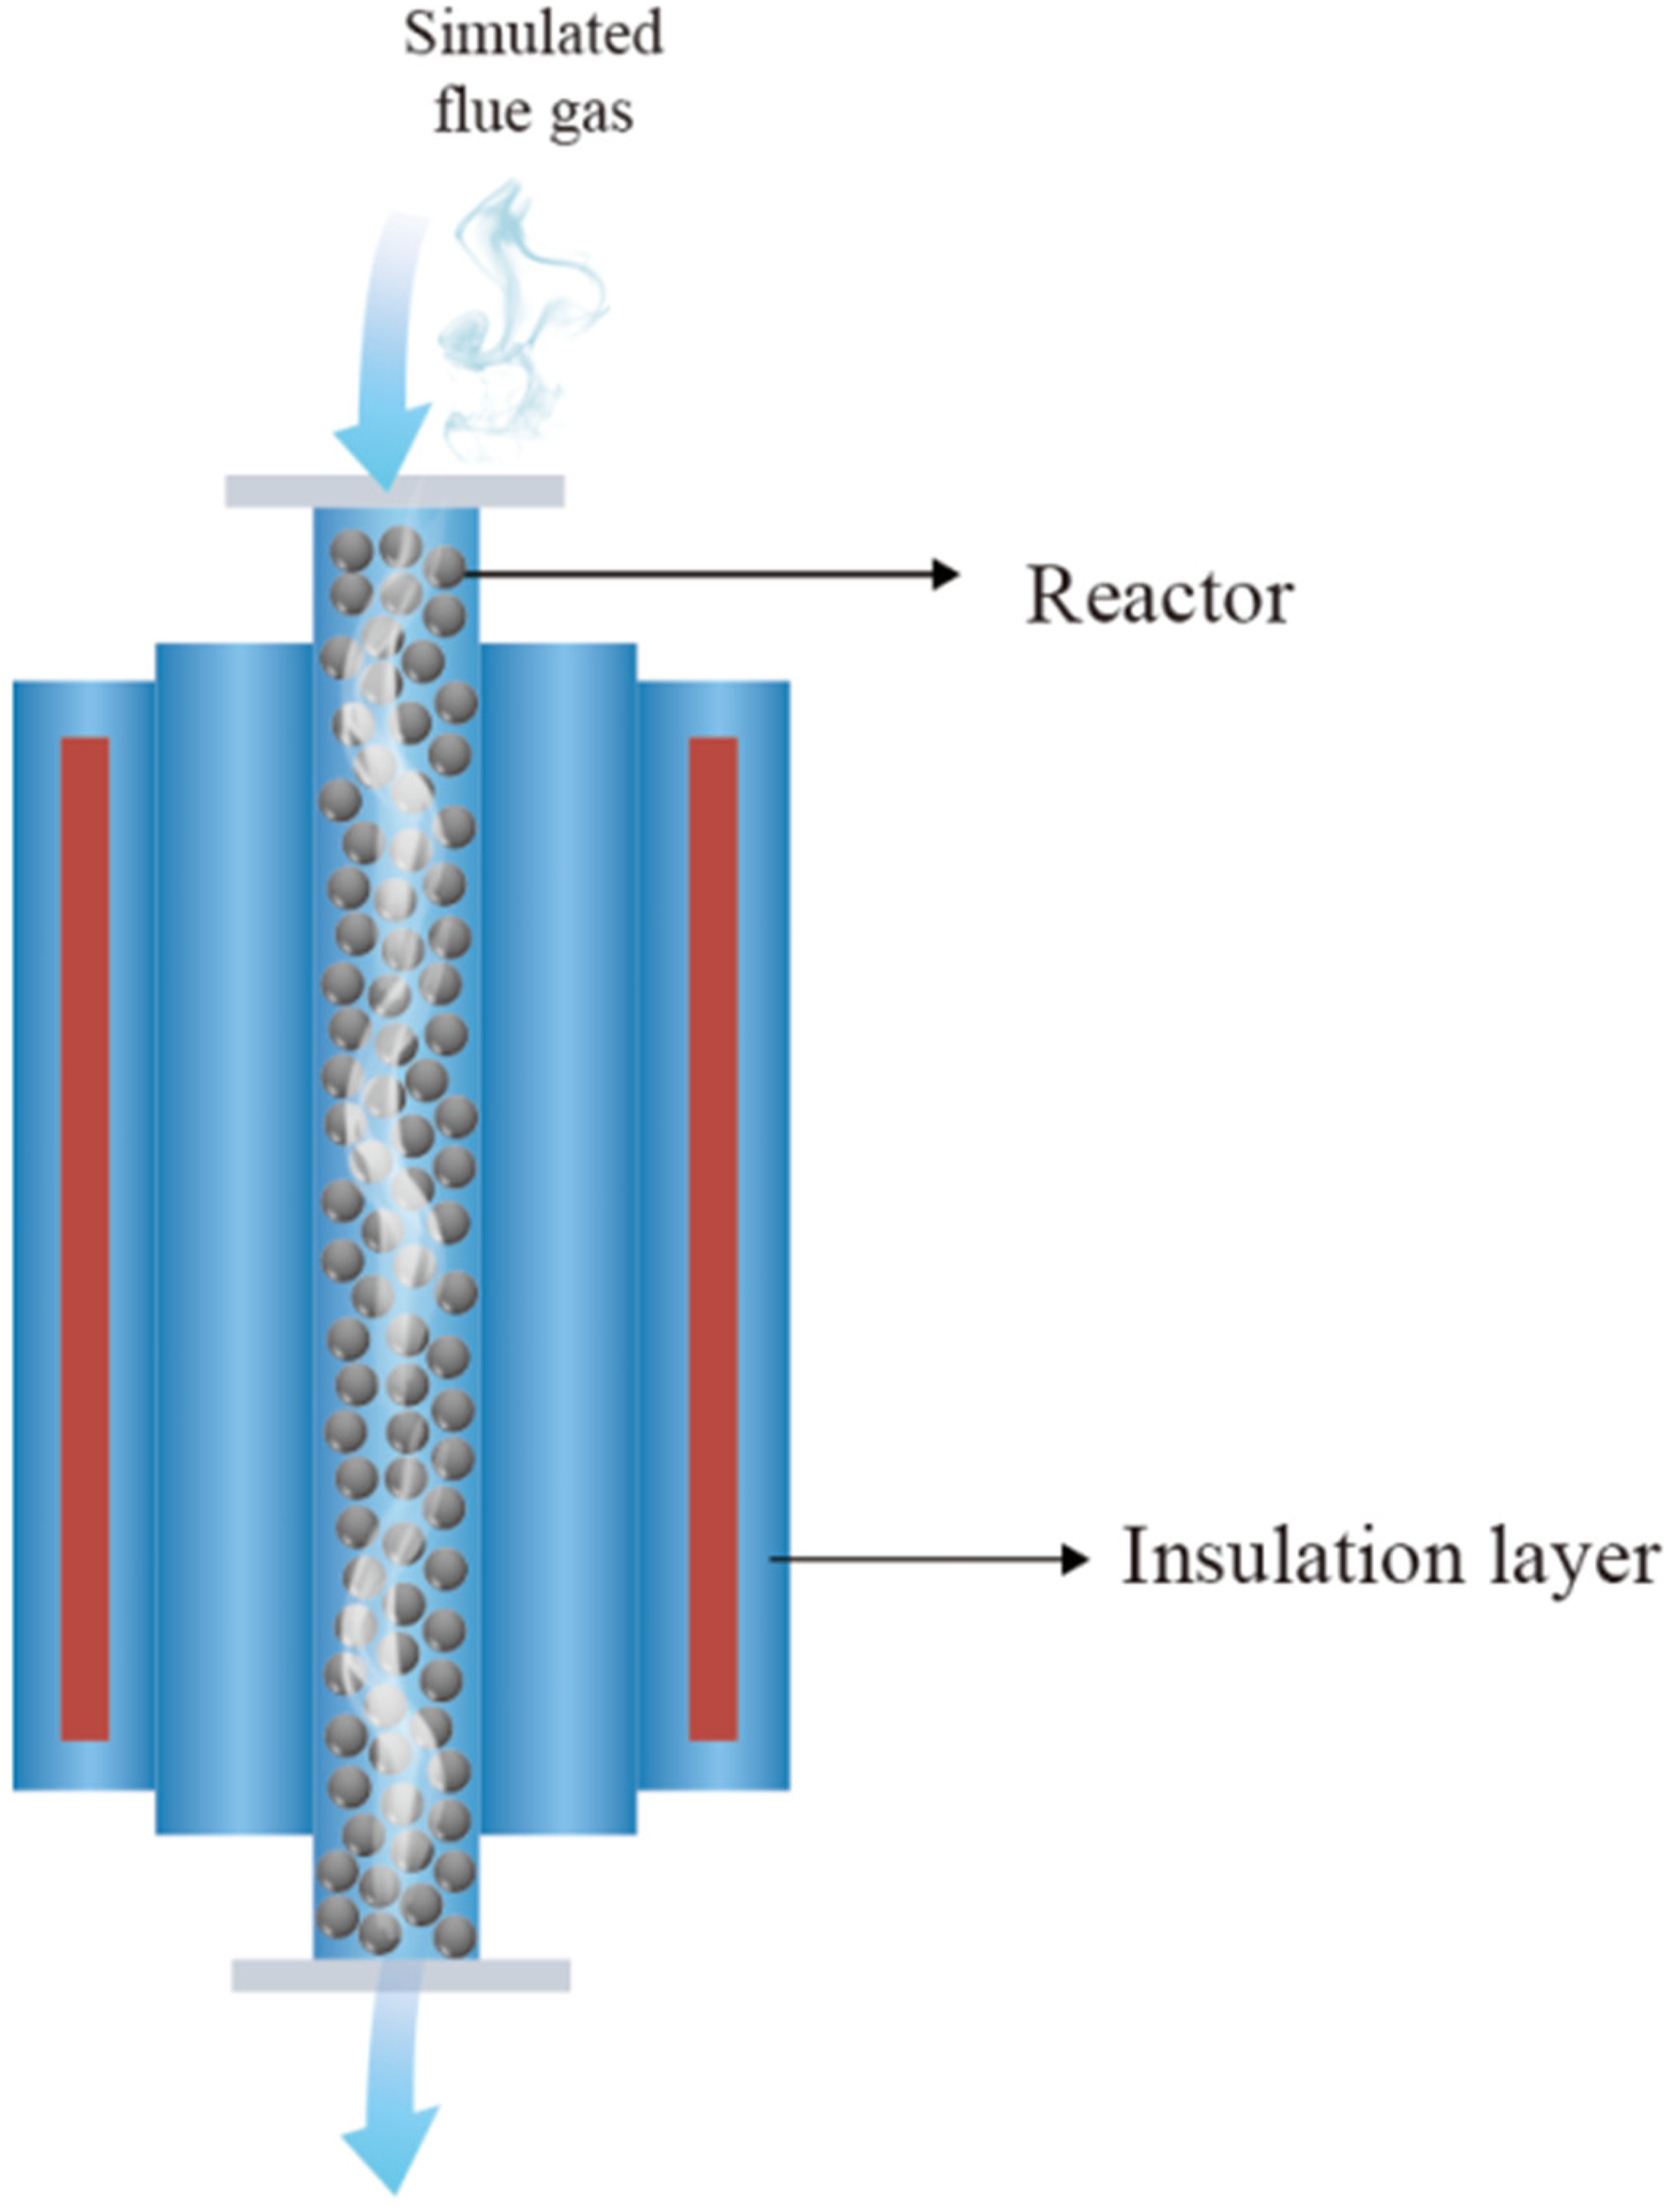
To confirm the reliability of the COMSOL simulation model, a fixed-bed reactor model was developed (Figure 6) to replicate the experimental setup in Figure 7. 46 In the simulation, spherical active coke particles with a diameter of 10 mm were packed into a cylindrical pipe. Although the reference study used columnar active coke particles, their height was not specified. Therefore, spherical particles of equivalent diameters (10 mm) were used to ensure consistency. The geometric configuration and boundary conditions of the model were defined as follows: the fixed bed had a height of 50 cm and a diameter of 2 cm, and the reaction was conducted at 130°C. A simulated flue gas mixture containing NH₃, NOx, O₂, and H₂O entered from the top of the reactor and exited from the bottom. The gas flow rate was maintained at 2 L/min, and the reaction proceeded continuously for 1 hours.

Geometric model of the fixed-bed reactor.
Schematic of the experimental setup. 46
To comprehensively validate the reliability of the COMSOL simulation model, this study examined two key operating conditions: oxygen concentrations (0%, 1%, 2%, 3%, 4%, 6%, 8%, 10%, and 12%) and volumetric flow rates (1, 2, and 4 L/min). Simulation results were directly compared with experimental data to assess accuracy. Figure 8 presents the denitrification efficiency of active coke across the different oxygen concentrations, while Table 5 summarizes the corresponding results for varying volumetric flow rates.

Denitrification efficiency of active coke at different oxygen concentrations.
Denitrification efficiency of active coke at different volumetric flow rates.
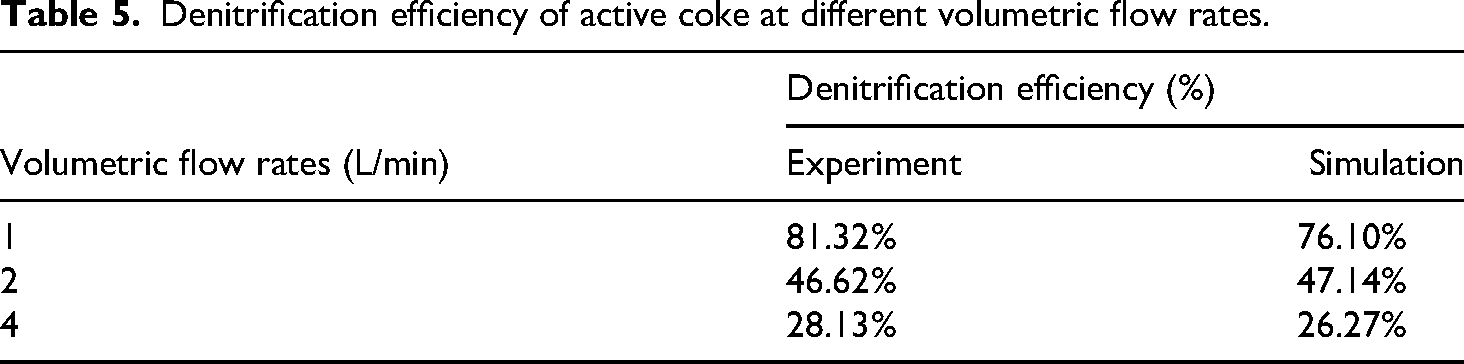
The simulation results agree well with the experimental data (Figure 8 and Table 5), indicating that the developed denitrification model can reliably predict the denitrification efficiency of active coke. It should be noted that a noticeable deviation occurs when the oxygen concentration exceeds 8%, whereas the oxygen concentration used in the subsequent part of this study is set at 5%, under which the model demonstrates good consistency. These results confirm the reliability and applicability of the model under specific operating conditions, thereby providing a foundation for further in-depth studies.
Comparative analysis of 3D and 2D model simulations
To evaluate the impact of dimensionality on simulation accuracy, this study systematically compared the denitrification efficiency simulated by three-dimensional (3D) and two-dimensional (2D) numerical models under baseline conditions. These conditions encompasses a temperature of 120°C, a flow velocity of 3 m/s, a pipe length of 3000 mm, inlet NO concentrations of 0.02 and 0.04 mol/m³, and pipe diameters of 50 and 80 mm. Given that actual industrial flows typically exhibit pronounced 3D characteristics, the comparison is essential. The detailed comparative results are listed in Table 6.
Comparison of denitrification efficiency simulations between 3D and 2D models.

2D: two-dimensional; 3D: three-dimensional.
Based on the results shown in Table 1, the denitrification efficiencies obtained by the 2D and 3D models are fairly close. However, the 2D model demonstrated significantly higher computational efficiency. Given that genetic algorithms inherently rely on extensive simulation data for predictive model training, the 2D numerical model was ultimately selected to optimize computational resources and improve efficiency.
Analysis of simulation results
Simulations were conducted using the established model. Figure 9 shows the simulated distribution of NO concentration in the pipe during denitrification. In the simulation, the pipe has a diameter of 50 mm and a length of 3000 mm. The inlet flue gas has a flow velocity of 3 m/s with an initial NO concentration of 0.02 mol/m³. The temperature within the pipe is uniformly maintained at 120°C. As the flue gas flows through the pipe, the NO concentration gradually decreases along the flow direction owing to the catalytic activity of active coke treated with an iron–manganese catalyst. Therefore, the NO concentration in the outlet flue gas is significantly lower than that in the inlet flue gas, indicating effective NO removal. The outlet NO concentration is 0.000766 mol/m³, which is below the emission standard of 0.00167 mol/m³. Despite the effectiveness of the denitrification process, its performance is influenced by several operating parameters. Therefore, the effects of pipe diameter, temperature, flow velocity, pipe length, and the inlet NO concentration on the outlet NO concentration were further analyzed.
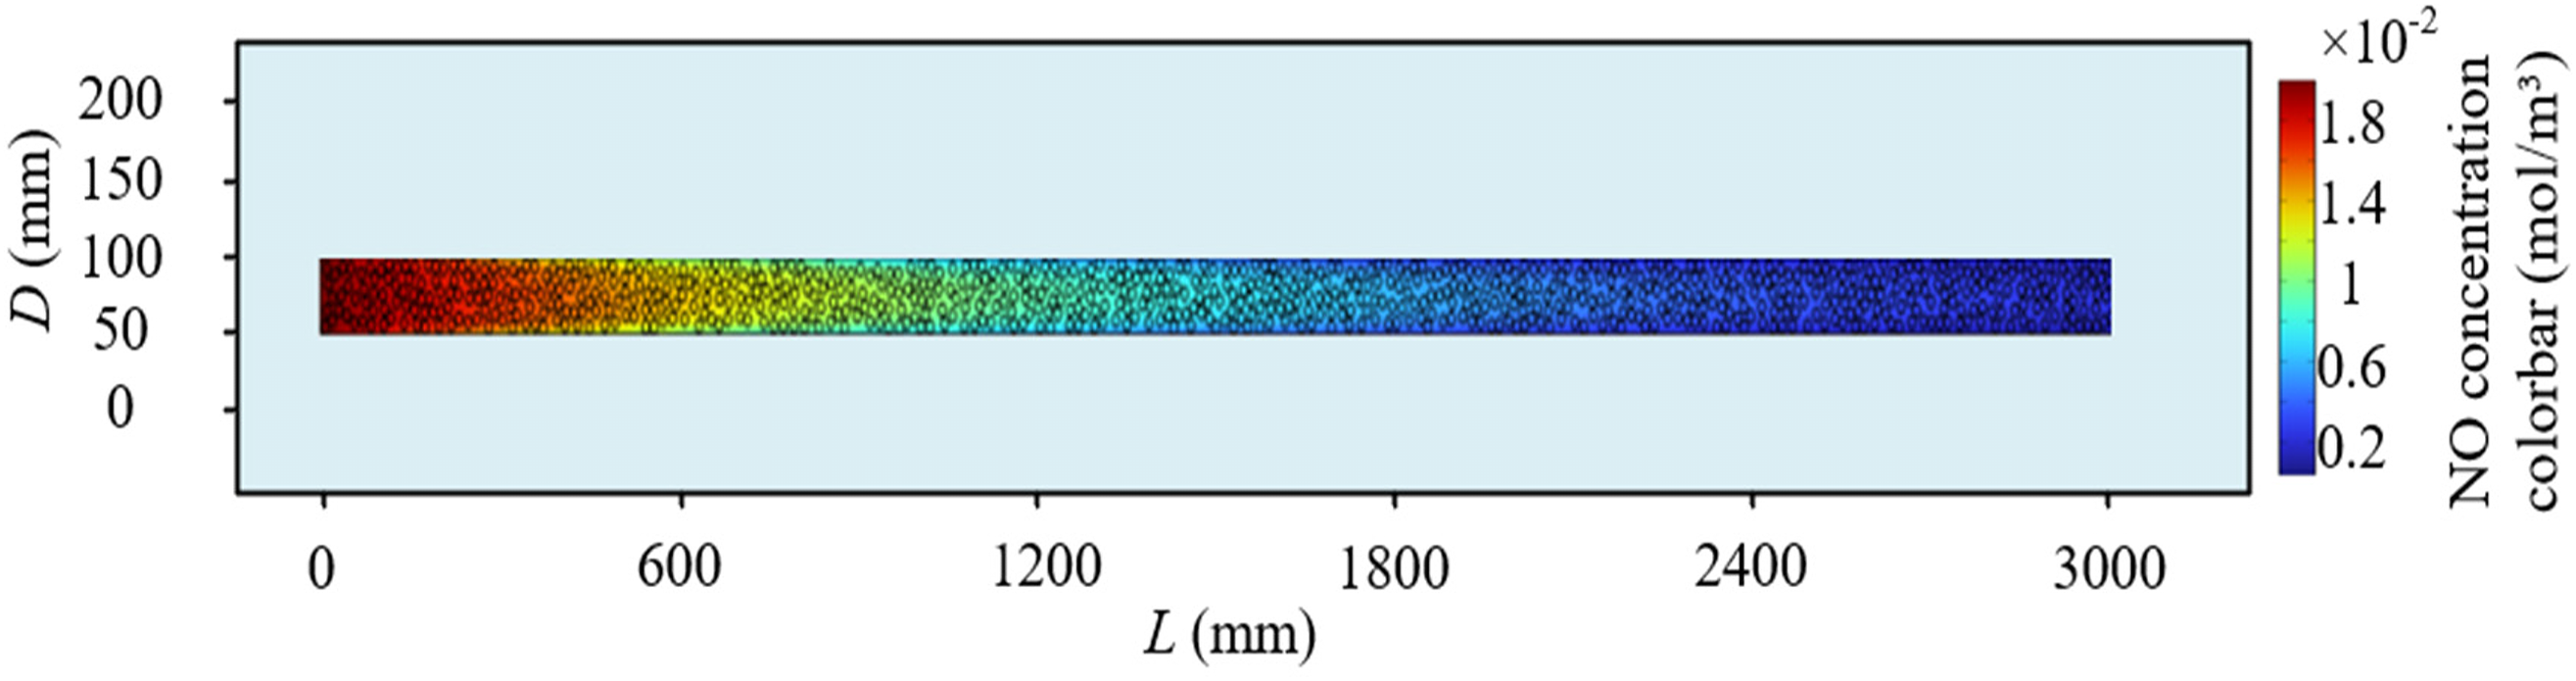
Simulated distribution of NO concentration.
Effect of pipe diameter on the outlet NO concentration
According to standard pipe production specifications, two pipe diameters (50 and 80 mm) were selected for analysis. Simulations were performed at a temperature of 120°C, with an inlet NO concentration of 0.02 mol/m³, a pipe length of 1100 mm, and a flow velocity of 3 m/s. The outlet NO concentration was determined from the endpoint value along the pipe centerline. Simulation results for both pipe diameters are shown in Table 7. As all other conditions are held constant, increasing the pipe diameter does not significantly affect the outlet NO concentration but results in a larger total flue gas volume. This finding can be attributed to the fact that the NO conversion reaction is primarily controlled by the concentration of reactants, the activity of the catalyst, and reaction kinetics, all of which are relatively insensitive to changes in pipe diameter. However, an increase in pipe diameter leads to a larger pipe cross-sectional area. At the same flow velocity, the total flue gas volume passing through the pipe per unit time significantly increases.
Effect of pipe diameter on the outlet NO concentration.

If the total flue gas volume remains constant, a large pipe diameter reduces the flow velocity, which increases the residence time and results in a lower outlet NO concentration (Table 7). According to the principles of reaction kinetics, a longer residence time provides more opportunities for NO to react with active coke, thereby promoting the reaction and reducing the outlet NO concentration. Moreover, the increase in pipe diameter directly affects the amount of active coke required. A larger pipe cross-sectional area means more flue gas to be treated, which in turn requires more active coke to maintain the same NO conversion efficiency. Meanwhile, the energy consumption also increases as more energy is needed to maintain the reaction conditions, for the increased volume of flue gas. Therefore, the pipe diameter not only affects the NO conversion efficiency but also the economic viability and energy consumption of the system. Based on these factors, comprehensive optimization with different nominal diameters will be conducted to balance treatment efficiency and cost-effectiveness.
Effect of temperature on the outlet NO concentration
The effect of temperature on the outlet NO concentration was investigated through simulations. The model parameters included a pipe diameter of 50 mm, an inlet NO concentration of 0.02 mol/m³, a pipe length of 1100 mm, and a flow velocity of 3 m/s. Simulations were conducted at 110°C, 115°C, 120°C, 125°C, 135°C, and 150°C. The results are shown in Figure 10.
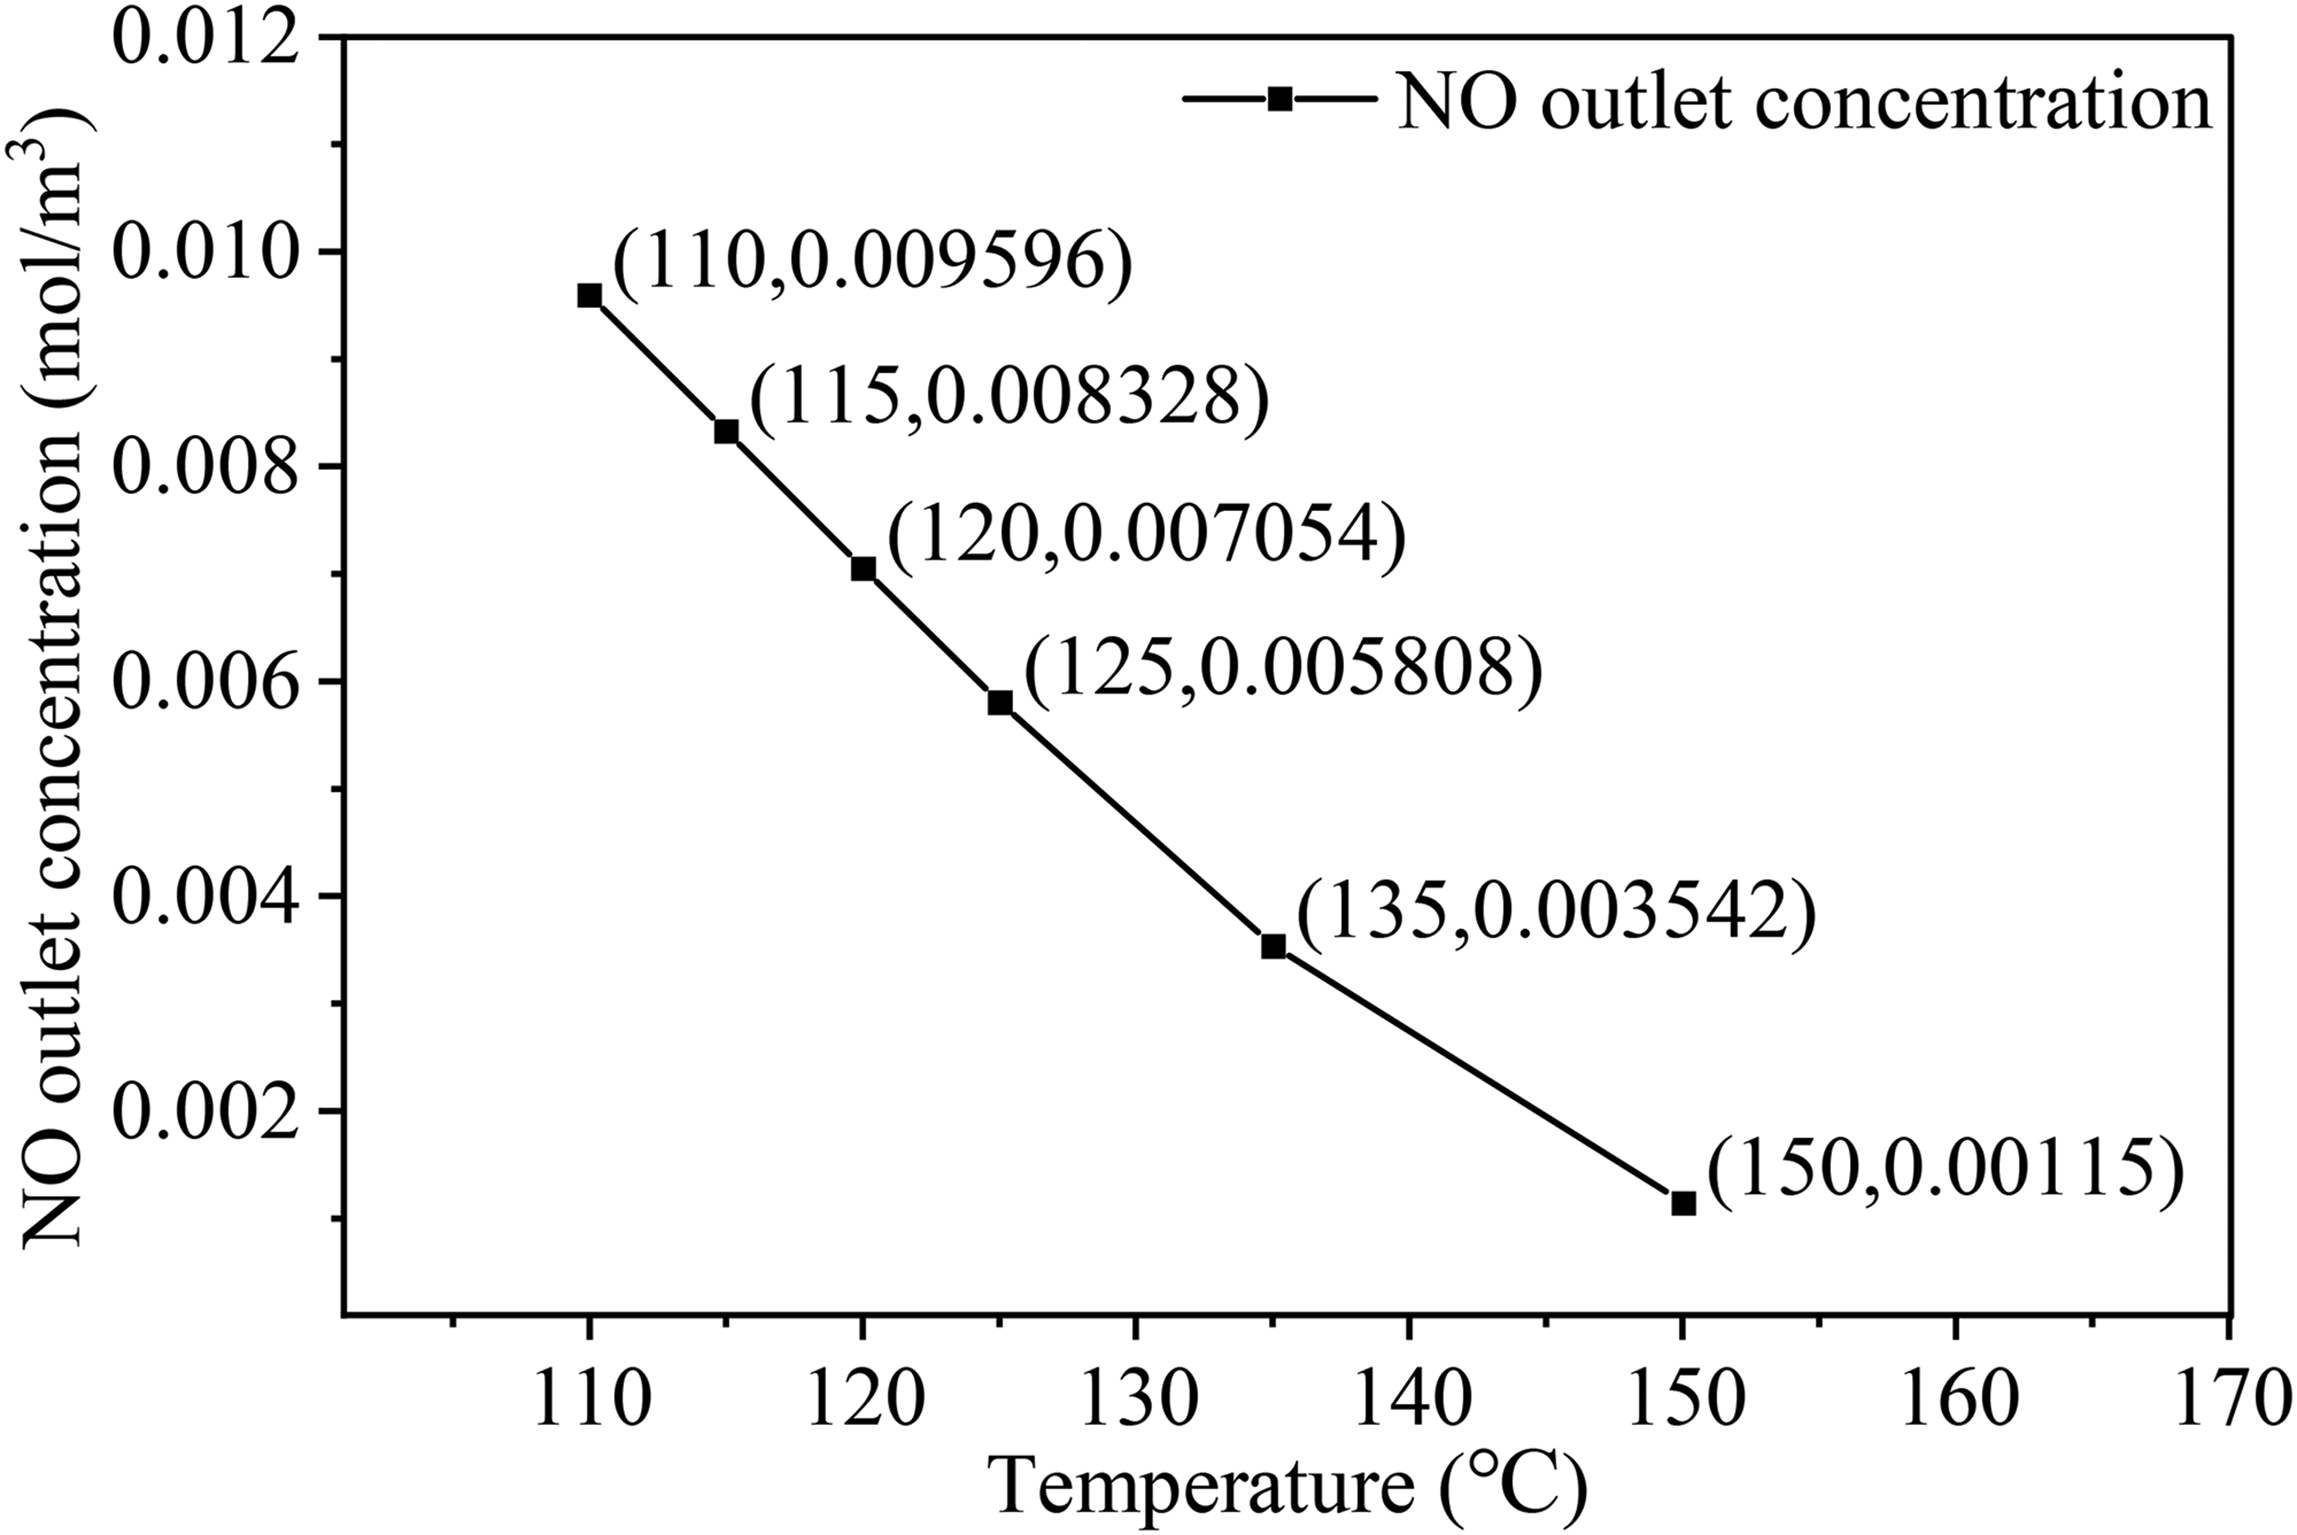
Effect of temperature on the outlet NO concentration.
The data in Figure 10 indicate a significant decrease in the outlet NO concentration with increasing temperature. In the ACD process, this trend is mainly attributed to the enhanced surface activity of active coke at higher temperatures. Higher temperatures promote the development of pore structure and increase the activity of surface active sites, thereby accelerating NO adsorption and reduction. Additionally, increased temperatures enhance the denitrification reaction kinetics, leading to more efficient NO conversion. Moreover, higher temperatures facilitate more effective contact between the reductant and NO molecules, which improves gas diffusion and further promotes the reaction. Consequently, the denitrification performance of active coke is significantly enhanced with increasing temperature, reflected by the continuous decrease in outlet NO concentrations.
Effect of flow velocity on the outlet NO concentration
The effect of flow velocity on the outlet NO concentration was analyzed using a pipe diameter of 50 mm, an inlet NO concentration of 0.02 mol/m³, a temperature of 120°C, and a pipe length of 1100 mm. Figure 11 presents the simulation results at flow velocities of 3, 3.4, 3.8, 4.2, 4.6, and 5 m/s.
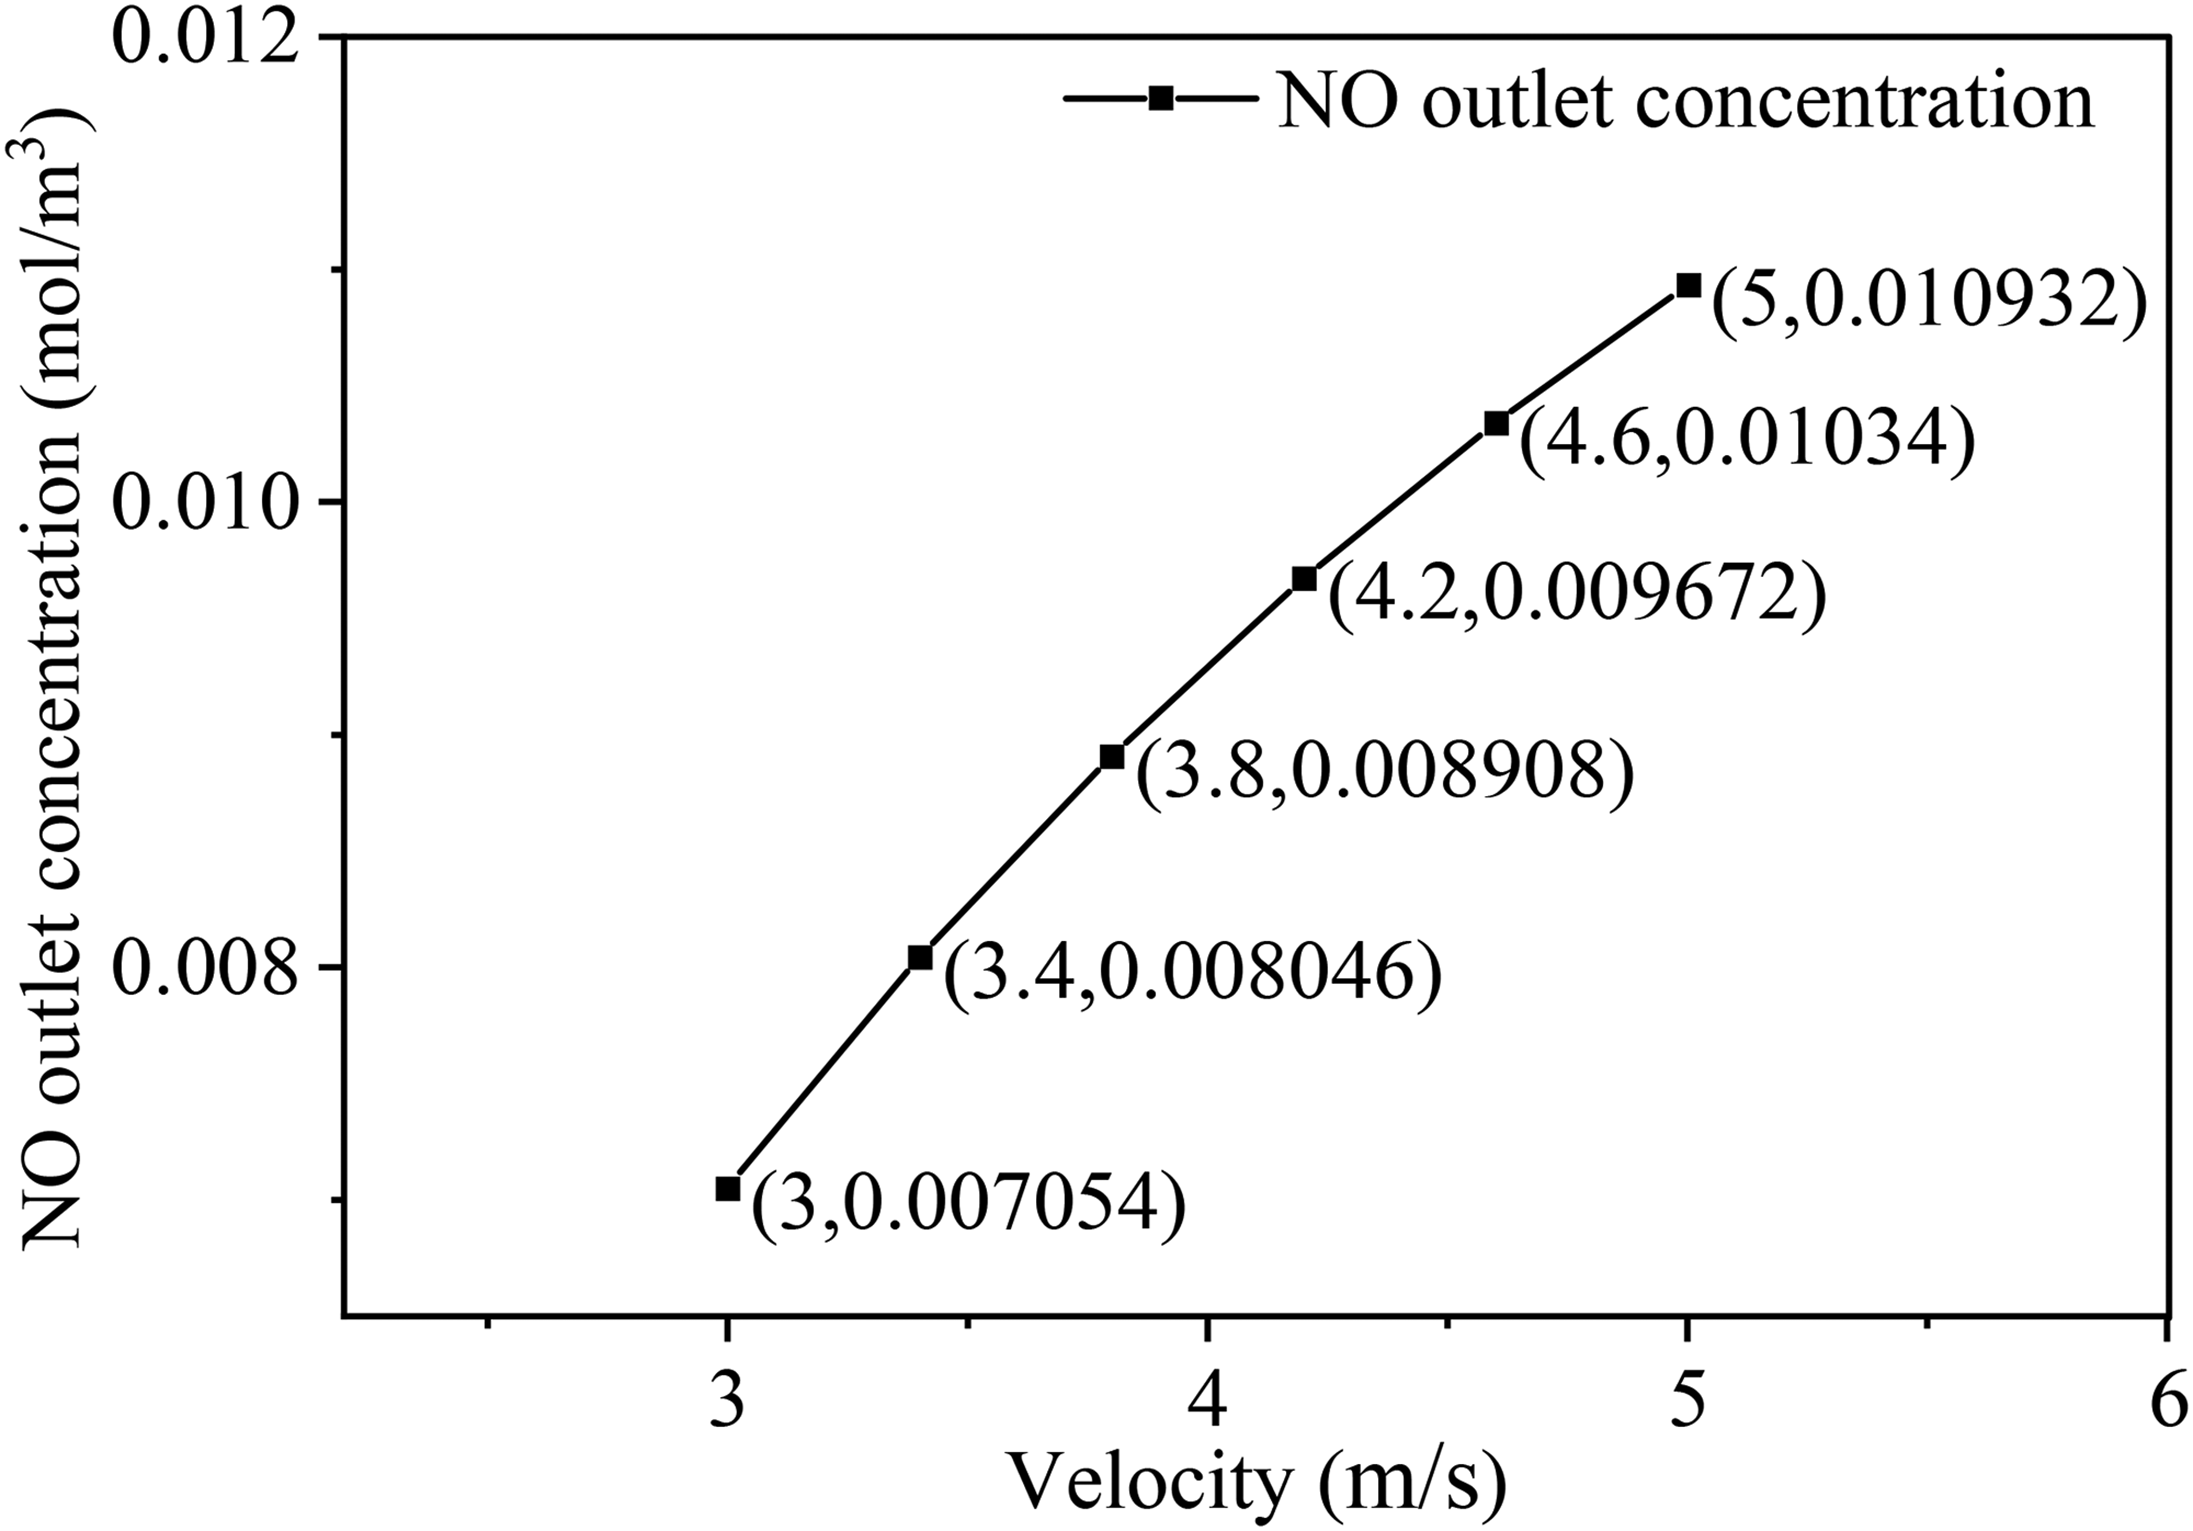
Effect of flow velocity on the outlet NO concentration.
The results (Figure 11) indicate the significant effect of flow velocity on the outlet NO concentration. Specifically, as the flow velocity increases, the outlet NO concentration increases. This trend can be attributed to several key factors. First, higher flow velocity shortens the residence time of the flue gas in the pipe, which reduces the likelihood of NO molecules interacting with the active coke surface for reduction reactions. Second, increased flow velocity reduces the diffusion efficiency of gas molecules, which limits the penetration of both the reductant and NO into the microporous structure of the active coke. This limitation hinders the effective utilization of reactive sites. Consequently, higher flow velocities lead to reduced overall denitrification efficiency, reflected by the increasing outlet NO concentration.
Effect of pipe length on the outlet NO concentration
The effect of pipe length on the outlet NO concentration was analyzed using a pipe diameter of 50 mm, an inlet NO concentration of 0.02 mol/m³, a temperature of 120°C, and a flow velocity of 3 m/s. Simulations were performed for pipe lengths of 800, 1100, 1400, 1700, 2000, and 2300 mm. The results are presented in Figure 12.
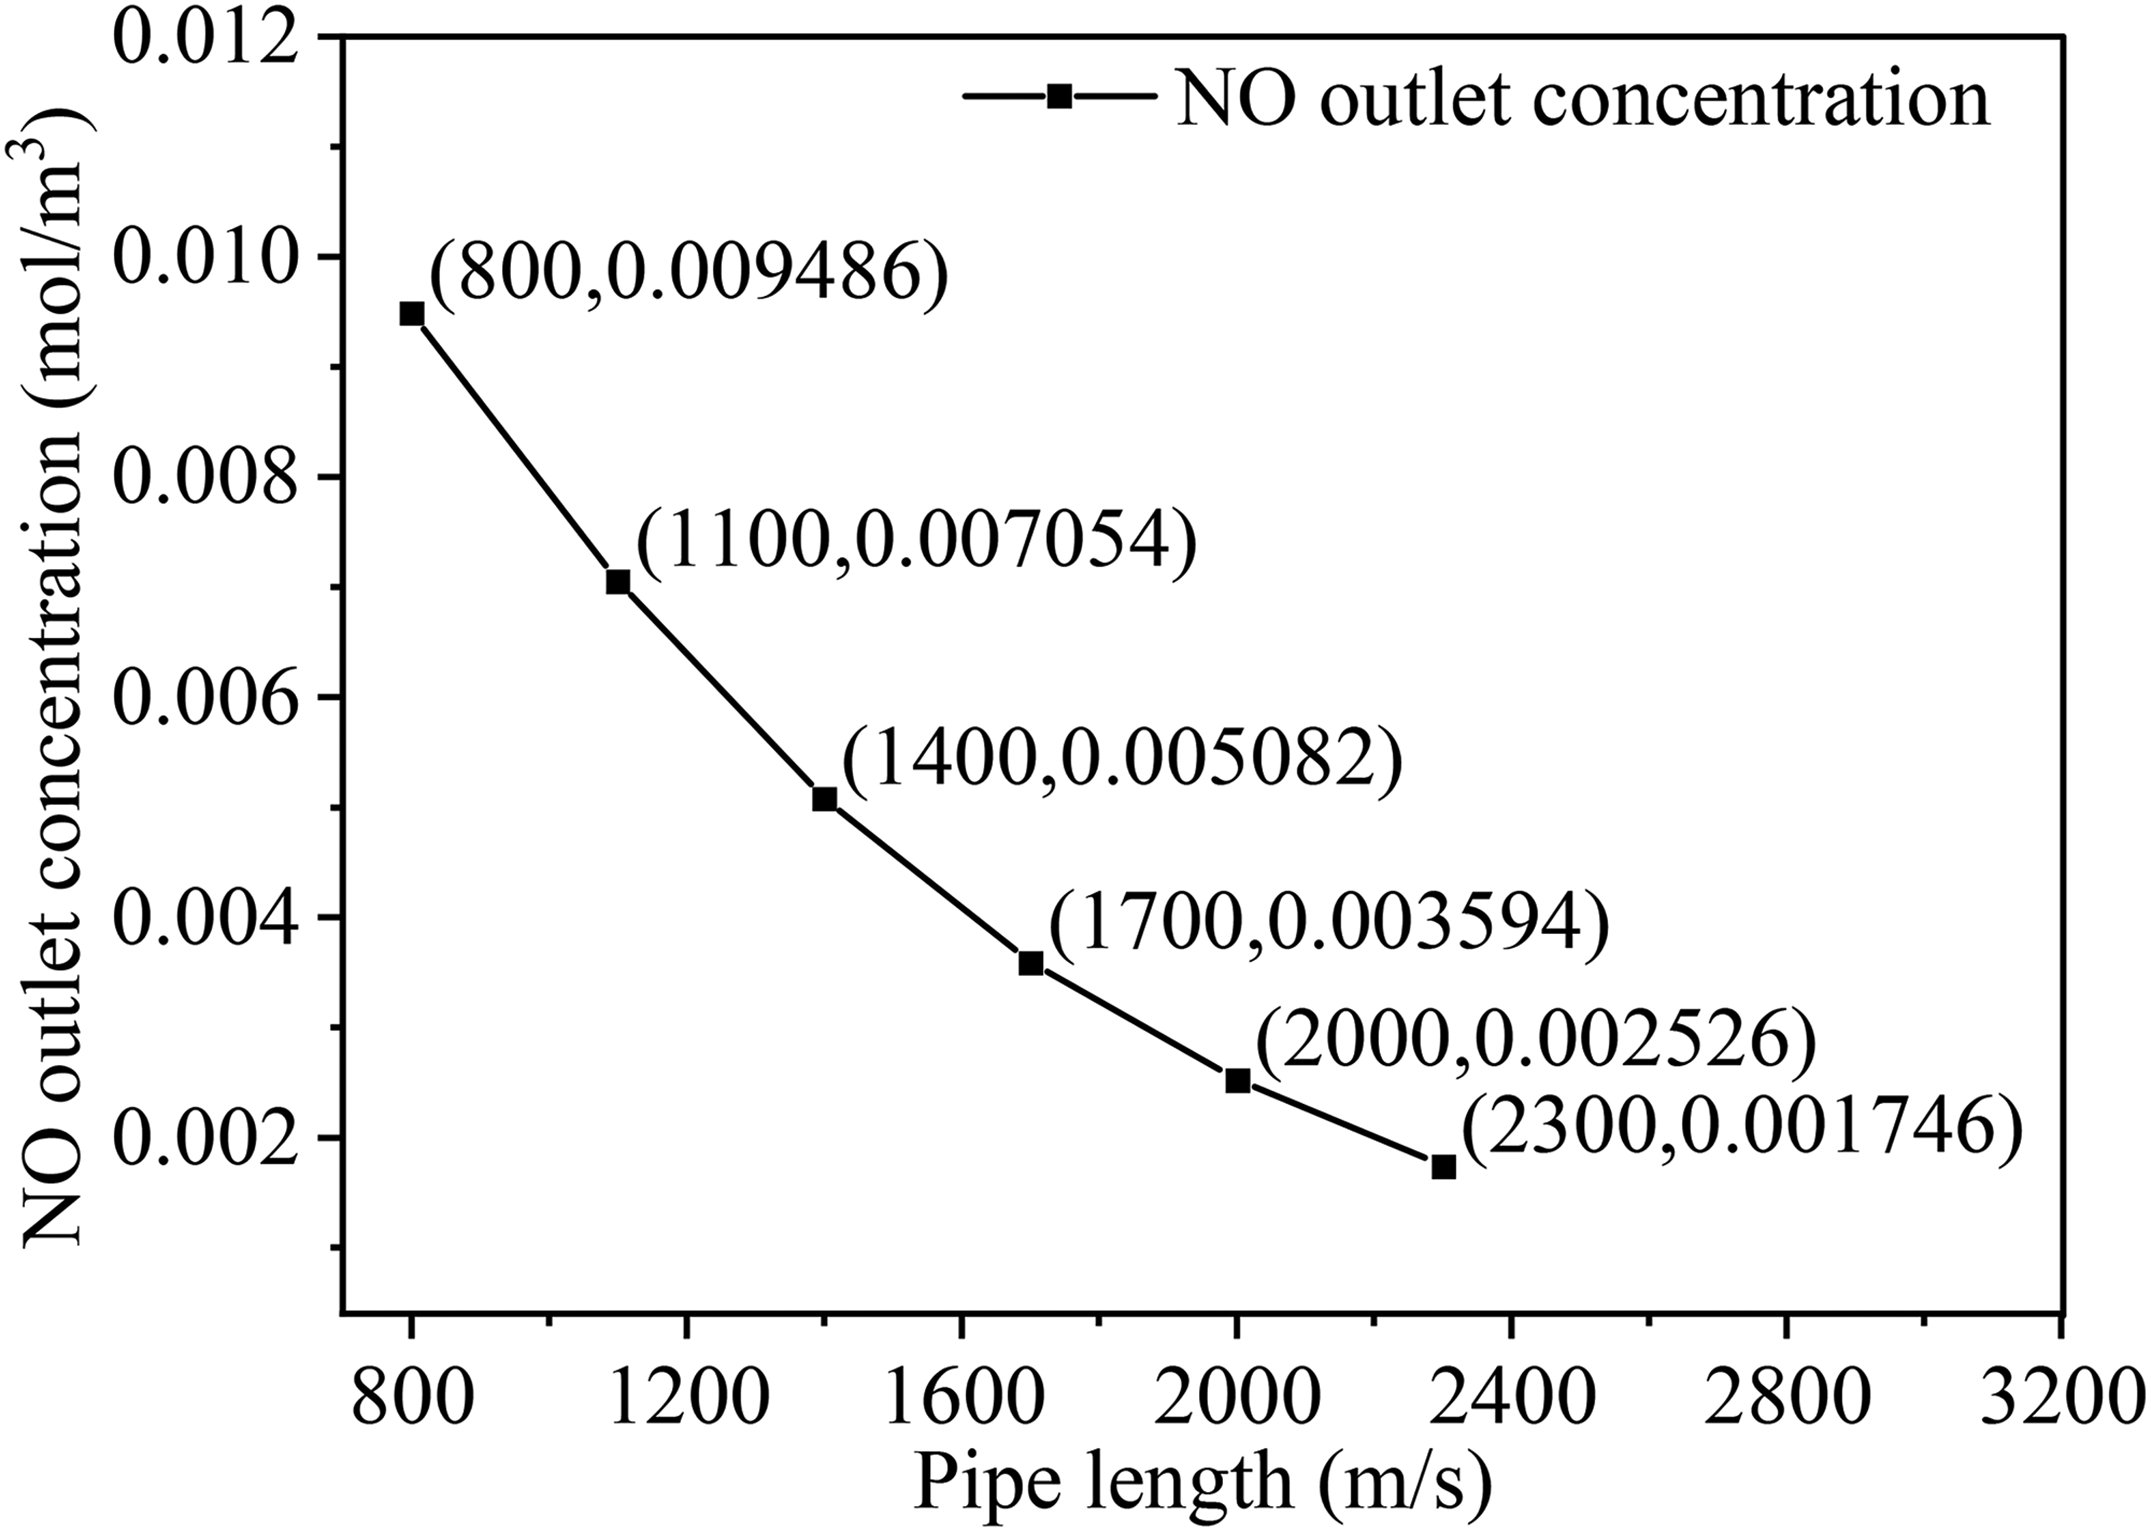
Effect of pipe length on the outlet NO concentration.
The trend in Figure 12 indicates a decrease in the outlet NO concentration with increasing pipe length. This behavior can be attributed to several key factors. First, a longer pipe length increases the residence time of the flue gas. This provides more time for reactions between NO molecules and active coke, which enhances conversion efficiency. Second, a greater pipe length expands the contact area between the flue gas and the active coke and increases the number of available reactive sites, which promotes both physical adsorption and chemical reduction of NO. Additionally, a longer pipe facilitates homogeneous mixing of the reductant and NO molecules, further enhancing reaction kinetics. Consequently, the increased pipe length significantly improves denitrification efficiency, as indicated by the lower outlet NO concentrations.
Effect of inlet NO concentration on the outlet NO concentration
The effect of inlet NO concentration on the outlet NO concentration was investigated using a pipe diameter, temperature, flow velocity, and pipe length set at 50 mm, 120°C, 3 m/s, and 1100 mm, respectively. The simulation results are shown in Table 8. As the inlet NO concentration increases, the outlet NO concentration increases, reflecting the larger amount of NO requiring treatment. This trend can be explained from the perspectives of chemical reaction kinetics and mass transfer. From the standpoint of chemical reaction kinetics, higher inlet NO concentrations result in the rapid occupation of active sites on the surface of active coke, which limits the adsorption and subsequent conversion efficiency of NO molecules. This implies that under conditions of high inlet NO concentration, the reactivity of active coke becomes constrained, hindering the timely processing of all NO molecules and consequently leading to elevated outlet NO concentrations. From the perspective of mass transfer, increased inlet NO concentrations enhance the diffusion driving force of NO molecules due to the increased concentration gradient. However, excessively high concentrations can induce reactant accumulation on the active coke surface, impeding molecular transport. As a result, denitrification efficiency declines, leading to higher outlet NO concentrations.
Effect of inlet NO concentration on the outlet NO concentration.

These findings indicate that all five parameters significantly influence denitrification performance and are interdependent. Moreover, these factors directly affect operating costs. Because pipe diameter is limited by production standards and the NO concentration in the flue gas is a fixed input in practical applications, a simultaneous optimization of temperature, flow velocity, and pipe length was conducted.
MATLAB neural network model training and performance evaluation
Numerous simulations were conducted using COMSOL software based on the parameter ranges provided in Table 1. The resulting data, including operating parameters and NO concentrations after denitrification, were used to train a neural network predictive model in MATLAB. The model was developed to predict the NO concentration after denitrification using key operating parameters (temperature, pipe diameter, pipe length, inlet concentration, and flow velocity) as input variables. To comprehensively assess model predictive accuracy, its outputs were compared with the COMSOL simulation data. Figure 13 shows the evaluation process of the predictive performance of the neural network model.

Evaluation process of the predictive performance of the neural network model.
Operating parameters were generated within the ranges specified in Table 1. Simulations were conducted using COMSOL software to create a diverse and reliable dataset for model training. The data were then imported into MATLAB for training and validation of the neural network model. To ensure both accuracy and generalization, the dataset was split into training, validation, and test subsets. The input parameters for the neural network model included temperature, pipe diameter, pipe length, inlet concentration, and inlet flow velocity. The NO concentration after denitrification served as the output parameter. Model weights were optimized using a backpropagation algorithm to minimize the error between predicted and simulated values. After training, the predictive performance of the model was evaluated using a test dataset excluded from the training set. The test set included various operating conditions, and the NO concentrations predicted by the neural network were compared with COMSOL simulation results to confirm prediction accuracy (Table 9). Based on the reference [47] and considering both accuracy and efficiency, the relative error between predicted and simulated values was controlled within 10%. If the relative error exceeded this threshold, the model was refined through the modification of the network structure, expansion of the training dataset, or optimization of training parameters. Additionally, the model was retrained and validated. After repeated iterations of adjustments and validation, once the relative error met the predetermined criteria, the neural network model was considered to have a high predictive accuracy. Consequently, the model can reliably predict the NO concentration after denitrification under different input conditions. This approach provides a basis for further investigation.
Comparison of predicted values with simulated results under different conditions.

Optimization results
Comprehensive optimizations of temperature, flow velocity, and pipe length were conducted at a constant pipe diameter and inlet NO concentration. In these optimizations, the NO emission standard was set at 0.00167 mol/m3, and a genetic algorithm was utilized to minimize the overall operating cost. Owing to the strict penalty imposed for exceeding the emission standard, the NO concentration after denitrification was maintained below this limit.
Optimization results
A narrow pipe length range of 2100 to 3000 mm was selected. The specific ranges for temperature and flow velocity are shown in Table 1. Additionally, optimizations were performed independently for pipe diameters of 50 and 80 mm (Tables 10 and 11), respectively.
Optimized parameters and corresponding costs for a pipe diameter of 50 mm.

Optimized parameters and corresponding costs for a pipe diameter of 80 mm.

Table 10 shows the optimized parameters and corresponding costs for a pipe diameter of 50 mm. The data in the two left columns are fixed during the optimizations, while the third column shows the optimization objectives. The minimization analysis of total hourly cost (P) reveals that as the inlet NO concentration increases, the pipe length remains at the lower limit of the specified range. Moreover, the temperature increases from 128.9962°C to 139.7202°C, the flow velocity increases from 3.0115 to 3.2407 m/s, and the optimal P increases from 11.0661 to 11.2358 CNY/h. The minimization analysis of cost per unit mass (P′) reveals that as the inlet NO concentration increases, the pipe length remains constant, while the temperature increases from 139.1558°C to 148.4687°C. Additionally, the flow velocity decreases from 4.8757 to 4.5680 m/s, and the optimal P′ increases from 0.2611 to 0.2799 CNY/kg.
The optimization results for a pipe diameter of 80 mm are presented in Table 11. The minimization analysis of total hourly cost P indicates that as the inlet NO concentration increases, the pipe length remains at the lower limit of the specified range, while the temperature increases from 127.8182°C to 136.2247°C. Moreover, the flow velocity decreases from 3.1341 to 3.0049 m/s, and the optimal P increases from 27.8594 to 27.9679 CNY/h. The minimization analysis of P′ indicates that with increasing inlet NO concentration, the pipe length remains constant, and the temperature increases from 142.0124°C to 145.8478°C. The flow velocity slightly changes, while optimal P′ increases from 0.2534 to 0.2555 CNY/kg.
Notably, all optimized pipe lengths reach the lower limit of the specified range, indicating that this limit should be reduced.
Optimization results with adjusted ranges
In this section, the pipe length range was expanded from 800 to 3000 mm. With other conditions unchanged, optimizations were conducted, and the results are summarized in Tables 12 and 13.
Optimized parameters and corresponding costs for a pipe diameter of 50 mm (pipe length range: 800–3000 mm).

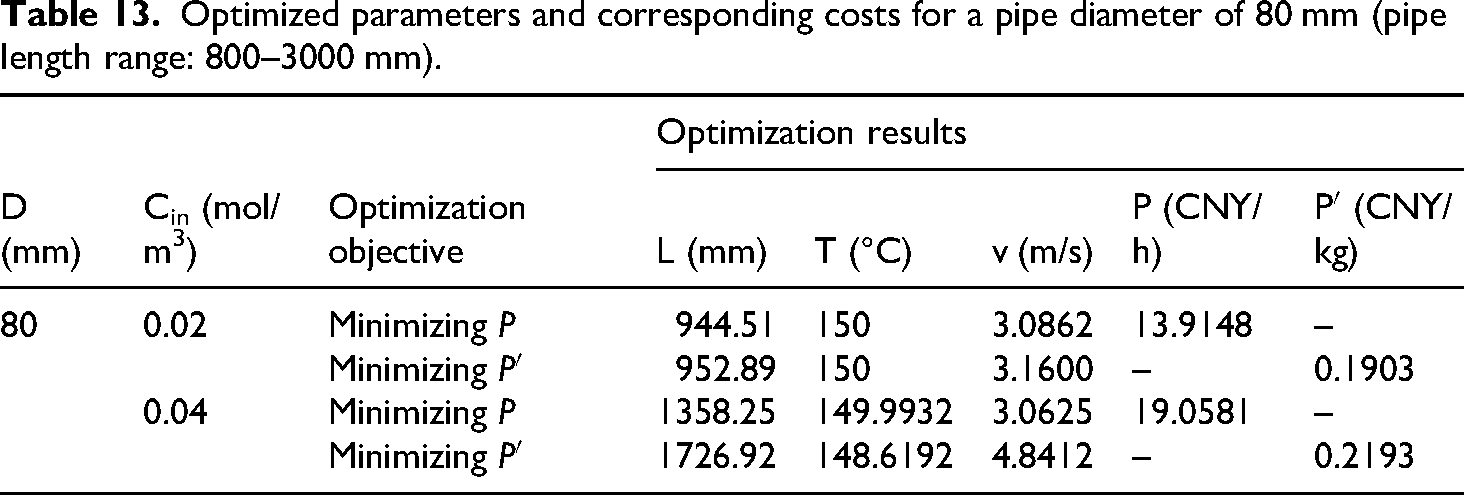
Optimized parameters and corresponding costs for a pipe diameter of 80 mm (pipe length range: 800–3000 mm).
For a pipe diameter of 50 mm, an increase in the inlet NO concentration from 0.02 to 0.04 mol/m³ results in several observable trends in the minimization analysis of P (Table 12). The pipe length increases from 975.56 to 1303.59 mm, the temperature slightly changes, the flow velocity remains at its lower limit, and the optimal P increases from 5.6758 to 7.3114 CNY/h. In the minimization analysis of P′, the increase in the inlet NO concentration causes the pipe length to increase from 1386.17 to 1485.15 mm. The temperature undergoes slight variations, the flow velocity decreases from 4.3625 to 3.5120 m/s, and the optimal P′ increases from 0.2029 to 0.2603 CNY/kg.
For a pipe diameter of 80 mm, an increase in the inlet NO concentration from 0.02 to 0.04 mol/m³ leads to several notable trends in the minimization analysis of P (Table 13). The pipe length increases from 944.51 to 1358.25 mm, the temperature and flow velocity remain nearly constant, and the optimal P increases from 13.9148 to 19.0581 CNY/h. In the minimization analysis of P′, the increased inlet NO concentration leads to an increase in the pipe length from 952.89 to 1726.92 mm. Additionally, the temperature decreases from 150°C to 148.6192°C, the flow velocity increases from 3.1600 to 4.8412 m/s, and the optimal P′ increases from 0.1903 to 0.2193 CNY/kg.
The optimization results with adjusted parameter ranges indicate improved operational efficiency, highlighting the vital role of selecting appropriate parameter ranges to optimize active coke-based NO removal.
Analysis of optimized costs
Under the third-row conditions in Table 13 (80 mm pipe diameter and 0.02 mol/m³ inlet concentration), the optimized cost per unit mass of processed flue gas was 0.1903 CNY/kg. A detailed analysis of the cost components is shown in Figure 14.

Cost components under the third-row conditions in Table 13 (P′ = 0.1903 CNY/kg).
The cost of processing one unit mass of flue gas comprises several components (Figure 14). The cost of supplying active coke (P1) is 0.1555 CNY, the heating cost of active coke (P21) is 0.0052 CNY, the heating cost of flue gas (P22) is 0.0267 CNY, and the operating cost of the fan (P3) is 0.0029 CNY. Notably, the emission penalty (P4) is 0 CNY, indicating full compliance with national emission standards.
Conclusions and outlook
This study numerically investigated active coke-based NO removal through COMSOL simulations. The effects of pipe diameter, temperature, pipe length, flow velocity, and inlet NO concentration on denitrification performance were analyzed. A neural network model was developed in MATLAB to predict the denitrification performance of active coke based on a large dataset generated from simulations. Moreover, key parameters, including temperature, flow velocity, and pipe length, were optimized using a genetic algorithm to enhance the denitrification efficiency and cost-effectiveness of the active coke-based NO removal system. The main conclusions are summarized as follows:
As other parameters are held constant, the NO concentration in the outlet flue gas decreases with increasing temperature and pipe length but increases with higher inlet flow velocity and inlet NO concentration. The developed neural network model accurately predicts the NO removal performance of active coke and can be applied to further optimization tasks. The proposed approach, combining neural network prediction with genetic algorithm optimization, effectively identifies cost-efficient schemes for active coke-based NO removal. The optimized parameters significantly improve the operational cost-effectiveness and performance of the ACD system. As the NO concentration in the inlet flue gas increases, the optimized pipe length, temperature, and flow velocity vary. Consequently, both the total hourly cost and the cost per unit mass significantly increase. Notably, the cost of active coke accounts for the largest proportion of the total flue gas processing cost. The effectiveness of the proposed optimization method strongly depends on the defined parameter ranges. Setting appropriate parameter ranges significantly improves the efficiency of the optimization process.
This study proposes a data-driven approach designed to improve the efficiency and economic performance of the denitrification process. Future work will involve the use of field data and plant operational data to train the model, optimize its parameters, and facilitate its practical application in industrial environment. While the current study primarily focuses on operational aspects, factors such as capital investment and maintenance costs will be considered in subsequent research to enable a comprehensive evaluation of the system's long-term deployment.
Footnotes
Abbreviations
Authors’ contribution
WL was involved in data curation, visualization, investigation, methodology, validation, writing—original draft, and formal analysis; HL in conceptualization, methodology, writing—review and editing, supervision, and acquisition of the financial support; and WC in conceptualization, methodology, and supervision.
Funding
The authors disclosed receipt of the following financial support for the research, authorship, and/or publication of this article: This research was funded by National Natural Science Foundation of China, grant number 52106219.
Declaration of conflicting interests
The authors declared no potential conflicts of interest with respect to the research, authorship, and/or publication of this article.
Data availability
The data that support the findings of this study are available from the corresponding author upon reasonable request.