
Abstract
Objective
To determine the prevalence of influenza A and B virus infection according to age, gender, and month in Jinshan District, Shanghai, and to set local prevention strategies.
Methods
The study was categorized as descriptive, involving patients having respiratory complaints at Tinglin Hospital in Jinshan District between January 2024 and December 2024. Analysis of nasopharyngeal samples was achieved by rapid diagnostic assessment of influenza A and B antigens. The results were analyzed according to age, gender, and the month of the testing. The chi-square test and Fisher's exact tests were used, with a statistical significance of P < 0.05.
Results
In 12,450 specimens, 2664 were positive for influenza A or B virus, which is an overall rate of infection of 21.4%. Most states had experienced in the category of the age of 7–18 years of age (28.5%), whereas those not in the 60 and above (8.9%) were the least. They did not reveal important gender differences. Peak periods were during January (48.6%) and December (10.3%).
Conclusion
The infection of influenza A and B viruses resulted in a significant seasonality and age-based regularity in Jinshan District, with school-going children and winter being the most affected. The results can be used to justify an age-specific preventive regime as well as improved implementation of prevention methods showcasing seasonality.
Introduction
Influenza is among the most common respiratory infections. 1 Respiratory infections are leading causes of global morbidity and mortality.2,3 Influenza viruses exhibit seasonal and age-specific incidence patterns. 4 They belong to the Orthomyxoviridae family and are single-stranded negative-sense RNA viruses transmitted primarily through respiratory droplets. 5 Based on pathogenicity, influenza viruses are classified into four types 6 : A, B, C, and D. Types A and B are responsible for seasonal epidemics. Influenza A viruses can infect multiple animal species, contributing to their high variability and potential for widespread outbreaks. Influenza B viruses primarily infect humans and typically cause localized or smaller-scale epidemics.7–9 Rapid detection of influenza A and B viruses is achievable through antigen testing. Understanding the age, gender, and monthly distribution of influenza A and B virus infections is crucial for monitoring epidemic trends and implementing effective prevention and control measures. Tailored screening and preventive healthcare services are essential for managing the incidence of these infections. Although multi-year surveillance of influenza and studies on large-scale studies have already been reported in Shanghai and the countrywide, these are often based on centralized PCR-based testing. Unlike the other research, our study is district-level and real-world in that we used routine antigen testing within a secondary-level hospital, and this offers practical knowledge in the epidemiological situation at the local level that can shape frontline public health solutions.
Methods
The study utilized a retrospective descriptive study that was used to evaluate the prevalence and distribution of influenza A and B viruses in Jinshan District, Shanghai. This study was reported according to the STROBE checklist of observational research and took place in Tinglin Hospital, which is a public healthcare institution with a large population in the southwestern outskirts of Shanghai.
Study setting and participants
All of the people who were tested with influenza A and B viruses in Tinglin Hospital during the period between January and December 2024 were utilized as sources of data. Eligible subjects were those aged 0–102 years who presented themselves to the outpatient department, emergency, or inpatient departments with symptoms usually related to influenza-like fever, headache, sore throat, nasal congestion, and coughing. The research team did not exclude any patients based on their underlying health conditions because all patients who were tested in the study period were included. Patients were recruited on a first-come basis according to whether they had symptoms satisfying the clinical testing criteria, so they were representative of epidemiological patterns with no sampling bias. This observational study was reported according to the STROBE standards. 10
Ethical considerations
The study was approved and reviewed by the Ethics Committee of Tinglin Hospital of Jinshan District. The research was performed following the principles of ethical research given in the Declaration of Helsinki (1975), updated in 2024. 11 All data on the patients were blinded and de-identified before analysis to ensure confidentiality. An Ethics Committee of Tinglin Hospital of Jinshan District, Shanghai, authorized the study protocol. All the study participants provided written informed consent, and consent of a parent or a legal adult guardian was provided in case of the participants of less under 16 years of age. All data gathered were anonymized and de-identified before analysis, taking into consideration participant confidentiality and institutional policies in protecting data.
Specimen collection
Standard clinical procedure was used to collect nasopharyngeal swabs, involving collecting specimens using nasopharyngeal swabs, which was done by licensed attending physicians or specialists. A sterile swab was placed in the posterior nasopharynx, swirled against the mucosal surface to get epithelial cells, and immediately placed in an extraction buffer. Sampling was done in less than one hour, after which the specimens were transported to the laboratory. In case of inability to perform immediate testing, the samples were maintained at room temperature conditions, with the check being done after < 24 hours.
Laboratory testing
Rapid antigen testing involved the use of colloidal gold-based immunochromatographic assay kits (China Aibo Biopharmaceutical, Hangzhou) that not only identified influenza A virus antigen but also identified the antigen of influenza B. The test was done in line with the instructions of the manufacturers. The presence of the control line guaranteed the validity of the tests, and the line at targeted test areas signified the entry of influenza A and/or B antigen. Mixed infections were noted where both zones on the test gave positive signals. Validations of each batch of test kits by internal positive and negative controls were done as a quality control measure.
Statistical analysis
The results were processed with the help of SPSS 27.0 (IBM Corp., Armonk, NY, USA). Categorical data (type of influenza, the distribution of gender and age groups) were described as counts and percentages. Prevalence was reported as the proportion of influenza-positive cases, and corresponding 95% confidence intervals (95% CI) were also given.
Comparisons between groups were made using the chi-square test or Fisher's exact test where the number of expected cell counts was <5. To increase interpretability, we stratified results by gender and age group (06, 718, 1959, 60 + years). Diagnostic categorization limited a reasoned multivariable regression model, but we performed stratified subgroup analyses to minimize the impact of a potential confounding factor. The statistical testing was done as two-sided with a significance level of P < 0.05.
Prevalence at baseline was summarized descriptively. Differences between categorical variables were examined using chi-square and Fisher’s exact tests as appropriate. Proportions were reported with an associated 95% CI. Where feasible, such analyses were done separately by age-stratum and sex to minimize confounding effects, though multivariable regression was not practical due to the lack of data.
Results
Of 12,450 patients tested, 2664 were found to have influenza (the overall prevalence of the infection was 21.4%; 95% CI: 20.7–21.1 nanopc). The influenza A onset in COVID-19 co-infection constituted 1468 cases (11.8%, 95% CI: 11.2%–12.4%), whereas the influenza B onset amounted to 1196 cases (9.6%, 95% CI: 9.1%–10.2%).
Age-prevalence showed that the levels were highest in the age of 718 years: 29.4% (95% CI: 27.8–31.0). However, in comparison, prevalence was the lowest among individuals aged 60 and above: 12.7% (95% CI: 11.4–14.0). The contrast between the age groups was statistically significant (P < 0.001). There was little difference in gender distribution based on the rate of positivity: 21.1 (95% CI: 20.2–22.0) in males and 21.7 (95% CI: 20.8–22.6) in females (P = 0.421).
The seasonal pattern showed a peak during the month of January, in which the positivity value was 38.6% (95% CI: 36.2–38.6 years) and a decrease in February (22.5%, 95% CI: 20.4–22.5 years). The lowest level was found in August (4.2% 95% CI: 3.1%–5.3%). This variation was highly significant, with the significance level being P < 0.001.
Infection rates by age group
The prophylaxis was of the following age: 6 years and younger: 22.6% (358/1583); 7–18 years: 28.5% (684/2404); 19–30 years: 23.7% (443/1873); 31–45 years: 24.2 (734/3032); and 46–60 years old: 17.6% (259/1470). The peak infection rate was in the age category of 7–18 years, whereas the lowest infection rate was reported to occur in the age group of 60 years. Statistical results revealed that there were considerable variations in age groups (χ2 = 297.73, P < 0.05). Comparison of historical exchange rate and the current exchange rate (see Table 1).
Influenza A and B virus antigens at different ages.

Distribution of influenza A and B virus infections by age
In a record of 2664 positive cases, there was a higher number of infections by the influenza B virus compared to other infections. Mixed infections were uncommon, with only age groups 19–30, 31–45, and 46–60 years identified as having them. The age structure was in an M-shaped pattern, with the highest response in the 7–18 age category and the 31–45 age category.
Infection rates by gender
Among male patients (n = 6122), 21.5% were positive, while among female patients (n = 6328), 21.3% were positive. Statistically, there was no significant difference in the genders (Fisher’s exact test, P = 0.64). The level of natural gas prices was higher compared with previous years (see Table 2).
The positive rate of influenza A and B viruses in different genders.

Seasonal trends
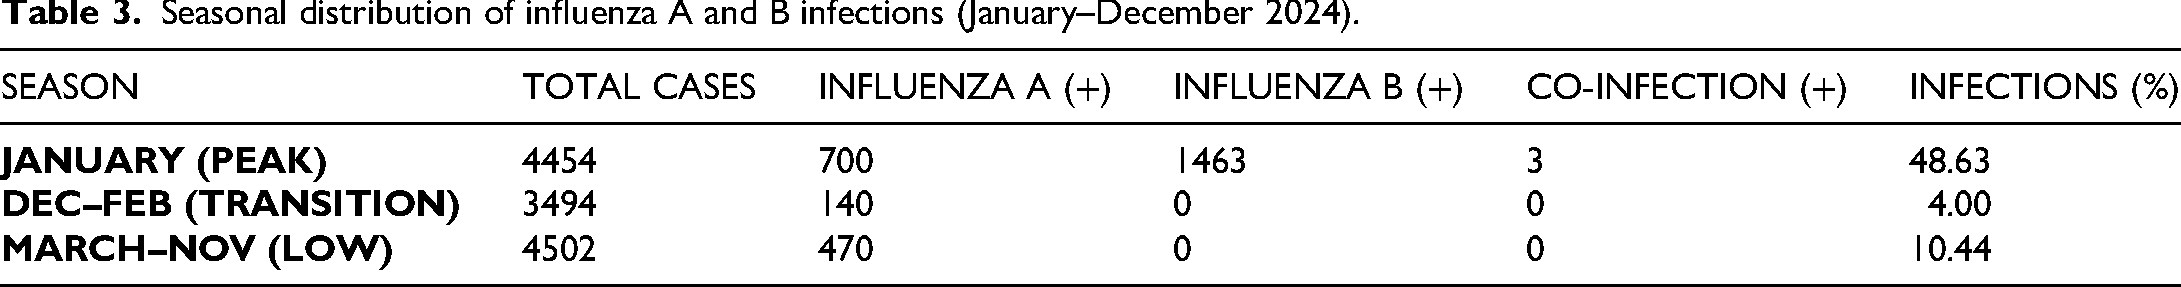
The monthly rate of infections showed a strong seasonality trend. It was calculated to be the highest in January (48.63%), with December taking second place (10.29%). After February, there were no cases of influenza B detected. The months were categorized into three groups to make a valid statistical comparison: peak season (January), transition season (December–February), and low season (March–November). There was a significant effect of seasonal variation (χ2 = 232.18, P < 0.001). At the time of writing this chapter, the story is available on the following (see Table 3).
Seasonal distribution of influenza A and B infections (January–December 2024).
The distribution of influenza A and B virus infections at different ages
Among 2664 cases of influenza virus infection A and B, the influenza virus infection rate of mono-A, mono-B and mixed infection in different age groups was ≤ 6 years: 12.00% (190/1583), 10.61% (168/1583), with no cases of co-infection; 7–18 years: 9.57% (230/2404), 18.89% (454/2404), also with no co-infection observed; 19–30 years: 12.23% (229/1873), 11.37% (213/1873), with one case of dual infection; 31–45 years: 9.11% (276/3032), 15.07% (457/3032), and one case of co-infection; 46–60 years: 9.46% (139/1470), 8.10% (119/1470), with one case of concurrent infection; and > 60 years: 6.42% (134/2088), 2.49% (52/2088), with no co-infection recorded.
The data indicate that the influenza B virus accounted for the majority of infections, followed by the influenza A virus. Simultaneous infection with both influenza A and B viruses was rare. The age group with the highest influenza A virus infection rate was 19–30 years, followed by the ≤ 6-year group, while the lowest was observed in individuals aged >60 years. The highest influenza B virus infection rate occurred in the 7–18-year-old group, followed by the 31–45-year-old group; the lowest rate was seen in the >60 years group. Among these, co-infections with both influenza A and B viruses were found in the 19–30, 31–45, and 46–60 years age groups, with no co-infection reported in the remaining age categories. The distribution pattern of influenza A and B virus infections across different age groups exhibited an “M”-shaped curve (Figure 1).

The distribution of influenza A and B virus infections at different ages.
The positive rate of influenza A and B viruses in different genders
Among 12,450 specimens tested for influenza A and B virus antigens, 2664 specimens were positive, with a total infection rate of 21.4%. A total of 2667 positive influenza A and B virus antigens were detected in the 2664 positive specimens. Among the 12,450 specimens, there were 6122 cases from men and 6328 cases from women. Among them, 575 male cases tested positive for influenza A, 740 for influenza B, and one case involved co-infection with both influenza A and B viruses. Among female specimens, 623 were positive for influenza A, 723 for influenza B, with 2 cases of dual infection. See Table 2. The statistical analysis of the data from this study shows no statistically significant difference in gender susceptibility to influenza A or B viruses (χ² = 3.42, P > 0.05).
The positive rate of influenza A and B viruses in different months
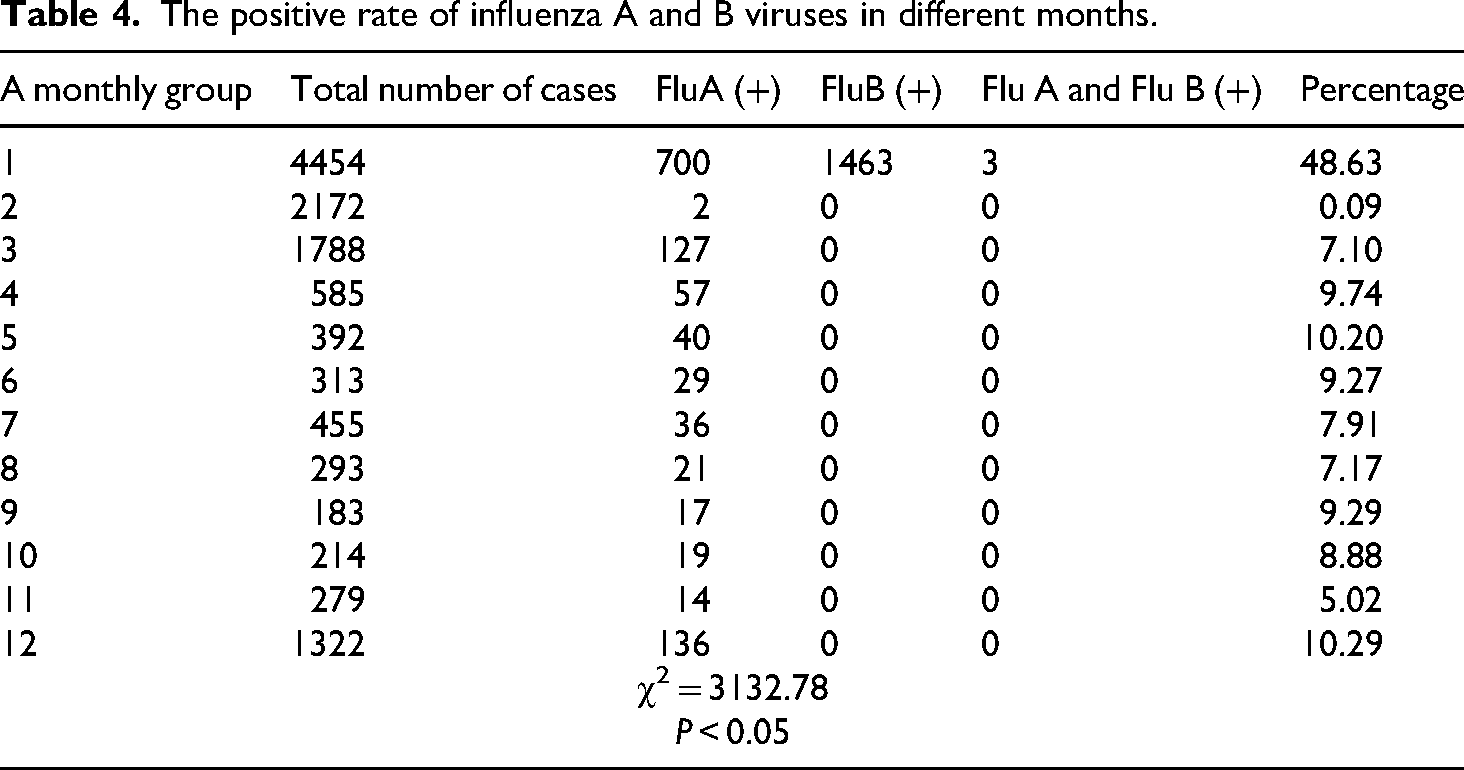
Among the 12,450 specimens, they were divided into 12 groups according to different months: monthly infection rates for influenza A and B viruses were as follows—January: 48.63% (2166/4454); February: 0.09% (2/2172); March: 7.10% (127/1788); April: 9.74% (57/585); May: 10.20% (40/392); June: 9.27% (29/313); July: 7.91% (36/455); August: 7.17% (21/293); September: 9.29% (17/183); October: 8.88% (19/214); November: 5.02% (14/279); and December: 10.29% (136/1322). The highest infection rate occurred in January. This month, influenza B virus cases were 2.09 times higher than those of influenza A, and it was the only month with documented cases of mixed infection. From February to December, all detected cases were attributed to influenza A, with no cases of influenza B or co-infection reported. See Table 4. Data analysis indicates that the positive rates in January and February were significantly higher than those observed in the other months (χ² = 3132.78, P < 0.05), while no significant differences were found among March to November.
The positive rate of influenza A and B viruses in different months.
Discussion
The current study presents an up-to-date epidemiologic profile of influenza A and B during the 2024 real-world clinical data on the population of the Jinshan District of Shanghai. The overall positivity rate was 21.4% (95% CI: 20.7%–22.1%), with influenza A (11.8%) being slightly more prevalent than that of influenza B (9.6%). Peaks on a seasonal basis were recorded in the month of January, and then there was a sharp fall in the spring months. These results are in line with those documented in national surveillance reports, whereby seasonality was observed in northern and eastern China with peak activity in winter to spring.
The results, compared with the previous comparable ones of Shanghai-based studies, including longitudinal analysis at multi-year surveillance results, can show a similarly sized percentage of influenza A during winter peaks, at a slightly higher percentage among school-aged children (7–18 years of age). This implies that district-based monitoring is still relevant to detecting age patterns that might not be apparent in pooled municipal statistics. These results agree with the national surveillance trends, showing peak activity of influenza A in January-February in northern China, 12 with the local district-level data of 2017/2018 of a SARI surveillance study in Jinshan, indicating the high activity in winter months detected using RT-PCR methodology. 13 This brings out the complementary format of the rapid antigen testing in specifying real-life clinical trends at the local level.
The limitations of rapid antigen detection (compared to RT-PCR) can be explained by the realities of the secondary-level hospitals located in suburban districts: molecular assays may not always be available. Rapid antigen tests continue to be popular in order to make important decisions with a turnaround time, especially in low-resource conditions. The current results, therefore, supplement molecular surveillance in that they provide real-life information in a typical frontline clinical setup. However, the sensitivity of antigen assays is relatively weaker, which limits the study.
In terms of the public health impact, the age-specific disparity, with the highest rates seen in school-going children (29.4%), demonstrates the utilization of uniquely tailored prevention interventions. These comprise achieving school-aged population seasonal influenza vaccination before the anticipated January peak, and this is coupled with increased school-based infection control measures. This might be effective in curbing infection within a family and the neighborhood.
Seasonal influenza A and B remain a global burden to the health of the people, particularly when they affect vulnerable groups. The results of our study show 2664 cases out of 12,450 individuals, which translates to an infection rate of 21.4% within the Jinshan District. This is well in line with the earlier conclusions regarding Jinshan, where 2015–2019 surveillance displayed a comparable seasonal distribution and high infections as well, especially with an infected proportion of 30.8% among the population above 60 years. 14
According to the national and international data, we identified the highest prevalence in school-aged children (718 years), which was probably explained by the close contacts during school attendance and reduced immunity. Throughout Shanghai, children and adolescents always test positive at a higher rate compared to adults and the elderly. There was lower positivity in 60–100-year-olds, or more likely, because of limited exposure or increased vaccination. 15 We found no significant differences according to gender, as is reflected in the other studies, showing no differences in susceptibility between the sexes.
In temperate parts of China, such as Shanghai, the influenza peak is in January–February, as same in ours, which further supports fall vaccination. 16 Other places in similar latitude show a bi-annual peak, one in the cold months and the other in mid-year. These established patterns align with our January peak, especially of influenza B, which serves to facilitate seasonal preparedness. There is the possibility that we have underestimated prevalence with our current reliance on rapid antigen tests as compared to PCR, which is more sensitive. 17 Antigen tests are less sensitive to low-viral-load infections, miss them, and are quick and point-of-care tests. Bacterial or other viral co-infection, 12 for example, Mycoplasma pneumoniae, Adenovirus, RSV and so on, although known as a factor that causes complications of influenza in hospitalized patients, was not taken into consideration in our study. A watchful eye on the complete ecology of pathogens should be integrated into future research, and this will greatly serve the current knowledge on the severe respiratory illness burden.
Implications for practice
It may be the case that greater coverage of vaccination and preventative education among school-aged children is an especially effective way of reducing transmission because of the observed high infection rates in this area. 18 The fact that the seasonal peak is observed in January indicates the necessity of timely vaccination campaigns and increased clinical alertness that should be observed in the winter. These findings can be used in the local planning of public health in setting strategies for the control of annual influenza.
Weaknesses and strengths
This research is limited in some ways. It happened in one district of Shanghai and only one hospital, which reduces the extent to which the findings can be applied in other regions. Rapid antigen tests, although feasible to use in surveillance, may have underestimated actual infection prevalence relative to PCR-based diagnostics. Also, the presence of bacterial co-infections was not evaluated. Nevertheless, the strong aspects of the study are a high base sample size, a wide age group, and the enrolment of patients consecutively among outpatients, emergency care, and inpatients, which allows capturing a full picture of the past season's epizootics related to seasonal influenza in this area.
Conclusions
This article concluded that the cases of influenza A and B virus infection in Jinshan District had a definite age-specific and seasonal epidemic tendency. School-aged children had the highest infection rates, and it was high in January, with a high seasonal peak. The gender did not contribute much to the infection rates. Such results can make recommendations to support local inoculation and seasonal control activities. Future studies that will include the data on bacterial co-infection and more sensitive diagnostic methods are likely to improve our knowledge of influenza dynamics in this part of the world.
Footnotes
Acknowledgements
Thanks to Jing Chen and Shanshan Chen for completing this manuscript with me.
Consent for publication
All authors agree to publish it publicly.
Authors’ contributions
TX: wrote the manuscript; SsC and JC: conducted statistical analysis of the data, having equal contributions.
Funding
The authors received no financial support for the research, authorship, and/or publication of this article.
Declaration of conflicting interests
The authors declared no potential conflicts of interest with respect to the research, authorship, and/or publication of this article.
Availability of data and material
Not public.
Clinical trial
Not applicable.