
Abstract
Rock is the most common engineering material in nature, among which sandstone has the widest distribution. It is characterized by its loose structure, strong water absorption, and decreased strength when wet. Especially in cold regions, significant seasonal and diurnal temperature fluctuations can lead to the formation of unique frozen rock bodies. As the seasons and day–night cycles change, these can transition into thawed states, generating immense local tensile and compressive stresses which result in irreversible damage to rocks with low cementing strength, making them highly susceptible to stability disasters. Therefore, studying the damage degradation mechanisms of rocks under freeze–thaw cyclic loads is crucial for the safety evaluation and disaster prediction of engineering projects in cold regions. However, rocks of different lithologies in various engineering contexts exhibit significant differences, leading to distinct damage evolution mechanisms under freeze–thaw cycles and loads, resulting in varying failure effects. In light of this fact, to explore the damage evolution mechanisms of sandstones with different lithologies, this study comprehensively employs theoretical analysis and experimental methods to conduct freeze–thaw and load tests on Green Sandstone (QSY) and Yellow Sandstone (HSY) within a temperature range of −30 to 30°C for 0, 10, 20, 30, and 40 cycles. The following results were obtained: The variation patterns of peak stress and elastic modulus in QSY and HSY under increasing pore numbers and pore sizes during freeze–thaw cycles have been identified. Differences in rock damage resulting from variations in mineral composition between the two rock types have been clarified. It has been confirmed that QSY exhibits more pronounced degradation under identical conditions, with a macroscopic fracture surface forming after 40 freeze–thaw cycles. Five evolutionary stages of QSY and HSY under cyclic freeze–thaw and loading conditions have been established. The analysis revealed that the trends in event rate and cumulative event count align with the characteristics observed in the stress-strain curve. Notably, the emergence of a high event rate without a corresponding low event rate was identified as a precursor to specimen failure, with 30 freeze–thaw cycles marking the transition point where QSY shifts from brittle to plastic failure behavior. In contrast, HSY consistently exhibits brittle failure throughout the process. A damage model under combined freeze–thaw and loading conditions has been developed, elucidating the evolution characteristics across three stages—quiescent, accelerated, and stable. The correlation between the number of freeze–thaw cycles and the initial damage value has been determined, confirming that QSY is more susceptible to freeze–thaw effects under comparable conditions. Furthermore, the accelerated damage stage has been identified as the critical phase leading to rock failure and instability.
Highlights
The influences of freeze–thaw cycle loads on pore structure, quantity, and mechanical properties of different sandstones are revealed. It is clear that 30 freeze–thaw cycles are the inflection point of QSY from brittle failure to plastic failure, and the occurrence of high event rate and the disappearance of low event rate are the precursive characteristics of sample failure.
Based on the established freeze–thaw damage equation, this study reveals the evolutionary patterns of damage quiet, damage acceleration, and damage stabilization in different types of sandstone. It further identifies the damage acceleration phase as the critical stage for damage progression and structural instability.
Introduction
Cold regions refer to areas where the winter is long and cold, with minimum temperatures around −30°C for more than three months, and hot and short summers, with maximum temperatures ranging from 25 to 30°C for about two months. In the autumn and winter seasons, the temperature difference between day and night can be between 15 and 20°C.1,2 Due to the long-term effects of seasonal changes and temperature fluctuations, during the rainy season, water enters the rock mass through the pores. In winter, the water freezes, causing the pores to expand and form new voids, while in summer, the frozen water thaws and seeps into the new pores, softening the rock mass. This cycle continues, and when the freezing forces exceed the rock mass's inherent resistance, it can lead to the development of fractures and fragmentation (Figure 1). Additionally, factors such as vibration and creep can significantly threaten the stability of engineering projects. Once a disaster occurs, it can lead to safety production issues, delays in project progress, or even serious casualties and significant economic losses.3–7 Therefore, this has become an important issue faced collectively by the geotechnical and mining engineering fields. Numerous scholars have conducted extensive research on the freeze–thaw rock mechanics degradation characteristics and damage evolution rules, achieving many significant results.

Freeze–thaw damage in rock masses in cold regions: (a) development of fractures and (b) local fragmentation.
In the early 1960s, Winkler 8 discovered in experiments that when temperatures fall below 0°C, the pore water in rocks would freeze, leading to disintegration once the load-bearing capacity is exceeded. This laid the foundation for studying damage and failure in rocks subjected to freeze–thaw cycles. Subsequently, to clarify the entire process from the onset of self-damage in rocks under freeze–thaw conditions to failure and to provide a theoretical basis for rock mass stability research, scholars9–14 analyzed the damage evolution laws of freeze–thaw rocks from the perspectives of mechanical strength and changes in elastic modulus. They determined that the significant degradation of mechanical properties characterizes the continuous accumulation of internal damage in rocks, serving as a standard for analyzing freeze–thaw damage from a macroscopic perspective. However, this approach has limitations, as it cannot directly reveal the entire process of freeze–thaw damage evolution. To address this drawback, researchers15–19 conducted studies on the changes in microstructural characteristics of rocks before and after freeze–thaw cycles, employing various technical methods based on mechanical testing. They revealed the evolution patterns of pore changes and progressive damage within rocks subjected to freeze–thaw cycles. Subsequently, based on the freeze–thaw damage constitutive model established by Dusan, 20 scholars21–25 explored the damage constitutive model using techniques such as acoustic emission and nuclear magnetic resonance. Among them, the work by Song Yongjun et al.,22–24 which constructed a freeze–thaw damage constitutive relationship based on CT scanning and acoustic emission, is particularly representative. They derived a freeze–thaw damage model with the strain energy release rate as a variable. Additionally, Lu Xiang et al.26–30 optimized the shear strength damage formula for freeze–thaw rock structures using negative exponential degradation parameters, revealing the nonlinear damage fracture mechanism of freeze–thaw rocks.
The aforementioned achievements have established a solid foundation for comprehensively understanding the variations in rock mechanical properties, the progression of damage evolution, and the underlying damage mechanisms under combined freeze–thaw and loading conditions. These findings hold considerable theoretical and practical significance. However, certain limitations remain. Specifically, the existing studies are unable to fully capture the entire process of freeze–thaw-induced damage evolution and do not adequately account for the influence of initial freeze–thaw damage on the mechanical behavior and subsequent damage development of rocks. Furthermore, in real-world engineering applications, rock lithology varies significantly, leading to distinct mechanical responses and damage evolution patterns under freeze–thaw and loading conditions. Such differences play a critical role in the stability of engineering structures in cold regions. Therefore, conducting in-depth and systematic research on the damage evolution mechanisms of different lithological rocks under freeze–thaw and load conditions is key to breaking down the barriers between safe production in cold region engineering and disasters caused by freeze–thaw damage. Based on this, the author focuses on the Green sandstone and Yellow sandstone in cold regions to study the mechanisms of mechanical property degradation and damage evolution. The research conclusions can provide an experimental basis and reference for the stability control, safety assessment, and disaster prediction of freeze–thaw rock masses in cold regions.
Although the findings of this paper offer an experimental basis and reference for stability control, safety assessment, and disaster prediction and early warning systems related to freeze–thaw rock masses in cold regions, there are limitations in directly applying these results to real-world engineering practices. This is primarily due to the discrepancies between laboratory rock specimens and actual engineering structures. To enhance practical applicability, it is essential to further investigate the damage evolution mechanisms of rocks and accurately identify freeze–thaw damage factors. By establishing and deriving a conversion model and corresponding equations that link macroscopic and mesoscopic damage parameters, the developed damage model—when integrated with numerical and physical simulations—can effectively support stability evaluations in cold region engineering. Therefore, continued and intensified research efforts in this field are strongly recommended.
Experimental overview
Sample preparation
The Green sandstone and Yellow sandstone samples used in this test were all collected from the Shuozhou area, Shanxi Province, China. They exhibit a uniform texture, are structurally intact, and show no signs of cracking. Green sandstone is predominantly composed of quartz, feldspar, muscovite, heavy minerals, and rock fragments, with pore-filling materials including siliceous, carbonate, and clayey or silty substances. Yellow sandstone, on the other hand, mainly consists of minerals such as quartz, feldspar, mica, and jadeite, with fillers primarily comprising carbonates, silicates, and clay. There are notable differences in the mineral composition between these two types of sandstone. According to the ISRM 2007 testing guidelines, 31 the samples were prepared into standard specimens measuring 50mm × 100 mm, with an allowable error of ±0.05 mm. The deviation of the cross-section perpendicular to the axis does not exceed ±0.25°, and the unevenness of both ends is ≤0.02 mm. There are five groups of each type of sandstone specimen, with three pieces per group, named QSY0, QSY10, QSY20, QSY30, QSY40, HSY0, HSY10, HSY20, HSY30, and HSY40, numbered as 1, 2, and 3. These specimens underwent 0, 10, 20, 30, and 40 freeze–thaw cycle tests, as shown in Figure 2.
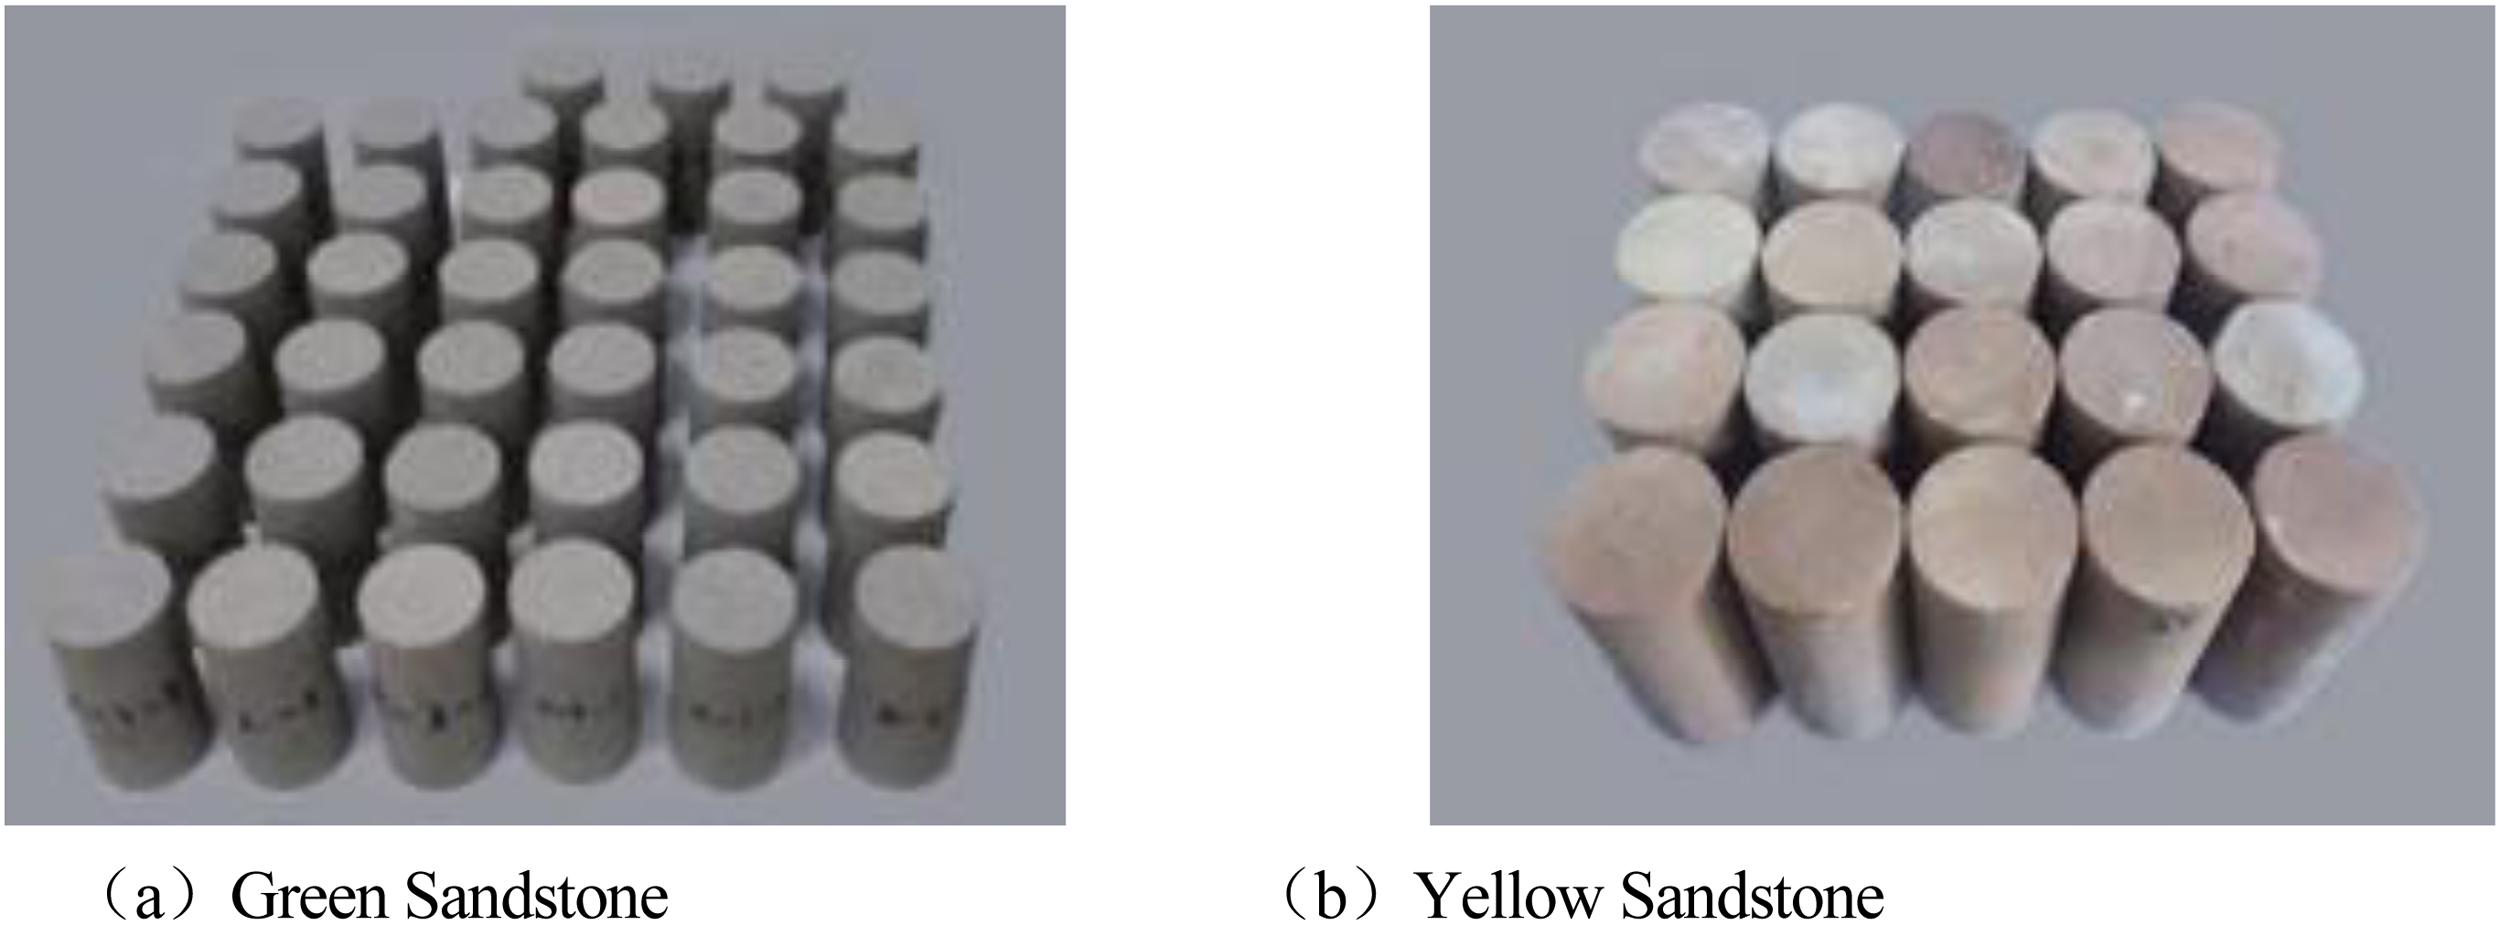
Sandstone specimens: (a) green sandstone and (b) yellow sandstone.
Experimental procedure
First, water-saturated specimens were placed into the automatic low-temperature freeze–thaw testing machine according to their respective groups. Considering the local climatic conditions, summer temperatures can reach up to 30 °C, while winter temperatures may drop as low as −30 °C. Accordingly, based on the regional environmental characteristics, the temperature range for the freeze–thaw cycles was set between −30 °C and 30 °C. The freezing phase was maintained at −30 °C for 4 hours to reflect seasonal duration variations. The thawing phase was conducted at 30 °C for 6 hours, with a transition time of 1 hour for both heating and cooling stages. Humidity during the thawing period was controlled at 60%, as illustrated in Figure 3. Based on this setup, freeze–thaw cycle tests were performed at 0, 10, 20, 30, and 40 cycles, with each cycle lasting 12 hours. Each complete cycle was recorded to analyze the corresponding change characteristics.

Schematic diagram of freeze–thaw cycle conditions.
Next, after the specimens underwent different freeze–thaw cycles, nuclear magnetic resonance and scanning electron microscopy were used to analyze the saturated specimens. This step recorded changes in porosity and microstructure.
Finally, the SAS-2000 microcomputer controlled electro-hydraulic servo rock testing machine and extensometer produced and designed by Changchun Kexin Test Instrument Co., LTD., Jilin Province, China, and the SAEU2S multi-channel detection acoustic emission system produced and designed by Beijing Songhua Technology, China were used to perform compression tests on the specimens after different freezing and thawing times, and the changes of stress-strain and event rate were recorded. The pre-load for the testing machine was set to 2kN, with a loading rate of 0.1 mm/min. The acoustic emission system had a sampling frequency of 100 kHz, a sampling length of 2048, a waveform threshold of 40 dB, a parameter threshold of 40 dB, and a front-end gain of 40 dB, as shown in Figure 4. To ensure the sensitivity of the data collected by the AE sensor, an HB lead core with a diameter of 0.5 mm is used. The lead core is vertically broken at 50 mm from the sensor, ensuring that the height of each break is 25 mm and the interval between each lead break is ≥10 s. This process is repeated 5 times. The peak intensity, rise time, and other parameters of each lead break signal are recorded, with a deviation of ≤±5 dB. The rise time conforms to the typical value of the sensor.
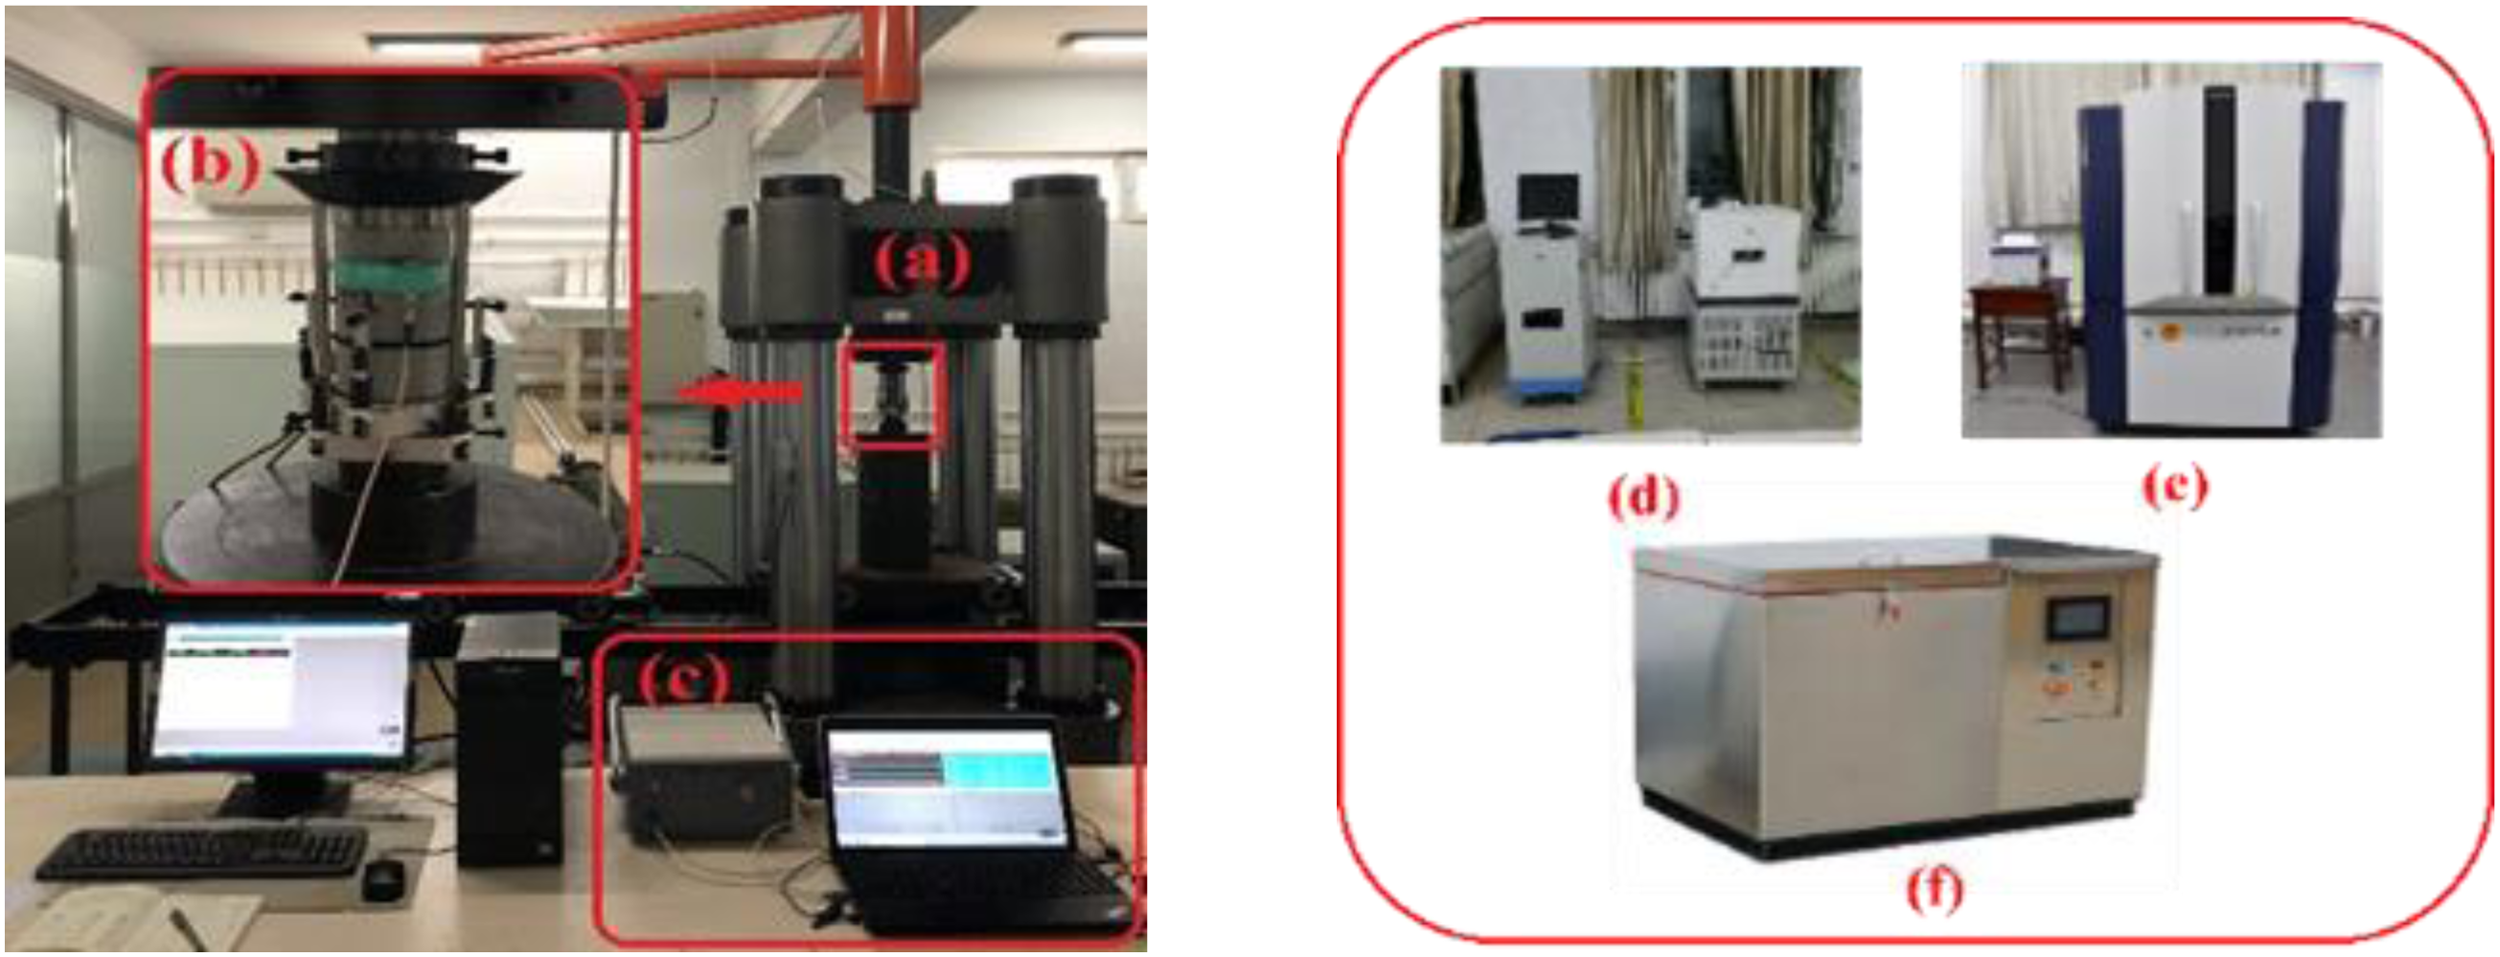
Testing equipment: (a) extensometer, (b) loading system, (c) acoustic emission, (d) nuclear magnetic resonance, (e) CT scan, and (f) sample cutting machine.
Experimental results and analysis
Pore characteristic analysis
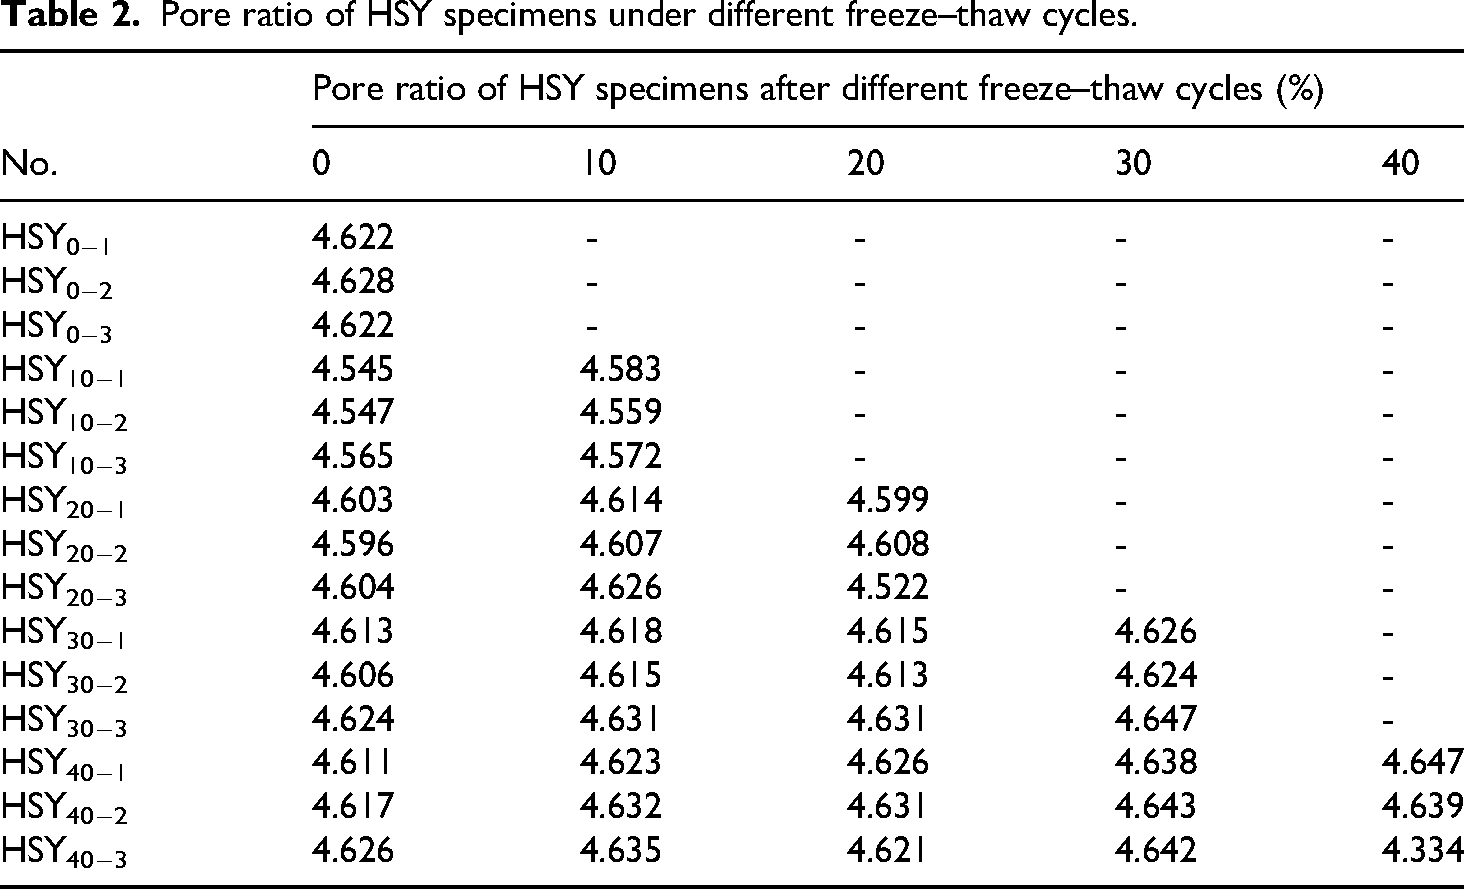
Nuclear magnetic resonance tests were conducted on QSY and HSY specimens subjected to different freeze–thaw cycles, resulting in Tables 1, 2, and 3. The values from Table 3 were fitted to obtain Figure 5.

Curve of average pore ratio fitting variation.
Pore ratio of QSY specimens under different freeze–thaw cycles.

Pore ratio of HSY specimens under different freeze–thaw cycles.
Average pore ratio variation of QSY and HSY.

After QSY and HSY are saturated with water and frozen, the liquid water in the pores crystallizes into a solid state, leading to frost heave and an increase in volume. Once the solid crystals melt, the expanded pore volume can absorb more liquid water, creating a repetitive cycle that continuously enlarges the pore structure. This results in an increase in both porosity and average pore ratio. However, due to the differences in mineral crystallization of the sandstone components, the effects of freeze–thaw cycles on porosity variation also differ. As the number of freeze–thaw cycles increases, the porosity of both specimens shows an upward trend, with a maximum variation of 2.06% for QSY and 0.55% for HSY, indicating that QSY is more significantly affected by freeze–thaw processes under the same conditions, as shown in Tables 1, 2, and 3.
As illustrated in Figure 5, the average pore ratio of QSY gradually stabilizes at a fixed value with increasing freeze–thaw cycles, indicating that the influence of the freeze–thaw cycle on the pore structure of QSY specimens is limited within a certain range. In contrast, although HSY has a lower initial porosity, its porosity exhibits linear growth with increasing freeze–thaw cycles. This demonstrates a greater impact of freeze–thaw action on the pore structure of HSY specimens, as the more cycles occur, the greater the increase in porosity.
In nuclear magnetic resonance tests, the protons (H) in the pore fluid absorb electromagnetic energy due to the applied magnetic field, generating a significant amount of energy signals, a phenomenon referred to as relaxation.32,33 According to references,34,35 there are three types of relaxation in the fluid within the pores: volume relaxation, surface relaxation, and diffusion relaxation, with surface relaxation being relatively more substantial than the other two. It is known that pore size is directly proportional to the T2 distribution. With T2 = 10 ms as the boundary, T2 < 10 ms indicates micropores, while T2 > 10 ms indicates macropores. Based on the nuclear magnetic resonance test results, the T2 spectra for QSY and HSY at different freeze–thaw cycles are plotted (Figure 6). Due to the minor differences in T2 spectra for the same specimen, one sample from each rock type is selected for analysis.

T2 Spectra of QSY and HSY under different freeze–thaw cycles: (a) QSY40-1; (b) HSY40-1.
As shown in Figure 6, before freeze–thaw, the T2 distributions of QSY and HSY range between 10−1 to 104 ms and 10 to 10³ms, respectively, indicating that before freeze–thaw, QSY and HSY contains both small and large pores. As the number of freeze–thaw cycles increases, the T2 distribution curve shifts to the right, becoming more pronounced with each additional cycle. The rightward shift for HSY is more significant than that for QSY, with peak intensities of 1400 n/a and 5000 n/a, respectively. This indicates that with an increasing number of freeze–thaw cycles, the number of pores in QSY increases more noticeably, accompanied by the transformation of small pores into large pores and the expansion of fractures.
Analysis of appearance deterioration characteristics
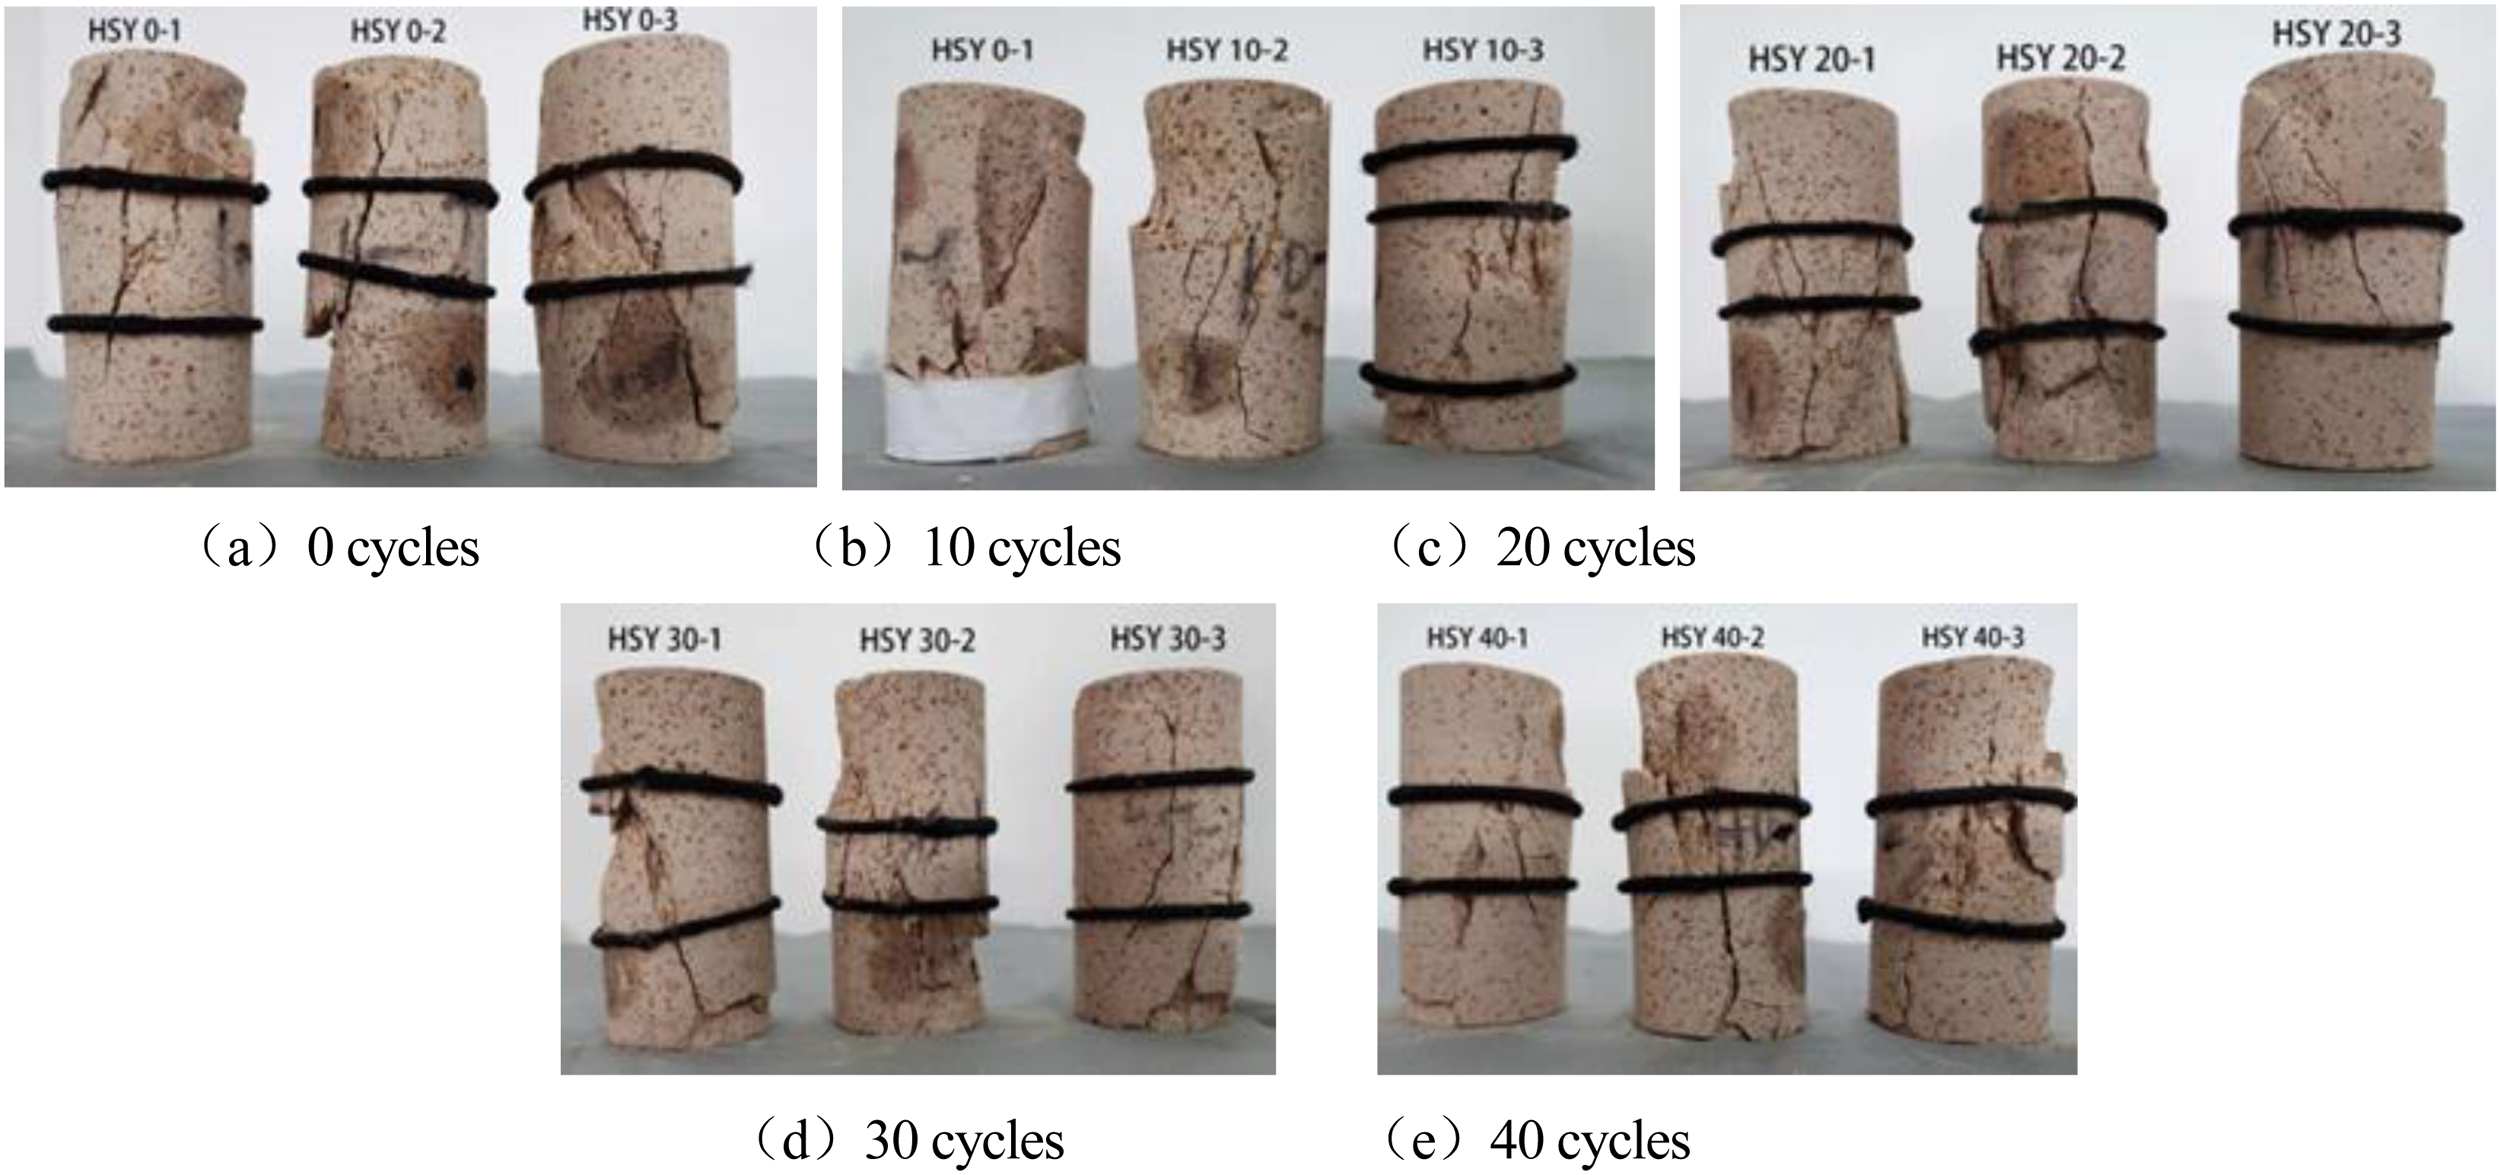
As shown in Figures 7, 8, and 9, QSY and HSY exhibit different appearance deterioration characteristics under varying freeze–thaw cycles. There are no significant changes observed after 10 and 20 cycles. However, after 30 cycles, with the increase in the quantity and size of pores, QSY begins to show the formation of debris and particle disintegration within its structure, leading to the formation of cracks between the mineral particles and the cementing material, resulting in localized cracks in appearance, while HSY shows no obvious changes. After 40 cycles, during the process of the transformation of small pores into large pores, intact particles within QSY disintegrate into multiple smaller particles, causing the localized cracks in its appearance to evolve into a network of intersecting cracks. HSY continues to show no significant damage in appearance. This further confirms that QSY is more significantly affected by freeze–thaw conditions compared to HSY under the same conditions.

Appearance deterioration of specimens under different freeze–thaw cycles: (a) 0 cycles, (b) 10 cycles, (c) 20 cycles, (d) 30 cycles, and (e) 40 cycles.

Schematic diagram of internal particle damage in the specimens: (a) mineral debris, (b) particle disintegration, and (c) crack penetration.
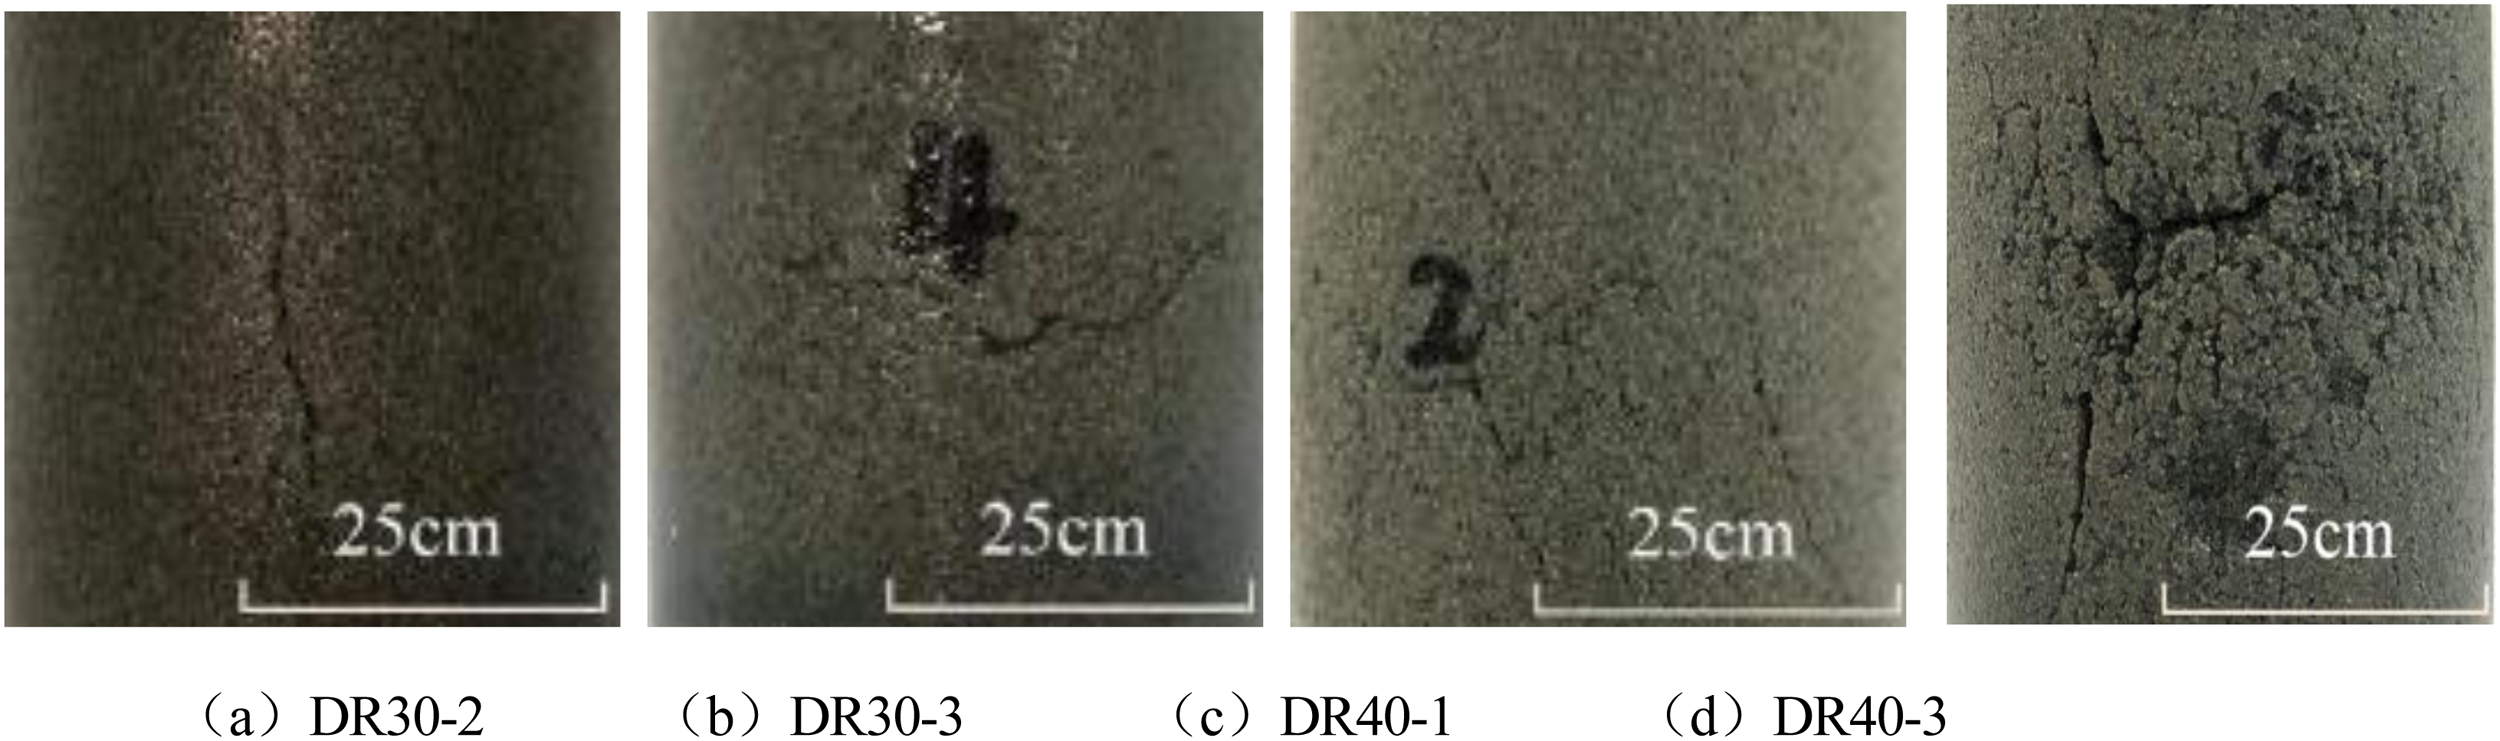
Appearance deterioration characteristics of QSY specimens after freeze–thaw cycles: (a) DR30-2, (b) DR30-3, (c) DR40-1, and (d) DR40-3.
Analysis of axial stress–strain and fracture characteristics
As shown in Figures 10 and 11, the stress-strain curves of QSY and HSY under different freeze–thaw loading conditions reveal that after 0, 10, and 20 cycles, the stress-strain curves of both rock types are similar and concentrated. Notably, the peak stress of QSY continues to decrease with the increase in the number of cycles, while HSY shows minimal change, indicating that the mechanical properties of QSY are more significantly affected by freeze–thaw cycles. Both specimens exhibit brittle failure, with QSY undergoing X-type conjugate shear failure and HSY displaying monoclinic shear failure, as illustrated in Figures 12 and 13 (a, b, c). After 30 cycles, due to the different internal structure and mineral composition of the specimens, as well as the different pore structure and damage changes under the freeze–thaw cycle, the stress-strain peak of QSY specimen 1 is greatly reduced compared with that of specimen 2 and 3, HSY shows a gradual decrease in peak stress and a slow increase in strain. This indicates that the degradation of mechanical properties under freeze–thaw loading conditions is more pronounced for QSY, leading to faster crack initiation and propagation. Upon reaching peak stress, both specimens experience brittle shear failure, but there is a trend for QSY to transition toward plastic failure, with an increased slope of the main crack, as shown in Figures 12 and 13(d). After 40 cycles, the peak stress of QSY drops sharply to about one-fifth of its original value at 0 cycles, while HSY shows a slow decrease in peak stress. Following failure, QSY exhibits plastic failure with the main crack having a nearly vertical slope, whereas HSY displays brittle failure accompanied by the formation of some tensile cracks, with a certain degree of expansion in the slope of the failure surface, as illustrated in Figures 12 and 13(e).
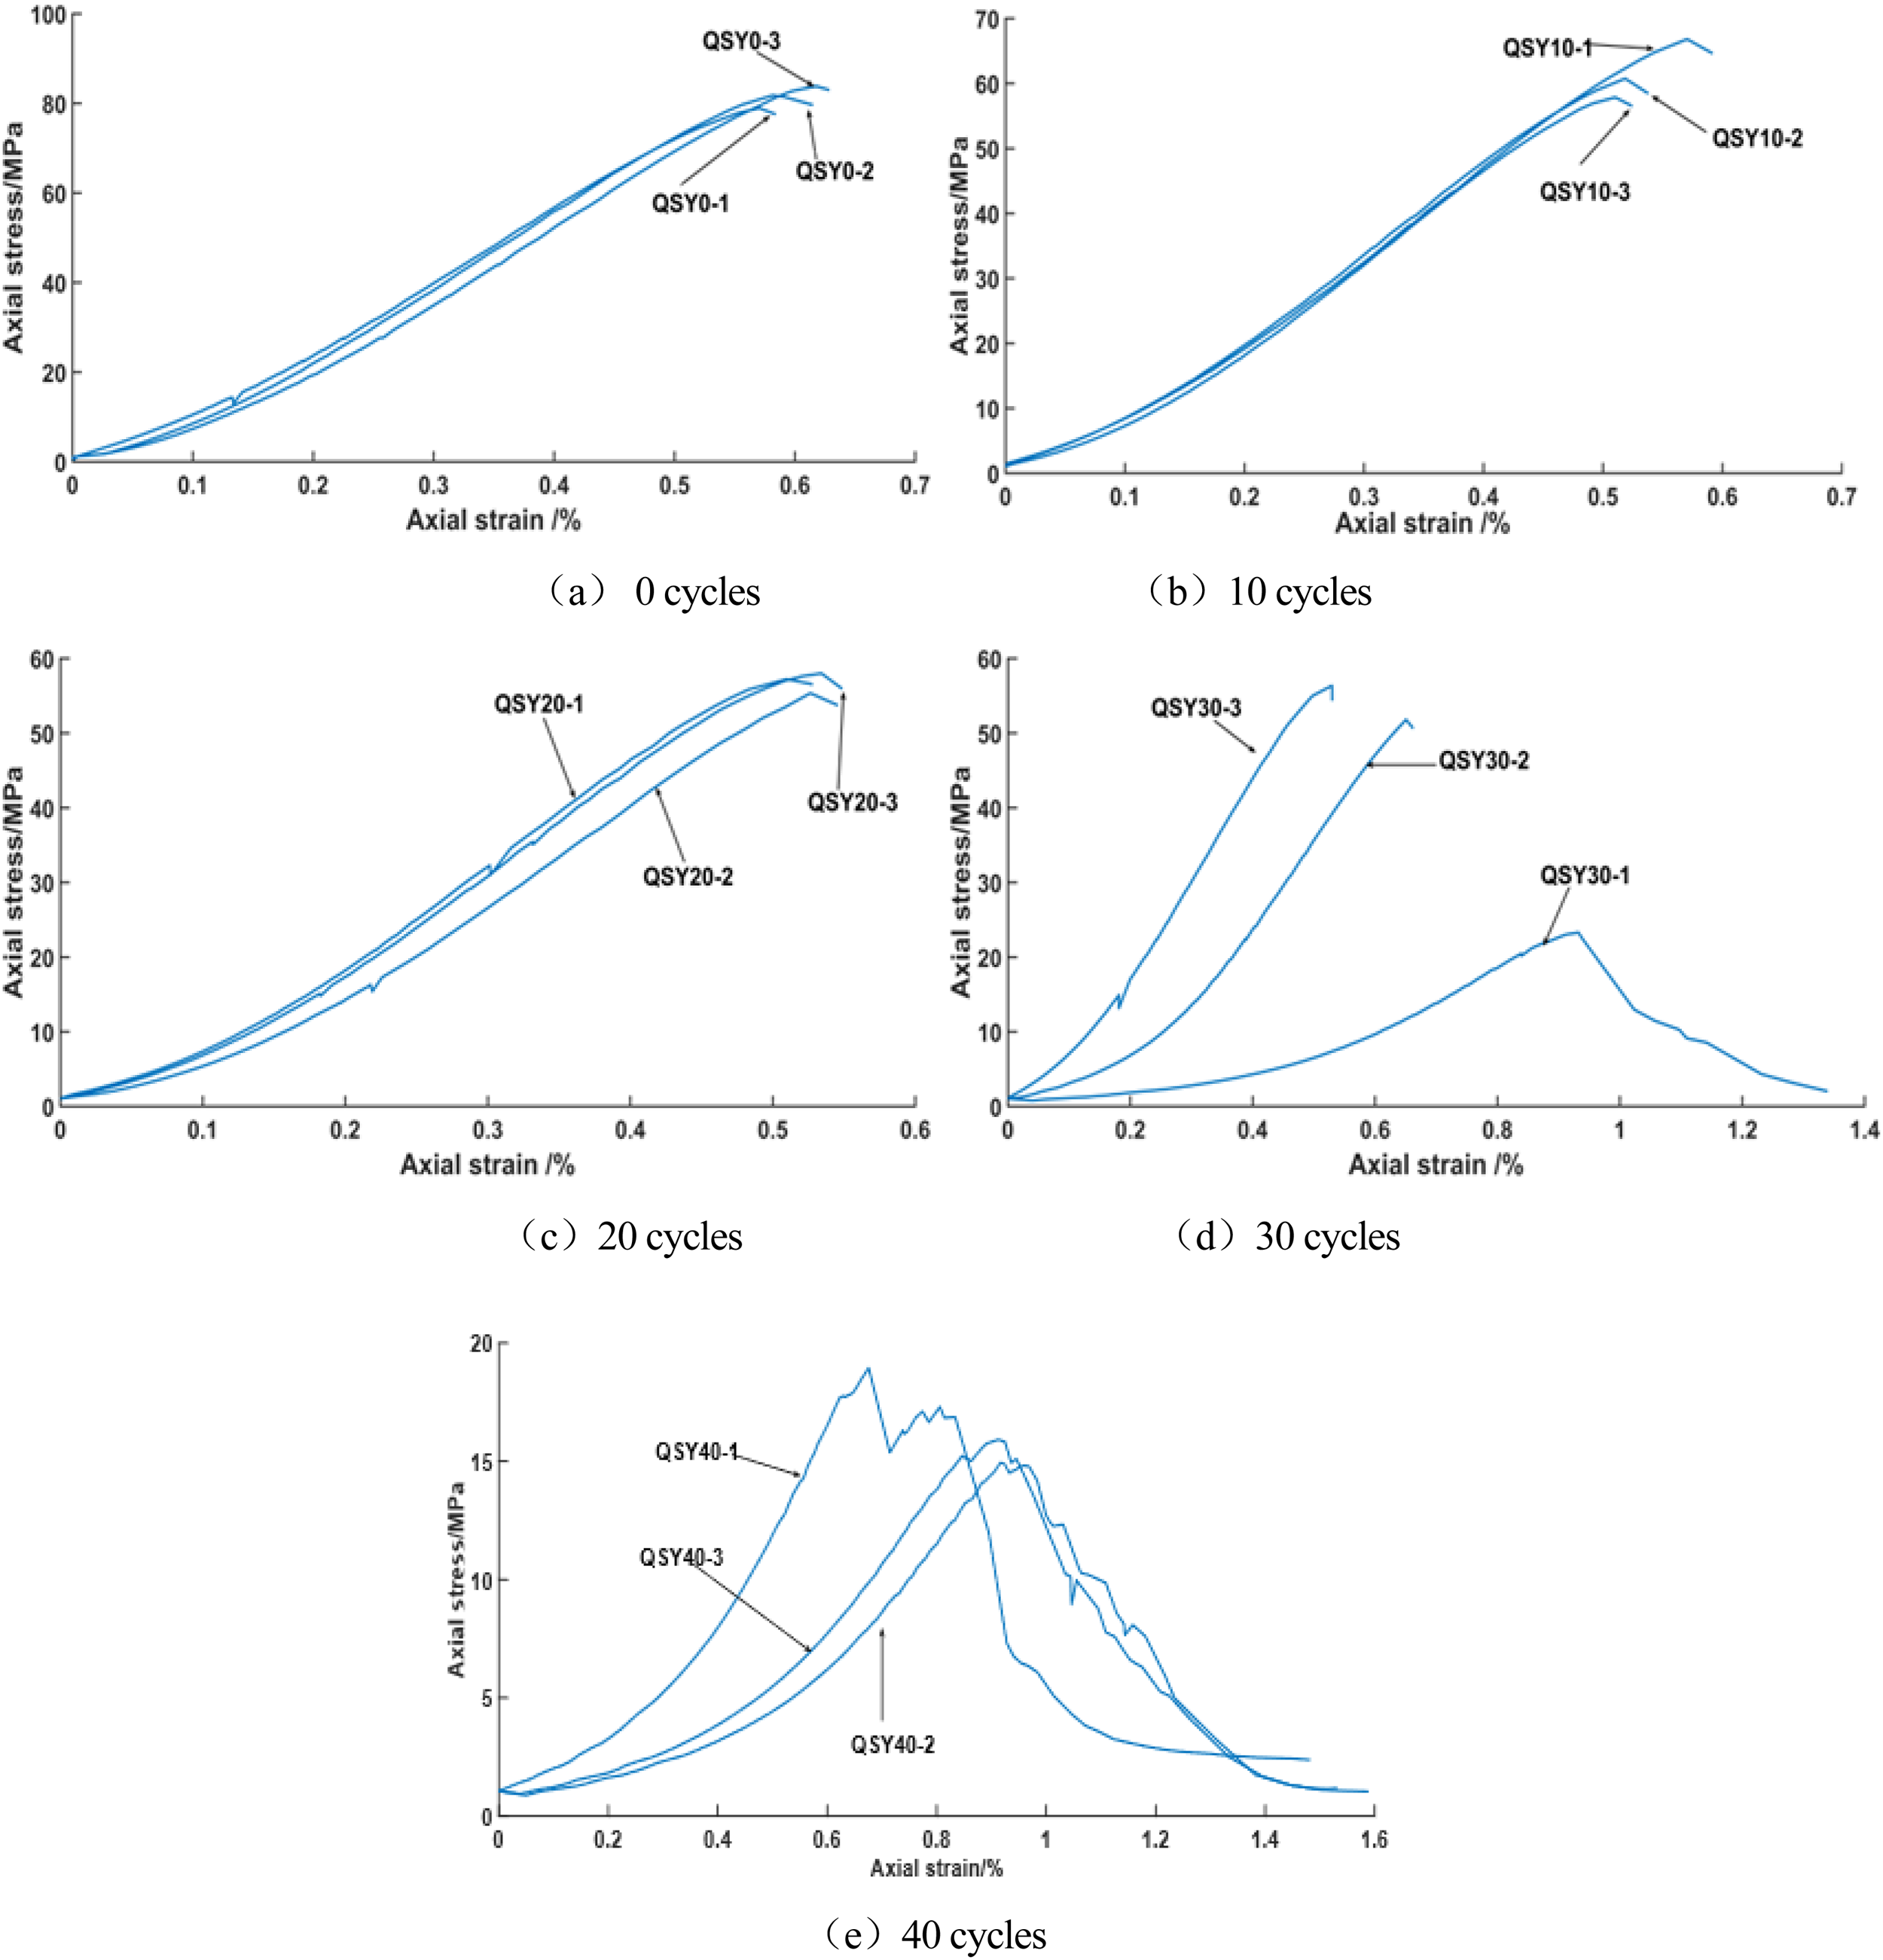
Axial stress-strain curves of QSY at different numbers of cycles: (a) 0 cycles, (b) 10 cycles, (c) 20 cycles, (d) 30 cycles, and (e) 40 cycles.

Axial stress-strain curves of HSY at different numbers of cycles: (a) 0 cycles, (b) 10 cycles, (c) 20 cycles, (d) 30 cycles, and (e) 40 cycles.

Failure characteristics of QSY under different freeze–thaw cycle numbers: (a) 0 cycles, (b) 10 cycles, (c) 20 cycles, (d) 30 cycles, and (e) 40 cycles.
Failure characteristics of HSY under different freeze–thaw cycle numbers: (a) 0 cycles, (b) 10 cycles, (c) 20 cycles, (d) 30 cycles, and (e) 40 cycles.
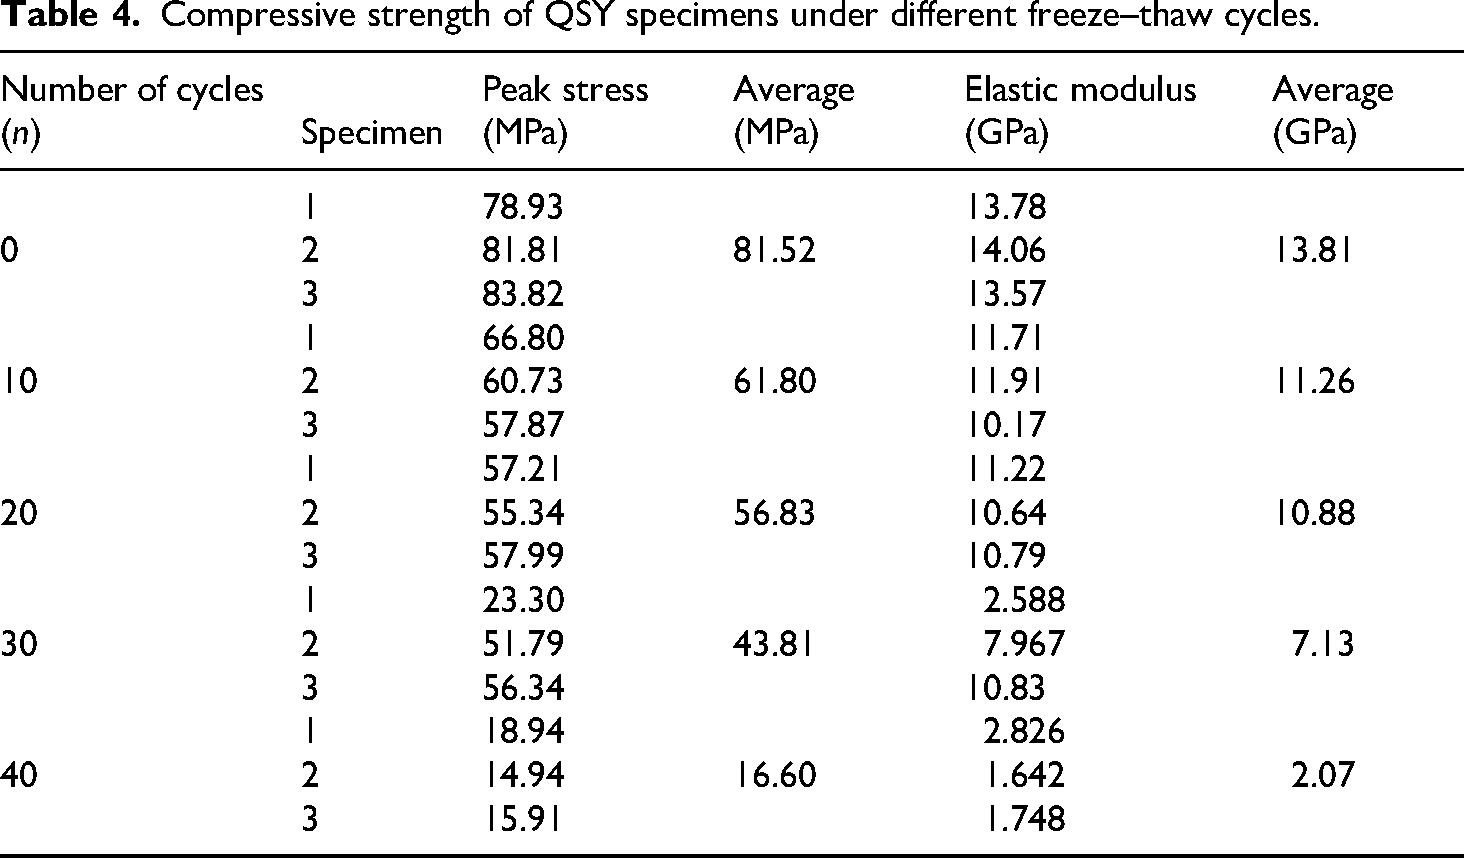
Under different freeze–thaw cycles and loading conditions, the peak stress and elastic modulus of QSY show a negative correlation with the number of freeze–thaw cycles; as the number of cycles increases, the peak stress and elastic modulus decrease. For 0 cycles, the average peak stress and elastic modulus are 81.52 MPa and 13.81 GPa, respectively, while after 40 cycles, the average peak stress and elastic modulus drop to 16.60 MPa and 2.07 GPa, representing reductions of 79.64% and 85.01%, respectively. In contrast, HSY exhibits a more gradual decline, with reductions in peak stress and elastic modulus of 9.15% and 6.14%, respectively. This indicates that freeze–thaw cycles have a more significant effect on the mechanical properties of QSY compared to HSY, and that the internal deterioration of rock specimens at high freeze–thaw cycles far exceeds that at low freeze–thaw cycles, as shown in Tables 4 and 5.
Compressive strength of QSY specimens under different freeze–thaw cycles.
Compressive strength of HSY specimens under different freeze–thaw cycles.

Analysis of acoustic emission characteristics
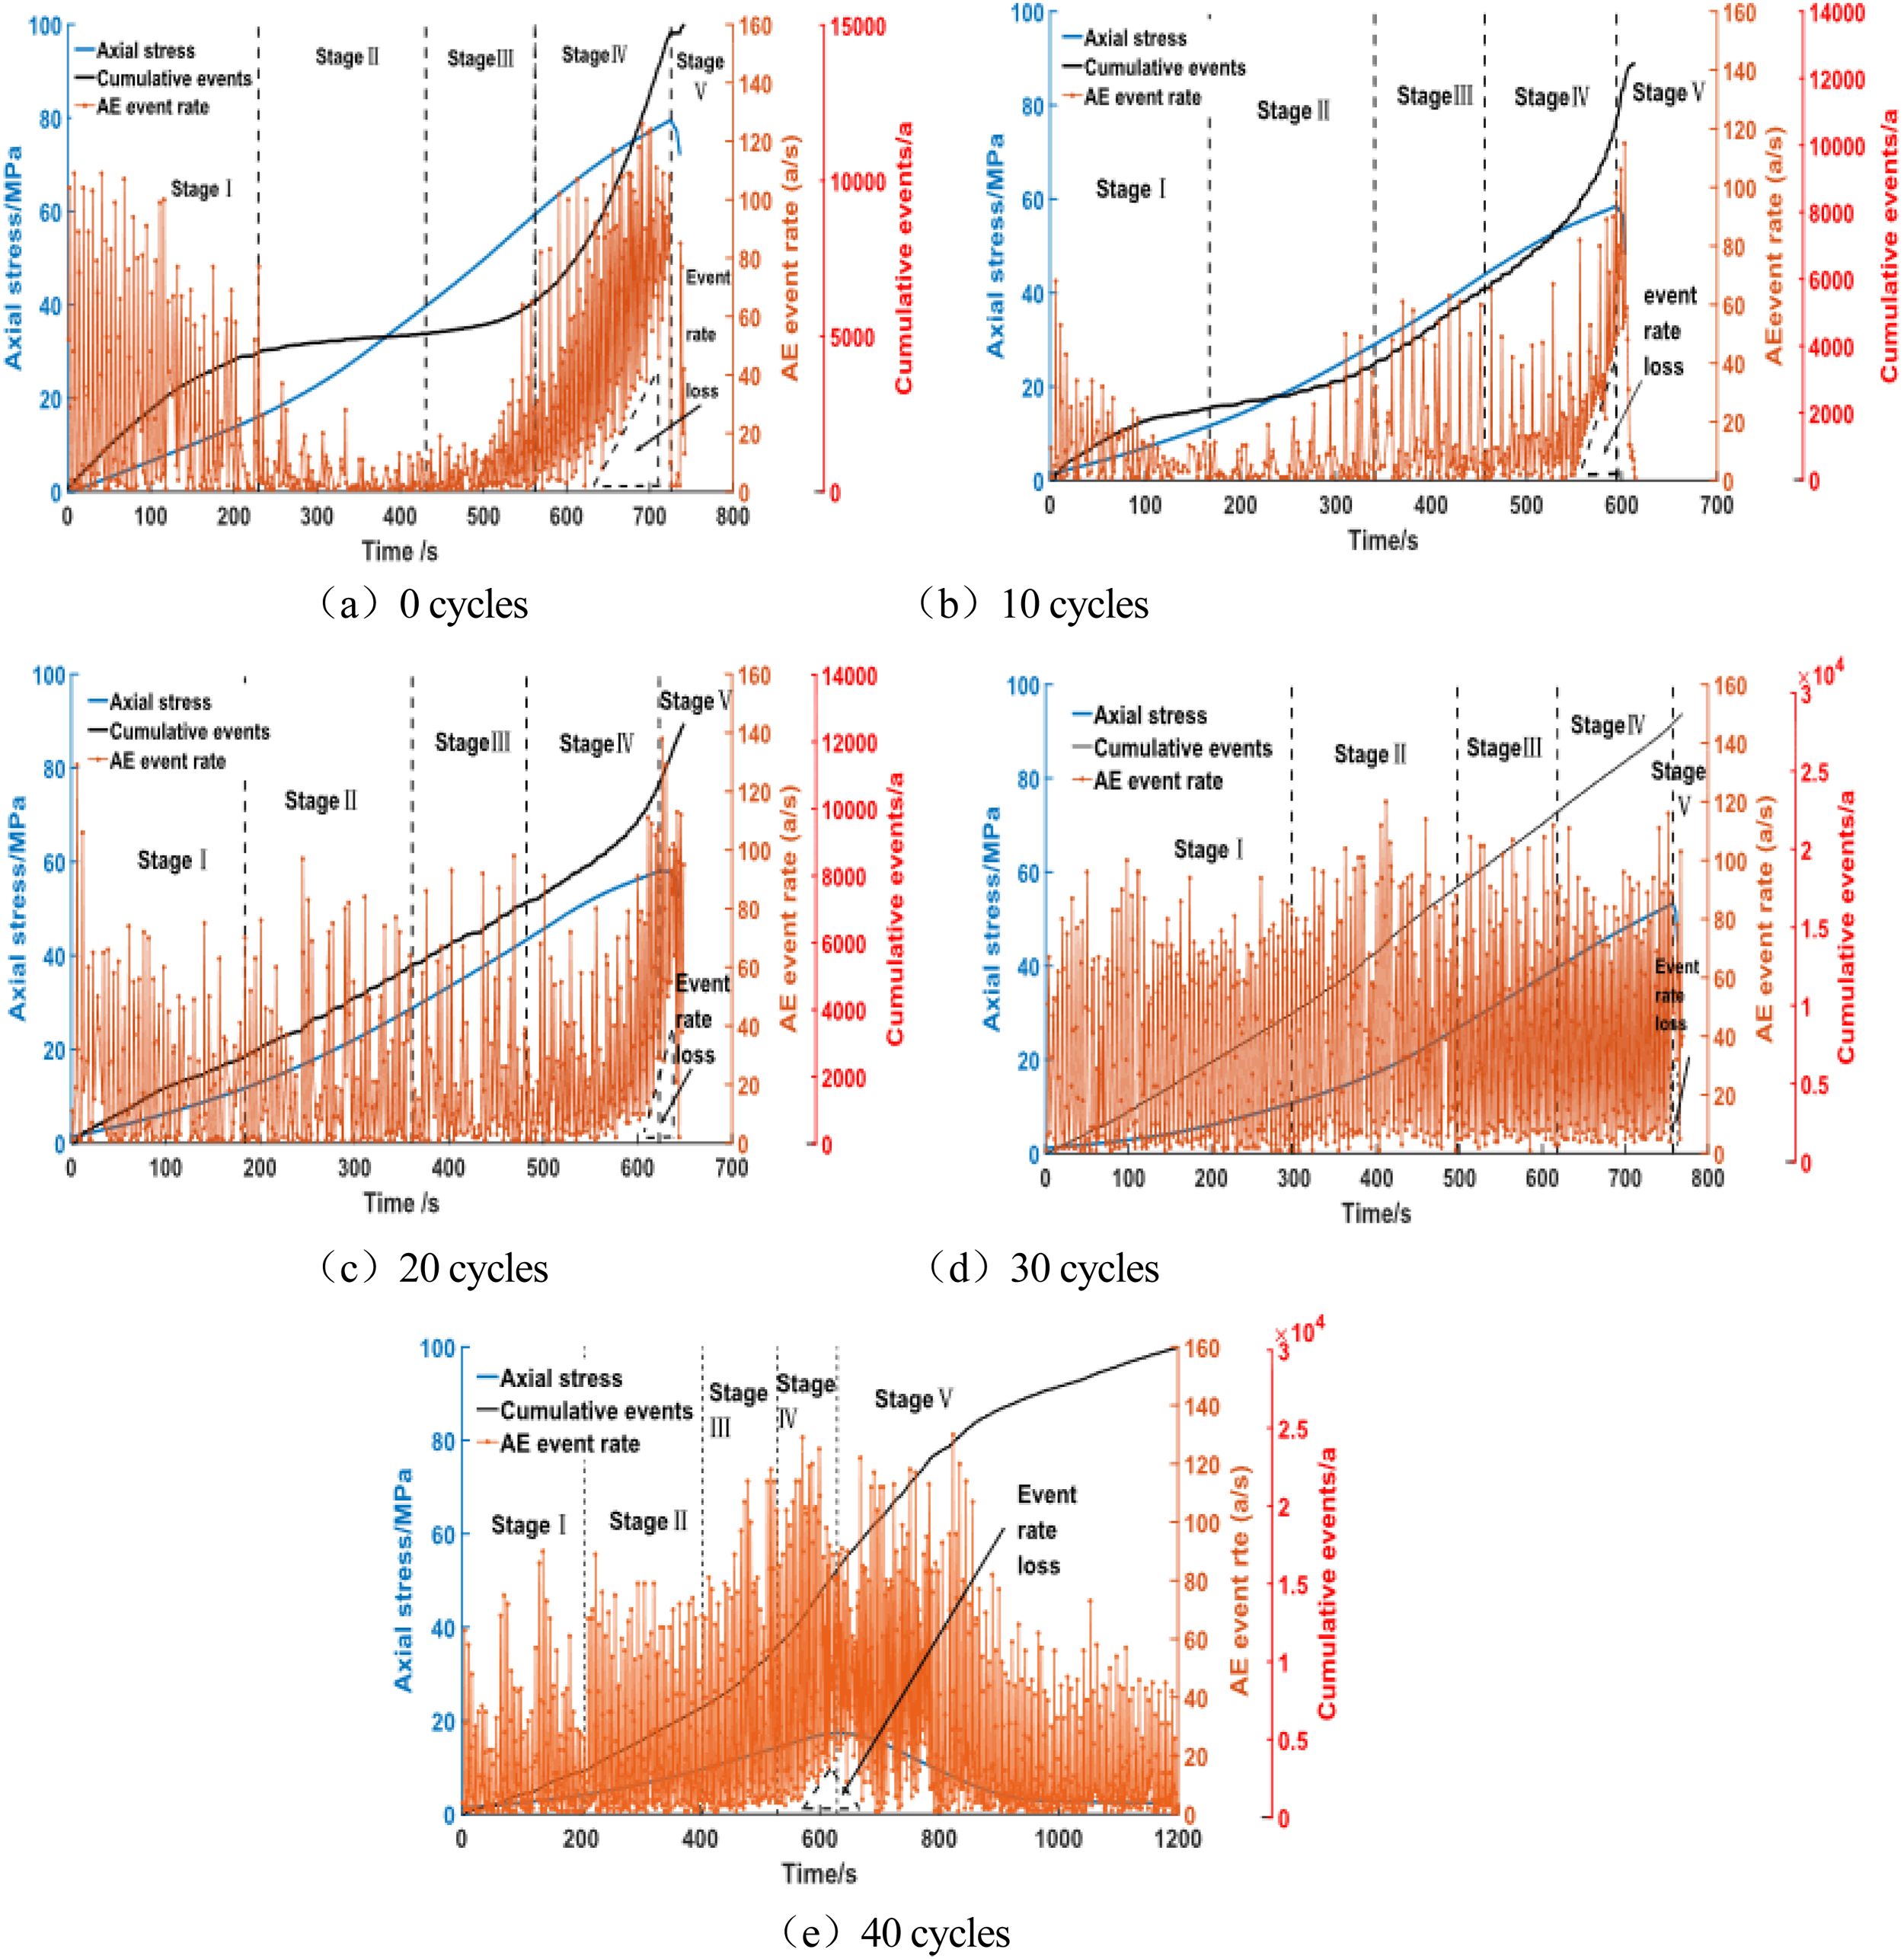
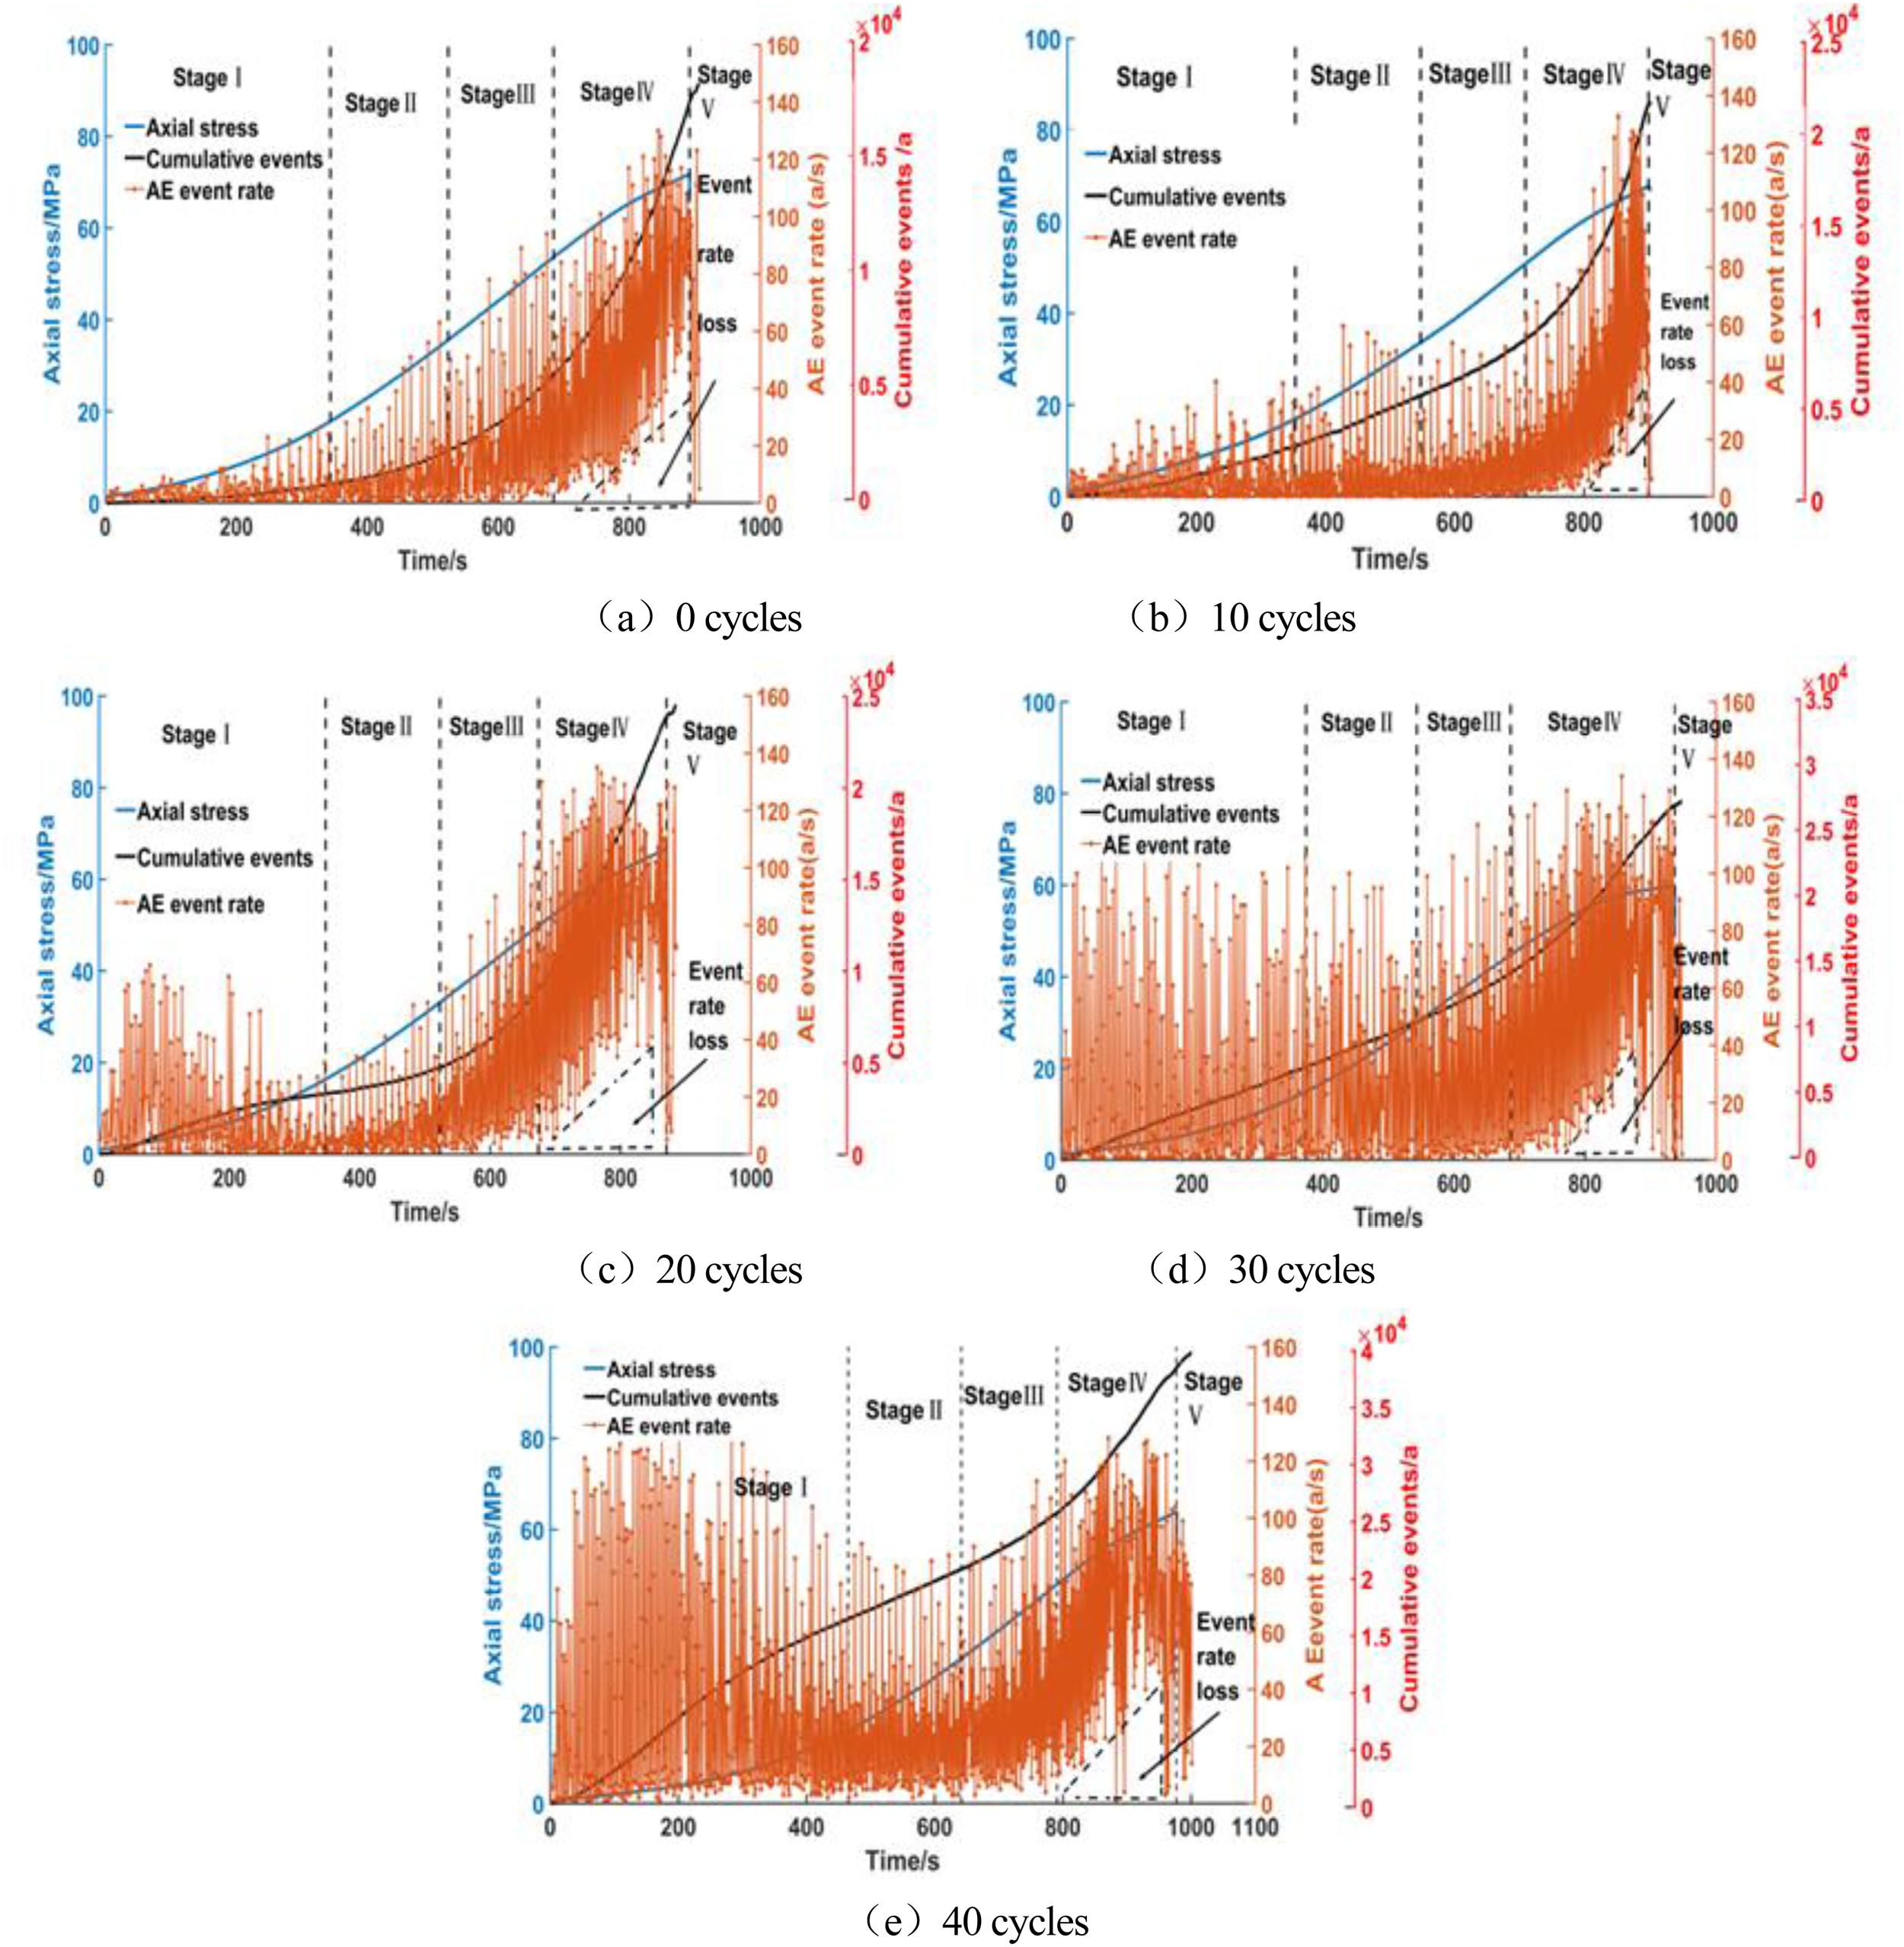
As shown in Figure 14, based on the volumetric strain method for cracking,36,37 the stress-strain behavior under loading can be divided into five stages: microcrack closure (Stage I), elastic deformation (Stage II), yield (Stage III), unstable crack propagation (Stage IV), and post-peak failure (Stage V).

Acoustic emission (AE) refers to the phenomenon of transient elastic waves generated by the rapid release of energy accompanying the deformation and failure of rock under load. These signals can reflect the degradation patterns and failure characteristics of the rock.38,39
The AE event rate is defined as the number of AE events per unit time, while the cumulative event count refers to the accumulation of event numbers. By combining these two parameters with stress over time, the relationship between AE event rate, cumulative event count, and axial stress over time can be obtained, as shown in Figures 15 and 16. Due to space limitations, one specimen from each type of rock is selected for analysis, and the details will not be elaborated further. As depicted in Figures 15 and 16, the characteristic distributions of the two types of rock specimens under different freeze–thaw and loading conditions are as follows:
1. Overall variation characteristics:
An event rate, cumulative event number, and stress-time relationship for QSY: (a) 0 cycles, (b) 10 cycles, (c) 20 cycles, (d) 30 cycles, and (e) 40 cycles.
An event rate, cumulative event number, and stress–time relationship for HSY: (a) 0 cycles, (b) 10 cycles, (c) 20 cycles, (d) 30 cycles, and (e) 40 cycles.
For low freeze–thaw cycles (0, 10, 20 cycles), the event rate of QSY exhibits an approximate “U”shape, while the cumulative event count displays an“S”shape characterized by “increasing and slowing down- approximately flat-accelerating increase.”As the number of cycles increases, the“S”shape gradually disappears, with cumulative event counts of 14,993, 13,333, and 13,432 for 0, 10, and 20 cycles, respectively, with the “U” shape being most pronounced at 0 cycles. For high freeze–thaw cycles (30, 40 cycles), the event rate for QSY remains high throughout the 30 cycles, leading to the disappearance of the“U”shape. The cumulative event count shows linear growth, totaling 28,122 events. For 40 cycles, the event rate takes on a“convex”shape, with the cumulative event count first accelerating and then slowing down, reaching a total of 29,949 events, an increase of 6.5%. Throughout this process, the mechanical properties of the specimens continue to degrade with increasing cycle counts, especially after 40 cycles, where brittle failure transitions to plastic failure.
For low cycle counts (0, 10, 20 cycles), the event rate for HSY approximates an exponential trend, initially exhibiting low events before gradually transitioning to higher event rates, ultimately forming a “√” shape. For high cycle counts (30, 40 cycles), it is dominated by high events and exhibits a “U” shape, with total event counts of 31,314 and 39,508 after 30 and 40 cycles, respectively, corresponding to an increase of 26.16%. This indicates that as freeze–thaw cycles increase, the internal porosity of the specimens continues to grow, resulting in changes to the pore structure under load, which leads to a continuous increase in event counts until brittle failure occurs, at which point the growth ceases.
2. Stage variation characteristics:
Based on the volumetric strain method for cracking, the event rates of QSY and HSY can be divided into five stages.
Stage I: For QSY, the event rate is high during the early period but decreases initially and then increases with the number of cycles. This behavior reflects the closure of primary pores, defects, and freeze–thaw damage zones. For HSY, the internal structure is dense at the beginning, with low event rates. As the number of freeze–thaw cycles increases, the event rate rises, indicating that internal porosity continues to accumulate with more cycles. The pore structure becomes increasingly compacted under load, leading to a sustained increase in the event rate.
Stages II and III: For QSY, the event rate during low freeze–thaw cycles is below 20 events/s, while for high freeze–thaw cycles, the event rate continuously increases, reaching a maximum of 120 events/s at 40 cycles. This suggests that under low freeze–thaw cycles, there are micro-fractures developing within the specimen, but no major cracks are generated. As the number of cycles increases, the bonding between particles weakens continuously, leading to the expansion and interconnection of pores and fractures, ultimately forming large cracks. After reaching a peak, the failure mode transitions from brittle to plastic. For HSY, during low freeze–thaw cycles, the event rate increases with the loading, while there are no significant changes in the event rate during high freeze–thaw cycles. This indicates that there is a deterioration in the bonding between particles in the early stages of cycling; however, due to the stability of the rock's internal structure, there are no further changes as the number of cycles increases. Under external loading, the event rate stabilizes and remains constant.
Stages IV and V: For QSY, during low freeze–thaw cycles, the event rate rapidly increases due to the accelerated generation and expansion of cracks. It reaches a maximum of 138 events/s after 40 cycles, then gradually decreases until failure occurs at peak stress. This indicates that a regional crack network within the specimen has matured and formed connections with visible freeze–thaw damage areas, resulting in the formation of macro-cracks. For HSY, the event rate also increases rapidly during low freeze–thaw cycles, peaking at around 140 events/s in Stage IV, while the event rate during high freeze–thaw cycles grows more slowly, reaching a maximum of about 130 events/s. This suggests that the degradation of specimens under both high and low freeze–thaw cycles is primarily manifested in an increase in pore quantity, with minimal impact on the bonding strength between particles. Additionally, after 20 cycles, the growth of pores tends to stabilize.
3. Low event rate absence characteristics:
Both QSY and HSY exhibit phenomena of low event rate absence under load, with the signals in the absence areas being very active. However, the area, location, and number of absences differ. Literature40,41 considers this phenomenon as a precursor to failure. For QSY during low freeze–thaw cycles, the absence area is located at the peak stress, and as the number of freeze–thaw cycles increases, the absence area gradually decreases. This indicates that internal pores and cracks continue to develop and accumulate during this process, leading to high event rates and the formation of low event rate absence phenomena. In high freeze–thaw cycles, a significant low event rate absence occurs simultaneously with high event rates, indicating that macro-damage phenomena have formed within the specimen, even though the peak stress has not yet been reached. After macro-damage occurs, pore and crack development continue, resulting in the absence of low event rates. For HSY, in both high and low freeze–thaw cycles, the low event rate absence areas are located at the peak stress, with minimal changes in the absence area. The event rates in these absence areas are also very active, indicating that there is no excessive damage phase as seen in QSY, and the influence of freeze–thaw cycles is limited, with brittle characteristics being more pronounced, leading to macro-damage occurring near the peak stress.
Damage evolution law analysis
As a natural medium, rock exhibits a variety of pore structures. Under the influence of freeze–thaw cycles and external loading, the internal structural degradation is exacerbated, leading to alterations in overall stability and mechanical properties. According to the previous discussion, there are significant differences in mechanical parameters, such as peak stress and elastic modulus, as well as damage characteristics between QSY and HSY under freeze–thaw and loading conditions. Phenomenological damage mechanics29,42 suggests that the response of the macroscopic physical and mechanical properties of rocks can characterize the degree of internal deterioration. Based on this, the elastic modulus E(N,T)of the rock specimens after freeze–thaw cycles is selected to define the freeze–thaw damage variable Df, expressed as:
where E(N,T)—ēlastic modulus after 10, 20, 30, and 40 freeze–thaw cycles; E0—elastic modulus before any freeze–thaw cycles.
Lemaitre
43
pointed out that the damage deformation of rock specimens under load is continuous and can be described by the Lemaitre stress equivalence principle, which is given by
where σ—nominal stress, MPa;
Literature42,44 indicates that the micro-unit damage strength of rock specimens under load follows a Weibull distribution, represented as:
where f—micro-unit distribution variable;f0—distribution function parameter;
The damage variable 
The number of events, as a characteristic parameter of acoustic emission, can effectively reflect the degree of damage to the rock under load. If the cumulative event count of the rock specimen under load is C0,the C(ε)is the cumulative event count at strain ε. Thus:
By substituting Eqs. (4) and (5), we obtain:
Assuming that the portion of the rock specimen without damage follows Hooke's law, the damage under load can be expressed as:
Literature
44
points out that the damage zone of rock specimens under freeze–thaw and load can be divided into freeze–thaw damage zone, load damage zone, and undamaged zone, leading to the following relationship:


where V—total volume, cm3; V0—undamaged volume, cm3; V1—freeze–thaw damaged volume, cm3; V2—load damaged volume, cm3; D—damage variable under freeze–thaw and loading conditions.
By substituting Eqs. (8), (9), (10), and (11), we obtain:
Substituting Eqs. (1) and (12) into Eq. (7) results in:
By incorporating Eqs. (1) and (6) into Eqs. (12) and (13), we derive the evolution equation for the total damage variable under freeze–thaw and loading conditions, expressed as:

According to Eq. (15) and combining with Table 6, we can obtain the damage evolution curves for QSY and HSY under different freeze–thaw and loading conditions, as shown in Figure 17.

Damage evolution curves under different freeze–thaw and loading conditions: (a) QSY and (b) HSY.
Evolution table of QSY and HSY event numbers under freeze–thaw cyclic loads.

As shown in Figure 17, QSY can be divided into three stages of damage evolution under different freeze–thaw cycles and loading: damage quiet stage, damage acceleration stage, and damage stabilization stage, while HSY comprises two stages: damage quiet stage and damage acceleration stage. Damage Quiet Stage: The slopes of the curves for both rock specimens approach 0. Due to the differences in material composition and density between QSY and HSY, there are variations in the initial damage values under freeze–thaw cycles. The fewer the freeze–thaw cycles, the smaller the initial damage value, and vice versa. Notably, after 40 freeze–thaw cycles, QSY has developed a network of intersecting cracks on its surface, resulting in an initial damage value as high as 0.68. In contrast, HSY, being structurally denser, only shows a damage value of 0.17 after 40 freeze–thaw cycles. In this stage, both rock specimens predominantly undergo elastic deformation, and the impact of loading on their failure is minimal. Damage Acceleration Stage: Under sustained loading, the damage variable and the slope of the curves for both rock specimens continue to increase, exhibiting a concave upward trend. The smaller the initial damage value, the more significant the influence of the load. HSY fails after reaching its peak stress, with the damage variable quickly trending towards 1. Damage Stabilization Stage: As loading continues, internal cracks in QSY grow and propagate under both high and low freeze–thaw cycles. Once the damage value reaches a certain level, it gradually slows down and stabilizes. After reaching peak stress, failure occurs, and the damage variable approaches 1. In this stage, the larger the initial damage value, the longer the time to stabilize.
To establish a scientific foundation for stability control, safety assessment, and disaster prediction and early warning of freeze–thaw rock masses in cold regions, this study focuses on Green sandstone and Yellow sandstone samples from a specific engineering project in a cold region. Initially, freeze–thaw cycle tests were conducted for 0, 10, 20, 30, and 40 cycles within a temperature range of −30°C to 30°C. The changes in porosity and microstructure of the saturated specimens after each cycle were analyzed using nuclear magnetic resonance (NMR) and scanning electron microscopy (SEM), enabling an assessment of the damage sustained by the two types of rock specimens due to freeze–thaw action. Subsequently, compression tests were carried out on both types of specimens after different freeze–thaw cycles using a microcomputer-controlled electro-hydraulic servo rock testing machine combined with a multi-channel acoustic emission detection system, allowing for an in-depth analysis of the damage evolution characteristics and mechanisms under varying freeze–thaw and loading conditions. Finally, a damage model was developed to examine the stages and differences in damage evolution of the two rock types under various freeze–thaw cycles and loading conditions.
Conclusions
Through freeze–thaw cycle tests, the evolutionary patterns of QSY and HSY in terms of changes in pore structure and macroscopic failure characteristics were revealed. It was determined that the number of freeze–thaw cycles is the main reason affecting the differences in pore structure and macroscopic failure characteristics between QSY and HSY. As the number of freeze–thaw cycles increases, the growth in pore quantity for QSY is more pronounced than that for HSY, accompanied by the disintegration of mineral particles. By the end of the cycles, QSY exhibits a network of intersecting cracks in appearance, while HSY shows no changes.
Under the same loading conditions, the peak stress and elastic modulus of both QSY and HSY continuously decrease during freeze–thaw cycles, with a more significant reduction observed in QSY. Particularly, after 40 cycles, the reductions in peak stress and elastic modulus for QSY are 83.06% and 85.01%, respectively, while HSY shows reductions of only 9.15% and 6.14%. Moreover, the internal deterioration of rock in high freeze–thaw cycles is much greater than in low freeze–thaw cycles, with QSY displaying this more prominently.
The evolution pattern of QSY transitioning from brittle failure to ductile failure was revealed, clarifying the failure characteristics of QSY and HSY based on event rate, cumulative event count, and the absence of low event rates. It was found that 30 freeze–thaw cycles represent the turning point for QSY when transitioning from brittle failure to ductile failure. The simultaneous occurrence of a high event rate along with the absence of a low event rate serves as a precursor characteristic for the failure of rock specimens.
Through the application of the damage model under freeze–thaw cycles and loading conditions, the evolution characteristics of three distinct damage stages—damage incubation, damage acceleration, and damage stabilization—for QSY, as well as the damage incubation and damage acceleration phases for HSY, have been identified. It was clarified that the initial damage value is determined by the number of freeze–thaw cycles; the more cycles, the larger the initial damage value. Specifically, QSY's initial damage value can reach 0.68 after 40 cycles, while HSY's is only 0.17, representing just 25% of QSY's value. This confirms that under the same conditions, QSY is more significantly affected by freeze–thaw cycles.
Footnotes
Acknowledgments
This work presented in this paper was fnancially supported by the National Natural Science Foundation of China (Nos. 52064043, 51464036 and 52464014), Central guidance for local scientific and technological development Foundation (No. 2024ZY0068), Fundamental Research Program of Shanxi Province (Nos. 202403021222358 and 202403021212128), Scientific and technological innovation projects of colleges and universities in Shanxi Province (No. 2024L436), Shanxi Institute of Technology high-level talent research start-up project(No. 2024026005).
Author contributions
Junpeng Li: data curation, writing-original draft, funding acquisition. Hongbo Yao: methodology, review, supervision. Wencai Wang: review and editing, data analysis, language editing. Jingjing Yan: supervision.
Funding
The authors disclosed receipt of the following financial support for the research, authorship, and/or publication of this article: This work was supported by the National Natural Science Foundation of China (Nos. 52064043, 51464036, and 52464014), Central guidance for local scientific and technological development Foundation (No. 2024ZY0068), Fundamental Research Program of Shanxi Province (Nos. 202403021222358 and 202403021212128), Scientific and technological innovation projects of colleges and universities in Shanxi Province (No. 2024L436), Shanxi Institute of Technology high-level talent research start-up project (No. 2024026005). These supports are gratefully acknowledged. The authors are grateful to the reviewers for discerning comments on this article.
Declaration of conflicting interests
The authors declared no potential conflicts of interest with respect to the research, authorship, and/or publication of this article.
Data availability statement
The data that support the findings of this study are available from the corresponding author upon reasonable request.