
Abstract
Radiation-induced pulmonary fibrosis (RIPF) constitutes a significant complication in radiotherapy for various cancers, often severely limiting its efficacy. Recent studies suggest that epithelial-mesenchymal transition (EMT) plays a vital role in the pathogenesis of RIPF. Elucidating the involvement of microRNAs (miRNAs) in EMT could provide valuable insights into the mechanisms underlying RIPF and potentially reveal therapeutic targets. In this study, twelve dishes of BEAS-2B cells were irradiated with 6 Gy 60Co γ-rays, and RNA was extracted at 0, 6, and 48 h after irradiation. High-throughput sequencing analysis of miRNA samples revealed miRNA significant changes in the BEAS-2B cells after irradiation, which was verified by RT-PCR. Additionally, the upstream transcription factors (TFs) were predicted through graphene oxide-based analysis. Transcription factors regulate the expression and transcriptional levels of miRNAs, and their functions may be associated with inflammatory or oxidative stress responses. The functional roles of these TFs were characterized through gene ontology (GO) analysis. Overall, we successfully screened and identified a set of miRNAs associated with ionizing radiation-induced EMT in lung epithelial cells and performed predictive identification of their upstream TFs and downstream regulatory target proteins. These data provide a firm foundation for future studies of the mechanism of radiation-induced EMT processes and related changes in biological function.
Keywords
Introduction
Radiotherapy plays an important role in the treatment of lung, breast and esophageal cancers. 1 Regardless of the specific technique, including stereotactic radiotherapy and methods aimed at reducing radiation exposure to healthy tissue, over 35% of lung or breast cancer patients develop radiation pneumonitis. 2 Furthermore, radiation-induced pulmonary fibrosis (RIPF) can manifest months, or even years post treatment.3,4 The hallmark histological characteristic of RIPF is the excessive proliferation of fibroblasts coupled with the massive deposition of collagen and extracellular matrix. Currently, no effective curative treatment for RIPF, which often leads to a serious (often fatal) respiratory insufficiency resulting in a very poor patient prognosis. Consequently, preventionis therefore of critical importance, 5 making RIPF a focal point of clinical and basic radiological research. Elucidating the mechanisms underlying RIPF development will provide an important theoretical basis for preventative and therapeutic strategies.
Fibroblasts are the key effector cells of pulmonary fibrosis, and the excessive deposition of collagen produced by their secretion is the main cause of fibrosis.6,7 Studies have shown that in pulmonary fibrosis, over a quarter of the fibroblasts originate from circulating fibrocyte differentiation, a third are activated by hyperplasia, and the remaining third are derived from Epithelial-mesenchymal transition (EMT). 8
EMT is the process by which epithelial cells become mesenchymal cells, characterized by the loss of cell polarity and intercellular adhesion, followed by the acquisition of migration and invasion characteristics.9,10 During pulmonary fibrosis, epithelial cells are damaged, disrupting the integrity of the alveolar-capillary barrier basement membrane, hindering normal epithelial and endothelial regeneration. This failure in the normal tissue structure reconstruction process results in respiratory dysfunction and triggers a secondary repair mechanism involving the activation and proliferation of fibroblasts and myofibroblasts. This, in turn, leads to collagen deposition, extracellular matrix build-up, and the continuous proliferation of fibers. Therefore, the transformation of alveolar epithelial cells into mesenchymal cells represents an important part of the fibrosis physiological process. 11 MicroRNAs (miRNAs) are a class of small non-coding RNAs, typically around 22 nucleotides in length, which can regulate the expression of target genes. 12 They primarily induce post-transcriptional silencing of genes by binding to the 3'UTR region of mRNA. 13 Studies have shown the extensive roles of miRNAs; alterations in miRNA expression profiles are frequently observed in malignant tumors, suggesting a close relationship between these abnormally expressed miRNAs and tumorigenesis and development.14–16 For example, miRNA-127-3p can act on target proteins such as mitoNEET or KMT5a to inhibit cell migration and invasion, and thus become a new target for inhibiting tumor formation.17–19 MiR-451a can inhibit tumor growth in basal cell carcinoma, gastric cancer and lung cancer and has been used as an early biomarker for predicting non-small cell lung cancer.20–23 MiR-451a-5p can promote epithelial-mesenchymal transition and contribute to radiation-induced pulmonary fibrosis. 24 MiR-155–5p in alveolar epithelial cells induces EMT and mediates RIPF. 25 The expression of miR-18a-5p is closely related to the occurrence and development of pulmonary fibrosis, 26 and miR-21 has emerged as a therapeutic target for renal fibrosis.27–29 The LncRNA PTENP1/miR-21/PTEN axis plays a critical role in regulating epithelial-mesenchymal transition (EMT) and drug resistance in cancer. 30 Therefore, miRNAs play a significant role in RIPF. Transcription Factors (TFs) are endogenous proteins that regulate the transcription process of mRNA or miRNAs. TFs can be involved in a variety of biological processes in vivo. Recently, many TFs have been demonstrated to modulate EMT and cellular process.31,32 However, there is littled information available on radiation-induced changes in miRNA expression that, in turn, affect EMT and the development of pulmonary fibrosis. Therefore, this study aims to address this gap by irradiating BEAS-2B cells with 6 Gy 60Co γ to induce EMT formation, analyzing the miRNA expression profiles, and summarizing the changes and functional enrichment to further explore the role of miRNAs in radiation-induced EMT.
Methods and materials
Cell culture and cell irradiation
BEAS-2B (human bronchial epithelial cells) were obtained from the Institute of Radiation Medicine, Academy of Military Medical Sciences. RRID:CVCL 0168. The cells were cultured in LHC-8 medium and passaged to the third generation. The cells were cultured at 37 °C at 5% CO2 and saturated humidity, and cell morphology was observed with an inverted microscope. When the cells were in the logarithmic growth phase, the growth medium was replaced 30 min before irradiation, the dish was then sealed to prevent contamination and placed on the irradiation table. Irradiation with γ-rays from 60Co was carried out at a dose rate of 135 cGy/min, and an irradiation dose of 6 Gy. After irradiation, the cells were cultured for 0 h, 6 h, and 48 h, and cell morphology was observed under an inverted microscope.
RNA extraction and reverse transcription
RNA was extracted with Trizol and left to dry on a clean bench until the RNA became colorless. 15–20 μL of DEPC water was then added and it was incubated for 5 min at 37 °C. RNA concentration was measured with a spectrophotometer and the sample diluted to 500 ng/μL before being aliquoted. Samples were kept at −20 °C for short-term and −80 °C for long-term storage, and repeated freeze/thaw cycles were avoided. RNA was reverse transcribed into cDNA using the miRcute enhanced miRNA cDNA first strand synthesis kit (Tiangen Biotechnology; China; DP424) according to manufacturer's instructions.
Quantitative real-time PCR (Rt-PCR) validation
The cells were washed 3 times with PBS, and 1 mL of Trizol was added to fully lyse the cells to extract total RNA. cDNA was generated using the PrimeScriptTM RT Master Mix kit, and mRNA RT-PCR was performed using the SYBR Premix Ex TaqTM II kit using the cDNA as a template. About 1 μg of RNA was used to synthesize cDNA using the miRcute Plus miRNA First-Strand cDNA Synthesis Kit (Tiangen Biotechnology; China; KR211). Mature miRNA RT-qPCR was performed using a miRcute Plus miRNA qPCR kit (SYBR Green) (Tiangen Biotechnology; China; FP411) on a Bio-Rad real-time PCR system using a program of 95 °C for 15 min 1 cycle, 94 °C for 20 s, and 60 °C for 34 s for 40 cycles. After the reaction was completed and the data were saved, the miRNA expression level was analyzed using the 2−△△Ct method. U6 was used as an internal reference, and all the primer sequences used are shown in Table 3.
Protein extraction
Cell culture medium was aspirated and the cells washed twice with PBS, after which an appropriate amount of protein extraction buffer containing protease inhibitor and phosphatase inhibitor was added, the cells incubated for 30 min in ice bath, and then centrifuged for 10 min 4 °C, 12000 r/min. Protein solution was mixed with 5 × loading buffer at a ratio of 1: 4, and then incubated in boiling water for 10 min. After cooling, the protein solution was stored at −20 °C before use.
Western Blot detection of protein expression
About 40 μg of total protein was separated on a 10% sodium dodecyl sulfate-polyacrylamide gel (SDS-PAGE) and subsequently transferred to a PVDF membrane. The membrane was blocked with 5% skim milk for 1 h at room temperature and incubated overnight at 4 °C with primary antibodies to EMT-related proteins including anti-E-cadherin (RRID:AB 2881444), N-cadherin (RRID:AB 2813891), vimentin (RRID:AB 2273020), α-SMA (RRID:AB 2223009), GAPDH (RRID:AB 2107448) (diluted 1 : 1000). The strips were removed and washed 3 times for 10 min with TBST. The blot was then incubated with the secondary antibody for 1 h at room temperature. The strip was washed 3 times for 10 min each with TBST. Enhanced chemiluminescence reagents were used to develop the Western blots.
miRNA sequencing analysis
To study the difference between the miRNA expression profiles of irradiated and non-irradiated cells, high-throughput sequencing technology was used. About 12 samples were used in this project, and the clean reads of each sample distributed between 17.59 and 35.87 M with a genomic alignment rate of between 76.14 and 91.55%. The known miRNA alignment rate is between 5.18 and 17.21%, the total number of known miRNAs in all sample comparisons is 1519, and the total number of newly predicted miRNAs in all samples is 911. The three differential comparison groups used were: 48 h-vs-0 h, 48 h-vs-6 h, 6 h-vs-0 h, and the number of differential miRNAs detected were: 493, 406, 128, respectively. This sequencing was completed by Shanghai Ou Yi Biomedical Technology Co., Ltd using the fastx_toolkit (version 0.0.13) software, quality control was performed on the sequences with Q20, retaining sequences with Q20 reaching 80% and above. Subsequently, NGSQCToolkit (version 2.3.2) was used to filter out reads containing N bases.
MiRNA target mRNAs
Based on different miRNAs expression, miRanda (http://www.microRNA.org), miRDB (http://www.mirdb.org/) and TargetScan (http://www.targetscan.org/) databases were used to explore target mRNAs.
Gene ontology analysis
GO functional analysis is a method of functional annotation and categorization of whole gene/transcripts and differential miRNA target genes/transcripts. Briefly, the GO functional enrichment analysis method parameters were: the whole gene/transcript was used as a background list, the differential miRNA target gene/transcript list was selected from the background list and used as a candidate list, the hypergeometric distribution test was used to calculate the representative GO function set in the differential miRNA. To further explore functional annotation of the TFs genes, we performed GO functional analysis via the Metascape (https://metascape.org/). An adjusted P < 0.05 was considered significantly enriched, and BH method was used to adjust the P value.
Kyoto encyclopedia of genes and genomes pathways analysis
KEGG is the main public database of pathways and can be used for analysis of differential miRNA target genes (combined with KEGG annotation results). Using the hypergeometric distribution test, the significance of any differential miRNA target gene enrichment in each pathway entry can be calculated. The calculation result returns an enriched p-value, indicating whether the differential miRNA target gene is enriched in the pathway. For the corresponding calculation formula, see the GO Enrichment Analysis above. Path analysis can be used to inform the design of further experiments. Pathway analysis of differential miRNA target genes can be used to identify which differential miRNAs may be involved in which specific cell pathways. The KEGG pathway functional enrichment analysis method is similar to that used in the GO functional enrichment analysis. An adjusted P < 0.05 was considered significantly enriched, and BH method was used to adjust the P value.
Prediction of potential TFs
Based on the miRNAs, we predicted the upstream and downstream TFs via TransmiR v2.0, a useful tool integrating experimentally verified TF-miRNA regulatory relationships from the publications. The Cytoscape software was subsequently utilized to visualize TF-miRNA regulatory relationships.
Statistical analysis
The higher the miRNA abundance, the higher its expression level. In SmallRNA sequencing analysis, we can estimate miRNA expression levels by locating the mature sequence of the species and the newly predicted miRNA sequence counts. The p-value is calculated using the Audic_Claverie formula. MiRNAs with a p-value < 0.05 and a TPM difference multiple > 2 were screened.
Results
Screening and verifying for different miRNAs in radiation-induced EMT model
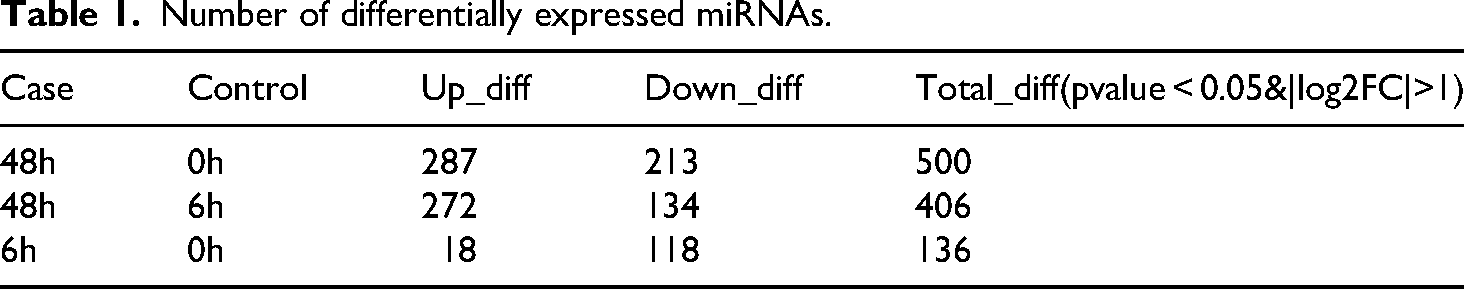
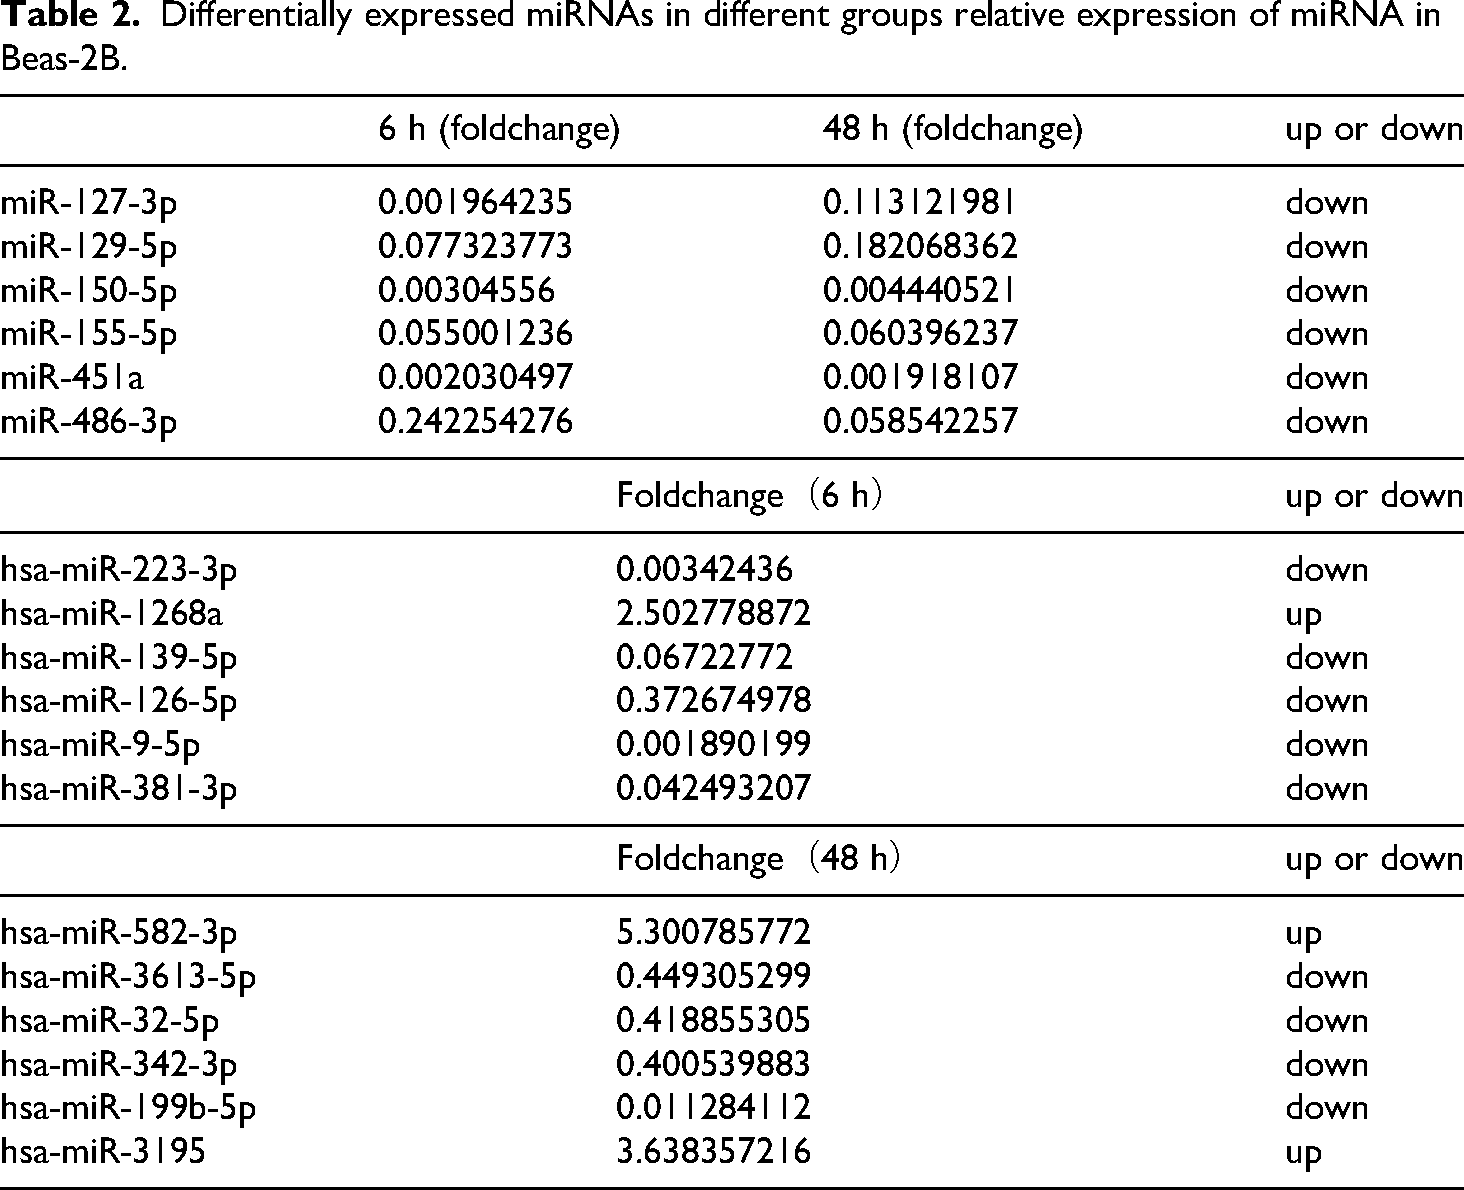
BEAS-2B cell morphology was observed at 0 h (sham ionizing radiation), 6 h, and 48 h after irradiation with 6 Gy 60Co γ (Figure 1A), alongside an assessment of corresponding changes in EMT marker proteins (Figure 1B). Post-irradiation, cells exhibited a morphological transition from a circular, epithelial-like shape to an elongated, spindle-like (mesenchymal) morphology. EMT formation after irradiation is accompanied by a decrease in the levels of known epithelial markers (E-cadherin) and an increase in mesenchymal markers (N-cadherin, Vimentin, α-SMA). These alterations in morphology and protein expression became more pronounced with increasing time post-irradiation, showing that irradiation can be used to establish an EMT formation model. To identify differentially expressed miRNAs in this irradiation-induced EMT model, we performed miRNA sequencing analysis on samples collected at 0 h, 6 h, and 48 h. (Figure 1C and 1D). These changes in miRNA expression suggest a potential role for miRNAs in regulating irradiation-induced EMT. Specifically, 118 miRNAs were downregulated at 6 h post-irradiation. Microarray analysis was used to determine miRNA expression profiles and four independent microarray analyses were repeated for each pair of comparisons. Differential expression analysis was performed using DESeq software, employing normalization and p-values calculations to compare the three groups. After filtering for fold change > 2 and p-value < 0.05, we identified 136 miRNAs and 500 differentially expressed miRNAs at 6 h and 48 h, respectively. The changed expression of miRNA suggests a potential role in irradiation-induced EMT. 118 miRNAs that changed after 6 h irradiation were down-regulated (Table 1). Further analysis revealed 87 miRNAs that were co-expressed at both 6 h and 48 h groups compared to non-irradiated BEAS-2B cells, with the expression of hsa-miR-127-3p, hsa-miR-129-5p, hsa-miR-150-5p, hsa-miR-155-5p, hsa-miR-451a, hsa-miR-486-5p significantly changed. There were 49 miRNAs which only showed different expression levels at 6 h, among which hsa-miR-223-3p, hsa-miR-1268a, hsa-miR-139-5p, hsa-miR-126-5p, hsa-miR-9-5p, hsa-miR-381-3p were significantly changed. 404 miRNAs were differentially expressed at 48 h only, of which hsa-miR-582-3p, hsa-miR-3613-5p, hsa-miR-32-5p, hsa-miR-342-3p, hsa-miR-199a-5p, hsa-miR-3195 are significantly different (Table 2). We synthesized primers for the miRNAs named above (Table 3) and used them to verify miRNA expression by RT-PCR in RNA extracted from cells at 6 h and 48 h groups (Figure 2A), 6 h-vs-0 h (Figure 2B), 48 h-vs-0 h (Figure 2C) after irradiation. The RT-PCR results for hsa-miR-127-3p, hsa-miR-129-5p, hsa-miR-150-5p hsa-miR-155-5p, hsa-miR-451a, hsa-miR-342-3p, hsa-miR-9-5p, hsa-miR-381-3p, hsa-miR-582-3p, hsa-miR-32-5p, hsa-miR-199a-5p were consistent with the sequencing data.

Morphological changes, and related protein and differential miRNA expression in BEAS-2B cells after irradiation. A. Cell morphology was observed from E- to M-phenotype at 0 h, 6 h and 48 h after irradiation. B. Changes in EMT-associated marker proteins after irradiation, E-cadherin decreased, and N-cadherin, Vimentin, α-SMA, and Twist increased. C. Differences between different groups (between samples) of miRNAs are shown in a histogram. The horizontal axis is the comparison group; the vertical axis the number of differential miRNAs in the comparison group, where Up is a significant difference in the up-regulation of the number of miRNAs, and Down is a significant difference in the down-regulation of the number of miRNAs. D. The differences generated by the comparison are reflected in the volcano map, gray is the non-differentiated miRNA, red is the up-regulated differential miRNA, and green is the significantly down-regulated difference miRNA. The X-axis is the display of log2 Fold Change, and the Y-axis is the display of -log10 P-value. This displays the overall distribution of differentially expressed miRNAs.

RT-PCR confirmation of differentially expressed miRNAs. A. RT-PCR confirmed that the miRNAs with obvious changes at 6 h and 48 h were consistent with the sequencing results. B. RT-PCR confirmed that the miRNAs with obvious changes at 6 h were consistent with the sequencing results. C. RT-PCR confirmed that the miRNAs with obvious changes at 48 h were consistent with the sequencing results. Note: The data represent the mean ± SEM (n = 3), compared with the same group of 0 h group *P < 0.05.
Number of differentially expressed miRNAs.
Differentially expressed miRNAs in different groups relative expression of miRNA in Beas-2B.
Differentially expressed miRNA primers in different groups.

Cluster analysis identification of differentially expressed miRNAs
Unsupervised hierarchical clustering of differentially expressed miRNAs revealed distinct expression patterns between irradiated and untreated cells (Figure 3). It was found that most miRNA expression was down-regulated in cells 6 h after irradiation (Figure 3A). Observing the cells after 48 h of irradiation (Figure 3B), it was found that the up-regulation of differentially expressed miRNAs is similar to the number of differentially expressed miRNAs, and the number is much, which is the same as our general logic. The clustering also demonstrated that samples of similar types grouped together, suggesting that miRNAs within the same cluster may share related biological functions. Consequently, these results provide a valuable resource for identifying functionally related, yet previously uncharacterized, miRNAs.

Hierarchical cluster analysis of BEAS-2B cells at different times after irradiation. A. Stratified cluster analysis of miRNAs with different differences between unirradiated cells and cells 6 h after irradiation. B. Stratified cluster analysis of miRNAs with different differences between unirradiated cells and cells 48 h after irradiation. C. miRNA hierarchical cluster analysis between cells 48 h and 6 h after irradiation.
miRNA target gene expression (mRNA) profile and function analysis
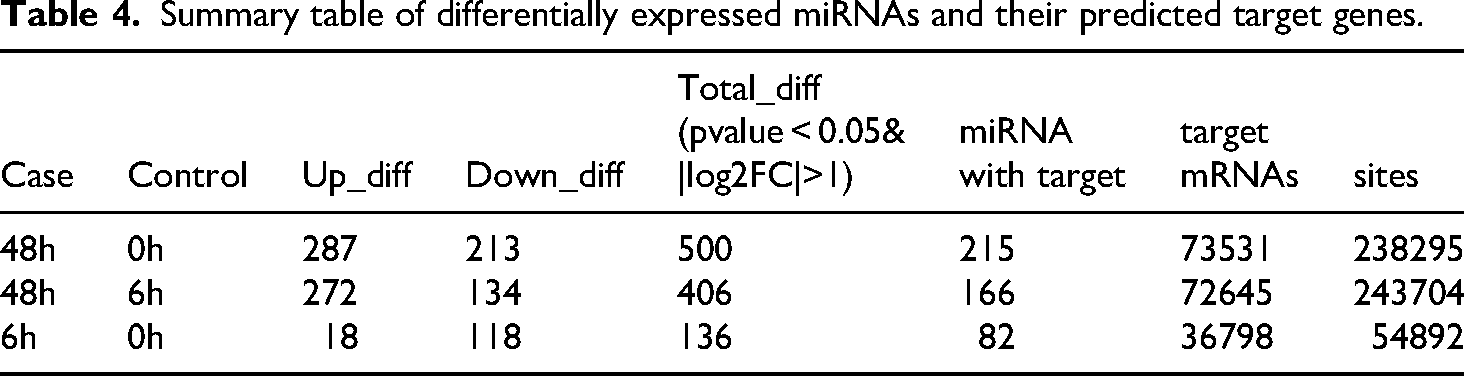
Using miRanda, miRDB, and TargetScan, we predicted potential target genes from the differentially expressed miRNA data. To identify the most robust targets, we focused on genes concurrently predicted by all three databases as downstream targets of differentially expressed miRNAs in the 6 h-vs-0 h, 48 h-vs-0 h and 48 h-vs-6 h comparisons. Among the predicted mRNAs, ZNF652, CCDC97, GTF2A1, MYB, DDR1 and ST3GAL2 were identified as representative targets (Figure 4A). We synthesized primers for those mRNAs and verified validated their expression levels by RT-PCR using RNA extracted from cells at 0 h, 6 h, 48 h after irradiation and our validation results were consistent with the sequencing results (Figure 5) (Table 4).

Go enrichment analysis of the target genes of differentially expressed miRNAs A. The intersection of target genes of differentially expressed significantly miRNAs at 48 h-vs-6 h, 6 h-vs-0 h, 48 h-vs-0 h. B. GO enrichment analysis. Bar graphs at 6 h-vs-0 h and 48 h-vs-0 h top10 (screening the top 10 GO entries in the three categories). The Fisher's algorithm was used to perform CC (cell component), BP (biological process), and MF (molecular function) enrichment analysis on the target genes predicted by differential expressed miRNAs in each comparison group, with the enriched term obtained using top GO. Draw a directed acyclic graph. C. 6 h-vs-0 h BP. D. 6 h-vs-0 h CC. E. 6 h-vs-0 h MF. F. 48 h-vs-0 h BP. G. 48 h-vs-0 h CC. H. 48 h-vs-0 h MF. I. Differences in miRNA target genes and all genes at the GO Level2 level distribution map. Blue indicates all gene-enriched GO Level2 entries, red indicates GO Level 2 entries for differential miRNA target gene enrichment, horizontal axis is the item name, and vertical axis indicates the number of genes and their percentages for the corresponding entries.

RT-PCR confirmation of differentially expressed predicted targeted genes. A-F. RT-PCR confirmed that the mRNA predicted by the website was consistent with the sequencing results.
Summary table of differentially expressed miRNAs and their predicted target genes.
To understand the function and role of these target genes in EMT formation, we studied the enrichment analysis of their molecular functions and pathways (Figure 4). GO functional analysis is analyzed from three aspects (Figure 4B): biological processes, cellular structures, and molecular functions. It can be seen that in the 6 h-vs-0 h and 48 h-vs-0 h groups, the target genes differentially expressing miRNAs in the top 10 hits are the same in the cellular component and molecular function aspects, and the top three are in the cytosol, nucleus, and cytoplasm, and involved in protein binding, metal ion binding, and ATP binding respectively. In the biological process entry, the top 3 GO items; transcription DNA-templated, regulation of transcription DNA-templated; and signal transduction, are the same in the 6 h and 48 h samples. These functions play a key role in the EMT process. The distribution of the differentially expressed miRNA target genes and all genes at the GO Level 2 level is shown in Figure 4I. The number of target genes that differentially express miRNAs in the GO functional enrichment assay and the percentage of total gene counts under the functional term can be visualized. Fisher's algorithm was used to perform CC (cell component), BP (biological process), and MF (molecular function) enrichment analysis of the target genes predicted by differentially expressed miRNAs in each comparison group, and top GO was used to draw a directed acyclic graph on the enriched term (Figure 4C-H). The top GO directed acyclic graph can visually display the GO node (Term) and its hierarchical relationship with target gene enrichment. This allows us to generate a graphical representation of the results of the target gene GO enrichment analysis, and with this the range of functional descriptions defined from top to bottom becomes more specific. For each of the three major GO categories (CC, BP, MF), the top 10 with the highest degree of enrichment are taken as the main node of the acyclic graph, represented by a rectangle. The associated GO Term is displayed together with the inclusion relationship, and the depth of the color indicates the degree of enrichment, with a darker color signifying higher enrichment. The highest degree of enrichment in each Figure is 6 h-vs-0 h BP (GO:0007275 multicellular organism development,GO:0048731 system development), CC (GO:0097458 neuron part), MF (GO:0008092 cytoskeletal protein binding,GO:0003779 actin binding), 48 h-vs-0 h BP and CC were same as 6 h-vs-0 h group, 48 h-vs-0 h MF (GO:0051015 actin filament binding,GO:0005515 protein binding,GO:0019899 enzyme binding). This all shows that these biological functions and structures have many common or similar results at different levels of GO functional enrichment, and these highly-enriched results may play a large role in radiation-induced EMT.
To complement the GO analysis, we investigated the functional enrichment of target genes in signaling pathways using KEGG enrichment analysis (Figure 6). The pathways with the largest number of target genes enriched in 6 h-vs-0 h are hsa-04010:MAPK signaling pathway and hsa-05205: proteoglycans in cancer. The pathways with the highest number of target genes enriched in 48 h-vs-0 h are: hsa-04010: MAPK signaling pathway, and the hsa-05200: pathway in cancer. The results of the two groups have a great deal of similarity, and we can see that many of these pathways are involved in cancer development (Figure 6A). There are also many classical EMT-related pathways that have been reported, including MAPK and Wnt signaling pathways. These results suggest that many target genes of radiation-induced differentially expressed miRNAs participate in the development of EMT.

KEGG enrichment analysis of the target genes of differentially expressed miRNAs. A. KEGG enrichment analysis top20 (sorted by -log10Pvalue for each entry) bubble map. Each dot corresponds to a path. The color is red, orange, yellow, green, blue, and purple. The p-value is sorted from small to large. The smaller the p-value, the more the color tends to red. The larger the dot, the greater the number of genes in this pathway. B. Comparison of miRNA target genes and all genes KEGG Level2 horizontal distribution. The horizontal axis is the difference between the miRNA target gene and the total number and ratio (%) of all genes annotated in the KEGG pathway, the vertical axis represents the name of the Level 2 pathway, and the number on the right side of the column represents the number of genes annotated to the Level 2 pathway.
TFs of differentially expressed miRNAs and its functional annotation enrichment analyses
Upregulated miRNAs at 48 h compared to 0 h were associated with TFs including HAND2, ELF3, SMARCC1, and ZNF263 (Figure 7A). Downregulated miRNAs at 6 h compared to 0 h were associated with TFs including IKZF1, LYL1, LMO3, ATOH8, IL1B, NOTCH3, TLR4, NR4A1, TLR2, KLF2, LMO2, TEAD4, TNF, NCOR1 and REST (Figure 7B). Downregulated miRNAs at 48 h compared to 0 h were associated with TFs including PBX1, BHLHE40, STAT6, TTF1, USF1, RUNX1T1, WIZ, ZNF644, NFATC3, CEBPA, TFAP2C, NOTCH1, TFAP2A, SMAD1, MED1, CHD8, TAL1, NFIC, ELF1, PBX3, FLI1, MAZ, CEBPB and ZNF384 (Figure 7C). Finally, downregulated miRNAs at 48 h compared to 6 h were associated with TFs including AGO2, ETS2, FOSB, NR3B3, SHP, AKT1, KLF2, LIN28A, FOXP3, EIF2C2, ZNF274, AP-1 and SNAI1 (Figure 7D). Detailed information of the TFs predicted for the 48 h-vs-0 h upregulated or 6 h-vs-0 h, 48 h-vs-0 h, 48 h-vs-6 h downregulated DE-miRNAs is provided in Table 5A-D.
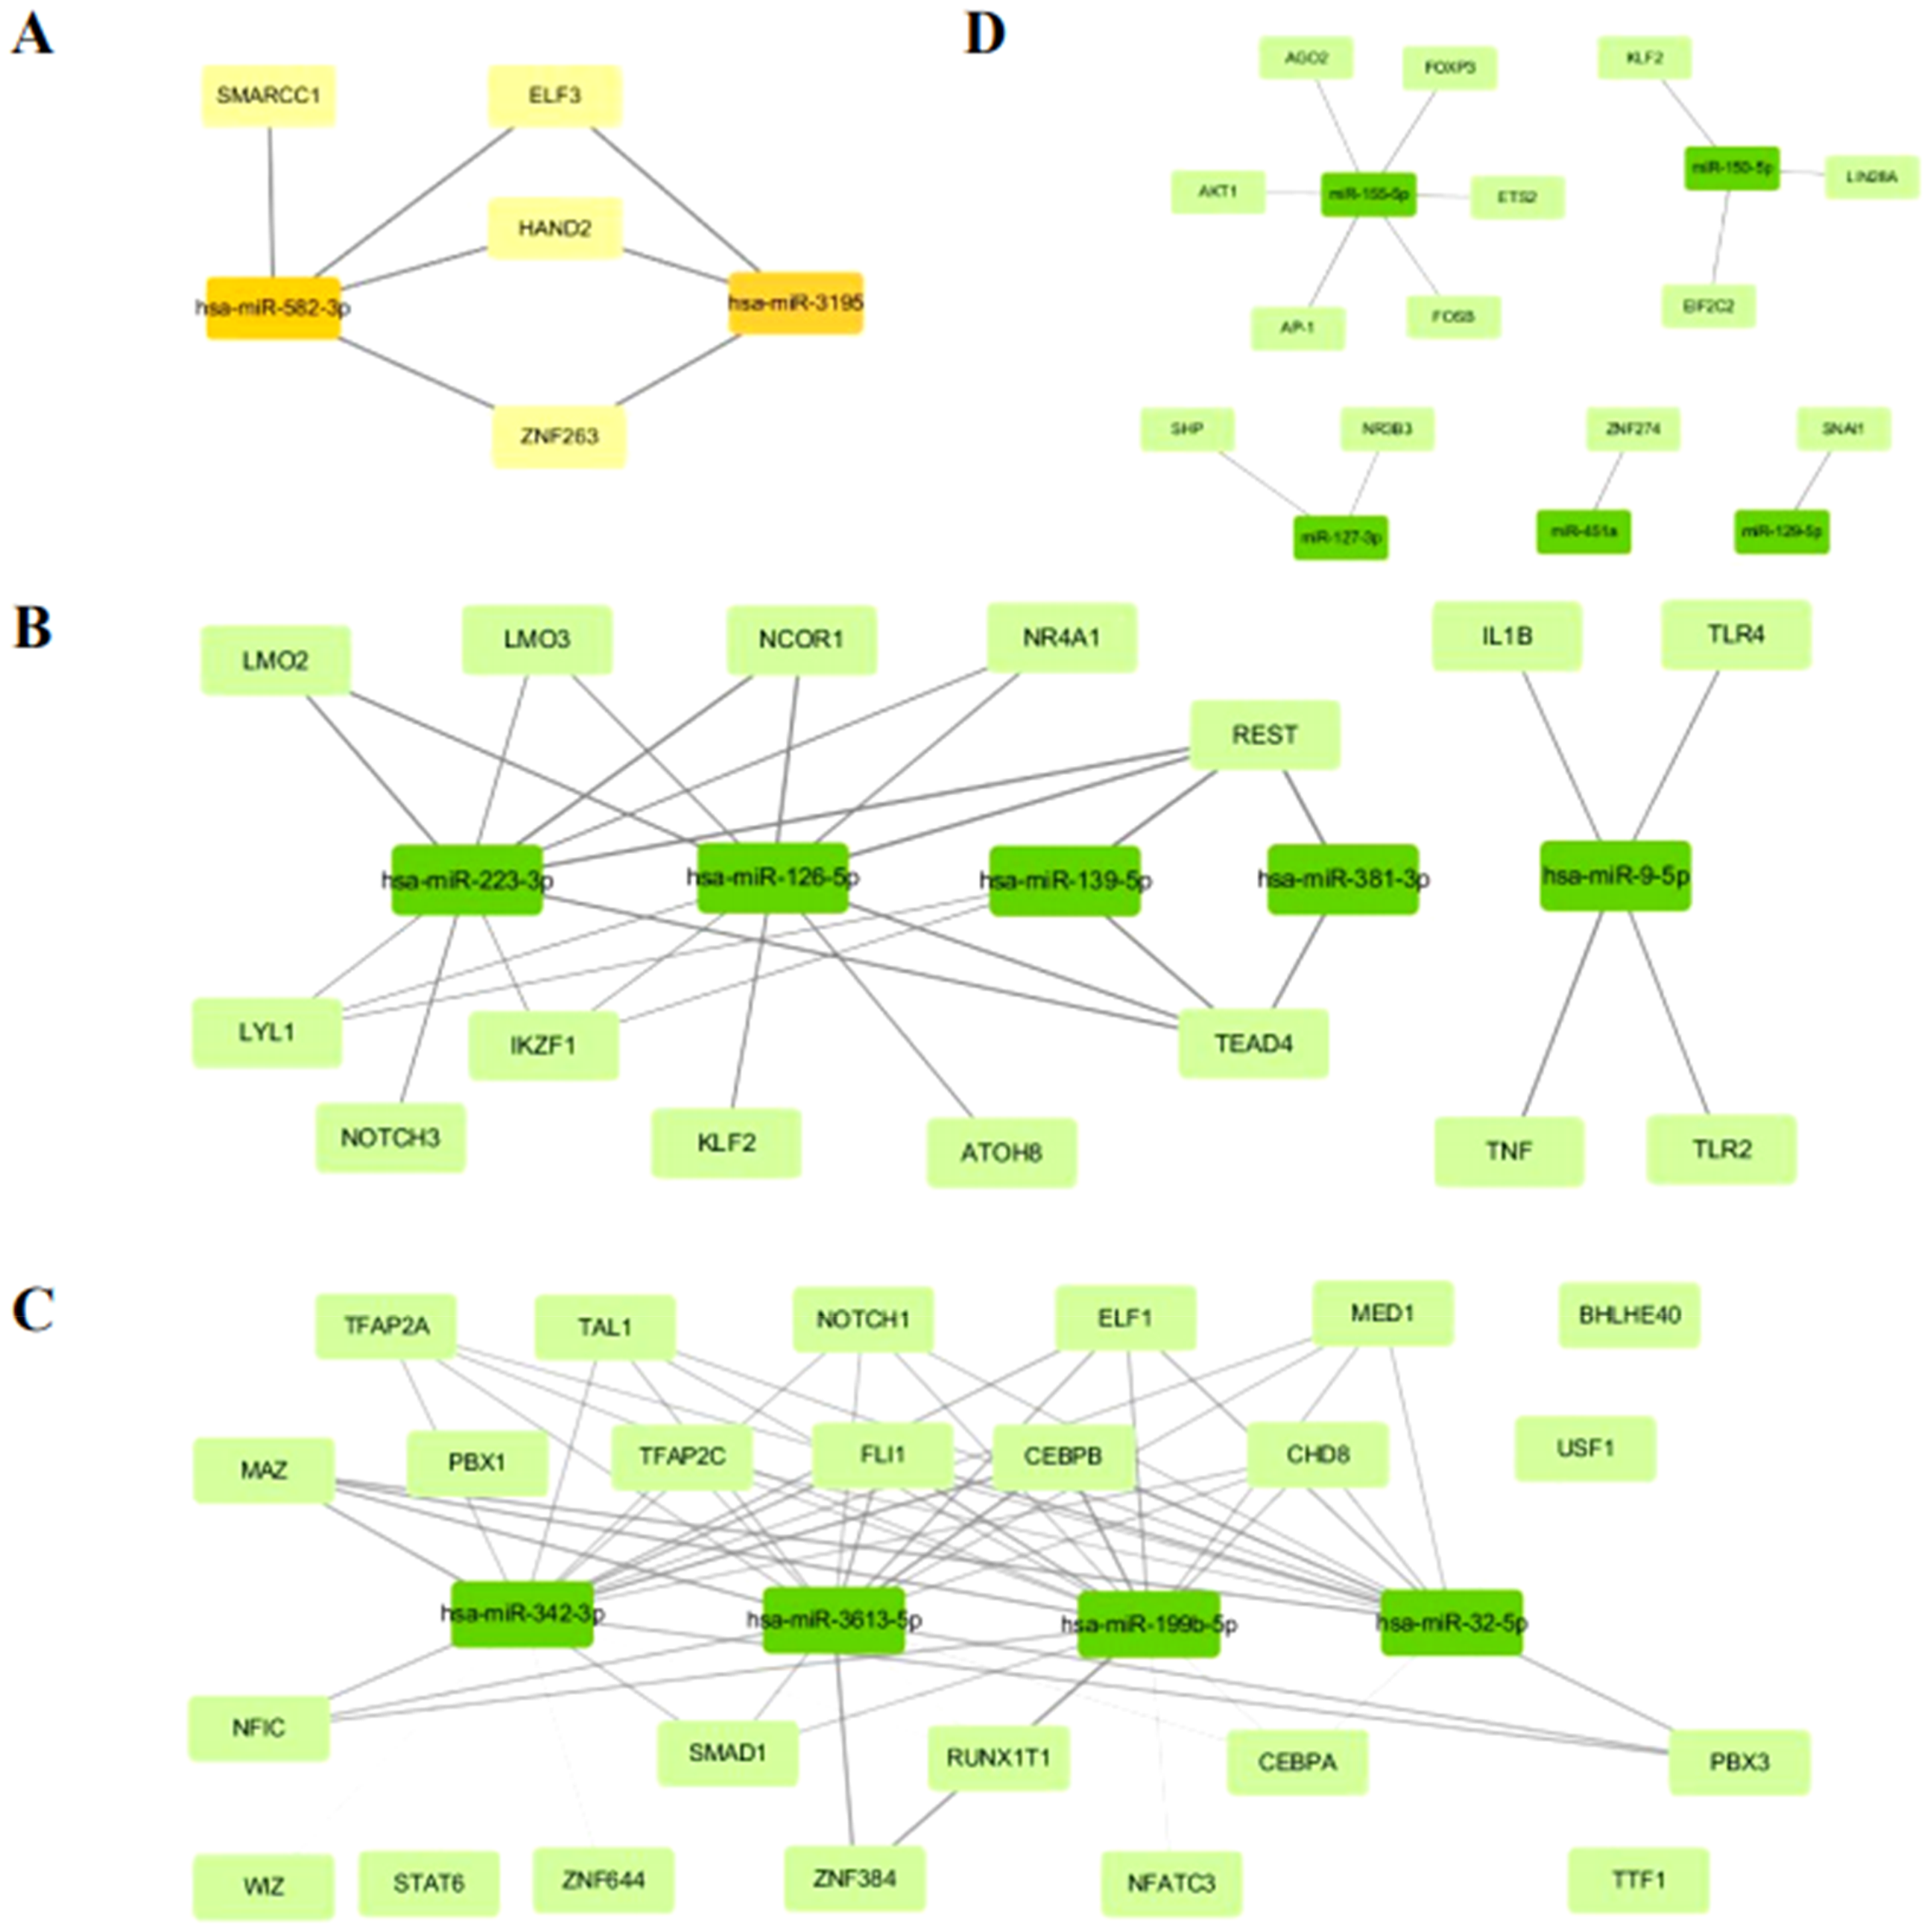
Putative TFs for upregulated and downregulated miRNAs. A. Putative TFs for upregulated 48 h-vs-0 h miRNAs. B. Putative TFs for downregulated 6 h-vs-0 h miRNAs. C. Putative TFs for downregulated 48 h-vs-0 h miRNAs. D. Putative TFs for downregulated 48 h-vs-6 h co-expressed miRNAs. The depth of lines color with p-value. TFs, transcription factors.
The TFs predicted for the DE-miRNAs.

DE-miRNAs, differentially expressed miRNAs; TF, transcription factor.
To further explore the functions of these predicted TFs, we conducted GO enrichment analysis (Figure 8). Biological process analysis indicated that enriched GO terms for 48 h upregulated target genes included the response to gland development (Figure 8A). GO terms for 6 h downregulated showed that TFs target genes were enriched in nitric oxide metabolic process, cellular response to lipid, leukocyte differentiation, cellular response to hormone stimulus, myeloid cell differentiation, pri-miRNA transcription by RNA polymerase II and cellular response to oxidative stress (Figure 8B). In the process of GO terms analysis, the 48 h-vs-0 h downregulated TFs genes were markedly enriched in DNA-binding transcription activator activity, RNA polymerase II-specific, transcription factor binding, chromatin binding, embryonic organ development, megakaryocyte development, ossification, DNA-binding transcription repressor activity, spinal cord development, DNA replication and negative regulation of response to external stimulus (Figure 8C). GO terms for 48 h-vs-6 h downregulated showed that TFs target genes were enriched in response to alcohol, homeostasis of number of cells, negative regulation of cell differentiation, and identified Kit receptor signaling pathway and IL-18 signaling pathway as significantly enriched pathways (Figure 8D). Collectively, these results suggest that predicted target TFs and their associated functions may play a role in promoting EMT.

Gene ontology terms enrichment analyses of the upregulated and downregulated TFs target genes. Metascape bar graph for viewing top non-redundant enrichment clusters, one per cluster, color by p-value (A-D). Metascape enrichment network visualization showing the intra-cluster and inter-cluster similarities of enriched terms, color by cluster ID (E-H). A and E. The enriched GO terms based on 48 h-vs-0 h upregulated TFs target genes. B and F. The enriched GO terms based on 6 h-vs-0 h downregulated TFs target genes. C and G. The enriched GO terms based on 48 h-vs-0 h downregulated TFs target genes. D and H. The enriched GO terms based on 48 h-vs-6 h downregulated TFs target genes. GO, Gene Ontology.
Discussion
The mechanism of pulmonary fibrosis is characterized by epithelial cell damage, repair of damage leading to cytokine release, extracellular matrix deposition, abnormal stromal cell activation, and cell proliferation, and the hallmark feature is the accumulation and proliferation of a large number of mesenchymal cells.33,34 The simultaneous expression of epithelial markers and α-SMA observed in lung sections from pulmonary fibrosis patients suggests the presence of cells undergoing phenotypic transformation in affected regions. Further studies have shown that more than 30% of the fibroblasts in the mouse pulmonary fibrosis model are derived from the EMT process,8,35 indicating that EMT may be the primary pathway for pulmonary fibrosis. Pulmonary fibrosis is a common and serious complication that can occur in patients undergoing chest radiotherapy or exposed to nuclear accidents. 36 Understanding the mechanism underlying radiation-induced EMT in lung epithelial cell has become a key research topic for preventing pulmonary fibrosis.
Numerous studies have highlighted the regulatory roles of miRNAs in EMT. For example, miR-34a induces p53 activation by targeting TP53 and MDM4 and regulates the development of EMT through the Wnt, Notch, and other signaling pathways 37 and miR-214 inhibition promotes EMT in gastric cancer by targeting FGF9. 38 However, comprehensive analyses of global miRNA expression profile changes during EMT induction remain limited. Our study addresses this gap by providing an initial characterization of miRNA profiles alterations after radiation-induced EMT. We have used bioinformatics and cytology experiments to analyze the possible role of differentially expressed miRNAs in the formation of EMT in BEAS-2B cells. These results will contribute to the future exploration of the upstream and downstream roles of miRNAs for EMT and its underlying mechanisms.
We compared miRNA expression profiles at 6 h and 48 h after radiation to those at 0 h, and summarized 18 miRNAs with large difference folds for analysis. These time points were selected based on our previous research demonstrating that 6 h and 48 h represent key stages in radiation-induced EMT development in alveolar epithelial cells in vitro.25,39 miR-129-5p can promote both EMT and colon cancer progression through the regulation of LncRNA HIF1A-AS2 in downstream DNMT3A. 40 Down-regulation miR-129-5p in breast cancer cells promotes EMT. 41 miR-486-5p can inhibit EMT by acting on Smad2 and snail via the classical TGF-β signaling pathway.42,43 This is consistent with the conclusion that miRNAs decline after irradiation. However, for miRNA-155-5p, we get a contradictory conclusion. Our sequencing results show that miR-155-5p inhibits EMT and tumor formation, but other studies have reported that it promotes tumor formation, especially in hepatocellular carcinoma.44,45 The difference in conclusions may be due to the fact that the tissue microenvironment and cellular functions of the same miRNA in different organs and cells are very different, even contradictory, and may also be different with different stages of cancer development. This regulatory process can be complicated and necessitates further study. While miR-127-3p, miR-150-5p, and miR-451a are rarely reported to be directly related to EMT or RIPF, our sequencing and validation results show significant differences in post-irradiation changes. These miRNAs may play an essential role in the process of EMT and pulmonary fibrosis, and the mechanism of action will be further explored in the future. Moreover, numerous other differentially expressed miRNAs beyond these 6 offer novel insights and directions for future research on miRNA and EMT. We predicted the target genes of differentially expressed miRNAs, aiming to elucidate their mechanisms and validate their relationship with the identified miRNAs. From a functional perspective, we analyzed the relationship between differentially expressed miRNA and EMT. Upregulated miR-155 silencing of ZNF652 promotes invasion and metastasis of breast cancer cells. 46 MYB affects the complexity of cancer progression by regulating tumor-associated miRNAs and miRNA also plays an instrumental role in regulating MYB expression. 47 We found that in the GO function analysis, the most obvious enrichment effect was seen in the neuron projection, cell-cell signaling and connection function of calcium and protein. The function of these target genes may be relevant to EMT and other tumor growth. We found that after irradiation, differential miRNA function was most obviously seen in the nervous system. Radiation has a great impact on nervous system function and there have been some reports confirming the influence of the nervous system on tumors and on its relationship with EMT.48,49 On the other hand, the function is mainly focused on transcription regulation and signal transduction (transcription, DNA-templated; regulation of transcription, DNA-templated; signal transduction transcription, DNA templated; transcriptional regulation, DNA templated; signal transduction), an area which has also become a hot research topic in recent years.
KEGG enrichment analysis of the miRNA target genes revealed that the MAPK signaling pathway and tumor-related pathways exhibited the highest number of enriched target genes. The detection of the classical MAPK signaling pathway is consistent with our research and shows that this pathway plays an important role in the EMT process.50,51 Pathways such as proteoglycans in cancer are not classical EMT pathways, but molecules either on or acting on, this pathway are also likely to be important EMT regulators.
Several studies have provided compelling evidence that alterations in TFs cause abnormal pri-miRNA transcription. Among the TFs predicted for DE-miRNAs in our study, HAND2 was reported to regulate cell proliferation, migration and invasion of Bladder Cancer. 52 Hand2 regulates miR-1 upregulation to inhibit apoptosis and promote proliferation of cardiomyocytes involved in congenital heart disease. 53 In addition, downregulation of IKZF1 leads to proliferation and differentiation of hematopoietic progenitor cells. 54 IKZF1 microdeletions may correlate with the level of miRNA in pediatric acute lymphoblastic leukemia. 55 PBX1, another predicted TF in this study, was contributed to reducing the cell invasion, proliferation and migration, and inhibiting the JAK2/STAT3 pathway in Oral squamous cell carcinoma. 56 PBX1 regulates miRNA-650 to promote the development of Helicobacter pylori-associated gastric carcinoma. 57 Furthermore, ETS2 was found to promote EMT in renal fibrosis by targeting JUNB. 58 Future studies are needed to validate the molecular mechanisms of ELF3, SMARCC1, ZNF263, and other TFs in the pathogenesis of pulmonary fibrosis.
This study provides an initial investigation of radiation-induced miRNA profile changes in BEAS-2B cells undergoing EMT using high-throughput sequencing. We identified miRNAs that were differentially expressed before and after irradiation and validated those exhibiting large fold changes, with the aim of identifying miRNAs that may influence EMT during irradiation. We should clarify that it may not only be miRNA profile changes that can induce and inhibit EMT, but also other molecules such as mRNA and lncRNA, something which deserves further investigation and will be a topic of future research. Targeting or activating specific transcription factors responsible for the abundance of miRNAs may be promising and innovative approaches to RIPF treatment. 59 Understanding the interaction between them will have a great impact on the field, and some scholars have recently begun research in this area.60,61
Conclusion
This study identified the differentially expressed miRNAs in BEAS-2B cells after irradiation. Functional enrichment of the target genes and TFs associated with these differentially expressed miRNA revealed their potential presence in critical pathways, opening new avenues for our future research into biological functions of irradiation, especially those affecting lung fibers. Subsequently, the modulation of miRNA expression through the knockdown or overexpression of upstream transcription factors (TFs) can influence downstream processes. Similarly, the expression levels of downstream target proteins can be altered by the knockdown or overexpression of miRNAs, thereby inhibiting EMT and exerting a protective effect against radiation-induced pulmonary fibrosis. This finding offers a novel research focus for the clinical investigation of therapeutic strategies targeting radiation-induced pulmonary fibrosis. Overall, these results contribute to a more comprehensively understanding of the mechanism of RIPF and provide potential therapeutic and preventive targets for the treatment of RIPF.
Supplemental Material
sj-docx-1-sci-10.1177_00368504251362376 - Supplemental material for Comprehensive high-throughput sequencing analysis and verification of miRNAs isolated from bronchial epithelial cells undergoing radiation-induced epithelial-mesenchymal transition
Supplemental material, sj-docx-1-sci-10.1177_00368504251362376 for Comprehensive high-throughput sequencing analysis and verification of miRNAs isolated from bronchial epithelial cells undergoing radiation-induced epithelial-mesenchymal transition by Yifan Hou, Shenghui Zhou, Ping Wang, Duo Wang, Yuhao Liu, Xingkun Ao, Xinxin Liang, Jiaojiao Zhu, Ziyan Yan, Xiaochang Liu, Lin Zhou, Huixi Chen, Yan Zeng and Yongqing Gu in Science Progress
Footnotes
Abbreviations
Acknowledgments
We are grateful to Xin Huang, Shanshan Gao, Chenjun Bai and Dafei Xie for their laboratory assistance.
Authors’ contributions
Yifan Hou, Shenghui Zhou: conducted cell experiments; analyzed the data; drafted the manuscript; Yuhao Liu, Jiaojiao Zhu: analyzed the data and interpreted the data; Xinxin Liang, Ziyan Yan, Xiaochang Liu, Xingkun Ao, Lin Zhou, Huixi Chen: conducted cell experiments; Yan Zeng: conceived the study; revised and edited the manuscript; Yongqing Gu: conceived and designed the study; revised the manuscript; project administration; supervision. All authors read and approved the final manuscript.
Funding
This research was funded by grants from the National Natural Science Foundation of China (82073488, 82273568, 32171238, 82230108, 81773359, 31470827 and 31270894).
Declaration of conflicting interests
The authors declare that they have no competing interests.
Availability of data and materials
Supplemental material
Supplemental material for this article is available online.
References
Supplementary Material
Please find the following supplemental material available below.
For Open Access articles published under a Creative Commons License, all supplemental material carries the same license as the article it is associated with.
For non-Open Access articles published, all supplemental material carries a non-exclusive license, and permission requests for re-use of supplemental material or any part of supplemental material shall be sent directly to the copyright owner as specified in the copyright notice associated with the article.