
Abstract
Objective
DNA methylation is a key regulator of gene expression and plays a crucial role in cancer development. However, the mechanisms driving gene-specific methylation remain unclear. This study investigates the role of microRNAs (miRNAs) in regulating promoter methylation of specific genes, aiming to uncover miRNA-driven modulation of gene methylation in cancer.
Methods
We analyzed data from the Cancer Cell Line Encyclopedia (CCLE) database, comprising 813 cell lines. Spearman's rank correlation was performed between the expression levels of 734 miRNAs and the methylation levels of 20,587 genes, focusing on CpG islands in promoter regions. Linear regression analysis was used to validate the relationship between selected miRNAs and gene clusters. Bioinformatics screening identified statistically significant miRNA-gene pairs involved in promoter methylation.
Results
The analysis revealed 25 target genes whose promoter methylation was significantly associated with the expression of four miRNAs (hsa-miR-200a, hsa-miR-200b, hsa-miR-200c, and hsa-miR-141). These correlations were most pronounced in colorectal, gastric, lung, and ovarian cancers. Notably, cancer-related genes such as ST14, OVOL1, and EPCAM were identified as targets, supporting the hypothesis that miRNAs regulate promoter methylation in these genes.
Conclusion
Our findings suggest that specific miRNAs induce promoter methylation in cancer-related genes, thereby influencing gene expression. This study expands our understanding of the role of miRNAs in tumor development and highlights the potential of miRNA-based therapies in cancer treatment. As this is a computational study, further experimental validation is required to confirm the proposed regulatory mechanisms.
Introduction
DNA methylation, orchestrated by the DNA methyltransferase (DNMT), is a pivotal epigenetic mechanism that finely regulates gene expression. It predominantly occurs at CpG sites within genomic regions known as CpG islands, which are densely packed with CpG dinucleotides and commonly located at the 5’ end of gene regulatory regions. Preserving appropriate DNA methylation is crucial since CpG island hypermethylation can effectively silence genes, while hypomethylation may lead to genomic instability and result in aberrant gene expression. Consequently, DNA methylation exhibits tissue-specific patterns that are carefully maintained and transmitted to the next generation of cells. 1
Aberrant DNA methylation patterns have been reported to be closely associated with various diseases, particularly cancer. Tumor cells often exhibit a 5% to 10% reduction in overall 5-methylcytosine levels compared to normal cells, while localized hypermethylation in many CpG islands.2,3 For instance, promoter hypermethylation of RB (retinoblastoma), a gene that regulates the cell cycle, occurs in about 10% of sporadic unilateral retinoblastomas, leading to reduced expression of the RB protein.4,5 Similarly, in sporadic colon tumors, promoter methylation of MLH1, a DNA mismatch repair-related gene, leads to reduced MLH1 expression, and treatment with the demethylating agent 5-aza-2'-deoxycytidine was found to decrease MLH1 suppression.6,7 Thus, hypermethylation of tumor suppressor genes in cancer cells can lead to their reduced expression, promoting cancer.
Despite numerous reports of abnormal gene expression regulation through DNA methylation of specific genes in cancer, 8 a definitive explanation for the mechanism behind gene-specific DNA methylation remains elusive. DNA methylation is highly critical for gene expression regulation; hence, precise control of methylation patterns in numerous genes is essential. To achieve gene-specific DNA methylation regulation, an accurate regulatory mechanism must exist that can precisely target DNMT activity for each gene. Such a regulator should be capable of recognizing the nucleotide sequence of the target gene and have the versatility to match various genes. Additionally, it should be a substance that has been reported to show differential expression patterns in tumors. From this perspective, we have considered the possibility of microRNAs (miRNAs), which have already been reported in the thousands and are known to bind to the 3’-untranslated regions of multiple target messenger RNAs (mRNAs), thereby inhibiting protein translation of the target genes,9,10 as potential guider for DNMT regulation.
miRNAs are small noncoding RNAs composed of 21–25 nucleotides that function primarily as post-transcriptional regulators in eukaryotic gene expression.11–13 Unlike mRNA, which acts as an intermediary in protein expression, the function of miRNAs is based on their ability to recognize and bind to their own nucleotide sequence. In addition to its post-transcriptional regulation function, small RNAs have been shown to mediate DNA methylation in plants through a phenomenon known as the RNA-directed DNA methylation (RdDM) pathway. 14 The RdDM pathway has been observed in some yeasts, 15 and several studies reporting RdDM-like mechanisms have been reported in human cells.16–18 Additionally, processes similar to RdDM have been reported in human cells, but they mostly involve self-feedback mechanisms, such as methylation of siRNA-derived repetitive sequences or de novo methylation of CpG islands by promoter antisense-derived small RNAs. 19 However, the molecular mechanism by which endogenous miRNAs in human tumor cells recognize specific target genes outside of miRNA-derived DNA sequences and induce methylation has not been elucidated.
In this study, we aimed to explore the relationship between the expression levels of 734 miRNAs and the methylation status of 20,587 genes across 813 cell lines obtained from public databases through rigorous statistical analysis. By doing so, we seek to ascertain the potential of specific miRNAs in selectively regulating the methylation of CpG islands in target genes.
Materials and methods
Dataset
This study was conducted based on the data collected from the Cancer Cell Line Encyclopedia (CCLE) via the DepMap portal (https:// depmap.org/portal/), which provides large-scale genomic data from cancer cell lines. We obtained expression data for 734 miRNAs and methylation data for 54,531 promoter CpG clusters (corresponding to 20,587 genes). To perform linear regression analysis on the target genes selected through Spearman's rank correlation analysis of miRNA expression and gene cluster methylation, mRNA expression data were also obtained from CCLE. All three datasets were retrieved from the 22Q2 release. The analysis was conducted on a common set of 813 cell lines that were identified in all three datasets.
Statistical analysis
Spearman's rank correlation analysis between the miRNA expression and specific gene cluster methylation levels of each gene was performed for all cases, obtaining correlation coefficients, p-values, and the false discovery rate (FDR) for each pair. A correlation with an FDR value below 0.05 was considered significant. Thresholds of r ≥ 0.30 and r ≤ −0.40 were used to define moderate positive and negative correlations, respectively. These values reflect moderate or stronger correlations and align with common practice in genomic studies. We also confirmed the informativeness of these thresholds by evaluating the empirical distribution of correlation values in our dataset. For the regression analysis of the final selected target pairs, we sequentially performed simple linear regression and multiple linear regression for the continuous dependent variable. One way analysis of variance (ANOVA) was conducted to compare differences among continuous variables. Post hoc tests were performed to verify differences between all groups. A p-value less than 0.05 was considered statistically significant in all statistical analyses. All statistical analyses and visualizations were conducted using software version 4.0.3. All subsequent correlation, regression, and clustering analyses were consistently performed using this common set of 813 cell lines to ensure methodological coherence and comparability.
Filtering of promoter CpG island clusters
We performed a selection process to identify gene clusters with potential promoter CpG islands, excluding noncoding RNA (RefSeq id: NM) gene clusters. Our selection criteria were based on a self-generated standard, taking into account the form and characteristics of the methylation data. Specifically, we defined CpG island clusters as those with a minimum of 20 CpG sites within a cluster and a ratio of CpG sites within the entire cluster of 10% or more. Ultimately, we identified 5070 gene promoter CpG island clusters through this process.
Cancer type grouping
A total of 26 cancer types were identified in a set of 813 cell lines that shared common miRNA expression data sets, gene methylation datasets, and mRNA expression datasets. We performed clustering of the entire miRNA expression values using the non-negative matrix factorization (NMF) consensus tool in Gene Pattern (https://www.genepattern.org/). This analysis was conducted under conditions ranging from k = 1 to k = 12. NMF was selected for its robustness in detecting latent structures in high-dimensional data. Among the available data types (miRNA expression, gene expression, and promoter methylation), miRNA profiles exhibited the highest variance across cancer types in preliminary analyses, supporting their use for clustering. Stratification by miRNA-based NMF groups allowed subsequent subgroup-specific analyses of methylation relationships. This approach aligns with our study's central goal: to elucidate how dysregulated DNA methylation in cancer may be guided by upstream miRNA expression. The miRNA expression patterns of the cell lines were clustered based on their similarity, and the k-value was set at the point where the cophenetic coefficient showed a sharp drop and clear clustering. We employed classification into a single group for cancer types only when they demonstrated similar miRNA expression patterns in two or more instances.
Gene ontology analysis
To investigate the interactions and biological characteristics of the selected genes, gene ontology analysis was performed using the Enrichr (https://maayanlab.cloud/Enrichr/) database. Adjusted p-values of 0.05 or higher were considered statistically significant in the biological process (BP), molecular function (MF), and cellular component (CC) categories for the 25 selected genes.
Sequence homology
To verify the sequence homology between the selected miRNAs and gene clusters, we utilized BLASTn (version: 2.2.31+) from the Basic Local Alignment Search Tool. Since miRNAs are relatively short, approximately 22 bp, and we specifically focused on assessing homology within the promoter CpG island of specific genes, we employed the blastn-short program, which is suitable for identifying sequence homology for sequences with fewer than 30 bp. The nucleotide sequence of the target gene cluster was defined as the region between the first CpG site and the last CpG site. To convert these sequences into a database, the Makblastdb package was employed. Subsequently, the homology between the database and query sequence was checked by setting the miRNA as the query sequence. In the known mechanism of miRNA targeting in the mRNA 3’-UTR, the seed sequence of 2 to 8 bp plays a crucial role. However, our study identified a different mechanism for the targeting of miRNAs. Therefore, we considered the entire mature miRNA sequence rather than limiting it to the seed sequence. We set the word size option, which represents the minimum matching length, to 7 bp.
Statistical software and computational environment
All statistical analyses were performed using R software (version 4.2.2; R Foundation for Statistical Computing, Vienna, Austria). Spearman's rank correlation was applied to identify associations between miRNA expression and CpG methylation levels using the cor() function in R. Simple and multiple linear regression models were conducted using the lm() function. The p-values were adjusted using the Benjamini–Hochberg method via the p.adjust() function to control for false discovery rate. Clustering analysis was carried out using NMF implemented in the NMF R package (version 0.23.0). Sequence similarity between miRNAs and promoter regions was assessed using BLASTn-short from BLAST + version 2.12.0, developed by NCBI. All data were retrieved from the CCLE through the DepMap portal (https://depmap.org/portal/). For statistical thresholds, an FDR value < 0.05 was considered significant for correlation and regression analyses. miRNA expression data were log2-transformed for variance stabilization. In all tests, a p-value < 0.05 was used as the significance threshold unless otherwise specified.
Results
Identification of miRNA–gene promoter CpG methylation pairs with confirmed correlations
To identify target pairs exhibiting a strong correlation between miRNA expression and gene promoter region methylation, and to investigate whether these target pairs have interdependent relationships that also influence mRNA expression, Spearman's rank correlation analysis followed by sequential regression analyses were performed (Figure 1). Based on Spearman's rank correlation analysis between miRNA expression and gene promoter region methylation, 316,671 miRNA–gene cluster pairs exhibited significant correlations (FDR < 0.05). Among them, 50,813 pairs were predicted to correspond to gene clusters within a promoter CpG island (CGI). There were 929 pairs with a positive correlation (r ≥ + 0.3, Figure 2(a)) and 777 pairs with a negative correlation (r ≤ −0.4, Figure 2(b)). Next, we implemented an alternative correlation coefficient threshold to address the imbalance between positive and negative correlation pairs in the overall correlation analysis results. This adjustment was necessary due to a considerable surplus of negative correlation pairs compared to positive ones. We next performed an additional selection step to prioritize more significant target pairs from the correlation results. We stratified the positive and negative correlation pairs into four intervals each, using log2-transformed miRNA expression and correlation FDR values. From these, we selected pairs with high mean expression and low FDR across cell lines (Figure 2(a) and (b)). For clarity, only log2-transformed values are shown in Figure 2, while the corresponding raw FDR and expression thresholds are provided in Figure 2 legend for interpretability. Consequently, 53 positive correlated pairs (Figure 2(c)) and 71 negative correlated pairs (Figure 2(d)) were identified within the selected intervals [positive: log2(miRNA expression mean) > 9.18, log2(FDR) < −76.42; negative: log2(miRNA expression mean) > 8.48, log2(FDR) < −211.82]. For future experimental validation, we then applied a criterion of relatively higher miRNA expression. We found that 12 gene clusters were positively regulated by these miRNAs based on their expression, while 52 gene clusters were negatively regulated. The final target miRNAs and gene clusters are presented in Table 1.

Schematic overview of the analysis pipeline used to identify and validate microRNA–target gene methylation relationships. MicroRNA expression and DNA methylation data from the CCLE were analyzed using Spearman correlation to identify significantly associated microRNA–CpG island pairs (referred to as “Pairs”). From these, only gene clusters with available mRNA expression data were retained for further validation (labeled “Common mRNA”). This integrative strategy enables multi-omic screening of putative epigenetic regulation mediated by microRNAs. CCLE: Cancer Cell Line Encyclopedia; mRNA: messenger RNA.

Selection of target microRNA and gene cluster pairs based on correlation between microRNA expression and DNA methylation across cancer cell lines from the CCLE. (a) Scatter plot of positively correlated pairs (Spearman r ≥ + 0.3). The X-axis represents the log2-transformed FDR values, and the Y-axis shows the log2-transformed average expression of microRNAs across all cell lines. The red box in the upper left corner highlights pairs with high microRNA expression and strong statistical significance (log2[FDR] < –76.42 and log2[microRNA expression mean] > 9.18), corresponding to FDR < 1.19 × 10⁻²³ and microRNA expression > 600. The middle lines of the plot correspond to x = −76.42 and y = 9.18. (b) Scatter plot of negatively correlated pairs (Spearman r ≤ −0.4), with similar axis representations and red box criteria (log2[FDR] < –211.82 and log2[microRNA expression mean] > 8.48), corresponding to FDR < 3.77 × 10−64 and microRNA expression > 362. (c) Enlarged view of the red box area in plot (a), showing high-confidence positive correlations. [log2(microRNA expression mean) > 9.18 and log2(FDR) < −76.42]. (d) Enlarged view of the red box in plot (b), showing high-confidence negative correlations. [log2(microRNA expression mean) > 8.48 and log2(FDR) < −211.82]. Dot color indicates the specific microRNA in each plot. This filtering step allows the prioritization of microRNA–gene cluster pairs with biologically relevant expression levels and strong correlation signals. CCLE: Cancer Cell Line Encyclopedia; FDR: false discovery rate.
Summary of target microRNAs and gene clusters.

Gene cluster: a gene cluster is a grouping of CpG sites with similar methylation changes around the transcription start site; positive correlation: a pair in which the microRNA expression and gene cluster methylation are positively correlated; negative correlation: a pair in which the microRNA expression and gene cluster methylation are negatively correlated.
Sequential regression analyses of miRNA expression and promoter methylation effects on mRNA expression
To investigate whether the target pairs exhibiting strong correlations in miRNA expression and promoter methylation have a dependent relationship and also influence mRNA expression, we performed sequential three regression analyses. First, a simple linear regression (first SLR) analysis was performed on the gene promoter methylation influenced by miRNA expression. The results showed significant positive correlations for all 12 target pairs with β > 0 and p-value < 0.05. Bonferroni correction confirmed statistically significant results for all 12 positive target pairs (Figure 3(a)). Additionally, all 52 pairs with negative correlations showed statistically significant results with an β < 0 and p-value < 0.05. However, two pairs, hsa-miR-200b & DSP_2 and hsa-miR-200b & FAM83H_3, did not show significant results after Bonferroni correction. Excluding these two pairs, significant results were observed for 50 pairs (Figure 3(b)). To further explore whether promoter methylation influenced by miRNAs also regulates mRNA expression, we next performed a second simple linear regression analysis. Subsequently, to validate the well-known theory of DNA promoter methylation-mediated mRNA expression regulation in our dataset, we performed a second SLR analysis on the gene promoter methylation and the corresponding mRNA expression. We separated the gene clusters that showed positive and negative correlations with the target miRNAs into positive and negative groups, respectively, and examined mRNA expression for each miRNA (Figure 3(c) and (d)). We found a significant negative correlation between promoter methylation and mRNA expression in both groups. To evaluate the combined effect of miRNA and promoter methylation on mRNA expression, we then conducted multiple linear regression. In the SLR2 results for each target pair, excluding hsa-miR-141 & TJP2_3 and hsa-miR-200c & TJP2_3 from among the positive pairs, 10 pairs showed significant results with β < 0 and p-value < 0.05, while all negative pairs showed significant results with β < 0 and p-value < 0.05 (Supplemental Table 1). Finally, we conducted a multiple linear regression analysis, considering two independent variables together, to examine whether miRNA-mediated methylation regulation affects mRNA expression. Among the 12 target pairs with positive correlations, hsa-miR-141 & TJP2_3 and hsa-miR-200c & TJP2_3 did not show β < 0 for both miRNA–mRNA expression and methylation–mRNA expression, contrary to the hypothesis we aimed to test. Excluding these two pairs, β < 0 was observed in both miRNA–mRNA expression and methylation–mRNA expression for 10 pairs, and 8 pairs were significant with p-value < 0.05. For negatively correlated pairs, miRNA expression was positively associated with mRNA expression (β > 0), and methylation was negatively associated with mRNA expression (β < 0), consistent with our hypothesis. Of the 52 pairs, 51 were statistically significant (p < 0.05), as shown in Table 2.

SLR analysis assessing the relationships between microRNA expression, DNA methylation at gene cluster regions, and mRNA expression of downstream target genes. (a) Manhattan plot of positively correlated microRNA–methylation pairs. The X-axis represents genomic positions of target genes arranged by chromosome, while the Y-axis displays –log10 (p values) from the SLR tests. (b) Manhattan plot of negatively correlated pairs, following the same axes and criteria. In both plots, colored dots indicate specific microRNAs associated with each target, with red dashed lines marking the nominal significance threshold (p = 0.05) and blue dashed lines indicating the Bonferroni-corrected threshold. FDR values are shown in both raw and log2-transformed form to enhance interpretability. (c) Distribution of mRNA expression levels for gene groups positively correlated with target microRNA via methylation, (d) corresponding distribution for negatively correlated pairs. Panels (c) and (d) validate the regulatory impact of microRNA-associated methylation on mRNA expression. All associations with p < 0.05 were considered statistically significant. FDR: false discovery rate; mRNA: messenger RNA; SLR: simple linear regression.
Summary of multiple regression analysis of mRNA expression regulation by target miRNA expression and promoter methylation.

CHR: chromosome; CI: confidence interval; Cluster no.: cluster number obtained by grouping CpG sites with similar methylation changes around the transcription start site of a gene; CpG sites (n): number of CpG sites in the region; Hypothesis matching status indicates whether the estimate (β) value from the simple regression analysis aligns with the study hypothesis;mRNA: messenger RNA; miRNA: microRNA; “Not significant,” the p-value associated with the hypothesis is not statistically significant; Region: the range between the first and last CpG sites within the cluste.
Comparing the significance of target pairs by cancer group
We performed NMF clustering on the expression of all miRNAs (n = 734) in the dataset to explore the significance of target pairs across cancer types. A rebound was observed in the cophenetic coefficient at K = 5 and K = 6, but we proceeded with grouping using K = 5, which exhibited the most distinct clustering (Figure 4(a)). Among the 26 types of cancer, only those with similar clusters containing two or more types of cancer were grouped together. Consequently, the cancer types were categorized into seven groups. We also included fibroblasts, which are expected to exhibit patterns similar to normal cells, resulting in a total of eight groups (Figure 4(b)). These NMF-based groups revealed distinct miRNA expression landscapes that were further leveraged to analyze variations in methylation regulation across cancer types. Notably, the groups were associated with differing levels of target miRNA expression, supporting their biological relevance in understanding methylation dynamics. Among the eight groups, groups 3, 6, 7, and 8 were observed to have low expression of the target miRNAs relative to the other cancer-type groups (p < 2.2e-16 by one-way ANOVA, Figure 4(c)). Using the same method, we performed SLR analysis of the target miRNA expression and the gene cluster methylation in each cancer group. Group 1 (colon cancer, gastric cancer, lung cancer, and ovarian cancer), which included the largest number of cancer types, showed SLR results that were the most similar to those of the overall cancer types, with 7 positive and 45 negative pairs (81.2% of the target pairs, Figure 4(d)). On the other hand, the SLR results of group 2 (breast cancer, endometrial/uterine cancer, and pancreatic cancer) and group 3 (brain cancer, liver cancer, and skin cancer), which included only three types of cancer each and with a similar number of cell lines, 103 and 109, respectively, exhibited markedly distinct trends (Figure 4(d)). The positive target pairs showed the same result as total cancer for two pairs (2/12) for both groups 2 and 3, while the negative target pairs showed the same result for 35 pairs (35/52) for group 2 but only one pair (1/52) for group 3. According to Supplemental Table 1, the most recurrent negative correlation target pair was hsa-miR-200b & ESRP2_2, consistently identified in four cancer groups (groups 1, 2, 3, and 5). Among positive correlation pairs, hsa-miR-141 & ATP8B2_1 and hsa-miR-141 & ATP8B2_5 were found in three groups (groups 1, 3, and 5), indicating reproducible regulatory patterns across multiple cancer types. hsa-miR-141 & ATP8B2_1 and hsa-miR-141 & ATP8B2_5 were the most frequent positive target pairs, exhibiting the same results as total cancer in three groups (i.e. groups 1, 3, and 5). In contrast, hsa-miR-200b & ESRP2_2 was the most frequent negative target pair, demonstrating the same results as total cancer in all four groups (i.e. groups 1, 2, 3, and 5). Figure 5 summarizes the functional enrichment results of the 25 target genes in GO categories, highlighting their roles in cell–cell junctions, keratin filament binding, and intermediate filaments. These findings support the biological relevance of miRNA-mediated methylation regulation. These findings are further interpreted in the Discussion section in the context of known functional roles in cancer progression. To further illustrate the integrative relationships between miRNA expression, promoter methylation, and mRNA expression in the identified gene targets, we generated a comprehensive heatmap (Supplemental Figure S1). This visualization includes the expression levels of four key miRNAs, promoter methylation β-values, and mRNA expression levels of the 25 target genes across all cancer cell lines, annotated with both cancer type and NMF cluster classification.
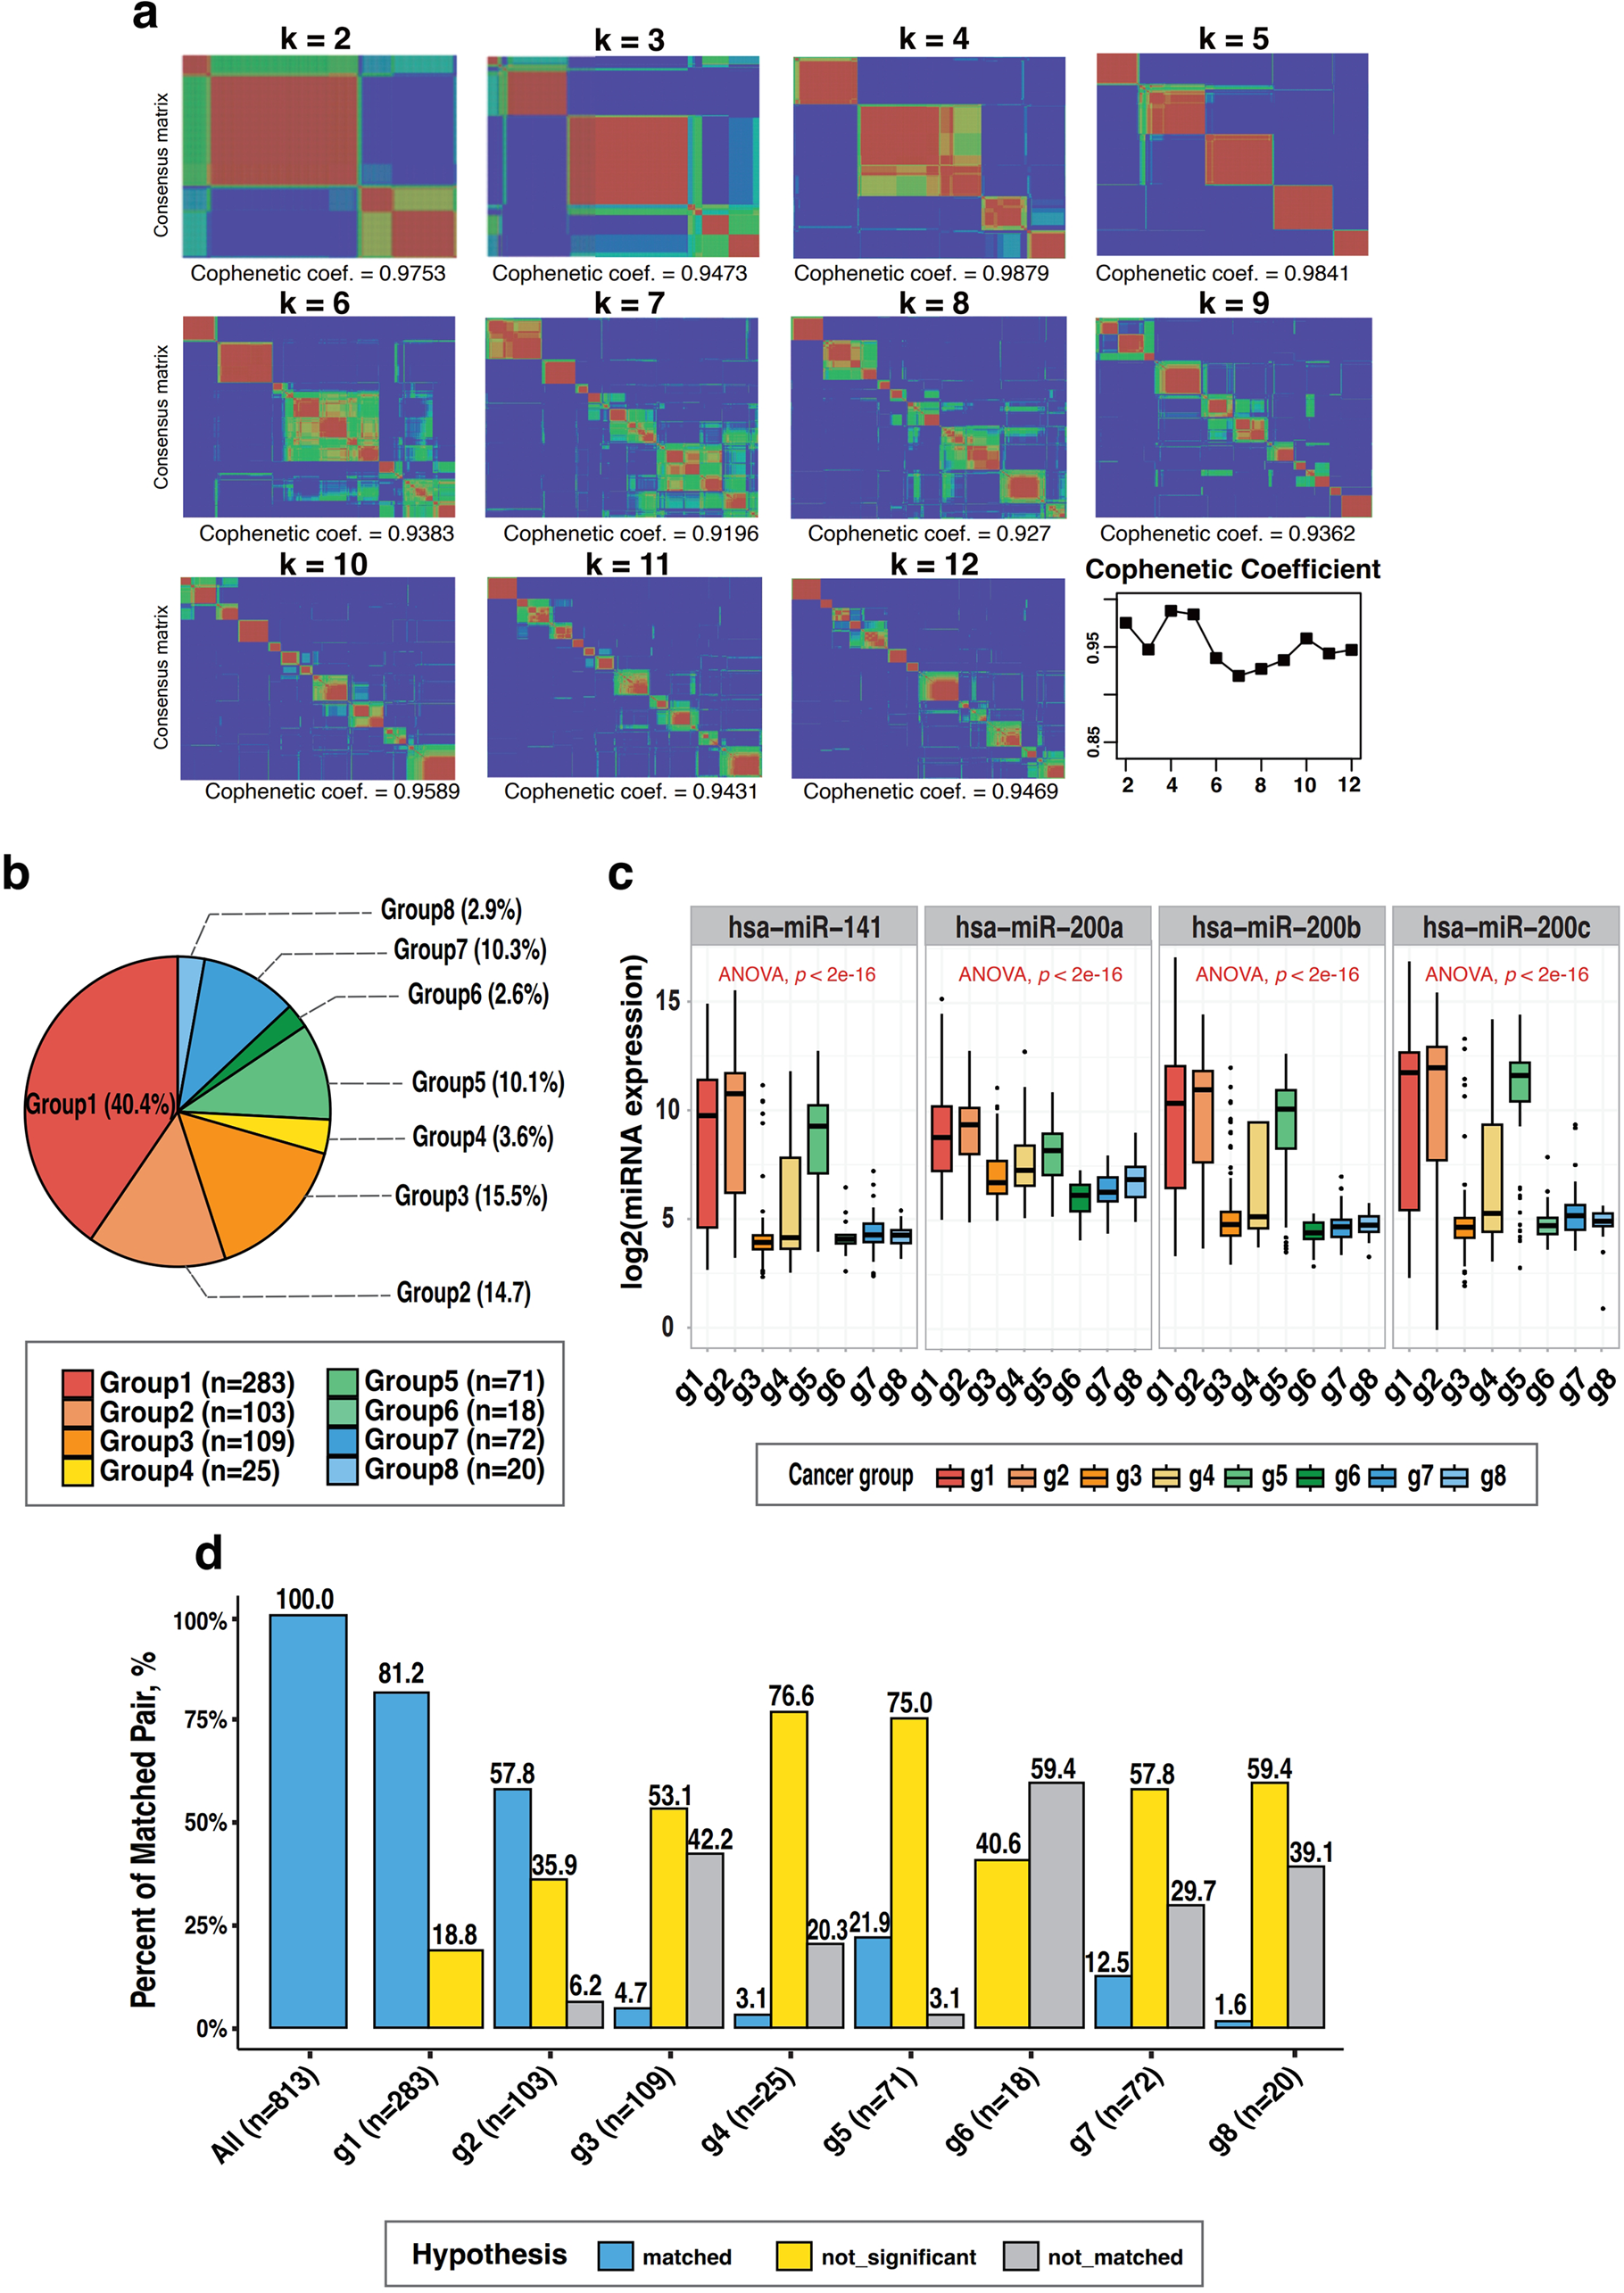
Cancer-type clustering and comparative regression analysis of microRNA–methylation associations across cancer groups. (a) Results of NMF consensus clustering performed on global microRNA expression profiles from 701 cancer cell lines. Shown are cophenetic coefficient values used to determine the optimal number of clusters (k = 2–12) and the corresponding consensus matrices. The bottom right plot illustrates that k = 8 provides the highest cluster stability. (b) Definition of the eight cancer groups based on the NMF results. Group 1 (n = 283, 40.4%) includes colon, gastric, lung, and ovarian cancers. Group 2 (n = 103, 14.7%) includes breast, endometrial, and pancreatic cancers. Group 3 (n = 109, 15.5%) includes brain, liver, and skin cancers. Group 4 (n = 25, 3.6%) includes bile duct, sarcoma, and thyroid cancers. Group 5 (n = 71, 10.1%) includes bladder, esophageal, and head and neck cancers. Group 6 (n = 18, 2.6%) includes neuroblastoma and rhabdoid tumors. Group 7 (n = 72, 10.3%) includes lymphoma and myeloma. Group 8 (n = 20, 2.9%) consists of fibroblast lines. (c) Expression distribution of selected target microRNAs across the eight cancer groups. Statistical comparison by one-way ANOVA indicates significant differences (p < 2.2e–16), suggesting group-specific microRNA expression patterns. (d) Bar plots showing the outcomes of the first SLR analysis within each cancer group. This analysis evaluates the association between microRNA expression and gene cluster methylation. Blue bars (“matched”) indicate the proportion of microRNA–methylation pairs with correlation directions matching the study hypothesis and statistical significance (p < 0.05). Yellow bars (“not significant”) represent hypothesis-consistent pairs lacking statistical significance. Gray bars (“not matched”) represent pairs whose correlation direction contradicts the study hypothesis. ANOVA: analysis of variance; NMF: negative matrix factorization; SLR: simple linear regression.

GO enrichment analysis of genes targeted by microRNA-associated methylation events. The bar plot displays significantly enriched GO terms grouped by category: BP (dark blue), MF (pink), and CC (green). The Y-axis indicates specific GO terms, and the X-axis shows –log10 of the adjusted p-value (FDR-adjusted) for each enrichment test. GO analysis was conducted using target genes identified from integrative correlation analysis and mRNA validation. Only terms with adjusted p < 0.05 were considered significant. Enriched terms include those related to transcriptional regulation, chromatin organization, and signal transduction, reflecting the potential functional consequences of epigenetic modulation mediated by microRNAs. BP: Biological Process; CC: Cellular Component; FDR: false discovery rate; GO: gene ontology; MF: molecular function
Discussion
In this study, we investigated the possibility that miRNA regulates gene promoter methylation using data collected from open-source databases. We examined the correlation between 734 miRNAs and various gene promoter CpG methylation using Spearman rank correlation analysis, identifying significant target miRNA and gene cluster pairs. In addition, we validated the dependency between the identified pairs through sequential linear regression analysis. Figure 1 depicts the workflow for the DNA methylation, miRNA and mRNA correlation, and the regression analysis. Through this process, we confirmed that the selected targets were indeed likely to be regulated by miRNA-mediated methylation of specific genes (Figure 3 and Table 2). For the SLR2 analysis on gene promoter methylation and mRNA expression, we found that, regardless of the directionality and correlation between the miRNA and gene clusters, all target pairs showed a significant negative correlation between gene promoter CpG methylation and mRNA expression (β < 0, p < 0.05), as reported in previous studies. This was further confirmed by our data (Figure 3(c) and (b) and Supplemental Table 1). Multiple linear regression considering both miRNA expression and promoter methylation on mRNA expression showed that, except for some pairs, gene promoter methylation by miRNA could also affect mRNA expression (Table 2). However, mRNA expression is a complex mechanism that can be regulated by various factors, so promoter methylation alone is not sufficient to fully explain the expression patterns. The correlation explanatory power between the selected miRNA and gene cluster pairs, derived from the analysis encompassing all types of cancer, was found to be highest in cancer group 1, which includes colon cancer, gastric cancer, lung cancer, and ovarian cancer. Group 2 (breast cancer, endometrial/uterine cancer, and pancreatic cancer) and group 3 (brain cancer, liver cancer, and skin cancer), which had similar cell numbers, showed substantial differences in the simple linear regression results of the target miRNA expression and the gene cluster methylation. It is likely that this was due to differences in the expression of target miRNAs across cancer types, particularly between groups 2 and 3 (Figure 4(c)). The variation in regulatory correlation strength across NMF-defined groups likely reflects intrinsic differences in the epigenetic programming of cancer types. For instance, group 1, which includes epithelial-derived cancers such as colon and gastric cancer, showed higher consistency in miRNA–methylation–mRNA regulation, suggesting a more canonical epigenetic regulatory architecture compared to groups like group 3, where less consistent patterns were observed. Furthermore, we observed a lower proportion of statistically significant target pairs in the SLR results for groups 3, 4, 6, 7, and 8, which had overall lower levels of target miRNA expression (Figure 4(c) and (d)).
To assess the enrichment of 25 target genes, gene ontology analysis was conducted and identified significant terms with a p-value < 0.05 in the BP, MF, and CC categories (Figure 5). DSP, CDH3, MARVELD2, and TJP2 were found to be significantly associated with cell–cell junction organization (GO:0045216) with the lowest p-value (7.03e-04) in BP. In MF, the keratin filament binding (GO:1990254) of FAM83H and VIM showed the most significant association with a p-value of 2.24e-05. In CC, intermediate filament (GO:0005882) was significantly associated with FAM83H, DSP, VIM, and PPL, with the lowest p-value (4.21e-07). Notably, the genes MARVELD2, EPCAM, and TJP2 showed functional roles in bicellular tight junctions (GO:0005923), tight junctions (GO:0070160), and the apical junction complex (GO:0043296) in the CC. These findings suggest that the miRNA-associated methylation regulation likely contributes to processes such as epithelial barrier integrity, cell–cell adhesion, and cytoskeletal stability, which are frequently altered in cancer progression and metastasis. The GO enrichment terms observed—particularly those related to tight junctions and intermediate filament organization—reinforce the potential tumor-suppressive or oncogenic contexts of the identified genes depending on cancer type.
Promoter methylation of tumor suppressor genes is an important mechanism in tumorigenesis. 20 ST14, a tumor suppressor gene, was identified as a target gene in this study and was found to be negatively regulated by promoter methylation mediated by hsa-miR-200b, hsa-miR-200c, and hsa-miR-141. According to Kim et al., the expression of Suppressor of tumorigenicity 14 (ST14) or Serine protease 14 (Prss14) genes are associated with a poor prognosis and increased invasiveness and metastatic potential in patients with breast cancer. 21 These facts suggest that miRNA-mediated regulation of ST14 gene methylation at the 5’ end, and the subsequent changes in mRNA expression, may function as a regulatory factor in tumor invasiveness and metastasis. Another target gene, OVOL1, is a transcription factor that induces the reversal process of EMT (M-EMT, mesenchymal to epithelial transition) in human cancer cells, thereby inhibiting tumor invasion and metastasis, and affecting the growth, apoptosis, and mobility of cancer cells. 22 The target gene EPCAM (epithelial cell adhesion molecule), frequently reported in the Gene Ontology analysis, is an important marker gene for cancer diagnosis and treatment, as it is overexpressed by various types of cancer cells, including colon and breast cancer.23,24 The possibility that the promoter methylation of EPCAM can be regulated by miRNA suggests a new perspective on cancer diagnosis and treatment.
Some previous studies have used bioinformatics to investigate the correlation between miRNA and CpG methylation. Such studies have focused on the interaction between DNA methylation and miRNA expression in the context of the phenotype of breast cancer 25 or the mechanisms of racial heterogeneity in hepatocellular carcinoma. 26 They mainly discuss the regulation of miRNA expression by methylation or the inhibition of DNMT enzymes by miRNA. However, these studies have not specifically focused on gene promoter methylation mediated by miRNA. Therefore, our study can be considered one of the first to screen the targets of miRNA-mediated promoter methylation in 26 diverse cancer types. However, the results of the current analysis have limitations in proving the hypothesis that miRNA guides promoter methylation of specific genes. To more clearly confirm this hypothesis, direct evidence of an interaction between miRNA and DNMT is needed. We plan to perform additional experiments, such as miRNA knockdown using siRNA, miRNA transfection, and chromatin immunoprecipitation sequencing (ChIP-seq). Before conducting experimental validation, we randomly verified the sequence homology between the target gene clusters and the miRNAs using BLAST. The results are shown in Supplemental Tables 2 and 3, and we were able to confirm sequence homology in some target pairs. However, due to the short query sequence length of approximately 22 base pairs and the limited matching of miRNA and gene cluster sequences with significant correlations, there was a notable disparity in the e-value and bit-score when compared to the general BLAST (the detailed methods can be found in the “sequence homology” section of the Materials and Methods). Importantly, the interpretation of our sequence homology results should be approached with caution. Due to the relatively short length of mature miRNAs (∼22 nucleotides), there is a high probability of obtaining spurious alignments when scanning large genomic regions. This intrinsic limitation of short-sequence homology analysis can inflate the apparent biological relevance of observed matches. Therefore, while our BLASTn-short analysis provides a preliminary map of potential target regions, these findings are hypothesis-generating and require experimental validation to confirm direct interactions between miRNAs and promoter DNA sequences.
These findings align with and extend previous studies highlighting the regulatory role of miRNAs in modulating DNA methylation in cancer. For example, Zhang et al. demonstrated that miR-29c suppresses DNMT3A expression, contributing to hypomethylation of tumor suppressor genes in colorectal cancer. 27 Similarly, Liu et al. proposed that combined miRNA and methylation signatures in circulating cell-free DNA can effectively distinguish early-stage lung cancer from healthy controls. 28 These examples support the translational relevance of our findings and suggest that miRNA-mediated methylation may offer novel biomarkers for noninvasive cancer screening. In our analysis, stronger correlations between miRNA expression and promoter methylation were notably observed in colorectal, gastric, lung, and ovarian cancers. This may reflect the high epigenetic plasticity and tissue-specific regulatory programs inherent to these tumor types. 29 In addition, prior studies have shown that these cancers frequently exhibit coordinated dysregulation of miRNA expression and DNA methylation, suggesting that their gene expression landscapes are especially sensitive to miRNA-epigenetic interactions.30,31 The relative abundance of these cancer types within the CCLE dataset may also have contributed to greater statistical power in detecting significant correlations.
Nevertheless, through screening using bioinformatics, we efficiently explored a large dataset to identify target pairs with strong correlations, and we validated the expression of mRNA for the target pairs using an mRNA database. This study is a foundational step in identifying the targets of miRNA-mediated promoter methylation phenomena. These results need further experimental validation. Our findings expand our understanding of the mechanisms underlying tumor formation through methylation and provide a new perspective on the use of miRNA in cancer treatment.
Conclusion
In this study, we investigated the potential regulatory role of miRNAs in gene-specific promoter methylation across multiple cancer types using data from the CCLE database. Through integrative correlation and regression analyses, we identified several miRNA–gene pairs showing strong associations between miRNA expression, promoter CpG methylation, and mRNA expression. Functional enrichment of target genes suggested relevance to key cellular processes involved in tumor development. Notably, cancer types such as colorectal, gastric, lung, and ovarian cancers exhibited more robust miRNA–methylation correlations, potentially reflecting their epigenetic sensitivity. While these findings offer novel insights into epigenetic regulation, our results are based on computational analysis and should be interpreted as hypothesis-generating. Further experimental validation is needed to confirm the mechanistic links between miRNAs and DNA methylation. These findings provide a foundation for future research into the role of miRNA in epigenetic modulation and may aid in the development of new diagnostic or therapeutic strategies.
Supplemental Material
sj-docx-1-sci-10.1177_00368504251370988 - Supplemental material for Investigating miRNA-driven DNA methylation: Statistical evidence of gene-specific modulation
Supplemental material, sj-docx-1-sci-10.1177_00368504251370988 for Investigating miRNA-driven DNA methylation: Statistical evidence of gene-specific modulation by Seyeon Jeon, Ha Ra Jun, Ji-Young Lee, Chang Ohk Sung and Sung-Min Chun in Science Progress
Footnotes
Acknowledgements
Authors’ contributions
SJ performed most of the data analysis with assistance from HRJ, J-YL, COS, and S-MC; SJ collected the data and wrote the manuscript; HRJ validate the analyzed result; and S-MC designed the study and edited the manuscript.
Funding
The authors disclosed receipt of the following financial support for the research, authorship, and/or publication of this article: This study was supported by the grants (2019IP0836-1, 2023IP0085-2) from the Asan Institute for Life Sciences, Asan Medical Center, Seoul, Korea.
Declaration of conflicting interests
The authors declared no potential conflicts of interest with respect to the research, authorship, and/or publication of this article.
Data availability
Supplemental material
Supplemental material for this article is available online.
References
Supplementary Material
Please find the following supplemental material available below.
For Open Access articles published under a Creative Commons License, all supplemental material carries the same license as the article it is associated with.
For non-Open Access articles published, all supplemental material carries a non-exclusive license, and permission requests for re-use of supplemental material or any part of supplemental material shall be sent directly to the copyright owner as specified in the copyright notice associated with the article.