
Abstract
The current study intends to provide a sustainable substitute for conventional motorbike-based delivery systems in Sydney, Australia, by designing a novel bio-hybrid solar quadricycle powered by plug-in, pedal, and solar energy. The current study exclusively integrates structural material analysis through ANSYS with powertrain simulation in Simulink to ascertain performance and feasibility. Among the tested materials, the low alloy steel AISI 4140 exhibits exceptional structural integrity with a minimal total deformation of 0.56116 mm, low equivalent strain (0.00073098 mm/mm), and the highest safety factor (4.3469). Modal analysis identifies aluminum 6061-T6 as effective in vibration damping, enhancing rider comfort, but other static structural results are not satisfactory. Simulink results confirm that a 1.8 kW DC motor coupled with a 3 kW lithium ion battery (LIB) permits effective operation over the New European Driving Cycle (NEDC) drive cycle, covering 3.3 km at a peak speed of 34 km/h, with only less than 1.5% drop in battery state of charge (SOC). Although the AISI 4140 shows the most effective results, it possesses higher hardness and lower ductility and is therefore less appropriate for parts that undergo exposure to cyclic loads, making it unsuitable for the whole chassis. AISI 4130 offers the best overall balance of strength, fatigue resistance, and ease of manufacturing. AISI 4130 also provides a superior blend of resilience, resistance to fatigue, and weldability. The outcomes portray AISI 4130 as the optimal frame material, offering a promising solution for eco-friendly and ergonomic urban delivery transport in Sydney, Australia.
Keywords
Introduction
The demand for effective, economical, and sustainable last-mile delivery solutions has grown as online retailing and metropolitan populations have expanded. Existing vehicle categories, such as electric delivery vans and engine-powered bikes, face constraints like exhaust emissions, short driving range for electric vehicles, limited battery lifespan, extensive charge time, infrastructure dependence, and insufficient cargo capability, making it difficult for existing city transportation systems to meet these demands for operation. It emphasizes the necessity for a mode of transportation that can continue to function without or with minimal assistance from external power grids while maintaining cost and ecological sustainability. To overcome this problem, the current study suggests a revolutionary bio-hybrid solar quadricycle that combines human pedaling, solar photovoltaic harvesting, and plug-in charging. Due to the increase in number of technological advancements, there is a substantial upsurge in the need for cargo transportation in urban areas. 1 By 2050, around 68% of people are expected to reside in urban settings. 2 The transportation sector is a significant source of greenhouse gas emissions and excessive energy use in urban environments. The fleet of light vehicles, especially light commercial vehicles, accounts for most emission outputs in the transportation sector. This is particularly noteworthy in massive cities where the increase in demand for quick delivery services causes traffic congestion and pollution. 3 The transportation accounts for almost 50% of overall fuel consumption and 25% of carbon emissions. 4 Both passenger and cargo transportation lead to environmental and safety concerns. A significant portion of road transport in urban areas is parcel delivery vehicles. 5 Road transportation is primarily responsible for CO2 emissions of about 71.7%. 6
The automotive industry is extensively conducting research on alternative technologies to address major global issues, such as carbon reduction, road congestion, fuel depletion, cost hiking, and global warming. One such technology, the electric vehicle (EV), produces a low carbon content and contributes to reducing greenhouse gas (GHG) emissions. 7 As the transport sector accounts for a noteworthy portion of greenhouse gas emissions, innovative methods must be developed to lower emissions and enhance cargo efficiency. Electric cargo bikes provide an opportunity to mitigate congestion in cities because of their reduced carbon footprint and lower operating costs. Electric-assist motors and strong frames can carry heavier loads farther than traditional cycles, reducing the adverse impacts of traffic. 8 In all the anticipated circumstances, EVs proved to be the most effective solution in terms of sustainable ecological impact. Specifically, when driving an EV, the GHGs are decreased by 17% in shorter mileage scenarios (about 20 km/day) and by 54% in longer distances like 120 km/day, and even further if a larger daily distance is taken into account. 9 EVs will ultimately replace vehicles with internal combustion engines due to the depletion of fossil fuel supplies and rapid fluctuation in their prices. Electric cars offer less maintenance, generate less pollution and sound, and may open the avenues for environment friendly transport soon. 10 Indonesia plans to bring out three million electric vehicles by 2030. 11 Significant advancements in sustainable transport include adopting energy from renewable sources in transportation infrastructure and the electrical conversion of urban transport. 12
Waseem et al. 13 conducted finite element analysis (FEA) to obtain insights into an automobile's mechanical structure and ascertained deformation, stress, and strain energy under varying conditions. The result exhibits that the factor of safety for the modified chassis is 1.8741 in comparison with the existing chassis factor of 1.6978 under similar loading conditions. They found that the modified chassis has more strength, light in weight, and is easy to fabricate in comparison with the existing double-type chassis. The design and fabrication of vehicle chassis are vital components in the automotive industry as they support the entire weight of the vehicle and other factors, such as passenger mass. The chassis design is one of the fundamental factors in a vehicle's construction for its optimized performance. Dubey et al. 14 investigated a total of 22 commercial engineering materials and found that AISI 4130 material is the most suitable due to its incredible strength compared to other materials. Furthermore, the advancements in FEA have made it possible to evaluate the performance of chassis made of tubes in different stress and impact situations, and this complies with the regulations established by the Society of Automotive Engineers for automotive design and development. Chandan and Shantala 15 analyzed the chassis of an electric motorcycle, which was modeled through Catia V5 software and hyper mesh-optistruct. They conducted a modal analysis to select the chassis material through a comparison between AISI 4130 and Al7075. Both AISI 4130 and Al 7075 were used in the study to analyze the frame of vehicle design. It was discovered that AISI 4130 performed better due to lower deformation, complying with industrial safety regulations, and had a deviation of <10% in the FEA analysis and analytical data. Shiva et al. 16 developed a three-dimensional (3D) computer-aided design (CAD) model in SolidWorks, and ANSYS was used to analyze the chassis response for different materials under stress. The materials used were AISI 4130, AISI 1018, and AISI 1020. The material chosen was AISI 4130 steel for the chassis, which has a higher strength-to-weight ratio than other materials. Patel et al. 17 conducted FEA for AISI 4130 and AISI 1018 to identify the areas of stress generation. The FEA indicates that the chassis frames made of AISI 4130 can sustain considerable forces while preserving safety margins, with a safety factor that is 116.43% greater than AISI 1018, suggesting improved performance under stress conditions. To assess the behavior of various types of steel, such as AISI 1018, 1065, 4140, and AISI 316, Rao et al. 18 created a CAD model of a cargo train carriage and carried out structural evaluation utilizing ANSYS. According to their findings, AISI 1018 was the best option for carriage building since it showed the lowest levels of stresses and total deformation. The existence of small vibrations during loading circumstances was further shown by modal examination, highlighting the importance of these evaluations in improving cargo carriage structure for railroad operations.
In a recent study on optimizing the efficiency of an existing electric bus chassis, the steel structure was replaced by aluminum 6061-T6 and aluminum 7075-T6 for weight reduction while maintaining safety and structural integrity. To validate safety and structural integrity, a study comprising total deformation and stress was carried out in ANSYS. The ANSYS results suggested a weight reduction of 65.61% for 6061-T6 and 64.33% for 7075-T6. 19 With emphasis on lightweight structures, made of steel and aluminum, and increased safety considerations, the study offers two topological optimization studies for the ideal EV frame shape. It highlights the necessity of effective frame design because of acquisition prices and the thickness of the wall restrictions. 20 A vehicle suspension lightweight front upright was designed using a topological optimization technique, with a 60.43% less mass was produced. After testing the optimized model in a variety of scenarios, the uprights were included in the sports suspension as they satisfy the requirements for performance. 21 The investigation into the materials for the bio-hybrid solar quadricycle frame opens the door to further improvements. Martyushev et al. 22 suggested a simulation model for calculating an EV's range. The MATLAB Simulink software platform was used to conduct a simulation, which demonstrated how crucial it is to comprehend the power reserve and range of EVs.
The hybrid vehicle approach provides an eco-friendly substitute for conventional gasoline-powered vehicles by lowering pollutants and fuel consumption. Recent research suggested a solar-hybrid system that eradicates the need for internal combustion engines; instead, batteries charged by solar energy are used for mobility. This method tackles both sustainability problems and the long-term petroleum shortage, focusing on renewable energy sources as a potential future option. 23 The utilization of photovoltaic technology in vehicles to lower greenhouse gas emissions, increase renewable energy availability, and increase the range of transportation is drawing more attention. Solar-powered vehicles are becoming more viable due to developments in renewable power sources and battery technologies, despite obstacles such as high initial cost and higher operational requirements. The appropriate regulatory structures and the establishment of infrastructure are essential to completely shift toward green transportation. 24 The photovoltaic (PV) cells combined with motors and engines provide an eco-friendly alternative to conventional transportation. The bio-hybrid solar quadricycle presents a feasible option for traveling across long distances with greater effectiveness, lower emissions, and a reduction in dependency on grid power for recharging. 25 According to recent research, solar electric vehicles (SEVs) can become a significant renewable energy means by incorporating flexible photovoltaic cells over their surfaces. It can reduce yearly power consumption by up to 21.5%, slash recharging expenses, and provide infrastructure and environmental benefits as well. 26 A recently published study 27 described a hybrid energy storage system (HESS) that combines photovoltaic, fuel-cell technology, supercapacitors, and battery packs to improve the vehicle's performance and effectiveness. The system was modeled in MATLAB/Simulink and controlled by a controller, which regulated the distribution of energy according to the state of the batteries. The use of PV lowered the load on the battery and decreased charging time, whereas the use of regenerative braking increased energy recovery. The outcomes revealed around 20% improvement in range, demonstrating the HESS as a feasible and economical option for boosting the performance of EVs. A study explores a hybrid vehicle that runs solely on solar power posesses zero emissions. The car significantly lowers toxic emissions by combining solar, motors, and battery. The experimental and MATLAB/Simulink computations are verifying the mathematical model under various operating conditions, and the system demonstrates greater effectiveness than conventional hybrid cars with internal combustion engines. 28 A maximum power point tracking (MPPT) for solar electric cars and solar energy systems is getting popular, using hybrid strategies for optimization. These methods leverage the advantages of many techniques to increase productivity, precision, and tracking speed, particularly in difficult situations like partial sunlight and quickly fluctuating illumination.
Under changing sunlight, an integrated MPPT strategy that combines high-frequency perturb & observe (P&O) and iterative learning control significantly improves tracking speed as well as precision. This technique is perfect for solar-assisted electric cars since it accomplishes tracking in just 12% of the typical reaction period and offers a 3.89% precision enhancement. 29 The challenges of traditional MPPT techniques during partial sunlight have been addressed by the concept of an integrated gray wolf optimization (GWO), particle swarm optimization (PSO) technique. It blends the quick convergence of the PSO technique with the worldwide GWO technique. In comparison with PSO, GWO, and P&O, modeling and simulation results demonstrate better tracking proficiency, quicker convergence, and greater effectiveness. They are also straightforward to set up and adaptable. 30 Arithmetic-based GWO (AGWO) is a combination approach that combines the advantages of the arithmetic optimization algorithm for exploration and GWO for exploitation to enhance MPPT effectiveness during limited sunlight or shading. With a tracking performance that is 16.41% greater than P&O and a reaction time of 60.42% quicker than PSO, this approach surpasses conventional methods and is thus adequate for solar electric vehicles with changing conditions of operation. 31 By providing superior tracking, more seamless operation, and better energy utilization, the Honey Badger Optimization (HBO) algorithm outperforms P&O and PSO. In a recent study conducted on a variety of PV systems demonstrated that HBO reaches efficiency levels exceeding 97%. 32
The influence of solar radiation fluctuation on urban PV electric cars is investigated in a recent study by contrasting PSO with incremental conductance methods of control. The results demonstrate that PSO provides greater energy generation and better overall effectiveness. 33 To address partial shadowing in solar systems, Hajar et al. have created an innovative MPPT technique that incorporates a Kalman filter alongside PSO. Using a TMS320F28379D, a processor from Texas Instruments, this technique reduces time spent on tracking to about 99.998%, outperforms traditional P&O by 30%, and PSO by 10%. 34 To reduce pollution and increase energy efficiency, researchers suggested a novel hybrid vehicle that is powered only by renewable energy sources, such as wind, sunlight, fuel cell technology, and supercapacitors. Motors are mounted on wheels, and a sophisticated control system have been employed in the framework, which determines the appropriate energy source based on operational requirements. Simulations demonstrated that the system supports worldwide sustainable development goals while operating effectively with nearly zero emissions of carbon. 35 An approach to develop an EV employing real-world evaluation using MATLAB/Simulink as a tool. By addressing gaps in the literature, this method improves vehicle performance, safety, and dependability within research frameworks. 36 To provide a framework for real-time evaluation based on actual driving data, drive cycles are utilized to describe users’ driving behaviors for automobiles. The vehicle performance can only be optimized if it follows the real driving conditions. 37 Using urban drive cycles, a recent study proposes a model-based method for evaluating an automobile EV drive train system's battery performance for different operating conditions using MATLAB. User driving behavior has a significant impact on the lifespan of the battery pack, which is a cost oriented aspect of an EVs. The model's ideal speed range, 21 to 34 km, was found to minimize energy utilization against different driving cycles for 3600 seconds. 38 In comparison to local drive cycles, the New European Drive Cycle (NEDC), which offers more mileage and less electrical energy usage, is often employed to assess EVs’ efficiency. One research study found that a battery-powered bike's mileage using the NEDC was 130 km, whereas the Indian Drive Cycle (IDC) was 95 km. 39 Recent research examined the driving efficiency of EVs and hydrogen vehicles modeled as a postdelivery vehicle, using the NEDC as a baseline. EV was found to be approximately 30% more efficient and covered approximately 90 km, but the hydrogen vehicle only covered about 65 km in the same circumstances. Even though EVs are now more efficient and have greater mileage than traditional cycles like the NEDC, hydrogen vehicles are still a viable option for the foreseeable future. 40
Based on the literature review, quadricycle development can be optimized and made in-line with sustainability objectives by conducting research in different avenues such as advanced materials (titanium alloys and carbon fiber), hybridization, enhanced electric charging, ergonomics, intelligent technology integration, life cycle evaluations, and studies on adoption by consumers. Multiple studies show the importance of material selection on vehicle weight, power consumption, operation, and maintenance costs. Moreover, renewable sources like solar energy should be integrated with conventional power sources. The increase in the adoption of hybrid EVs can decrease greenhouse gas emissions, promote environmental sustainability, and increase efficiency for last-mile urban delivery and logistic operations. The current study applies the FEA approach to thoroughly analyze the properties of various materials and energy sources and their broad applications for developing last-mile urban delivery and logistics vehicles. By analyzing these critical factors, the current study contributes to sustainable urban mobility. It attempts to better understand these critical factors by thoroughly assessing material characteristics, innovative drive train architectures, and their extensive implications for developing final-mile delivery transport vehicles. Additionally, it promotes innovative and novel techniques for improving urban logistics and cargo operations. The significance of the current study lies in the development of energy-efficient and sustainable means of transportation that address the urban cargo and logistics obstacles while offering eco-friendly and green alternatives. Table 1 shows the static structural analysis results reported in the literature for distinct materials.
Finite element results of static structural performance based on reported literature.

Materials and methodology
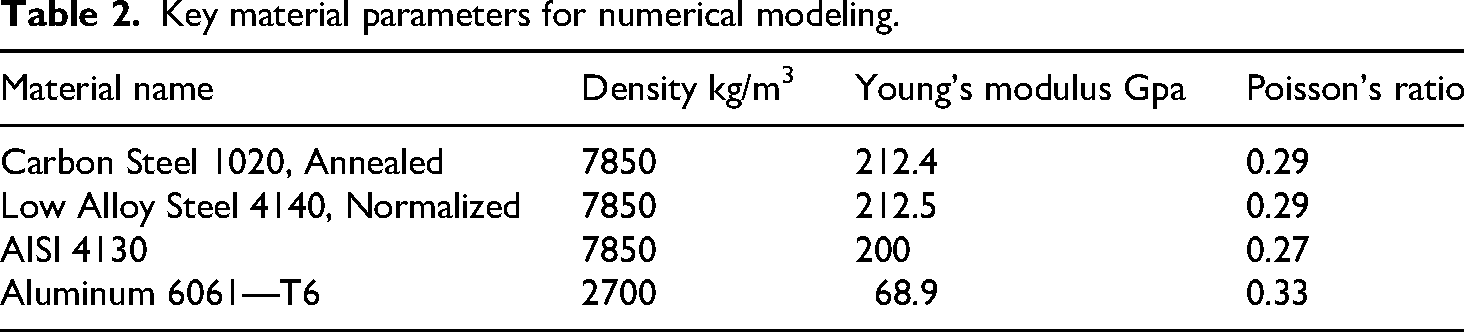
The appropriate material, battery, and motor selection for any EV or hybrid vehicle is important for ensuring safety, reliability, structural integrity, efficiency, and overall performance. The material needs to be cost-effective, available in the local market, exhibit required mechanical properties and satisfy operational conditions. The current study analyzed a bio-hybrid solar quadricycle chassis using different materials. The current bio-hybrid solar quadricycle can be charged using solar power, pedal power, and plug-in charging. A 3D CAD model was developed using SolidWorks, and FEA analysis was carried out in ANSYS. Four materials were selected for the study due to cost effectiveness, easy fabrication, and local market availability: Carbon steel AISI-1020 annealed, ow alloy steel AISI 4140 normalized, AISI 4130, and aluminum 6061-T6. The selected material properties are given in Table 2.
Key material parameters for numerical modeling.
The performance analysis based on the motor and battery is carried out in Simulink. In Simulink, the NEDC drive cycle is used to run the vehicle for 1180 seconds, and then the distance traveled by the vehicle, speed, and battery state of charge are calculated. The vehicle driveline architecture is given in Figure 1. The battery's SOC is continually monitored by the system. The system determines that the SOC drops below a predetermined level, that is, 80%. If so, electricity generated by pedaling or solar energy is used for recharge, with the highest priority given to these renewable resources. To minimize dependency on the electrical grid, plug-in recharging is limited to being utilized while the vehicle is not in operation. The current strategy uses renewable energy as the primary power source and guarantees that the battery is properly maintained without lowering system performance. The charging algorithm for the current bio-hybrid solar quadricycle is illustrated in Figure 2.

Schematic of the bio-hybrid solar quadricycle architecture.
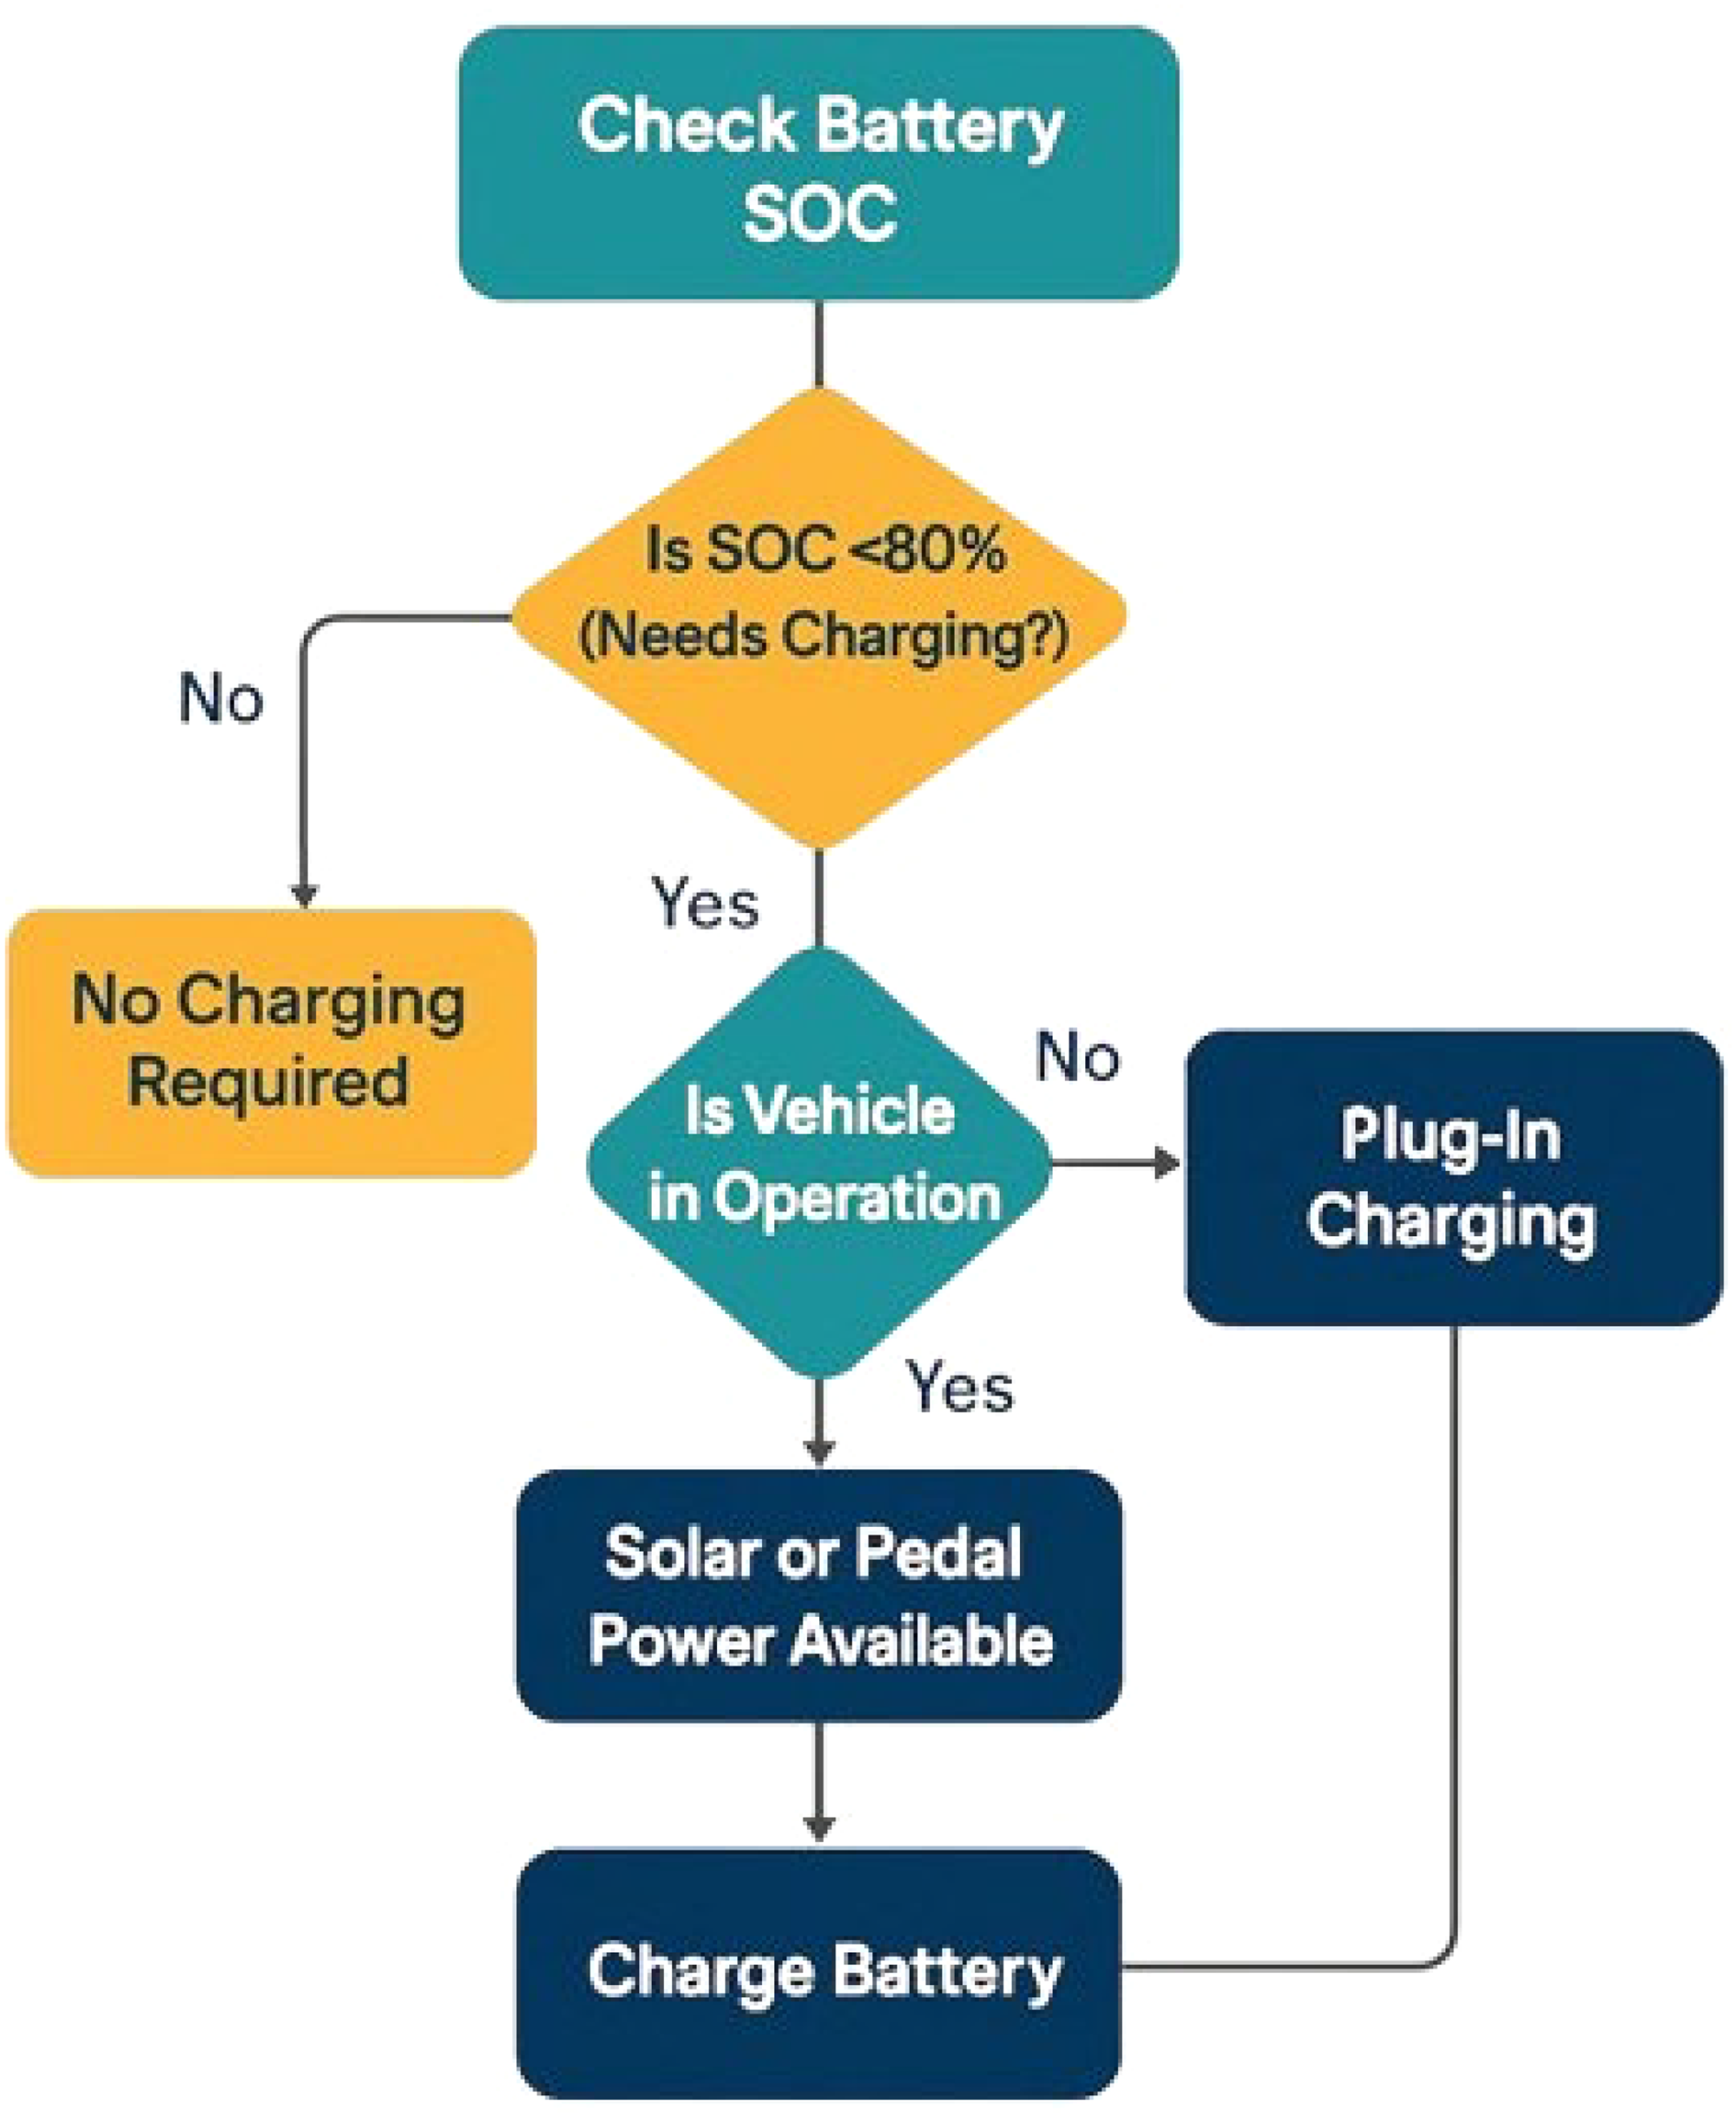
Flow chart illustration for battery charging algorithm.
Simulation setup
The proposed 3D CAD vehicle model was developed in SolidWorks, as shown in Figure 3. The chassis was made from circular pipes using a weldment module in SolidWorks, shown in Figure 4; the chassis dimensions and parameters were estimated, considering the last-mile delivery challenges in Sydney, Australia. Multiple analyses were carried out using ANSYS to assess the response of the bio-hybrid solar quadricycle chassis against different loading conditions. Based on literature review, the selected analysis was static structural and modal to get better insights into structural stability and safety under various loading conditions; static structural analysis includes total deformation, equivalent (von Mises) stress, equivalent strain, and safety factor.
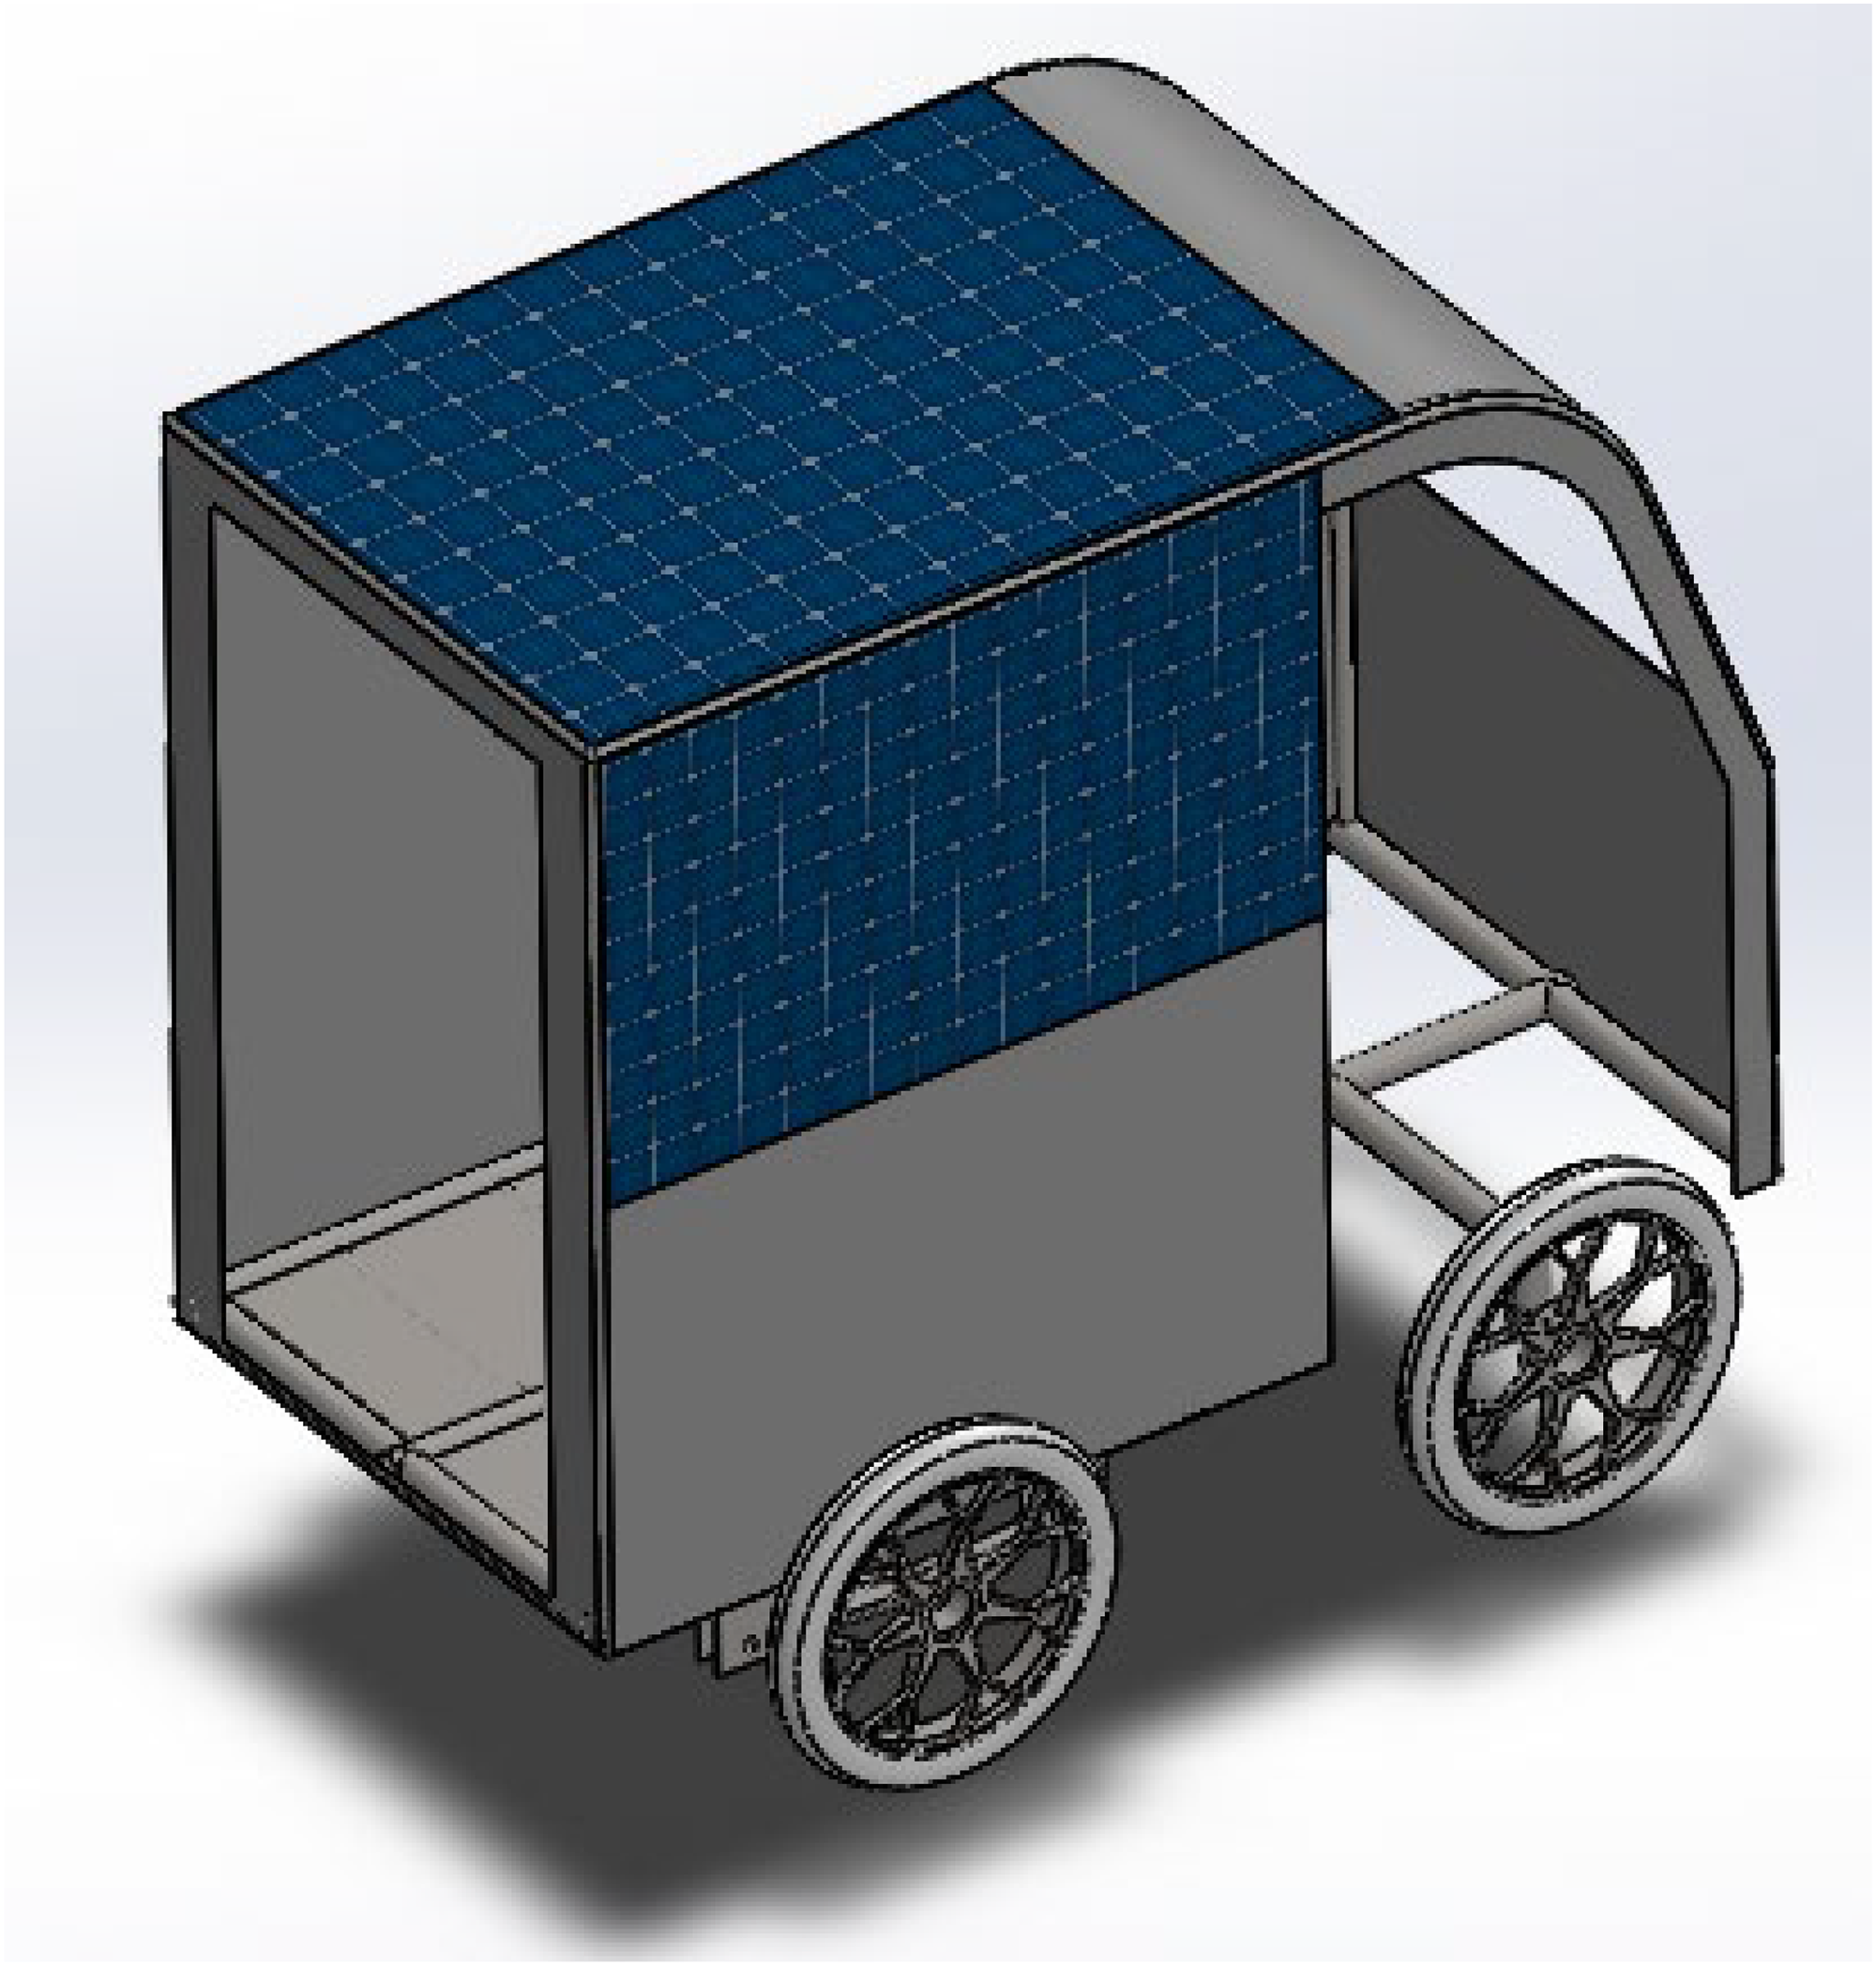
Proposed 3d model for bio-hybrid solar quadricycle.

Bio-hybrid solar quadricycle frame 3d model in SolidWorks.
The meshing of the frame is done using a mesh element size of 10 mm, employing the tetrahedra meshing method. The resulting mesh consisted of 271,113 elements and 548,819 nodes, providing a detailed representation of the frame's geometry. The cargo weight is 1471 N or 150 kg, and the rider's weight is 610 N or 62.2 kg, as shown in Figure 5(a) and (b), respectively.

ANSYS based analysis for distinct load applied: a) for cargo weight, and b) for rider weight.
Motor and battery performance
The vehicle's design was optimized against established design calculations, resulting in the selection of the most suitable parameters for its development. These parameters, including vehicle mass, powertrain configuration, and battery capacity, were incorporated into a MATLAB Simulink model. The NEDC was selected to simulate the vehicle's performance in a sustainable commuting environment at an average speed of 34 km/h and run time of 1180 seconds. This cycle produced comprehensive results, encompassing a comparison of actual and reference speed, battery state of charge, and distance traveled. Table 3 provides a detailed summary of the boundary conditions and specification parameters for the bio-hybrid solar quadricycle and their corresponding values. Figure 6 shows the Simulink model architecture used for simulating the performance of an EV under the NEDC. The simulation is designed to validate the selected motor and battery configuration by analyzing key performance indicators such as actual speed, distance traveled, and SOC. The model begins with a driving cycle input, represented by the NEDC, embedded within a subsystem. This reference speed (VelRef) is compared with the vehicle's feedback speed (VelFdbk) in the Longitudinal Driver block, which generates throttle (AccelCmd) and brake (DecelCmd) commands accordingly. The road grade is set to zero, simulating a flat terrain. These commands are fed into a DC motor model, which acts as the propulsion source for the vehicle. The motor's output torque is passed through a simple gear block and then into the vehicle body and tire blocks, which simulate the vehicle dynamics and traction forces using the magic formula tire model. The motor current is monitored through the current sensor block, and the battery pack supplies the required electrical power. The battery block provides real-time outputs for SOC, current, and voltage, which are critical for energy management and range estimation.

Simulink model for battery and motor performance using NEDC.
Vehicle design parameters and operational constraints.
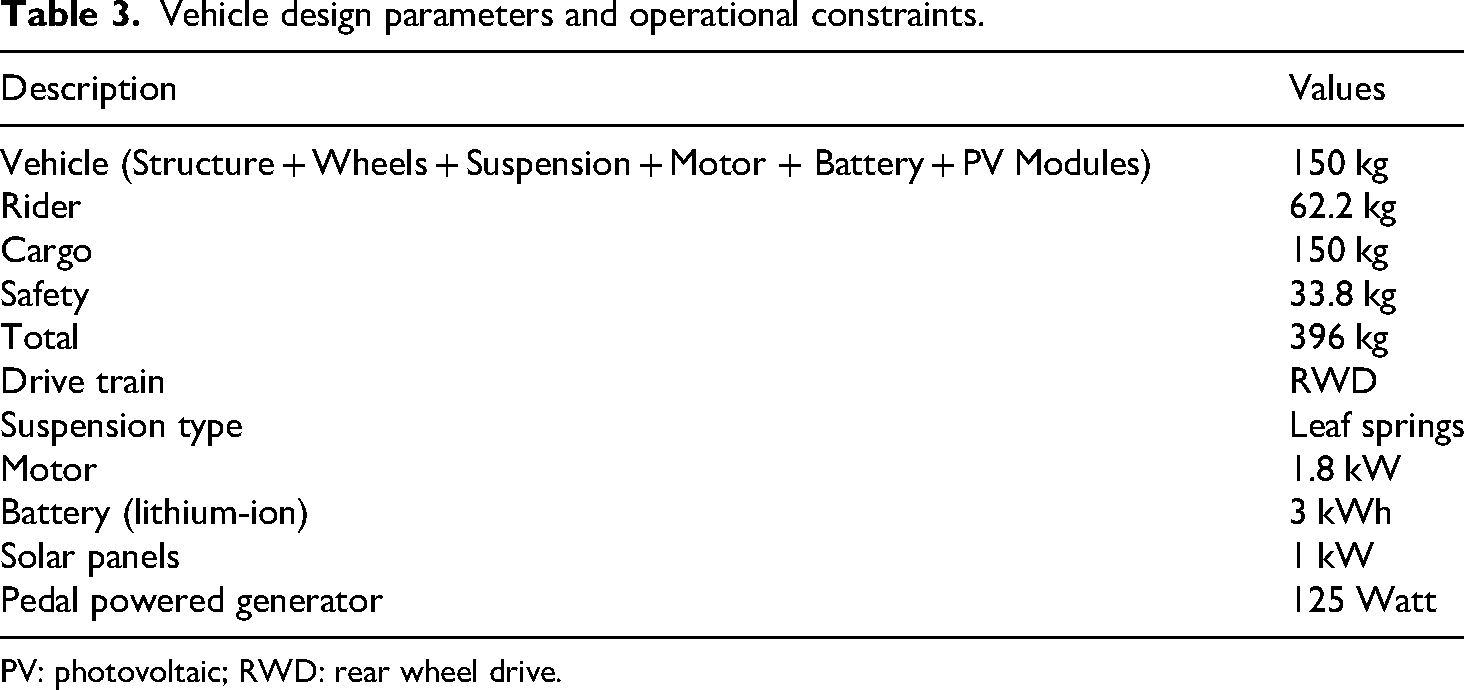
PV: photovoltaic; RWD: rear wheel drive.
The simulation outputs are routed to display blocks for visual monitoring of the following parameters:
Speed tracking, by comparing actual speed versus the reference profile Voltage, current, and SOC from the battery Distance traveled
This integrated system allows for performance validation under realistic driving conditions, enabling the assessment of battery capacity, motor suitability, and control strategy effectiveness for the EV. The governing equations for the powertrain are given below as equations 1, 2, 3, 4, 5, and 6.
where, Pbattery = battery power, Vbattery = battery voltage, and Ibattery = battery current.
where, ηmotor = motor efficiency, Tmotor= motor torque, and ωmotor = motor angular speed
Where, G = gear ratio
where, Ftraction = tractive force, m = mass, a = acceleration, ρ = air density, Cd = drag coefficient, A = frontal area, v = velocity, g = gravitational acceleration, Cr = rolling resistance and θ = road slope angle.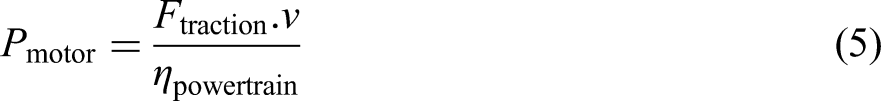

where, ηpowertrain = powertrain efficiency and ηtransmission = transmission efficiency.
Vehicle charging and control logic
The proposed bio-hybrid solar quadricycle uses closed-loop control logic; the energy-management system of the vehicle keeps an eye on variables such as PV power, pedal-generated power, plug-in charging, battery SOC, and vehicle state. To fullfil vehicle power requirements, the system proactively distributes sources of power, giving environmentally friendly inputs priority. When SOC falls below 80%, charging is activated to avoid excessive charging. To avoid deep discharging, the system switches to plug-in charging while stationary and initiates precautionary measures if the state of charge drops below 20%. The pseudocode for the control logic is given below.

In addition to the energy management method, Table 4 lists the main parameters and thresholds for making decisions and associated system reactions that regulate the vehicle's power distribution. These conditional criteria, which represent the real-time prioritization of power sources, are taken straight from the control logic.
State-based charging actions during vehicle operations.

PV: photovoltaic; SOC: state of charge.
Results and discussions
For each conducted test, ANSYS software generated numerical results encompassing parameters such as displacement, equivalent strain, equivalent (von Mises) stress, safety factors, and modal frequencies. These results are systematically recorded and thoroughly analyzed to assess how materials respond when subjected to various load conditions. Sensitivity analysis is also performed to examine the influence of changing parameters. By thoroughly examining the data, the primary objective is to identify the material that demonstrates the highest level of structural integrity, load-bearing capacity, safety margins, and adaptability across various load scenarios. These findings significantly shaped subsequent stages of the research, guiding the optimal selection of material for the bio-hybrid solar quadricycle frame.
Total deformation analysis
The total deformation of each material is evaluated under specified loading conditions to assess its structural behavior and deformation characteristics. The analysis is intended to determine the material with the least deformation, indicating higher rigidity and structural integrity. ANSYS employs equations (7) and (8) for total deformation.

where K is the stiffness, x the displacement, and F the force. Figure 7 graphically compares the total deformation among the bio-hybrid solar quadricycle frame materials. It is observed that AISI 4140 normalized exhibited the least amount of deformation of 0.56116 mm, indicating higher rigidity and structural integrity under the applied loads. Similarly, AISI 1020, AISI 4130, and 6061-T6 exhibit total deformation of 0.56143, 0.59618, and 1.729 mm. These findings are consistent with the inherent properties of the materials: 6061-T6 aluminum exhibits noticeably more deformation due to its lower Young's modulus than steel, which reduces flexibility during loading. Minute deviations among AISI 1020 and AISI 4130 indicate their intermediary strength classes, but AISI 4140's greater yield value and finer internal structure from normalization probably improved its resilience to strain. These findings highlight AISI 4140 normalized as the best option for situations where structural integrity and low deformation are top priorities. Figure 7 illustrates the deformation patterns and magnitude for each material based on the color scheme. The red color indicates maximum deformation, and the blue color indicates minimum deformation. Figure 7 graphically demonstrates deformation characteristics and highlights areas of concern. A color variation is used to depict the deformation, with blue areas denoting the least amount of displacement and red areas showing the most deformation. Figure 8(a) shows the structure's deformation behavior for AISI 1020 material. Figure 8(b) shows the structure's deformation behavior for AISI 4130 material. Figure 8(c) shows the structure's deformation behavior for AISI 4140 material. Figure 8(d) shows the structure's deformation behavior for aluminum 6061 material. Comparing the deformation behavior of all four materials, it is found that aluminum 6061 exhibits substantially more deformation, suggesting the inefficiency of the structure. To achieve mechanical strength and credibility, these models are critical for pinpointing regions of maximum deformation. The total deformation findings for the various materials employed in this study are presented in Table 5. A comparison with results from previous research, given in Table 1, is provided to demonstrate the efficacy of the suggested design. The current design's AISI 1020 material shows around 44% lower deformation than previous chassis versions. Similarly, as compared to values provided for suspension components, AISI 4130 and AISI 4140 demonstrate a deformation performance increase of more than 50%. Compared to previous chassis designs, the aluminum 6061 employed in the current study exhibits a remarkable reduction of around 90% less deformation. The structural benefits of the four different selected materials are well illustrated by these comparisons.

Total deformation comparison for distinct bio-hybrid solar quadricycle frame materials.
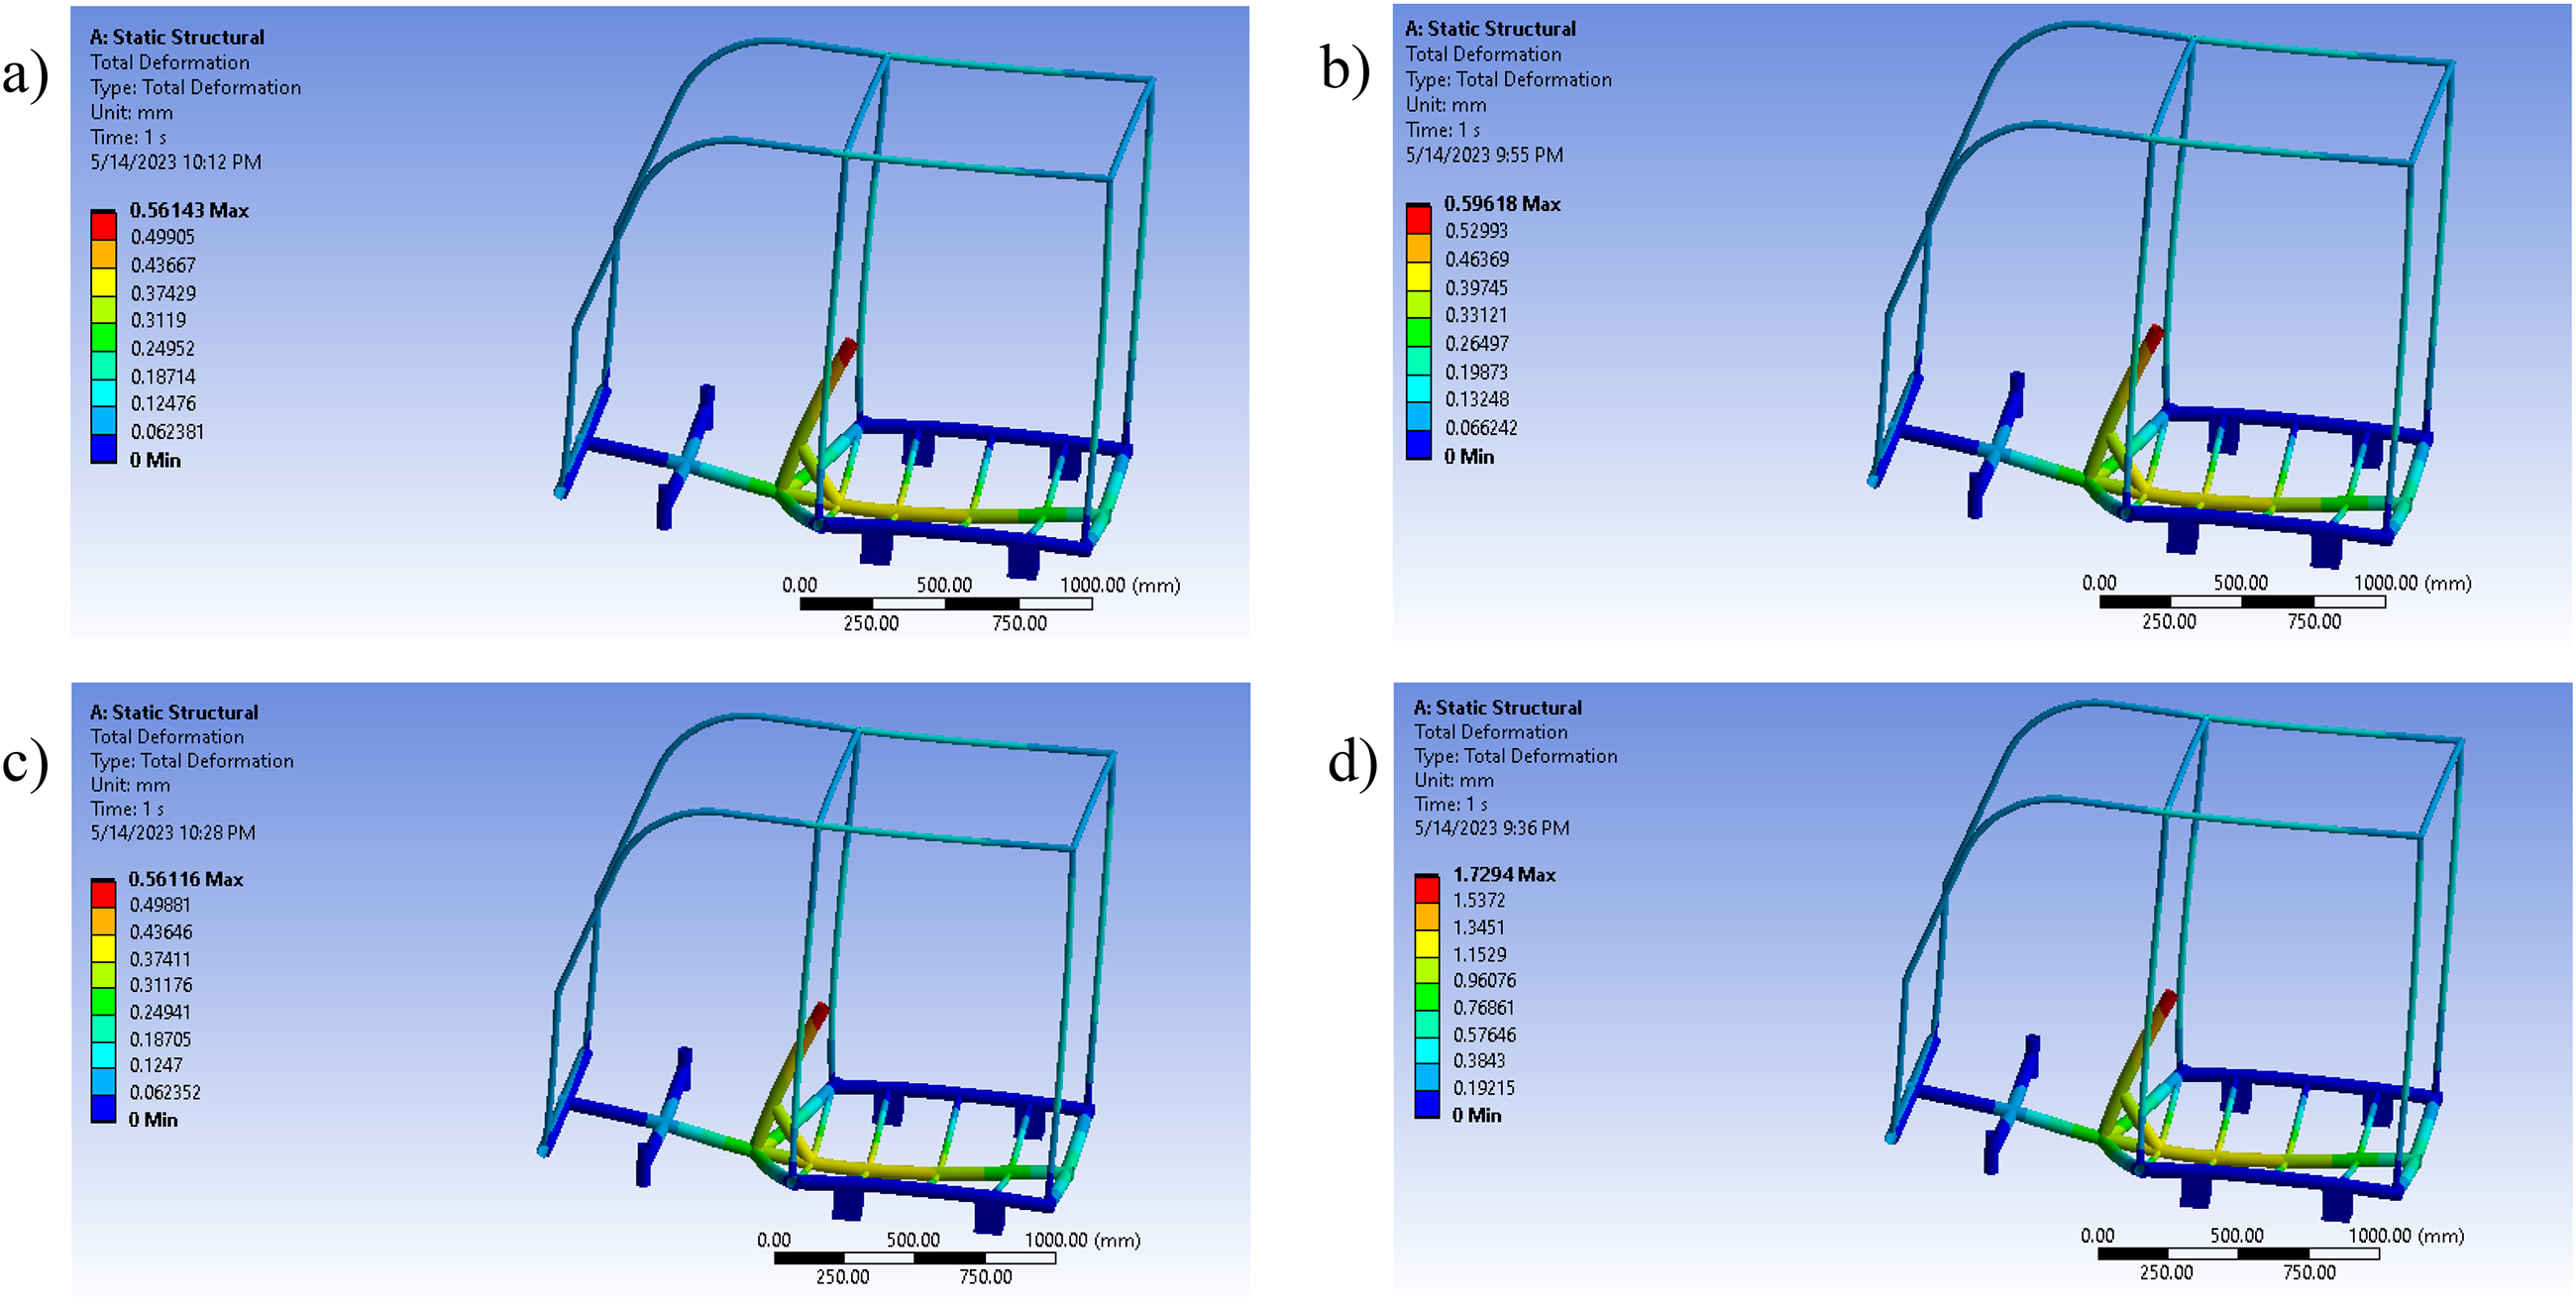
ANSYS total deformation behavior of distinct materials: a) AISI 1020, b) AISI 4130, c) AISI 4140, and d) Aluminum 6061.
Total deformation results for bio-hybrid solar quadricycle frame materials.

The total deformation analysis revealed the extent of deformation experienced by each material under specified loading conditions. The results demonstrated that all materials exhibited some degree of deformation, which is expected under applied loads. However, certain materials showed lower deformation values, indicating higher rigidity and structural integrity. AISI 1020 and AISI 4140 displayed the least total deformation among the tested materials, suggesting their superior load-bearing capabilities. While 6061-T6 shows the highest total deformation.
Equivalent elastic strain analysis
The equivalent elastic strain of each material is evaluated to understand the strain distribution within the frame and identify potential failure points. The current tests aim to determine the material with the lowest equivalent elastic strain, indicating its ability to withstand higher stresses without significant deformation.
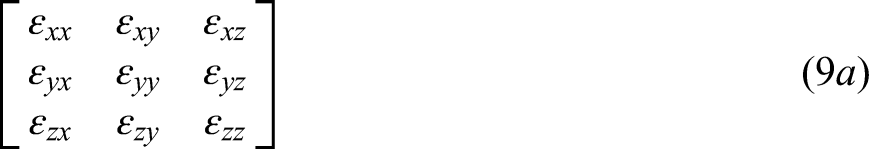
Table 6 shows the equivalent elastic strain values for all tested materials. The comparative graphical representation in Figure 9 explains the variability in equivalent elastic strain among the materials used in the bio-hybrid solar quadricycle frame. The material AISI 4140 normalized exhibits the lowest equivalent elastic strain value of 0.00073098 mm/mm, signifying its capacity to endure elevated stresses without undergoing substantial deformation. The graphical representation shows that the regions with high strain levels suggest possible areas of structural failure. The analysis results offer valuable insights into the strain distribution patterns among the materials. The equivalent strain is given by equation (9).

Equivalent elastic strain comparison for bio-hybrid solar quadricycle frame materials.
Equivalent elastic strain results for bio-hybrid solar quadricycle frame materials.

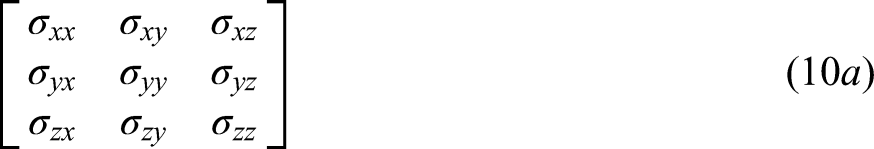
In the FEA framework, the strain tensor (equation (9a)) represents the full 3D strain components at a material point, including normal strains εxx, εyy, εzz and shear strains εxy, εyz, εzx, εzx, εzy, and εxz. By using these components in equation (9), the equivalent stress can be calculated. This scalar quantity effectively combines the normal and shear strain components into a single measure, facilitating assessment of overall deformation intensity under complex loading conditions. The equivalent elastic strain analysis provides insights into the strain distribution within the materials. It highlights areas with higher strain levels, indicating potential failure points. Aluminum 6061-T6 exhibits the lowest equivalent elastic strain values of 0.0022207 mm/mm, while AISI 1020 and AISI 4130 exhibit 0.00073132 and 0.00078151 mm/mm. The increased strain in aluminum 6061-T6 results from its substantially decreased mechanical properties, which enhances its elasticity based on the same stress environments. This tendency is correlated with rigidity and yield ability. The greater yield strength and improved microstructure from normalization, which enhances stress dispersing and prevents localized yielding, are responsible for AISI 4140's minimum strain across. The lower strength grades of AISI 1020 and AISI 4130 are correlated with somewhat greater strain, highlighting the importance of alloy structure and hot working in maximizing strain protection. These results demonstrate that the highest strain-resistant material, AISI 4140 normalized, is essential for preserving its structural strength in situations with elevated stress. The material's excellent strain resistance can be attributed to its high strength-to-weight ratio and inherent stiffness. Figure 10 depicts the corresponding elastic strain in the structure made of four distinct materials based on the color scheme. The red color indicates maximum elastic strain, and the blue color indicates minimum elastic strain. Figure 10 graphically demonstrates elastic strains and highlights any areas of concern. Figure 10(a) shows the structure's elastic strain behavior for AISI 1020 material. Figure 10(b) shows the structure's elastic strain behavior for AISI 4130 material. Figure 10(c) shows the structure's elastic strain behavior for AISI 4140 material. Figure 10(d) shows the structure's elastic strain behavior for aluminum 6061 material. Aluminum 6061 displays a notably different strain distribution than steel alloys (AISI 1020, AISI 4130, and AISI 4140). The three materials named AISI 1020, AISI 4130, and AISI 4140 approximately exhibit identical strain behavior. This comparison highlights how material characteristics affect the structural response to the same loading scenarios.
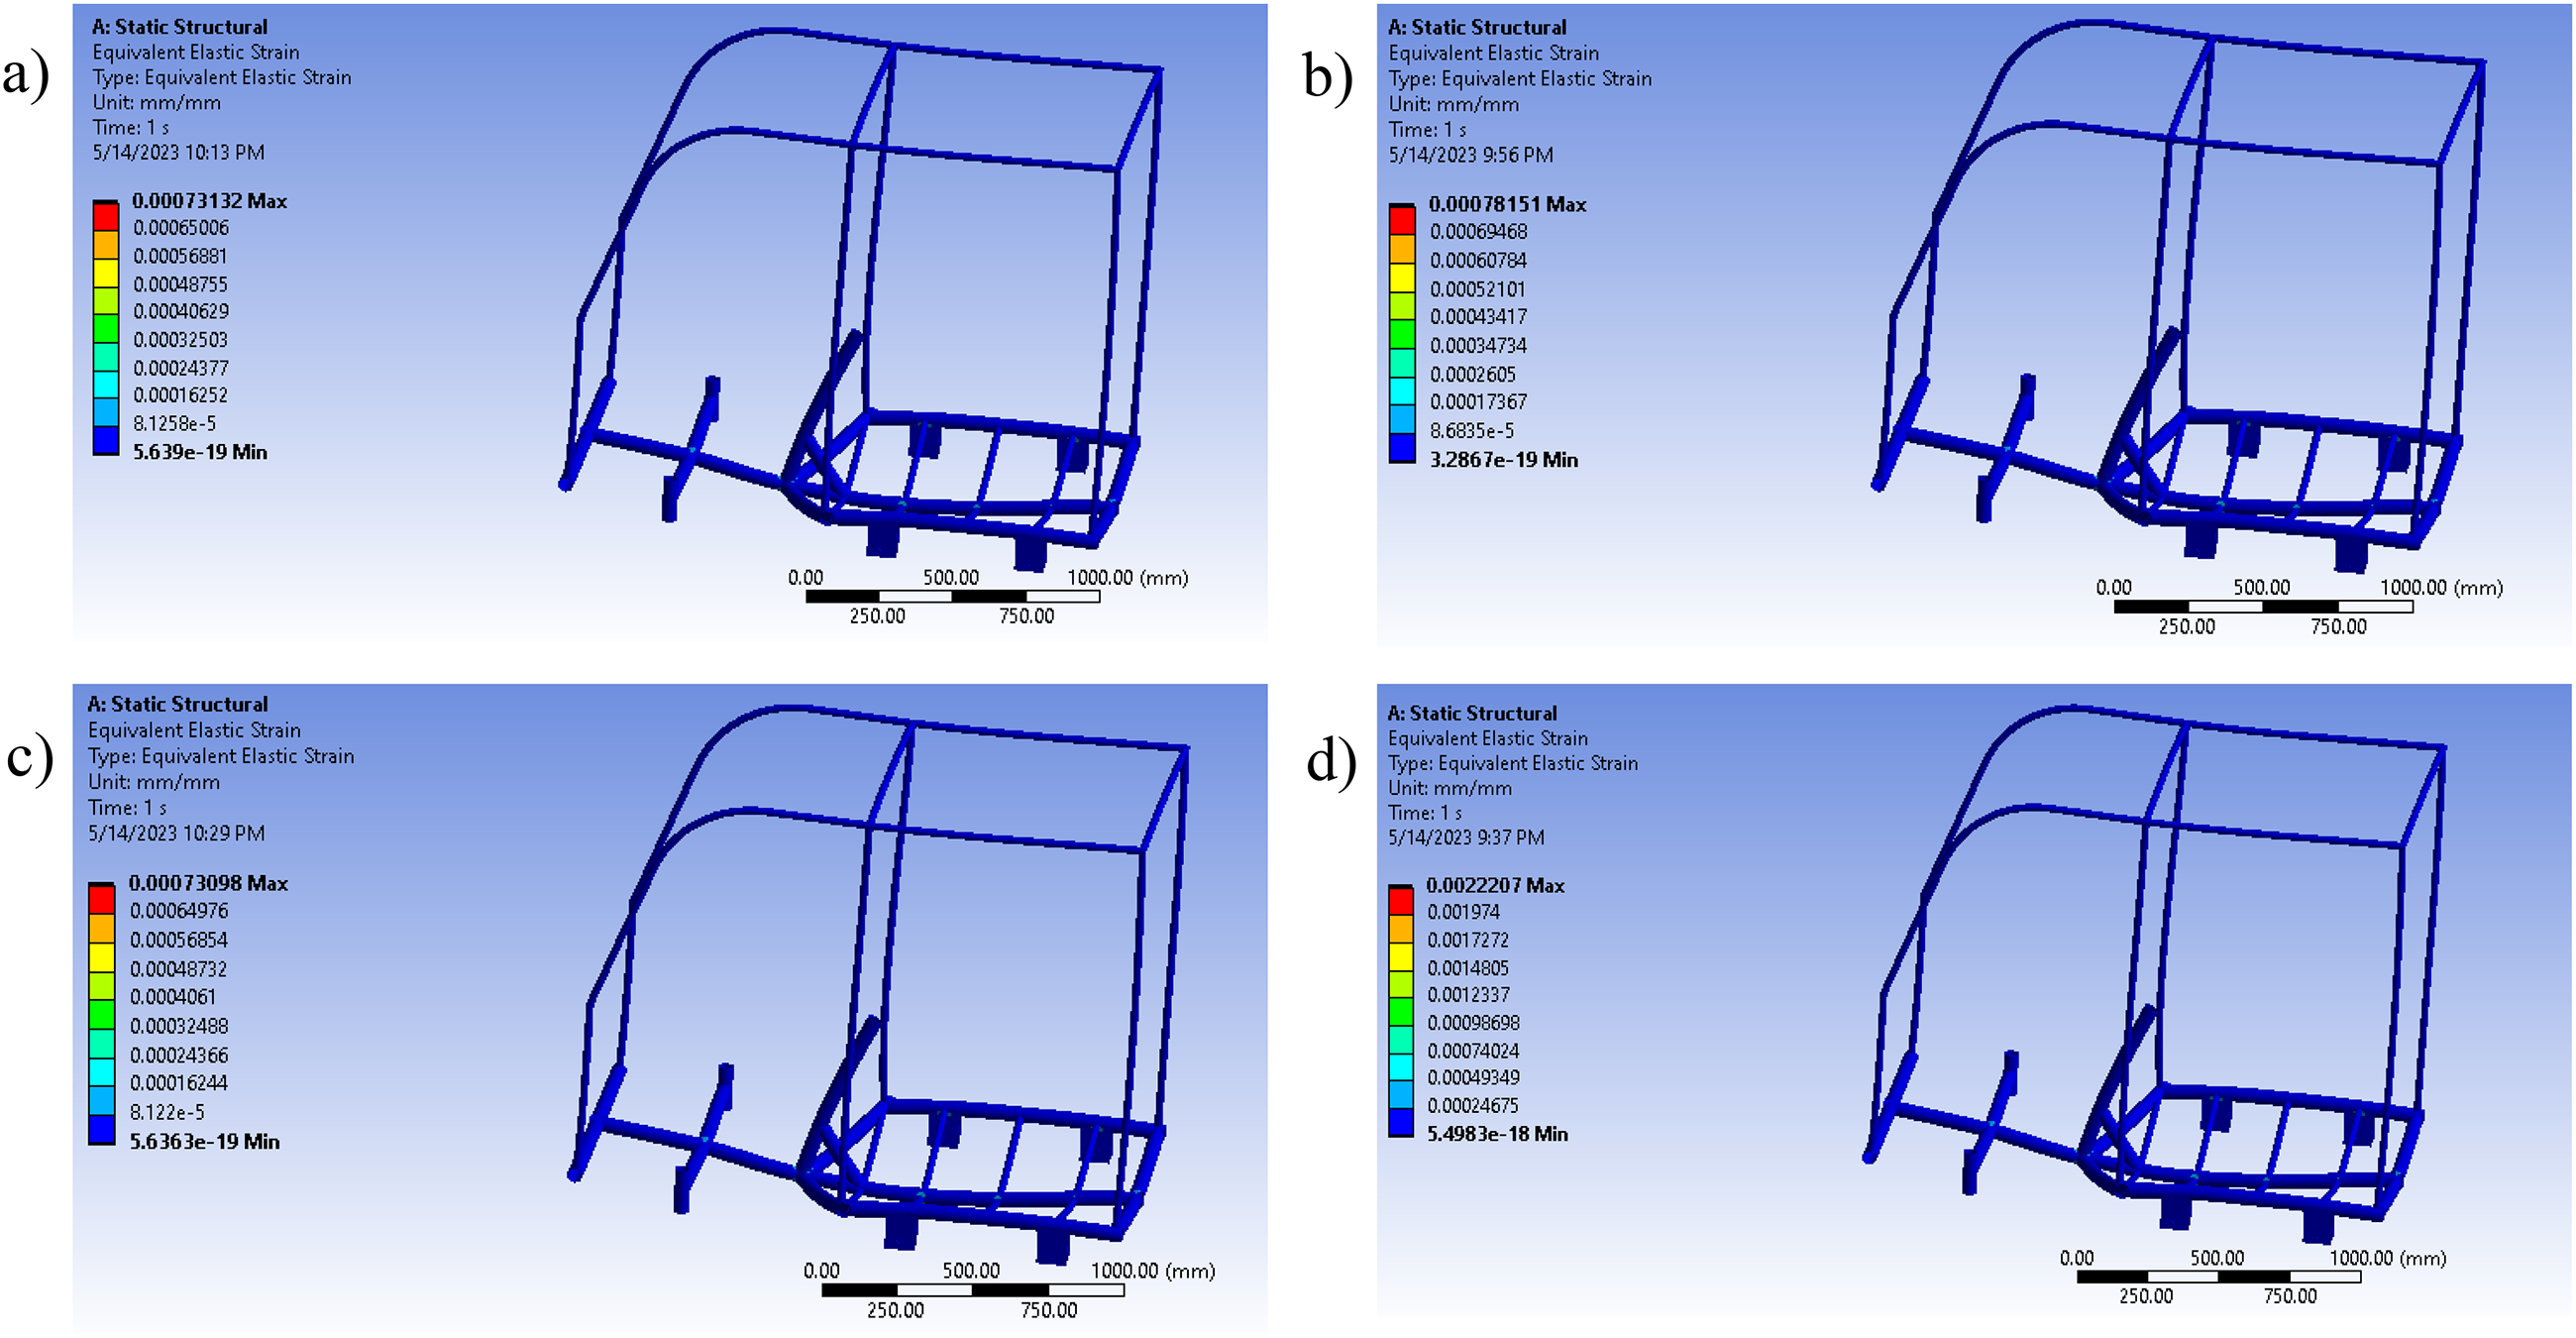
ANSYS equivalent elastic strain behavior of distinct materials: a) AISI 1020, b) AISI 4130, c) AISI 4140, and d) aluminium 6061.
Equivalent (von Mises) stress analysis
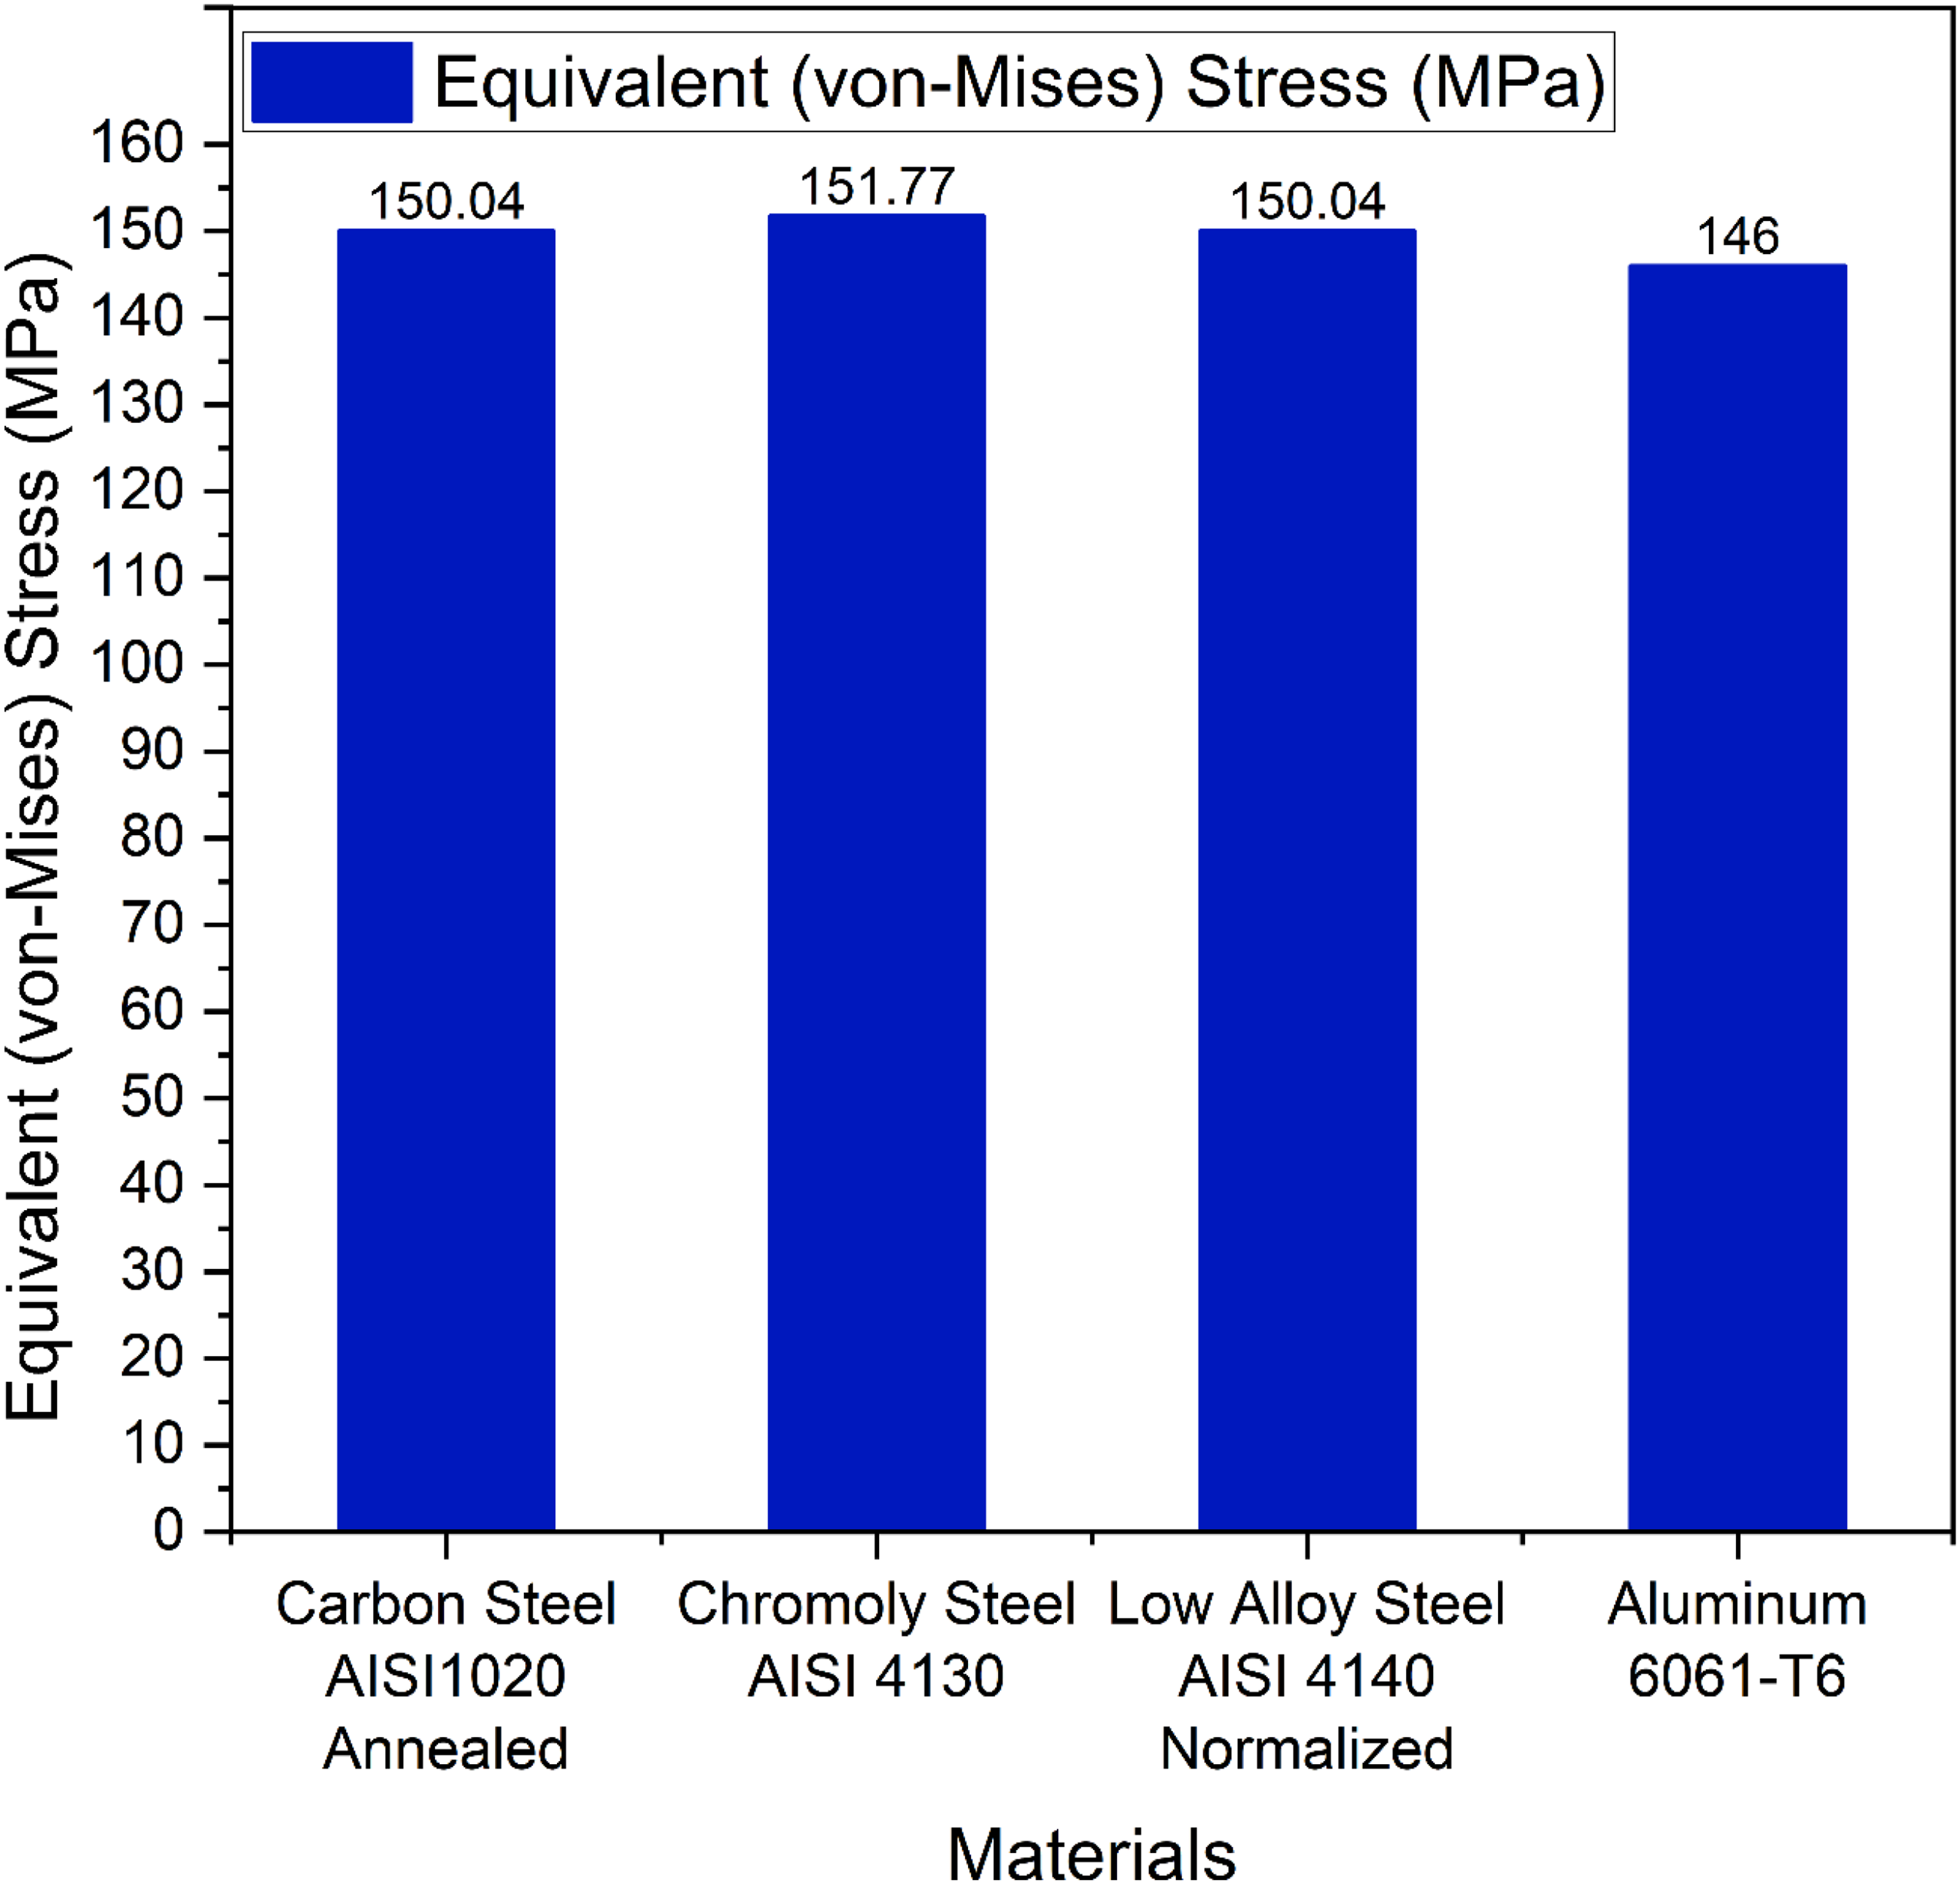
Each material's equivalent (von Mises) stress is assessed to evaluate its stress distribution and identify potential failure areas, as shown in equation (4). This test aimed to find the material that shows the lowest equivalent stress, representing efficient stress distribution and minimizing the risk of failure. Table 7 presents the equivalent stress values for each material. Figure 11 represents the equivalent stress distribution among the different materials. It can be observed that aluminum 6061-T6 exhibited the lowest equivalent stress of 146 MPa, indicating efficient stress distribution and reduced stress concentrations. The maximum stress of 151.77 MPa is depicted by AISI 4130. While the AISI 1020 and AISI 1040 show the same value of 150.04 MPa. This behavior is due to the difference in mechanical properties like ductility and Young's modulus. In FEA, the stress tensor (equation (10a)) represents the complete 3D stress state at a point within a material. The von Mises stress (equation (10)) is then computed from this tensor to assess the material's yield condition under complex loading. It provides a single scalar value used to visualize and evaluate failure zones in FEA results. Where, σv is equivalent stress and σxx, σxy, σxz, σyx, σyy, σyz, σzx, σzy, σzz all nine are stress components acting along the respective direction x, y, or z or in combination as shown in equation (10a).
Equivalent stress comparison for bio-hybrid solar quadricycle frame materials.
Equivalent stress results for bio-hybrid solar quadricycle frame materials.
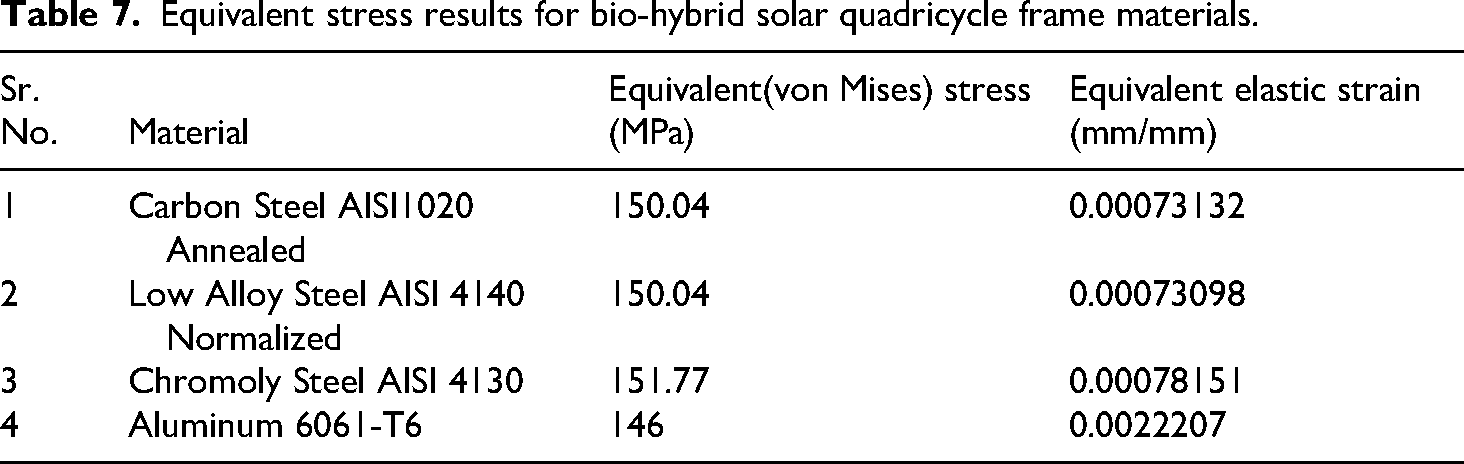
Table 7 mentions the equivalent stress in the selected materials, and these values can be compared with previously investigated materials as indicated in Table 1. Although the stress for AISI 1020 is slightly higher than recorded for earlier chassis designs, it remains clearly under the safe working range. The better distribution of loads in the current model is indicated by AISI 4140's result in optimized performance, which shows around 24% lower stresses as compared to previous studies. The adaptability for various components is demonstrated by the fact that the stress value for AISI 4130 lies between the literature for frame and suspension use. However, 6061-T6 shows higher values, but these values are within the safe limits.
Figure 12 illustrates stress distribution patterns for each of the materials under examination based on the different color scheme. The red color shows the maximum von Mises stress, and the blue color shows the least von Mises stress. The material with the lowest equivalent stress has a more even stress distribution, thereby reducing the risk of structural failure and ensuring overall integrity. The findings will be subjected to further in-depth discussion and analysis in the subsequent sections to determine the optimal material for the biohybrid solar quadricycle frame design. The equivalent stress analysis evaluated stress distribution within the materials forming the frame. The results revealed variations in stress concentration among the different materials. Figure 12(a) shows the structure's equivalent (von Mises) stress for AISI 1020 material. Figure 12(b) shows the structure's equivalent (von Mises) stress for AISI 4130 material. Figure 12(c) shows the structure's equivalent (von Mises) stress for AISI 4140 material. Figure 12(d) shows the structure's equivalent (von Mises) stress for aluminum 6061 material. The results of all the materials are quite similar, but the yield strength of aluminum is much lower than the steel variants (AISI 1020, AISI 4130, and AISI 4140). The result suggests that the strength of the material and its capacity to effectively distribute stress, thereby minimizing the likelihood of structural failure when subjected to applied loads.

ANSYS equivalent (vVon-mMises) stress behavior of distinct materials: a) AISI 1020, b) AISI 4130, c) AISI 4140, and d) Aluminum 6061.
Safety factor analysis
The safety factor assessment for each material is conducted to measure its structural strength and capacity to endure applied loads without failure. In Table 8, the safety factor values for each material are presented. AISI 4140 shows the highest safety factor of 4.3469, while the lowest safety factor of 1.8904 is shown by 6061-T6. Both AISI 4130 and AISI 1020 show a safety factor of 3.0309 and 1.9561, respectively. Figure 13 compares safety factor values among different bio-hybrid solar quadricycle frame materials. All the materials exhibit the highest safety factors, signifying a substantial safety margin and reliability when subjected to applied loads. Figure 14 shows the distribution of safety factors for each material using color variation. The blue color shows the highest safety factor, and the red color shows the lowest safety factor. The findings from this analysis offer valuable insights into the structural resilience of the bio-hybrid solar quadricycle frame materials. The material with the highest safety factor ensures that the frame can withstand applied loads without failing by offering a greater safety margin and reliability. The safety factor analysis measures the load-bearing capability and safety margins intrinsic to each material. A higher safety factor indicates a higher degree of safety against potential failure. Figure 14(a) shows the structure's safety factor for AISI 1020 material. Figure 14(b) shows the structure's safety factor for AISI 4130 material. Figure 14(c) shows the structure's safety factor for AISI 4140 material. Figure 14(d) shows the structure's safety factor for aluminum 6061 material. The results establish that low alloy steel AISI 4140 in its normalized state achieves the highest safety factor, signifying its exceptional strength and capacity to withstand substantial loads. AISI 4130 shows a lower factor of safety as compared to AISI 4140. While the AISI 1020 and aluminum 6160 have the least safety factor.

Safety factor comparison for bio-hybrid solar quadricycle frame materials.

ANSYS model for safety factor of four distinct materials: a) AISI 1020, b) AISI 4130, c) AISI 4140, and d) Aluminum 6061.
Safety factor results for bio-hybrid solar quadricycle frame materials.

Modal analysis
The modal analysis evaluates a structure's natural frequencies and corresponding mode shapes.
Equation of motion (equation 11) is given as follows:
where M denotes the mass (resists acceleration), C the damping (dissipates energy), K the stiffness (restores equilibrium), and f the external force.
For modal analysis, the equation 12 is as follows:
where M denotes the mass (resists acceleration), and K the stiffness (restores equilibrium).
Table 9 shows the natural frequencies obtained from the modal analysis for each material. Figure 15 graphically represents the variation in natural frequencies among the materials. It can be observed that Carbon Steel 1020 Annealed and AISI 4140 exhibited the highest natural frequency, indicating their ability to resist vibrations and potential resonance issues. Figure 16 shows the modal response of the upper frame, revealing a natural frequency of 9.14 Hz with total deformation ranging from 0 mm (min) to 12.39 mm (max). The color gradient highlights regions of peak displacement, indicating potential stress concentration zones. This analysis identifies resonance risks, emphasizing the need to avoid operational frequencies near 9.14 Hz to prevent structural amplification and fatigue. These insights guide design improvements to enhance stiffness in high-deformation areas, and Figure 17 shows the modal behavior of the chassis frame, exhibiting a natural frequency of 60.66 Hz with total deformation spanning 0 mm (min) to 57.62 mm (max). The color gradient maps show deformation zones, likely stress-critical regions under dynamic excitation. This highlights resonance vulnerabilities at 60.66 Hz, necessitating operational frequency avoidance to mitigate excessive vibration and structural fatigue. The findings underscore the importance of targeted reinforcement or damping strategies to reduce deformation in critical areas of the lower frame.
Natural frequency comparison for bio-hybrid solar quadricycle frame materials.
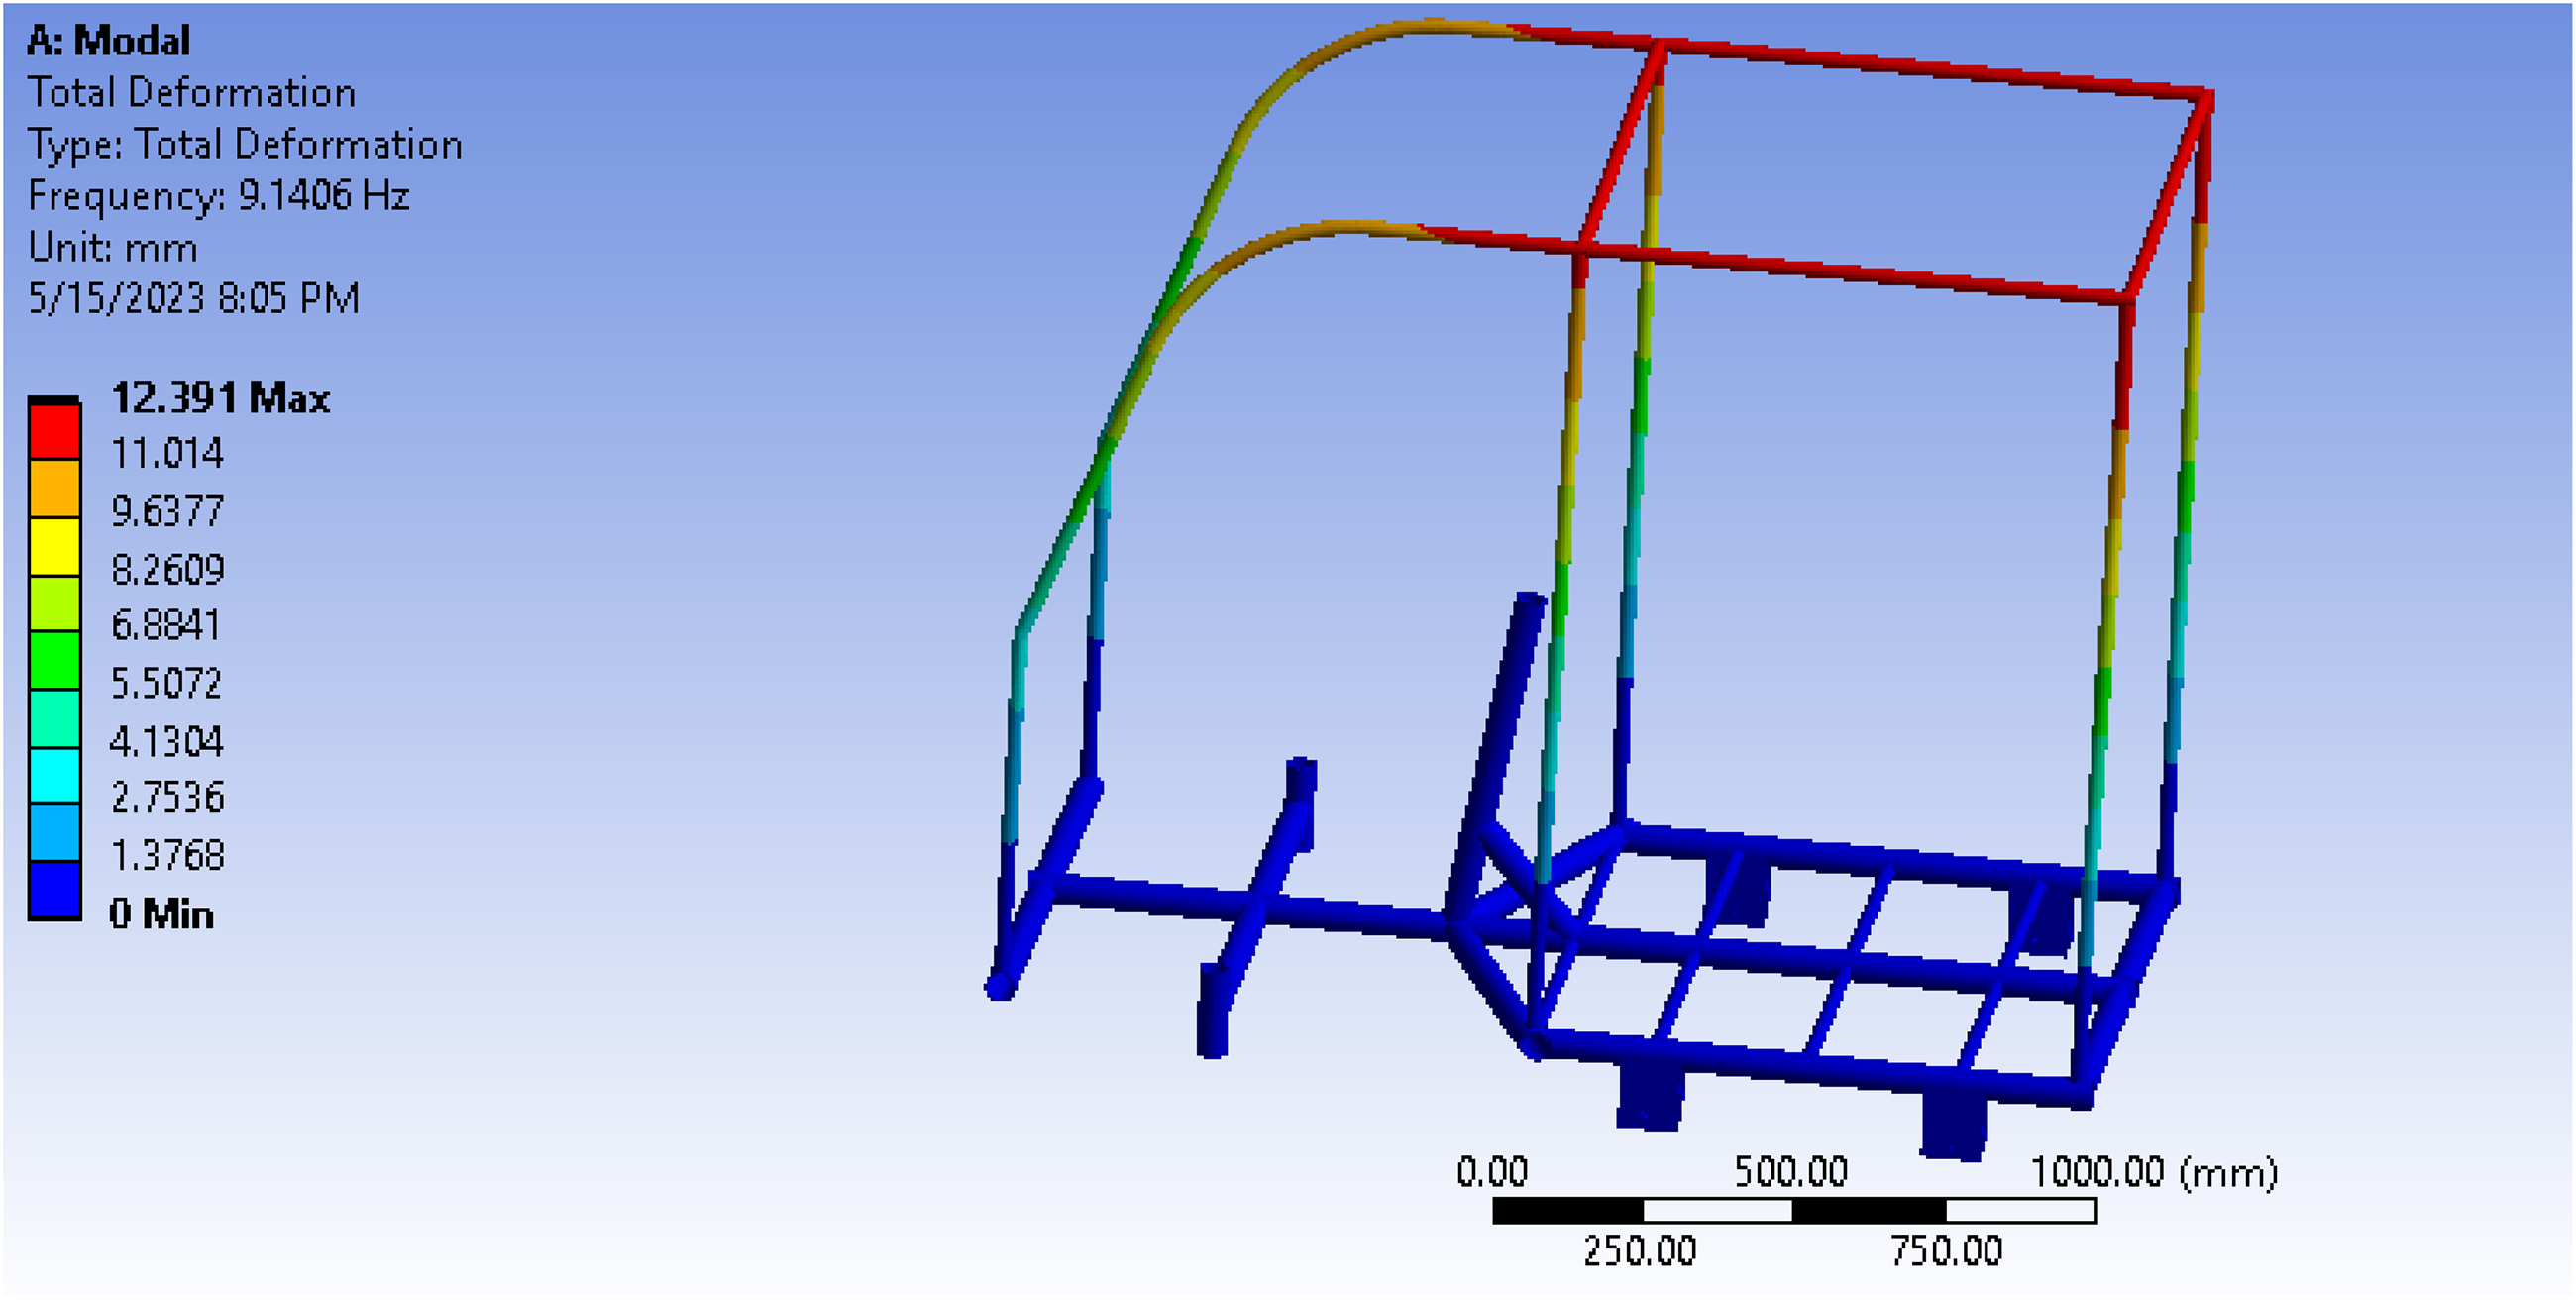
Mode image for upper frame shape.

Mode shape image for lower frame.
Modal analysis results for bio-hybrid solar quadricycle frame materials.

Battery and motor selection
Initially, the motor and battery requirements are calculated using equations (13) and (14). The required motor power comes out to be 1.6 kW, and the required battery is 3 kW. Accounting for safety factors into consideration, a 1.8 kW DC motor with a 3kW lithium-ion battery for an 80 km range:
where Prequired is the required power, FTotal the total force, ϑ the velocity, and η the efficiency.
where Erequired = required energy and Prequired = required power.
To assess if a selected battery and motor are appropriate for the vehicle, a Simulink model was developed using the NEDC. It consists of urban and extra-urban driving conditions, making it suitable for evaluating energy consumption and performance. Significant vehicle characteristics, including the energy consumed by the vehicle, speed of the vehicle, and motor power, were incorporated in the model. Three core variables were used to analyze the results: speed comparison with reference speed, SOC, and distance traveled. Figure 18 shows the distance covered by the vehicle for the complete NEDC cycle, that is, 1180 seconds. The vehicle covers the distance of 3.3 km in 1180 seconds.

The graphical representation of distance covered by the vehicle with respect to time.
One significant indicator of motor performance is the vehicle's capacity to reach the desired speed. The reference speed from the NEDC and the actual speed have been compared in Figure 19. The findings demonstrate that the motor effectively provides the required power and torque since the actual speed closely matches the reference speed. The minor control delays might be the cause of small variations but can be fixed with additional adjustments. It means that the battery size of 3 kW and the motor size of 1.8 kW are sufficient to run the vehicle.

The graphical representation of actual speed comparison with the reference speed of the vehicle.
The battery's performance can be accessed more comprehensively by monitoring the SOC over time. The battery charge drops as the vehicle progresses through the cycle, as can be observed in Figure 20. The findings show that the battery can complete the NEDC without experiencing a catastrophic discharge. The battery size is appropriate for the energy requirements of the cycle, as confirmed by the discharge pattern. For the complete NEDC, the discharge of the battery is <1.5% of the total charge.

Trends of battery's state of charge with respect to time.
Comparing the battery voltage, vehicle speed, and SOC provides a better understanding of how the battery functions under various driving circumstances. The SOC graph indicates that the battery is being used gradually over time as it steadily drops from 100% to 98.7%. The vehicle's acceleration and deceleration are indicated by the speed graph, which displays variations between 0 and almost 34 km/h. These variations in speed have a direct impact on the battery voltage, as illustrated in Figure 21, which varies from 59 to 56 V.

Trends of battery's voltage with respect to time.
The simulation results verify that the selected motors with 1.8 and 3 kW battery efficiently meet the NEDC cycle requirements. The motor precisely tracks the reference speed with little variation. The distribution of three charging power sources: solar, pedal, and plug-in over a 24-hour period according to Sydney is portrayed in Figure 22. The solar radiation data is collected and averaged from the weather website. 44 Following normal sunshine hours, solar electricity (blue line) is accessible from around 7:00 to 18:00 and peaks at noon, attaining an upper limit of 1 kW. To mimic small periods of human-powered input from pedal pedal-powered generator, the pedal power (orange line), which stands in for periodic 125 W sessions, happens at regular intervals throughout the day. When both renewable sources of power are not available, plug-in electricity (green line), which has a steady 1 kW output, only turns on at night (00:00–06:30 and 19:00–24:00) or when the vehicle is not in operation. With this hybrid charging approach, grid independence or less grid power usage can be achieved, giving priority to human and green energy resources during the day, even sustaining an adequate charge throughout the cycle, confirming credibility.
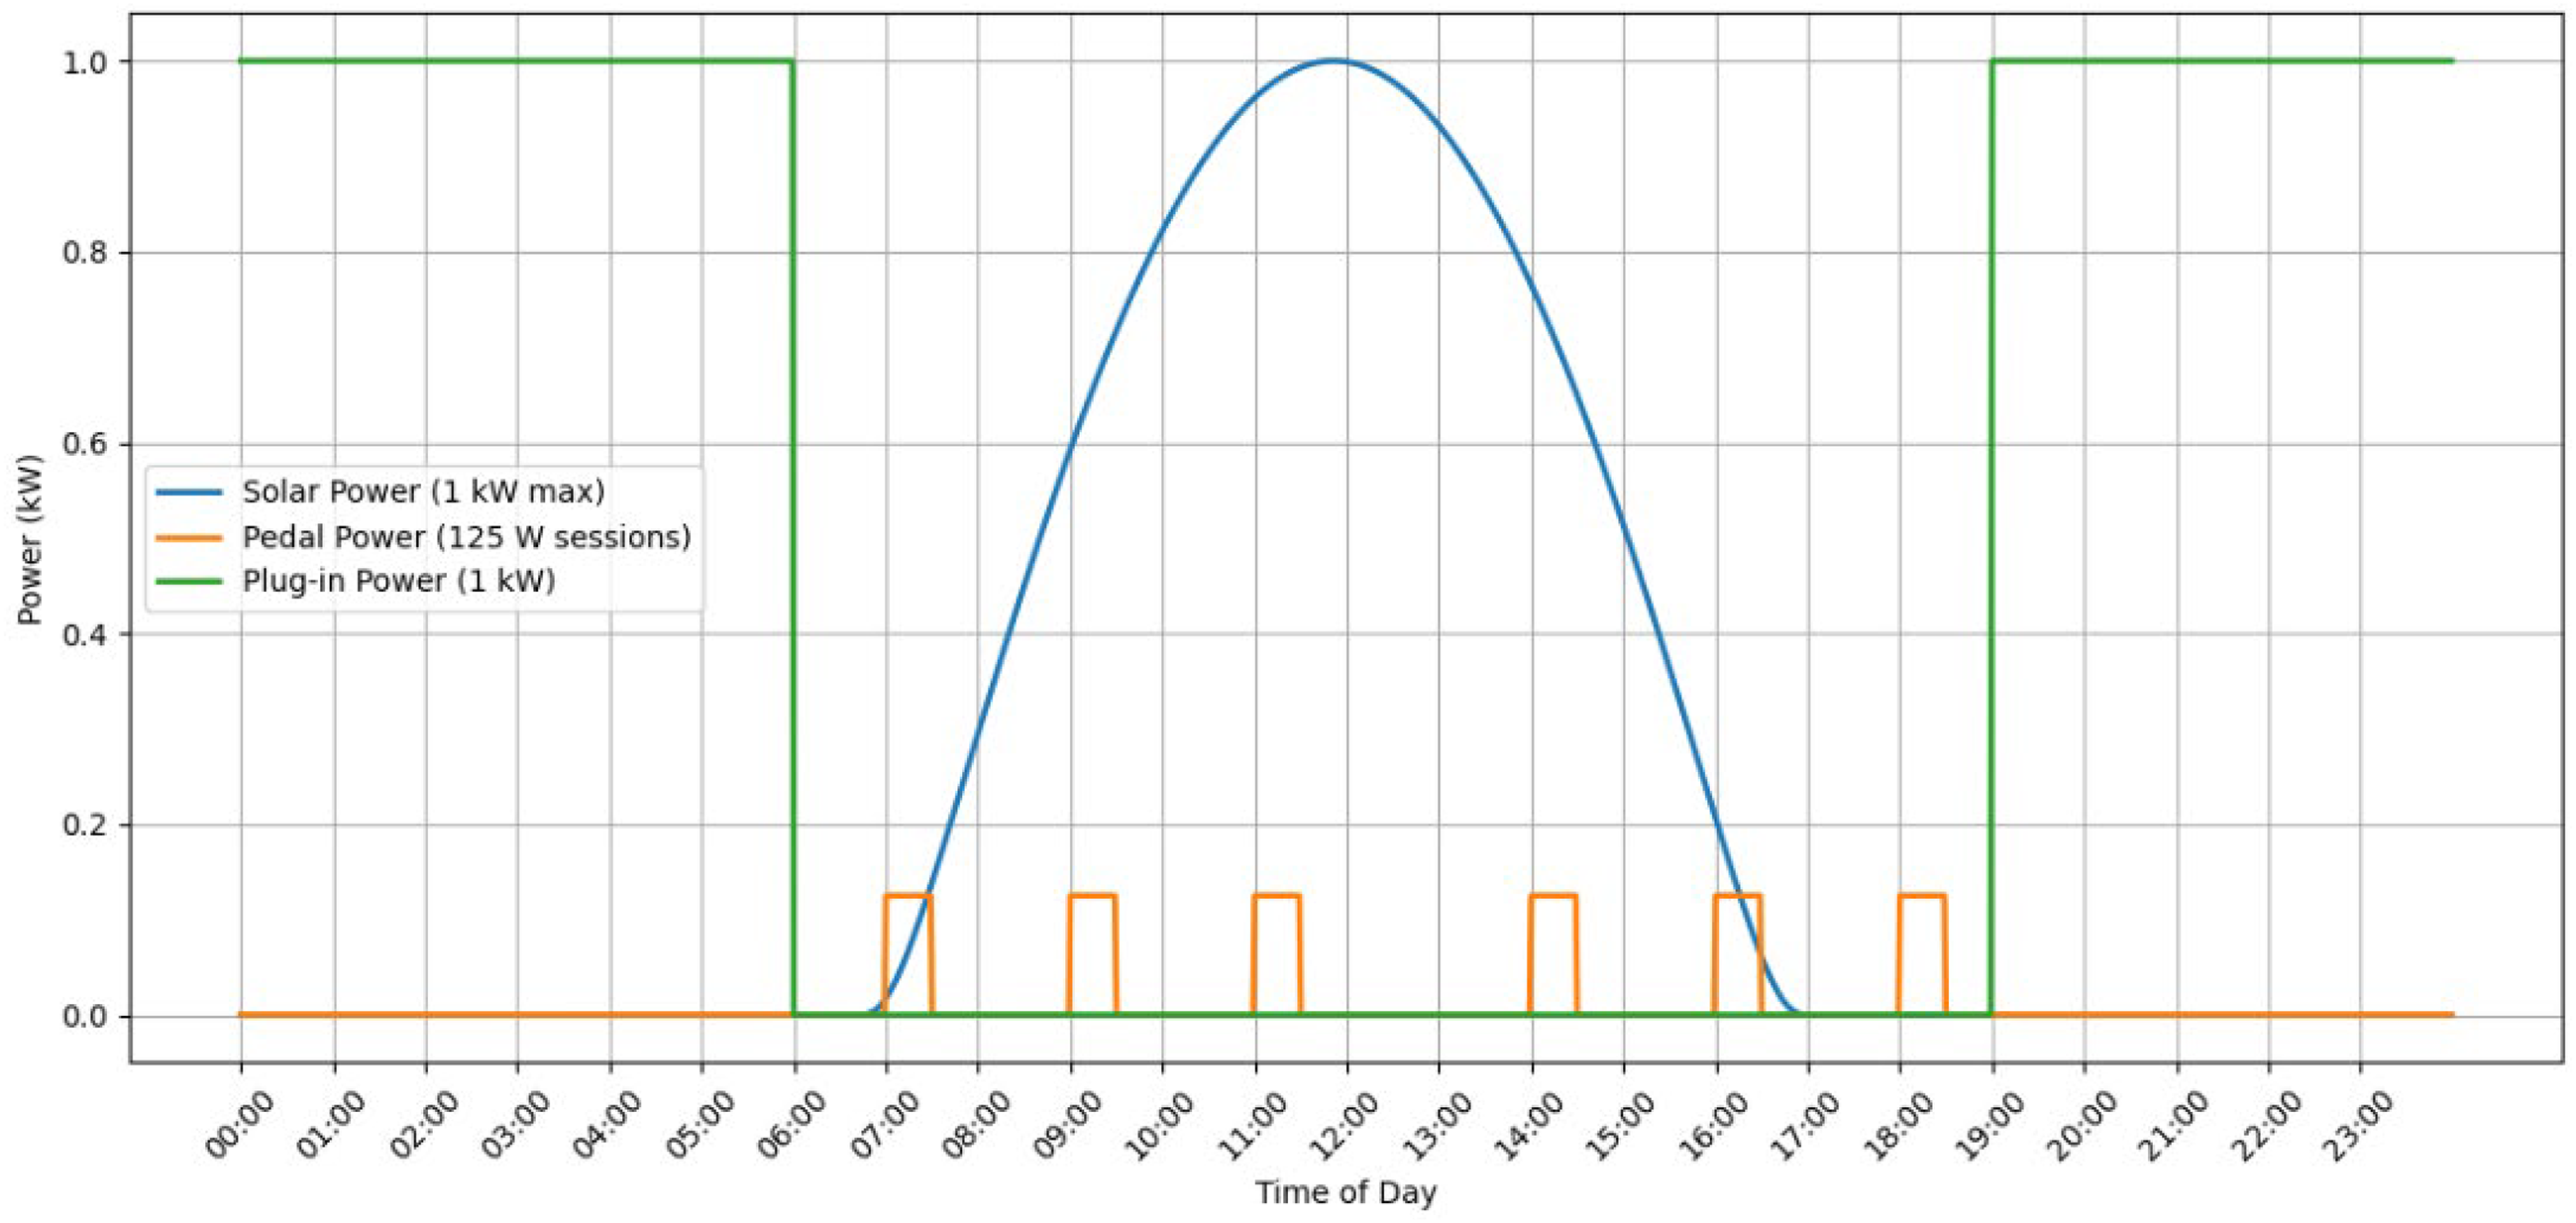
Graphical representation of charging power sources availability over 24 hours.
The total energy consumed by the vehicle will be calculated using equation (15), and the energy efficiency is calculated using equation (16), which are as follows:

The system's energy efficiency measures how well electricity that has been stored is transformed into mechanical motion during a normal driving cycle. The vehicle traveled 3.3 km in 1180 seconds during the Simulink simulation that was run using the NEDC. The battery SOC steadily dropped from 100% to 98.7% throughout this time, suggesting moderate to low energy consumption. So, the energy consumed comes out to be 39 Wh. This corresponds to an estimated 11.82 Wh per km of energy consumption, which is in line with lightweight urban electric vehicles and indicates effective energy use. The ability of the selected motor-battery design to maintain energy usage throughout changing operating situations is demonstrated by the continuous reduction in SOC without sudden voltage dips or quick depletion.
A 3 kW battery capacity and a projected motor of 1.6 kW build up the foundation for the system's development. A motor of 1.8 kW and a 3 kW battery were chosen to provide a safety element and ensure dependability under real-world circumstances, such as changing terrain, cargo, and acceleration needs. The configuration not only satisfies the estimated power requirements but also offers sufficient buffering to accommodate peak current consumption and additional requirements. A realistic driving range of about 80 km is attainable, depending on the observed energy requirement profile, and the Simulink findings confirm that the battery can maintain consistent energy. This demonstrates how well the selected battery and motor maintain reliability and stability while extending the driving range. Power losses in the vehicle can arise due to several factors, including friction between mechanical parts, electrical resistance, and power losses in electronics. These losses are illustrated in simulation results where voltage drops occur due to higher load conditions or driving habits like sudden starts. This behavior can reduce the effective range of the vehicle, suggesting the need for future optimization. Efficiency might be increased by additional optimizations, such as adding regenerative braking. The validation of system performance under various circumstances would also be aided by real-world testing.
Conclusions
The current study thoroughly investigated the structural and operational performance of four distinct materials for the frame of a bio-hybrid solar quadricycle customized for the sustainable urban delivery system in Sydney, Australia. The primary objective is to select the ideal material while considering operational performance, market availability, and cost-effectiveness. The major findings are as follows:
The total deformation results highlight that Carbon Steel AISI-1020 and Chromoly Steel AISI 4130 exhibit low deformation values. Carbon Steel AISI-1020 recorded a total deformation of 0.56143 mm, while AISI 4140 registered a slightly lower value of 0.56116 mm. The findings suggest that such materials have the potential to withstand significant structural stresses and maintain their shape integrity under operational loads. The evaluation of the equivalent elastic strain determines that Carbon Steel AISI-1020 and Low Alloy Steel AISI 4140 exhibited minimal values, which indicate their suitability for bearing heavy loads with minimal deformation. The equivalent (von Mises) stress results show that Carbon Steel AISI-1020 and Low Alloy Steel AISI 4140 share similar stress resistance, measuring 150.04 MPa. This is a crucial factor in ensuring the safety and longevity of the quadricycle during operation. Meanwhile, the AISI 4130 and 6061-T6 stress 151.70 and 146 MPa. The safety factor highlights that Low Alloy Steel AISI 4140 and AISI 4130 stand out with the highest safety factor of 4.3469 and 3.0309. The higher safety factor underscores its robustness and reliability in withstanding operational stresses. Modal analysis results provide insights into the vibration behavior of different materials, with lower values indicating greater stability. Aluminum 6061-T6 exhibited lower modal values, ranging between 60.655 and 136.7. This suggests its potential to sustain vibrations and enhance rider comfort. The simulation-based analysis highlights AISI-1020, AISI 4140, and AISI 4130 as strong material candidates, each with specific advantages. Although the AISI 4140 shows the most effective results, it possesses higher hardness and lower ductility and is therefore less appropriate for parts that undergo exposure to cyclic loads, making it unsuitable for the whole chassis. Moreover, AISI 4140 is very difficult to weld. AISI 4130 offers the best overall balance of strength, fatigue resistance, and ease of manufacturing. AISI 4130 also provides a superior blend of resilience, resistance to fatigue, and weldability. Aluminum 6061-T6, despite being lightweight and stable under vibrations, deforms too much under stress for use in key structural parts. The Simulink analysis shows a promising electric vehicle design with optimized parameters like motor power and battery capacity. The NEDC drive cycle simulation shows favorable energy consumption, battery state of charge, range, and speed results. The battery's efficient energy storage and motor controller operation improves overall performance.
The current study contributes to developing an effective and sustainable transport system for Sydney, Australia, including cargo and delivery services. The investigation into bio-hybrid solar quadricycle frame materials unveils promising avenues for future development. These prospects encompass the exploration of advanced materials to achieve weight reduction, structural strength optimization, hybridization of materials, energy control and management system, refinement of electric charging systems and development of intelligent charge controllers, utilization of solar energy sources, enhancement of rider comfort through ergonomic design considerations, integration of smart technologies for real-time data acquisition, execution of lifecycle assessments to promote sustainability, and the examination of user acceptance for broader adoption. These directions can optimize quadricycle design, elevate performance standards, and align it with sustainability goals.
Notation
Arithmetic-based Grey Wolf Optimization
American Iron and Steel Institute
Computer-aided design
European Union
Electric vehicles
Finite element analysis
Factor of Safety
Greenhouse gases
Honey Badger Optimization
Hybrid energy storage system
Indian drive cycle
Iterative learning control
Lithium ion battery
Maximum power point tracking
New European Driving Cycle
Perturb & observe
Particle swarm optimization
Photovoltaic
Rear wheel drive
Society of Automotive Engineer
Solar electric vehicle
State of charge
Footnotes
Acknowledgements
We would like to thank University of Technology Sydney, Australia for providing us the research opportunity in the field of advancing sustainable mobility through optimized ubran delivery system designs. We gratefully acknowledge the support and resources provided by the University of Technology Sydney, which made this research possible.
Authors contribution
Funding
The authors received no financial support for the research, authorship, and/or publication of this article.
Declaration of conflicting interests
The authors declared no potential conflicts of interest with respect to the research, authorship, and/or publication of this article.