
Abstract
Background
Obesity- characterized by excessive adiposity- is associated with various comorbidities, including metabolic, cardiovascular, and liver diseases. Chronic low-grade inflammation is a key factor in complications associated with obesity. This study aimed to investigate the associations between systemic inflammatory indices (SIIs) and weight-adjusted waist index (WWI), alongside metabolic and liver function biomarkers in overweight and obese individuals.
Method
This cross-sectional study included 350 overweight or obese participants (body mass index (BMI) ≥ 25 kg/m2) from both genders. Weight, height, waist, hip, and neck circumferences were measured and BMI, WWI, and the ratios of waist to height (WHtR) and hip (WHR) were estimated. Fasting blood samples were taken to assess SII as well as metabolic parameters.
Results
In this study, males had significantly higher weight and WC compared to females, whereas the mean level of WWI (p < 0001) and WHtR (p = 0.01) in women were greater than in men. A significant correlation was observed between WWI and SII (r = 0.113, p = 0.039), and other associations were observed between HbA1c levels (r = −0.117, p = 0.033) and monocyte-to-lymphocyte ratio (MLR), and fasting blood sugar (FBS) and neutrophil-to-lymphocyte ratio NLR (r = 0.110, p = 0.041). SII quartiles showed significant differences in aspartate aminotransferase AST levels (p < 0.001), and significant variations in WHtR and MLR were also observed (r = −0.112, p = 0.043).
Conclusion
Our results reveal strong and significant correlations between systemic inflammatory markers, including SII, MLR, and PLR, and important obesity measures, as well as metabolic and liver function parameters in individuals with obesity.
Keywords
Introduction
Obesity is a long-term condition marked by an excess accumulation of body fat. 1 Globally, in 2022, approximately 2.5 billion adults aged 18 and older were classified as overweight, with 890 million of these individuals meeting the criteria for obesity. 2 Obesity has emerged as an escalating global public health issue, with evidence indicating that it can reduce life expectancy and contribute to a significant disease burden. It has been widely acknowledged as a significant risk factor for various chronic diseases over time, including cardiovascular disorders, respiratory diseases, liver diseases, diabetes, cancer, and sleep disorders.3–5
Low-grade, chronic inflammation is a hallmark characteristic of obesity. 6 Excess adipose tissue, particularly visceral fat, induces homeostatic stress, predominantly within adipocytes, due to positive energy balance and a hyper-anabolic state.7,8 In response, these cells secrete various mediators, including adipokines and pro-inflammatory cytokines such as leptin, tumor necrosis factor-alpha (TNF-α), and interleukin-6 (IL-6). This initiates an adaptive inflammatory response that facilitates adipocyte expansion and tissue remodeling, while simultaneously limiting further energy storage. 9 The persistent release of these inflammatory mediators contributes to a chronic low-grade inflammatory state, which is crucial in the onset of obesity-related complications. Recent studies have introduced novel inflammatory indicators, including the Systemic Inflammatory Index (SII).10,11 The SII is calculated using three blood cell subtypes: neutrophils, lymphocytes, and platelets. Additionally, it incorporates the neutrophil-to-lymphocyte ratio (NLR), platelet-to-lymphocyte ratio (PLR), and monocyte-to-lymphocyte ratio (MLR). These indices together represent the equilibrium between inflammatory activity and the immune system's reaction to inflammation.12,13
Previous studies exploring the link between obesity and inflammatory cytokines have largely relied on body mass index (BMI), waist-to-hip ratio (WHR), or waist circumference (WC) as indicators of adiposity.14–16 However, these indices are unable to differentiate between fat mass and muscle mass.17,18 It has been proposed that assessing body composition and fat distribution provides a more accurate evaluation of unfavorable metabolic profiles. 19 The weight-adjusted waist index (WWI), a novel measure of obesity, standardizes WC in relation to weight, preserving the advantages of WC while minimizing its correlation with BMI. 20 The WWI was first introduced by Park et al., 21 defined as waist circumference divided by the square root of body weight. This index aims to provide a more accurate assessment of health risks within the population. 22 Growing evidence supports the diagnostic and prognostic value of WWI, with numerous studies indicating its positive association with chronic diseases such as diabetes, coronary heart disease (CHD), and liver-related disorders.23–25
Recent research highlights the superiority of WWI over traditional obesity indices like BMI and WC in predicting health outcomes. 25 Li et al. demonstrated that elevated WWI is significantly linked to increased all-cause mortality, with high area under the curve (AUC) values reinforcing its potential as a reliable prognostic marker for assessing long-term survival risks, particularly in patients with cardiovascular disease (CVD). 26 Similarly, Liu et al. found that WWI is associated with a heightened risk of CHD. 23 Shen et al. reported a significant positive linear relationship between WWI and hepatic steatosis, highlighting a strong association between increased WWI and the prevalence of liver fat accumulation. 27
Moreover, multiple studies have identified strong correlations between high WWI and various health conditions, including cancers, respiratory diseases, periodontitis, sleep apnea, and cognitive impairments.28–30 These findings underscore the clinical utility of WWI as a valuable marker for disease prediction and risk assessment. WWI distinguishes between fat and muscle mass while also addressing issues of visceral fat area that are independent of overall body weight.22,31 To the best of our knowledge, there is limited research examining the correlations between SIIs and WWI in overweight and obese patients. Therefore, this cross-sectional study aims to explore the associations between SIIs, WWI, and metabolic indices as well as liver function biomarkers in overweight and obese individuals.
Materials and method
Study design
This cross-sectional study involved 350 overweight or obese participants (BMI ≥ 25 kg/m²), both male and female, aged 18 to 60 years. Participants were excluded from the study if they were gestating, lactating, in menopause, active athletes, had undergone bariatric surgery, had chronic diseases or malignant tumors, or were taking oral contraceptives, hypertension-lowering, anti-hyperlipidemic, anti-diabetic medications, or nutritional supplements within three months prior to the study. This study was conducted in accordance with the ethical principles outlined in the Declaration of Helsinki. 32 Ethical approval was obtained from the Ethics Committee of Tabriz University of Medical Sciences (IR.TBZMED.1403.371). Prior to their inclusion in the study, informed written consent was obtained from all eligible participants after fully explaining the study's aims and plans. All data were anonymized and handled confidentially to ensure participant privacy. All patient details were fully de-identified to maintain confidentiality and comply with ethical guidelines. No personally identifiable information was collected or reported in this study.
Sample size
The sample size was calculated to be 350 based on obesity prevalence in Iran (35.09%) reported by Abiri et al. 33 This estimation was made with a 95% confidence level and a 5% margin of error, utilizing G-power software (version 3.1.9.7) for the analysis (Heinrich-Heine-Universität Düsseldorf, Düsseldorf, Germany).
Data collection
A trained nutritionist recorded personal information including demographic and socioeconomic status along with other factors such as taking medicine, medical history, smoking, and alcohol consumption through face-to-face interviews. Anthropometric parameters of the participants, including WC, height, and weight. BMI was calculated by dividing weight in kg with the square of height in m. Weight and height were measured while they were fasting, using a calibrated stadiometer (Seca, Hamburg, Germany). Participants were measured while wearing light clothing and without shoes, with weight recorded to the nearest 100 grams and height measured to the nearest 5 millimeters. WC was measured at the midpoint between the lower edge of the rib cage and the iliac crest, with a precision of 1 mm. Hip circumference (HC) was measured around the widest part of the buttocks, with measurements recorded to the nearest 1 mm. NC, measured by placing a flexible tape horizontally around the widest part of the neck just below the larynx, perpendicular to the long axis of the neck, with measurements recorded to the nearest 1 mm. The WHtR was determined by dividing WC by the individual's height, while the WHR was calculated by dividing WC by HC. WWI was calculated as follows
31

SII biomarkers were calcified into quartiles to investigate the association with anthropometric, metabolic, and liver function data,
Laboratory assay
Following 12–14 h of overnight fasting, 10 ml blood samples were collected from each participant. The samples were then divided into two tubes: 5 ml was placed in vacuum-sealed gel separator tubes, and the remaining 5 ml of whole blood was stored in EDTA-containing vacutainer tubes (Vacutainer K2E). The gel separator tubes were centrifuged and obtained sera were stored at −80 °C. Sera samples were analyzed to assess metabolic parameters, including triglycerides (TG) fasting blood sugar (FBS), total cholesterol (TC), and HDL-C, performed by commercial kits (Pars-Azmoon Co., Tehran, Iran) and an auto-analyzer (Hitachi 902, Tokyo, Japan). Serum ferritin levels were determined through electrochemiluminescence immunoassay. Aspartate aminotransferase (AST) and Alanine aminotransferase (ALT) levels were measured based on the International Federation of Clinical Chemistry protocols. 34 A calibrated Coulter CBCH1 automated counter was employed to assess the total count of white blood cells, as well as neutrophil, lymphocyte, monocyte, and platelet counts per mm³ in whole blood samples. Subsequently, SIIs, including the MLR, NLR, and PLR were calculated.
Statistical analysis
Statistical analysis was performed using the Statistical Package for the Social Sciences (SPSS, version 20, Chicago, IL, USA). The Kolmogorov–Smirnov test was employed to evaluate the normality of continuous variables. To compare symmetric and asymmetric continuous variables between two groups, independent-samples t-test (two-tailed) and Mann–Whitney U-test were applied, respectively. To compare continuous variables among more than two groups the analysis of variance (ANOVA) was used. Furthermore, relationships between continuous variables were assessed through Pearson and Spearman correlation coefficients for symmetric and asymmetric data, respectively. Statistical significance was set at p < 0.05.
Results
The flowchart that depicts the study process is shown in Figure 1. Table 1 summarizes the demographic and clinical characteristics of the study participants by gender. Males exhibited significantly greater weight, height, and WC (p < 0.001) than females, whereas mean WWI (p < 0.001) and WHtR (p = 0.01) in women were greater than in men. Liver function markers such as ALT (p < 0.001) and AST (p < 0.001) were more pronounced in males. Conversely, females showed higher platelet counts (p < 0.001), PLR (p = 0.003), and SII (p = 0.017).

Flow diagram of study process.
Participants’ characteristics by gender.
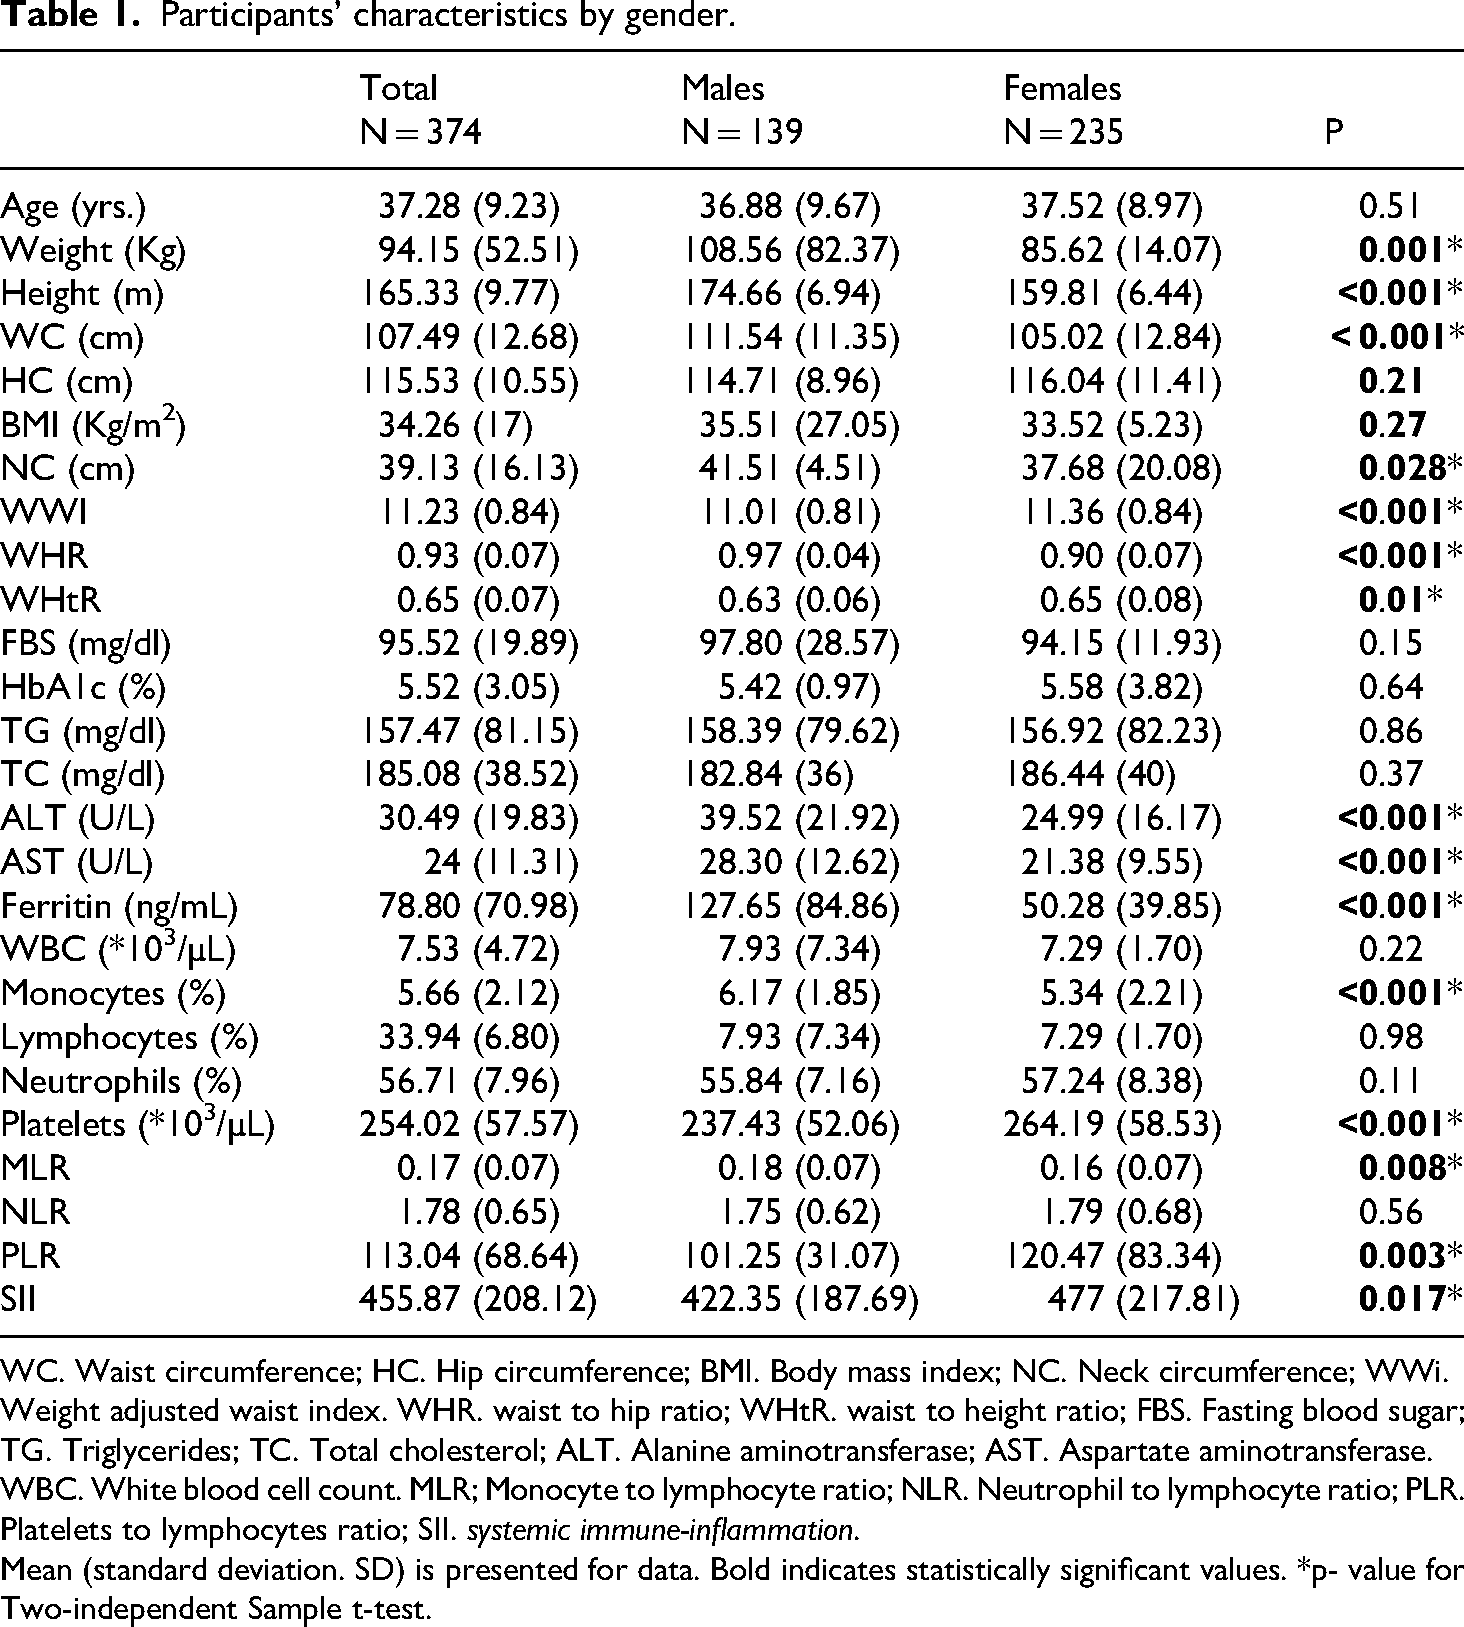
WC. Waist circumference; HC. Hip circumference; BMI. Body mass index; NC. Neck circumference; WWi. Weight adjusted waist index. WHR. waist to hip ratio; WHtR. waist to height ratio; FBS. Fasting blood sugar; TG. Triglycerides; TC. Total cholesterol; ALT. Alanine aminotransferase; AST. Aspartate aminotransferase. WBC. White blood cell count. MLR; Monocyte to lymphocyte ratio; NLR. Neutrophil to lymphocyte ratio; PLR. Platelets to lymphocytes ratio; SII. systemic immune-inflammation.
Mean (standard deviation. SD) is presented for data. Bold indicates statistically significant values. *p- value for Two-independent Sample t-test.
Relationships between systemic inflammatory markers and obesity indicators, metabolic health, and liver function are shown in Table 2. Among obesity indicators, there were found significant correlations between WWI and SII (r = 0.113, p = 0.039), WHtR and MLR (r = -0.112, p = 0.043), WHR and PLR (r = -0.128, p = 0.020). Moreover, among the metabolic factors, significant relations were also observed in HbA1c levels (r = -0.117, p = 0.033) and MLR, FBS, and NLR (r = 0.110, p = 0.041) and also serum ferritin levels and PLR (r = -0.158, p = 0.005).
Correlations between systemic inflammatory indices and obesity, metabolic and liver function biomarkers.
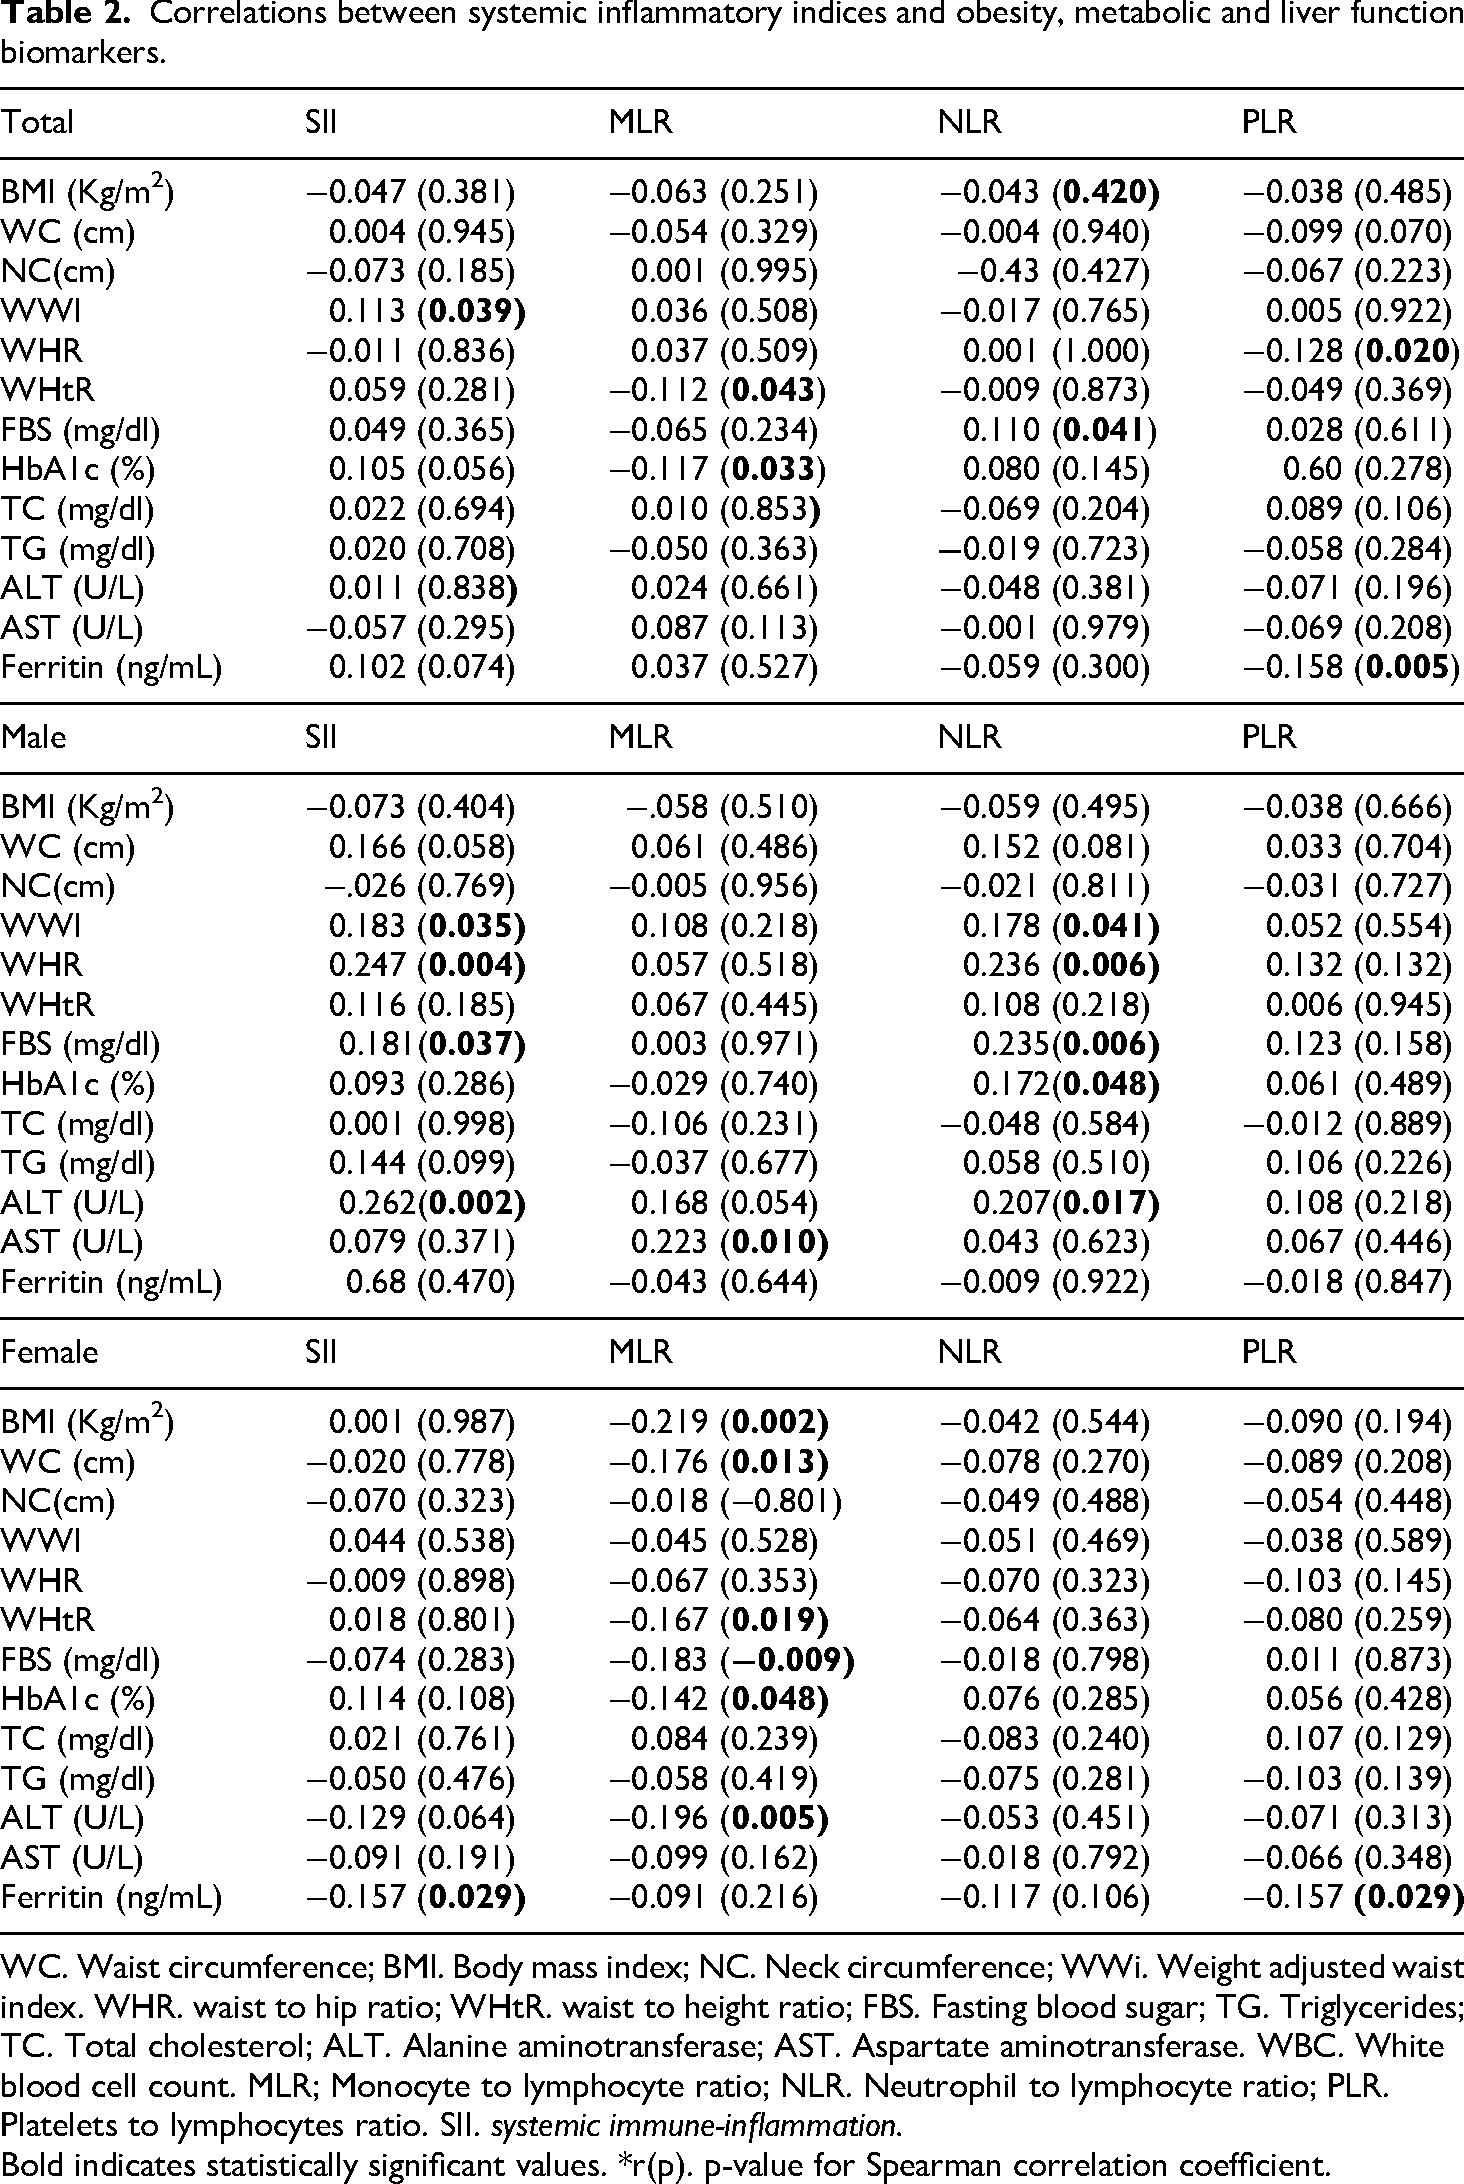
WC. Waist circumference; BMI. Body mass index; NC. Neck circumference; WWi. Weight adjusted waist index. WHR. waist to hip ratio; WHtR. waist to height ratio; FBS. Fasting blood sugar; TG. Triglycerides; TC. Total cholesterol; ALT. Alanine aminotransferase; AST. Aspartate aminotransferase. WBC. White blood cell count. MLR; Monocyte to lymphocyte ratio; NLR. Neutrophil to lymphocyte ratio; PLR. Platelets to lymphocytes ratio. SII. systemic immune-inflammation.
Bold indicates statistically significant values. *r(p). p-value for Spearman correlation coefficient.
In the gender-based analysis of correlations, significant findings were observed. Among males, a positive correlation was found between WWI and SII (r = 0.183, p = 0.035) and WWI and NLR (r = 0.178, p = 0.041). Additionally, significant positive correlations were noted between WHR and SII (r = 0.247, p = 0.004) and WHR and NLR (r = 0.236, p = 0.006). Among metabolic factors, a positive correlation was also observed between FBS and SII (r = 0.181,p = 0.037) and FBS and NLR (r = 0.235,p = 0.006). Furthermore, a significant positive correlation was noted between ALT and SII (r = 0.262,p = 0.002) and ALT and NLR (r = 0.207,p = 0.017). For AST, a significant positive correlation with MLR (r = 0.223, p = 0.010) was observed.
In females, BMI was negatively correlated with MLR (r = -0.219, p = 0.002), WC with MLR (r = -0.176, p = 0.013), and WHtR with MLR (r = -0.167, p = 0.019). FBS was negatively correlated with MLR (r = -0.183, p = 0.009), HbA1c with MLR (r = -0.142, p = 0.048), and ALT with MLR (r = -0.196, p = 0.005). Additionally, ferritin was negatively correlated with both SII (r = -0.157, p = 0.029) and PLR (r = -0.157, p = 0.029).
Table 3 presents the association between SII and MLR with various biomarkers related to obesity, metabolic health, and liver function. Aspartate Aminotransferase (AST) levels showed significant variation across SII quartiles, with the highest levels in the lowest quartile (27.67 U/L) and the lowest in the second quartile (20.18 U/L (p < 0.001). Additionally, WWI displayed a significant difference across SII quartiles, with values ranging from 10.97 to 11.33 (p = 0.021). Furthermore, The results show a significant difference in WHtR values across MLR quartiles, with a p-value of 0.005. Other parameters such as BMI, WC, NC, as well as FBS, HbA1c, TG, TC, and Ferritin, did not show significant variations across either SII or MLR quartiles.
Association of SII and MLR with obesity, metabolic and liver function biomarkers.
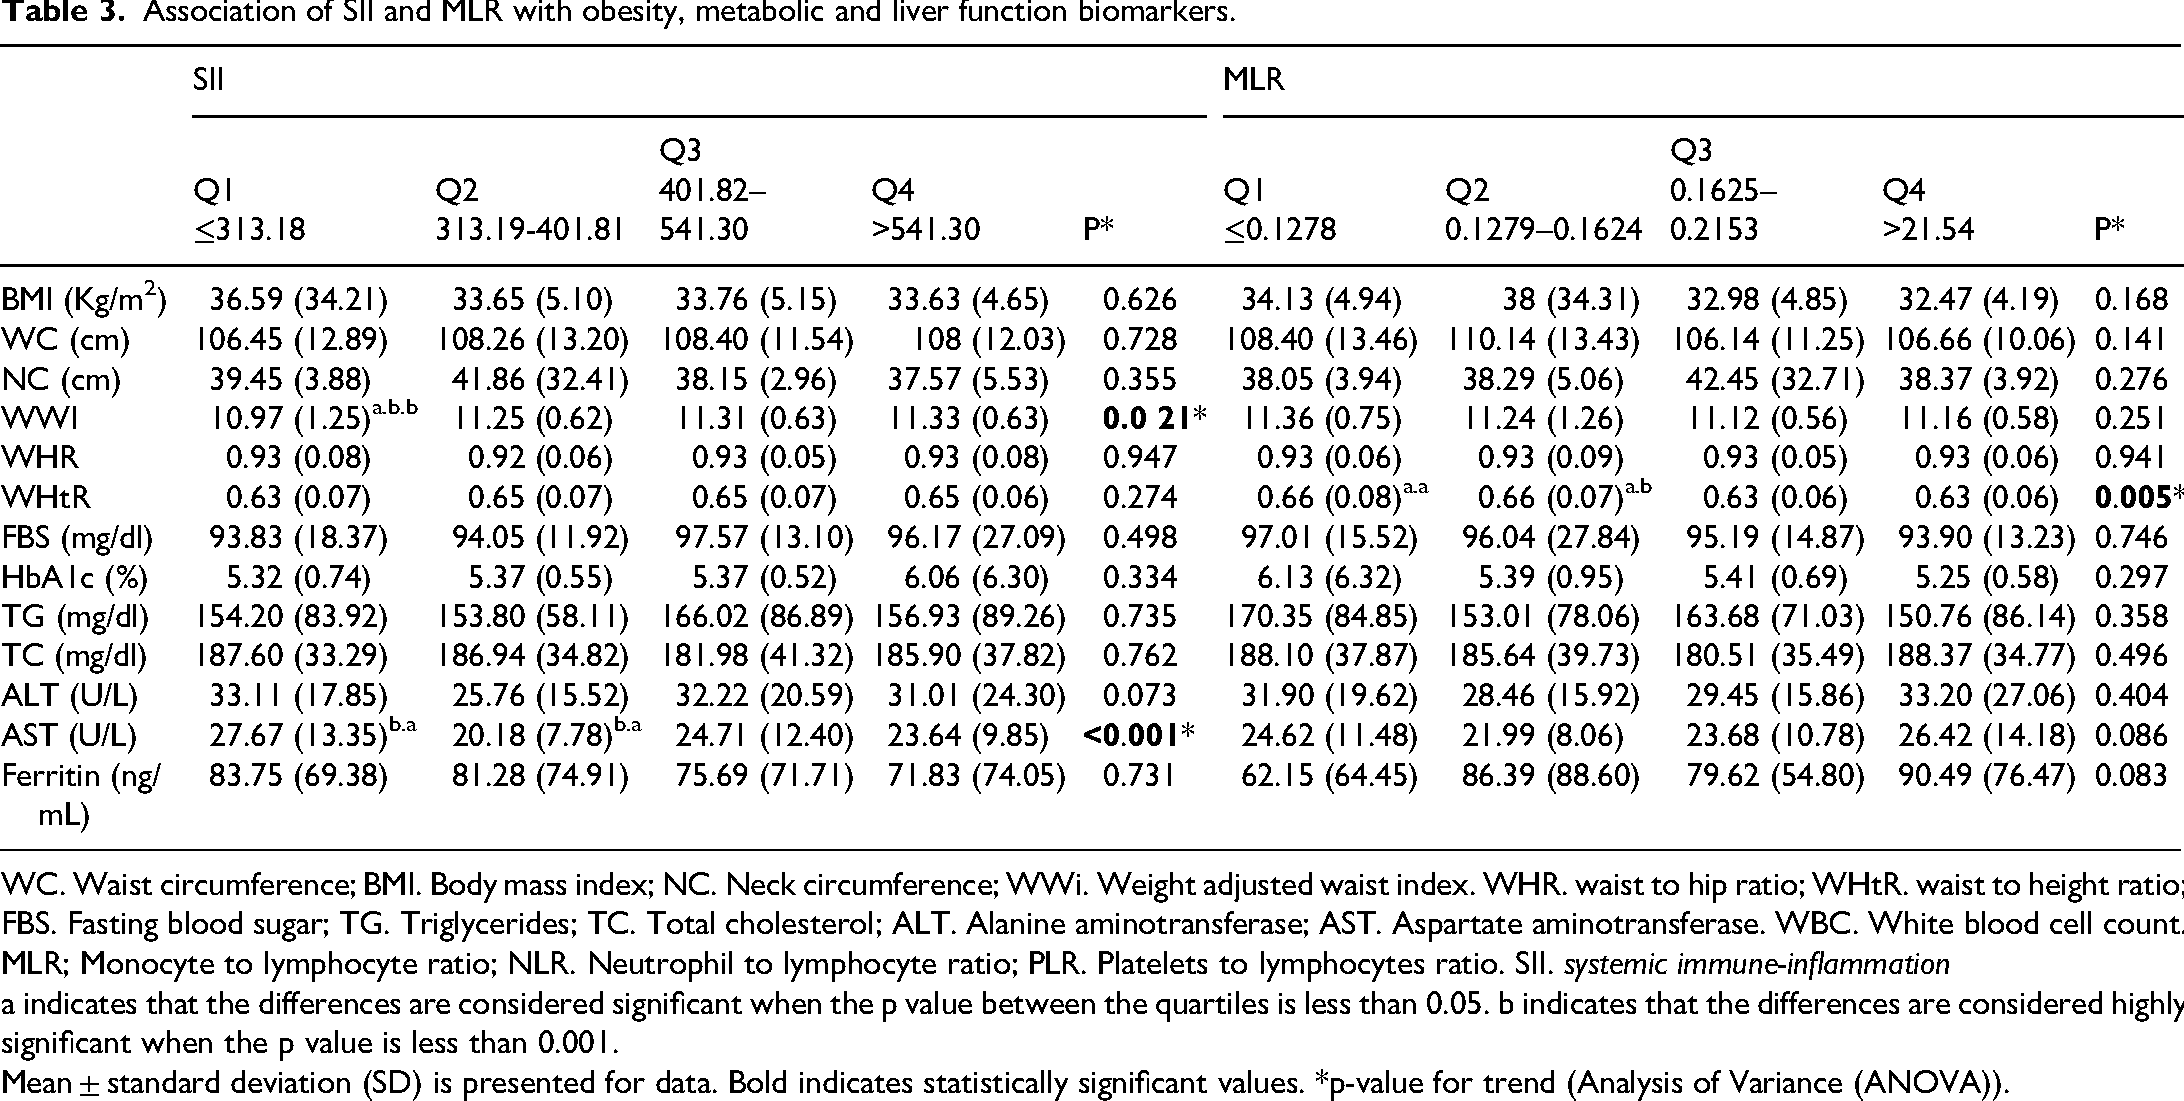
WC. Waist circumference; BMI. Body mass index; NC. Neck circumference; WWi. Weight adjusted waist index. WHR. waist to hip ratio; WHtR. waist to height ratio; FBS. Fasting blood sugar; TG. Triglycerides; TC. Total cholesterol; ALT. Alanine aminotransferase; AST. Aspartate aminotransferase. WBC. White blood cell count. MLR; Monocyte to lymphocyte ratio; NLR. Neutrophil to lymphocyte ratio; PLR. Platelets to lymphocytes ratio. SII. systemic immune-inflammation
a indicates that the differences are considered significant when the p value between the quartiles is less than 0.05. b indicates that the differences are considered highly significant when the p value is less than 0.001.
Mean ± standard deviation (SD) is presented for data. Bold indicates statistically significant values. *p-value for trend (Analysis of Variance (ANOVA)).
The Post Hoc analysis reveals significant differences among quartile groups across various indices. Regarding WWI and SII, differences were observed between Q1 (≤313.18) and Q2 (313.19–401.81) (p = 0.032), Q1 and Q3 (401.82–541.30) (p = 0.009), and Q1 and Q4 (>541.30) (p = 0.006). In AST and SII, significant differences occurred between Q1 and Q2 (p = 0.001), Q1 and Q4 (p = 0.018), Q2 and Q3 (p = 0.008), and Q2 and Q4 (p = 0.042). With WHtR and MLR, notable differences were identified between Q1 (≤0.1278) and Q3 (0.1625–0.2153) (p = 0.020), Q1 and Q4 (>0.2154) (p = 0.010), Q2 (0.1279–0.1624) and Q3 (p = 0.013), and Q2 and Q4 (p = 0.007) (Table 3).
Table 4 presents the relationships between PLR and NLR with the aforementioned factors. Among anthropometric indices WC and WHtR were significantly higher in the highest PLR quartile (>0.2154) compared to the lowest quartile (≤0.1278), with WC at 111.47 cm vs. 105.03 cm (p = 0.015) and WHtR at 0.67 vs. 0.64 (p = 0.022). WHR and AST levels showed significant differences across NLR quartiles, with WHR highest in the lowest quartile (0.94) and lowest in the second quartile (0.91) (p = 0.039), and AST levels at 26.16 U/L in the first quartile vs. 21.03 U/L in the second (p = 0.031). The levels of ALT and ferritin across NLR quartiles showed significant differences. ALT levels were lowest in the second quartile (24.16 U/L) and highest in the fourth quartile (34.21 U/L), with a significant difference observed between the quartiles (p = 0.010). Additionally, ferritin levels were lowest in the second quartile (58.57 ng/mL) and highest in the third quartile (91.55 ng/mL), with a significant difference found between the quartiles (p = 0.011). No noteworthy differences were observed in BMI, Neck Circumference, or other metabolic markers across PLR or NLR quartiles.
Association of NLR and PLR with obesity, metabolic and liver function biomarkers.
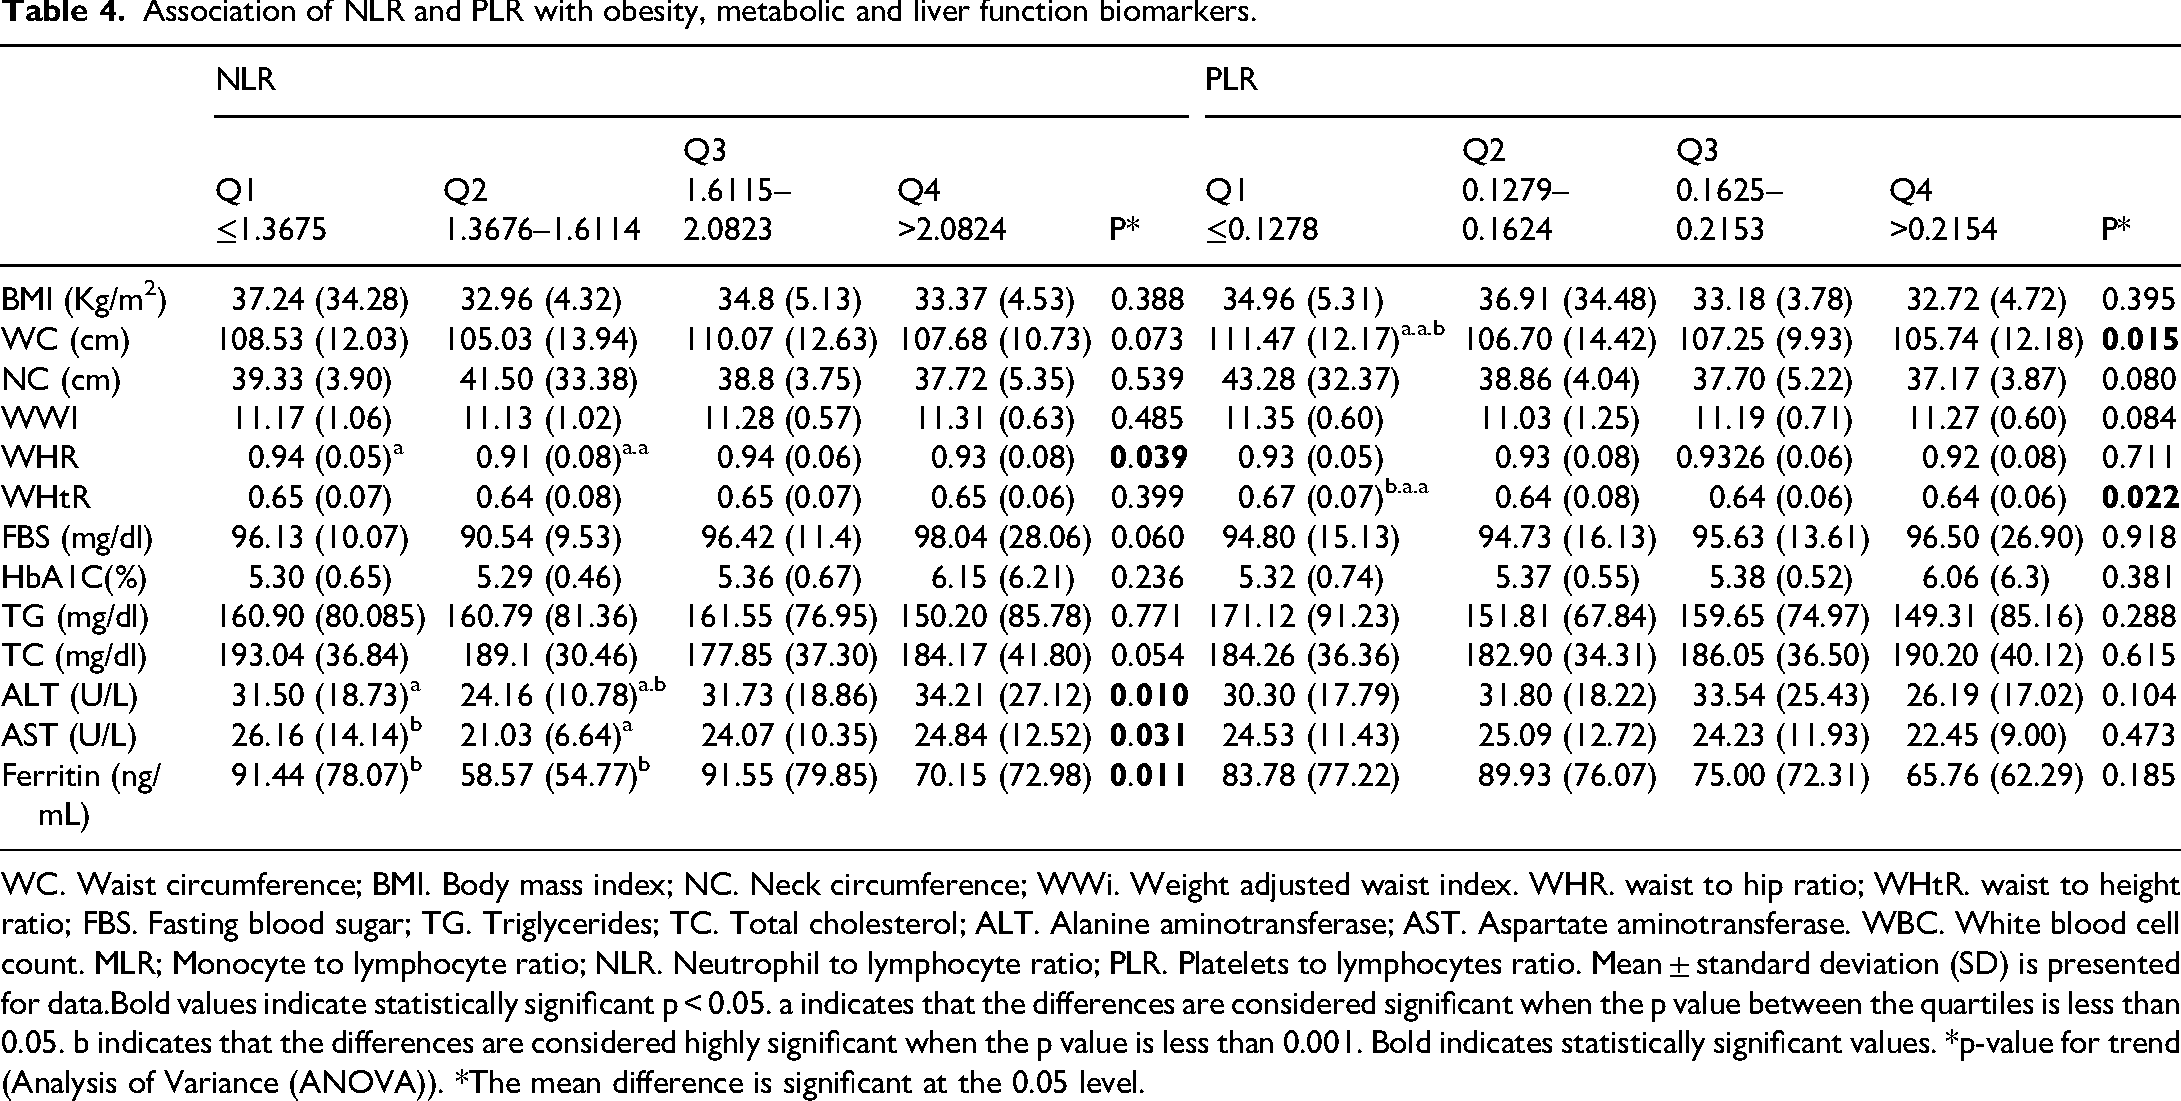
WC. Waist circumference; BMI. Body mass index; NC. Neck circumference; WWi. Weight adjusted waist index. WHR. waist to hip ratio; WHtR. waist to height ratio; FBS. Fasting blood sugar; TG. Triglycerides; TC. Total cholesterol; ALT. Alanine aminotransferase; AST. Aspartate aminotransferase. WBC. White blood cell count. MLR; Monocyte to lymphocyte ratio; NLR. Neutrophil to lymphocyte ratio; PLR. Platelets to lymphocytes ratio. Mean ± standard deviation (SD) is presented for data.Bold values indicate statistically significant p < 0.05. a indicates that the differences are considered significant when the p value between the quartiles is less than 0.05. b indicates that the differences are considered highly significant when the p value is less than 0.001. Bold indicates statistically significant values. *p-value for trend (Analysis of Variance (ANOVA)). *The mean difference is significant at the 0.05 level.
In addition, the Post Hoc analysis shows notable differences between quartile groups for various indices. In WHR and NLR, significant differences were detected between Q1 (≤1.3675) and Q2 (1.3676–1.6114) (p = 0.013), Q2 and Q3 (1.6115–2.0823) (p = 0.013), and Q2 and Q4 (>2.0824) (p = 0.043). For ALT and NLR, significant differences appeared between Q1 and Q2 (p = 0.019p = 0.019), Q2 and Q3 (p = 0.016), and Q2 and Q4 (p = 0.001). Similarly, in AST and NLR, differences were noted between Q1 and Q2 (p = 0.004) and Q2 and Q4 (p = 0.032p = 0.032). Ferritin and NLR showed significant differences between Q1 and Q2 (p = 0.006) and Q2 and Q3 (p = 0.006). With WC and PLR, differences emerged between Q1 and Q2 (p = 0.012), Q1 and Q3 (p = 0.029), and Q1 and Q4 (p = 0.003). Lastly, in WHtR and PLR, significant differences were observed between Q1 and Q2 (p = 0.007), Q1 and Q3 (p = 0.016), and Q1 and Q4 (p = 0.014) (Table 4).
These results demonstrate variations in the indices across tertiles, reflecting significant metabolic and inflammatory patterns.
Discussion
This research offers valuable perspectives on the complex connections between systemic inflammatory indices and obesity-related measures within a distinct group of obese individuals. Obesity, marked by excessive fat accumulation, is linked to low-grade systemic inflammation driven by adipose tissue, which releases pro-inflammatory cytokines and disrupts metabolic regulation, potentially causing liver dysfunction.2,35,36 Systemic inflammatory indices are increasingly recognized for assessing inflammation in obesity, where elevated PLR, NLR, MLR, and SII reflect increased inflammation (2). Higher PLR and NLR correlate with elevated inflammatory cytokines and cardiovascular risk in obese individuals, 37 while MLR and SII provide insights into immune cell activity in inflammation. 38 Our study results indicated that liver enzymes (ALT and AST) were significantly higher in males, suggesting potential liver stress. In contrast, females exhibited higher platelet counts, platelet-to-lymphocyte ratio (PLR), and systemic inflammatory index (SII), reflecting a different inflammatory response. The results showed that although males showed higher weight and WC, WWI, and WHtR were significantly greater in females compared with males, reflecting different fat distribution patterns. These results emphasize the significance of accounting for gender in health evaluation.
Additionally, significant relationships were found between WWI and SII, while inverse correlations were found between WHtR and MLR, WHR and PLR. Its correlation with the Systemic Inflammatory Index (SII) further supports WWI's potential as a precise marker for assessing inflammation and identifying high-risk obese individuals. 39 The correlations between MLR with WHtR observed in this study suggest potential cardiovascular risks. These findings are consistent with research that identifies MLR as an independent risk factor for cardiovascular diseases and associates it with lesion severity in coronary artery disease patients. 40 However, unlike previous studies focused on CVD patients, this study highlights the importance of examining an obese population to better understand these associations. In this study, we observed inverse correlations between ferritin and PLR, as well as between HbA1c levels and MLR. Furthermore, a positive correlation was found between FBS and NLR, indicating that elevated FBS levels were linked to increased NLR. These findings are consistent with prior research, such as a cross-sectional study, which highlighted similar associations between FBS and NLR 41 in NAFLD patients. Furthermore, serum ferritin levels, which can reflect inflammation, were negatively correlated with PLR. The main difference is that our study focused on obese individuals, while Arefhosseini et al. studied those with NAFLD, which could affect the inflammatory profiles in each study. In addition, This is consistent with research that associates NLR with the severity of metabolic syndrome (MetS) in adults with severe obesity. 42 However, unlike those studies that concentrated on MetS, our findings underscore the importance of NLR in a more general obese population, regardless of MetS status.In the gender-based analysis of correlations, significant findings were observed.
Moreover, in the gender-based analysis of correlations, significant findings were observed. Among males, a positive correlation was found between WWI and SII and WWI and NLR.43,44 Additionally, significant positive correlations were noted between WHR and SII and WHR and NLR. Among metabolic factors, a positive correlation was also observed between FBS and SII and FBS and NLR. Furthermore, a significant positive correlation was noted between ALT and SII and ALT and NLR. For AST, a significant positive correlation with MLR was observed.
The present analysis indicates positive correlations between specific anthropometric measurements, particularly the Waist-to-Hip Ratio (WHR), and inflammatory markers such as the Systemic Immune-Inflammation Index (SII) and the Neutrophil-to-Lymphocyte Ratio (NLR). These associations imply that central obesity is related to elevated systemic inflammation. This observation aligns with existing literature suggesting that obesity can contribute to a chronic low-grade inflammatory state, which is recognized as a significant risk factor for various metabolic disorders.2,6,10,43–46 Men have a higher proportion of visceral fat, which is more metabolically active and releases pro-inflammatory cytokines. This contributes to the observation that absolute numbers of neutrophils and monocytes increase with age, with men generally exhibiting higher counts of neutrophils, eosinophils, and particularly monocytes. This suggests that the combination of age-related changes and greater visceral fat in men may lead to heightened inflammation and immune cell activation. 47
In females, the analysis reveals several significant negative correlations between factors related to obesity and metabolism. Body Mass Index (BMI), Waist Circumference (WC), Waist-to-Height Ratio (WHtR), Fasting Blood Sugar (FBS), Hemoglobin A1c (HbA1c), and Alanine Aminotransferase (ALT) all show negative correlations with the Monocyte-to-Lymphocyte Ratio (MLR). Additionally, serum Ferritin levels are negatively correlated with MLR, while the Systemic Immune-Inflammation Index (SII) is negatively correlated with the Platelet-to-Lymphocyte Ratio (PLR).
The analysis highlights that increased obesity, as measured by BMI and waist circumference, raises systemic inflammation, leading to a decreased Monocyte-to-Lymphocyte Ratio (MLR). Poor metabolic control, indicated by higher fasting blood sugar and HbA1c, further exacerbates this inflammation and impairs immune responses. Liver health, reflected by ALT levels, is critical for managing inflammation, while elevated serum ferritin levels signal chronic inflammation and correlate with lower MLR. Additionally, the link between the Systemic Immune-Inflammation Index (SII) and the Platelet-to-Lymphocyte Ratio (PLR) underscores how systemic inflammation may disrupt immune balance. Overall, addressing obesity and metabolic dysfunction is essential for improving immune function and reducing chronic disease risks in females.
The findings reveal key associations between obesity-related metrics and systemic inflammation. WHtR varied significantly across MLR quartiles, showing that higher WHtR values correspond to greater levels of systemic inflammation. WWI differed notably across SII quartiles, indicating a comparable link between increased obesity and inflammation. These results highlight the role of adiposity in driving inflammatory responses within the body, as reflected by multiple obesity indices. Furthermore, serum AST levels exhibited notable variation with the systemic inflammatory index, indicating a strong association between liver function and systemic inflammation. Elevated inflammatory markers could contribute to liver dysfunction in individuals with higher systemic inflammation.
Overall, these findings emphasize the intricate associations between obesity, systemic inflammation, and liver health, which is critical for developing interventions that target inflammation in obesity-related health risks.
In addition, WC and WHtR were notably higher in the lowest PLR quartile compared to the highest, suggesting an association between abdominal obesity and systemic inflammation. Similarly, significant differences were observed in WHR and AST levels across NLR quartiles. This variation supports the notion that inflammatory markers like NLR may reflect the degree of systemic inflammation in obesity, though the effectiveness of NLR as a marker in obese adolescents remains debated. Some studies report elevated NLR levels in obesity, while others find no significant difference.48–52
Overall, systemic inflammation in obese individuals is driven by several mechanisms, as reflected in indices such as PLR, NLR, MLR, and SII. These inflammatory indices are closely associated with anthropometric measures like WHR, WC, and WHtR. The elevated levels of these indices in obesity are primarily due to chronic low-grade inflammation caused by excess adipose tissue, which releases pro-inflammatory cytokines such as IL-6, TNF-α, and CRP. 53 It is essential to recognize that C-reactive protein (CRP) fundamentally differs from the inflammatory markers analyzed in our study—such as SII, MLR, NLR, and PLR—in both nature and regulatory mechanisms. CRP functions as an acute-phase reactant, predominantly synthesized in the liver in response to systemic inflammation and is directly influenced by pro-inflammatory cytokines like IL-6. 54 In contrast, the systemic inflammatory indices we utilized are derived from blood cell counts and their ratios (e.g. neutrophils, lymphocytes, platelets), which reflect the equilibrium of various immune cell populations rather than the acute inflammatory state.55,56
The significant correlation between these inflammatory markers and anthropometric measures underscores their role in not only reflecting the presence of inflammation but also its impact on metabolic and cardiovascular health. For example, higher NLR and PLR are linked to increased risks of insulin resistance and atherosclerosis, particularly in individuals with higher WC and WHR. 57 SII, which integrates several inflammatory markers, is closely associated with visceral fat accumulation and adverse metabolic outcomes like hyperglycemia and dyslipidemia. 58
These observations highlight the importance of considering these inflammatory markers when assessing the risk of metabolic in obese individuals. Elevated NLR, MLR, PLR, and SII contribute to the development of conditions such as type 2 diabetes and cardiovascular disease, making these markers valuable for clinical evaluation and management. 58
Our study offers several important contributions while also having some limitations that should be considered. One of the main strengths of our research is its specific focus on an obese population, which allows us to delve into the relationships between systemic inflammatory markers like NLR, MLR, PLR, and SII, and key measures such as WC and WHtR, alongside various metabolic factors. This focus is particularly valuable because it enhances our understanding of the role inflammation plays in the health risks associated with obesity.
Based on our understanding, this study seems to be the first to investigate various inflammatory indices in relation to anthropometric and metabolic parameters, offering a more comprehensive insight into how these factors interact in the context of obesity. This depth of analysis is critical, as it helps identify potential markers that could predict cardiovascular and metabolic diseases in obese individuals, which could eventually inform better clinical practices.
However, our research also has certain limitations. The cross-sectional nature of the study cannot establish cause-and-effect relationships or track how these associations evolve over time. The sample size is sufficient for initial findings, but it limits the generalizability of the results and may weaken the strength of the associations observed. Furthermore, the lack of data regarding diet and physical activity and also specific inflammatory cytokines for presenting a more complete view of the involved factors as well as underlying inflammatory processes in obesity should be considered. The study may not account for cultural or environmental factors that could affect the results.
Conclusion
Our findings suggest potential correlations between systemic inflammatory markers, such as SII, MLR, and PLR, and key obesity indicators and metabolic parameters in obese individuals. These results highlight the possible relevance of systemic inflammatory markers in assessing health risks associated with obesity, particularly in relation to metabolic health.
In conclusion, while our study offers valuable insights into the interplay between inflammation and obesity, these findings should be interpreted with caution. The identified limitations indicate that future research would benefit from involving larger and more diverse populations, incorporating longitudinal analyses, and exploring a broader range of inflammatory and metabolic markers to further validate and enhance our understanding of these complex relationships.
Supplemental Material
sj-docx-1-sci-10.1177_00368504251333218 - Supplemental material for Weight-adjusted waist index and its relationship with systemic inflammatory Index and metabolic indices in overweight and obese individuals: A cross-sectional study
Supplemental material, sj-docx-1-sci-10.1177_00368504251333218 for Weight-adjusted waist index and its relationship with systemic inflammatory Index and metabolic indices in overweight and obese individuals: A cross-sectional study by Sanaz Asemani, Neda Jourabchi-Ghadim, Sara Arefhosseini and Mehrangiz Ebrahimi-Mameghani in Science Progress
Footnotes
Abbreviations
Acknowledgements
None.
Ethical considerations
This study was conducted in accordance with the ethical principles outlined in the Declaration of Helsinki. Ethical approval was obtained from the Ethics Committee of Tabriz University of Medical Sciences (IR.TBZMED.1403.371).
Author contributions/CRediT
SA, NJ, SA, and ME significantly contributed to the manuscript's writing.
SA and ME were responsible for gathering the patient data, conducting follow-ups, identifying the limited availability of cases, performing literature reviews, and revising the manuscript. All authors have read and approved the final version of the manuscript.
Funding
The author(s) received no financial support for the research, authorship, and/or publication of this article.
Conflicting interests
The author(s) declared no potential conflicts of interest with respect to the research, authorship, and/or publication of this article.
Data availability
The datasets utilized and/or examined in this study can be obtained from the corresponding author upon a reasonable request.
Supplemental material
Supplemental material for this article is available online.
References
Supplementary Material
Please find the following supplemental material available below.
For Open Access articles published under a Creative Commons License, all supplemental material carries the same license as the article it is associated with.
For non-Open Access articles published, all supplemental material carries a non-exclusive license, and permission requests for re-use of supplemental material or any part of supplemental material shall be sent directly to the copyright owner as specified in the copyright notice associated with the article.