
Abstract
The lack of clear regulations regarding the provision of electric vehicles parking lots, particularly in indoor parking lots, may result in inadequate fire protection and contingency planning during construction. This study investigated fire contingency planning for electric vehicle parking lots in large shopping mall, specifically scrutinizing the effects of charging pile locations, and was conducted through field research and computer simulations. Fire dynamic simulation model was utilized to simulate a fire in an indoor parking lot and investigate the impact of automatic sprinkler systems on the fire scene. The findings indicated that while automatic sprinkler cannot directly extinguish a fire, they can suppress the hazard parameters of the surrounding environment, alleviate the hazard area, and provide more time for responders or firefighters to rescue those affected.
Keywords
Introduction
In numerous urban business districts, where land is small and densely populated and outdoor parking is already scarce, buildings are tending to provide parking in the interior of the building or even moving toward basement parking to provide more parking. Large shopping malls have become the primary destination for shopping and leisure, combining shopping centers, retail stores, restaurants, movie theaters, and other commercial and entertainment facilities to provide a multi-functional shopping and entertainment experience. As a result, the demand for parking space has increased, making fire safety in parking lots a major concern. The size and number of the basement parking space parking spaces present a significant risk in the event of a fire, as the entire structure of the building can readily be affected. Evacuation can also be challenging due to the dense smoke, which makes it difficult to see the emergency exit signs in the room. Beyond doubt, firefighters are challenged in fire rescue because of the difficulty of entering the scene, increasing the complexity and challenge of disaster relief. 1
The insufficiency of public transportation has caused a serious parking problem in urban planning. To alleviate the issue of insufficient parking space, it is recommended to provide diversified modes of transportation. 2 The parking problem can be solved through fruitful management, planning and spatial design, which can be achieved by implementing measures, such as setting parking time limits and increasing parking fees to limit the time and number of private cars parked near shopping malls. 3
The planning and construction of commercial centers should include the development of a convenient transportation network and sufficient parking facilities to provide customers with leisure and entertainment convenience. Multi-purpose parking lots should be built around shopping malls or in city centers to provide more parking spaces. Basement or multi-level parking structures are designed to optimize space utilization and enhance added value. These structures accommodate higher vehicle density while also providing additional amenities like electric charging stations to cater to evolving transportation needs. Effective parking space design and provision can create an enjoyable shopping experience for customers and contribute to economic performance. 4
Previous studies have conducted numerous experiments to measure the data, such as heat release rate, temperature, and mass loss rate during the fire on the combustion of conventional fuel vehicles in parking spaces.5,6 After fire tests, the average effective combustion heat value of traditional fuel vehicles ranges from 21 to 23 MJ/kg. 7 A vehicle fire test was conducted in a semi-open parking lot to understand the spread of fire without obstacles or any fire-fighting conditions. Results showed that the fire would spread expeditiously to adjacent vehicles by radiant heat and flames ejected through the ceiling. 8
At present, most parking lots mainly park traditional fuel vehicles, and some have been converted into parking spaces for electric vehicles (EVs), resulting in a mixed parking situation. However, it is pivotal to follow the fire safety design and emergency response procedures established for electric vehicle parking lots. Because the fire risks and emergency response needs of electric vehicles are different from traditional fuel vehicles. Therefore, it is necessary to develop a comprehensive and appropriate emergency plan based on the fire characteristics of electric vehicle parking lots to ameliorate the fire response capabilities of shopping malls and ensure the safety of shoppers and employees.
In recent years, research on the combustion behavior of electric vehicle batteries has proliferated due to their increasing popularity. Studies have shown that the heat release rate of batteries increases promptly during the combustion process.9,10 Since combustion will cause forced air convection, research has also shown that airflow can affect the propagation of thermal runaway in lithium-ion battery arrays, and it is found that higher airflow can exacerbate thermal runaway fire behavior and shorten the propagation time. 11 Moreover, battery packaging causing battery clogging may seriously affect firefighters’ performance in firefighting operations. 12
According to data analyzed by the U.S. National Transportation Safety Board (NTSB), 13 four factors for electric vehicle fires have been identified, including weather, spontaneous combustion, re-ignition, and traffic accidents. The statistics from 2016 to 2021 14 showed that the accident rate of EVs was lower in the months of January to March, while June to August were the months with the highest accident rate, accounting for half of the annual number of accidents. The peak period for EV fires is summer, so it can be assumed that the cause of EV fires may be related to the weather temperature. In addition, when the vehicle is exposed to high temperature for a long period of time, heat dissipation is not conducive, and the battery is prone to short circuit. Spontaneous ignition of electric vehicles can occur in stationary (uncharged state), charging, and driving states. 15 Combustion during charging may be related to lithium-ion battery failures caused by overcharging, short circuits leading to thermal runaway, or overcharging, over-discharging, or external short circuits, which can cause thermal runaway.
In some cases, electric vehicles’ lithium-ion battery modules can suffer severe damage due to traffic accidents or collisions, leading to thermal runaway battery fires caused by extrusion and deformation of lithium-ion batteries or short circuits resulting from collisions. 16 Moreover, an electric vehicle may reignite after the initial fire has been extinguished due to the lithium-ion battery pack damages. 13 The battery's internal temperature increases due to the persistent high ambient temperature. As the battery's heat dissipation is lower than its heat production, it cannot release heat quickly enough. This ultimately leads to thermal runaway of the battery.
Thermal runaway of lithium-ion batteries can cause electric vehicle fire accidents due to the high internal temperature, causing the battery material to decompose thermally and release toxic gases, ultimately leading to battery fire and explosion.17–19 The hazards caused by thermal runaway in EV batteries are severe, and this type of disaster poses a global challenge. The main objective of this study is to conduct a field investigation on the fire response in indoor electric vehicle parking spaces in large shopping malls. Through simulation and analysis, this study evaluated the possible hazards caused by fire in the parking space of electric vehicles on different floors with automatic water sprinkler and electric piles in different locations.
Field research
This study examined 20 large shopping malls in Taiwan, including department stores, shopping centers, and mass merchandisers. Field investigations were conducted to understand the current situation of large shopping malls in terms of EV parking areas, such as their location, number, and surrounding conditions. Then, full-scale numerical simulations were performed based on a certain parking lot configuration.
Numerical simulation
Computation domains
The parking lot evaluated in this study was divided into six zones for simulation. The dimensions of each zone are as follows: (1) 19.8 × 13 × 4 m, (2) 48.6 × 55.6 × 4 m, (3) 18.6 × 12.2 × 4 m, (4) 11.2 × 9 × 7.2 m, (5) 11.2 × 9 × 7.2 m, and (6) 11.2 × 12.6 × 7.2 m. The total number of computational cells was 1,901,688, as shown in Figure 1. The fire sources were located in zones (1) and (2).

Layout and zoning of the parking lot used for the simulation.
For a fire scenario with a maximum heat release rate (HRR) of 7.25 MW, achieving sufficient resolution in the fire dynamics simulator (FDS) requires cell sizes ranging from 13 to 52 cm. 20 Therefore, a uniform grid size of 20 cm was selected for all zones in this simulation.
This study focused on smoke movement conditions in three different parking spaces: The above-ground level, the underground B1 level, and the lowest underground level. The above-ground parking lot was a semi-open area connected to the outdoors via driveways. Surrounding the floor are 1.6-m-high low walls, creating a semi-open environment, as shown in Figure 2(a). Owing to the open boundaries of the surrounding area and spiral driveways, the above-ground level has a greater air exchange capacity compared to the underground levels.
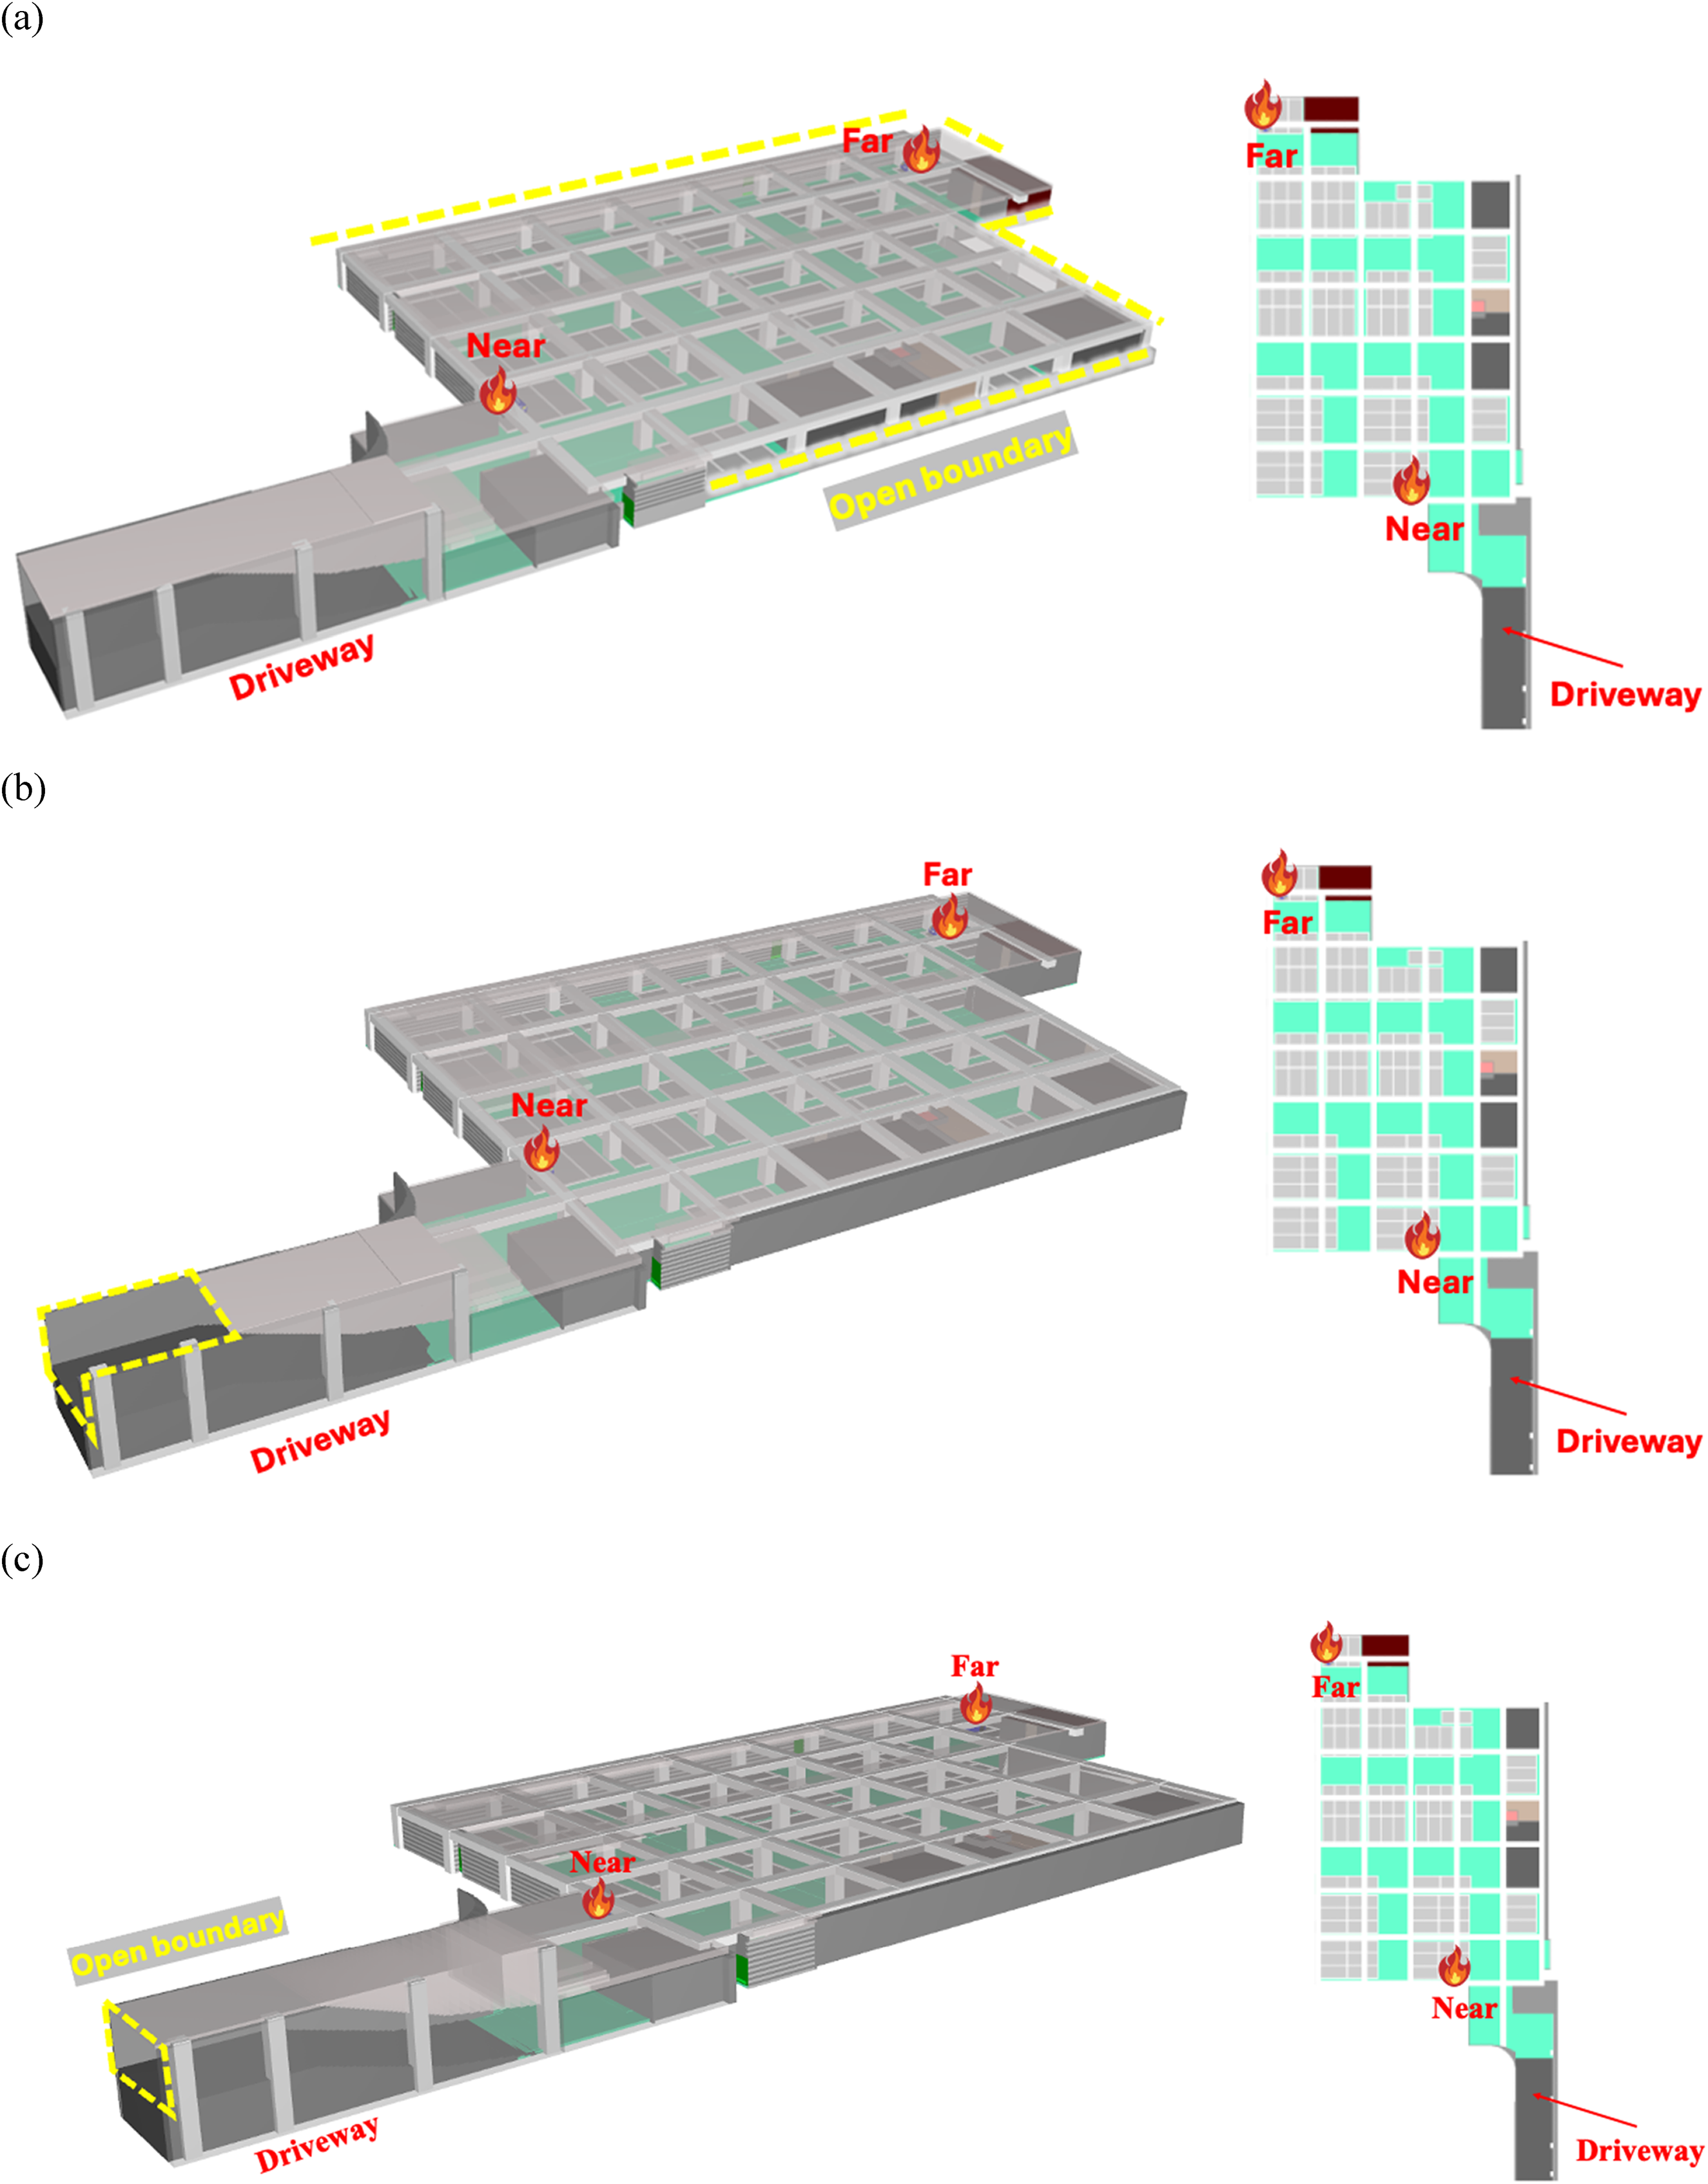
Structural and spatial layout of the parking spaces analyzed in this study: (a) ground level, (b) B1 level, and (c) the lowest level.
The underground B1 level and the lowest underground level were fully enclosed spaces, except at the spiral driveway connections. The primary difference between these two levels lay in the configuration of the spiral driveways. The B1 level's driveways were connected to the ground level, providing larger air inlets and outlets compared to the lowest underground level, where the primary air exchange was limited to the cross-sectional area of the spiral driveway. Additionally, the space above the B1 level driveways was open to the outdoors, while the space above the driveways in the lowest underground level was enclosed, as shown in Figure 2(b) and (c).
In the computer simulations, the boundary conditions for openings were set to be connected to the atmosphere. The floor, walls, and ceiling were not assigned specific material properties, but their thicknesses were defined to meet the 20-cm grid resolution requirement. These differences in driveway and boundary configurations form the primary distinctions between the parking spaces on different levels, as illustrated in Figure 2(a) to (c).
Heat release rate and associated gas emissions
Numerous studies have evaluated the fire risk and safety design of batteries.21–24 Relevant experiments9,25 indicate that the fire extinguishing efficiency for lithium-ion batteries differs substantially from that of traditional vehicles, making it challenging to directly apply traditional vehicle fire extinguishing data to the effectiveness of extinguishing EV fires. In addition, EV fires are associated with varying degrees of fire hazard depending on factors, such as the size, material, and capacity of the battery, power system, and battery pack. 15 To understand the combustion characteristics of electric vehicles, some studies conduct full-scale fire tests on electric vehicles to assess their fire-extinguishing effectiveness, such as those involving lithium titanate battery-powered EVs with an average heat flux of approximately 2.3 MW/m² when fully charged, 15 and other EVs exhibiting heat release rates between 4.2 and 8.6 MW in combustion tests.9,26
The vehicle dimensions used in this study were based on the specifications of the Tesla Model 3, with a length of 4.8 m and a width of 2 m. All windows, including those at the front, rear, and sides, were assumed to be fully open. The placement of the battery pack was determined by evaluating the typical locations of battery systems in electric vehicles currently available on the market. Most battery packs are installed in the central undercarriage of the vehicle. Therefore, the battery pack was positioned at the vehicle's central undercarriage and designated as the fire source location, as illustrated in Figure 3.

Electric vehicle dimensions, battery pack placement, and fire source location used in this study.
The HRR was based on the full-scale fire tests of electric vehicles conducted by Kang et al. 27 In these experiments, the battery of a fully charged vehicle (BEV#3) was ignited using a heating plate, and the maximum HRR recorded was 7.25 MW. To simplify the simulation of the combustion process and the propagation of fire to the vehicle body, it was assumed that the vehicle body was non-combustible, and all energy was released solely from the battery located under the vehicle. The battery dimensions were set to 2.8 m in length and 1.4 m in width, resulting in a specific HRR of approximately 1.85 MW/m². Based on experimental data from Kang et al., 27 the ignition source refers to the energy release from the entire battery pack and vehicle combustion in the FDS simulation. The fire growth rate was determined based on the HRR curve recorded for BEV#3 in Kang et al.'s experiments. For a conservative evaluation, the simulation differs from Kang's experimental curve in that, after reaching the maximum heat release rate, it remains at a steady-state of 7.25 MW without decreasing. Based on the aforementioned data, the HRR of the fire source in the simulation was set at 7.25 MW, calculated based on the battery dimensions of 2.8 × 1.4 m and the required heat release rate per unit area. The fire growth data were derived from the experimental curve by Kang et al., 27 and the growth coefficient was calculated to accurately simulate the heat release rate at each time point, closely approximating the experimental results. According to the experimental data and adjustments from Kang et al., the fire energy release in our simulation was configured accordingly, and therefore, the battery material and quantity were not explicitly considered.
It is acknowledged that the HRR of lithium-ion batteries may vary under different conditions. For instance, Sun et al. 15 reported that LTO-based electric vehicles release energy at 2.3 MW/m². However, this study focuses on the spread of smoke under varying environmental conditions. Therefore, the HRR data recorded in Kang et al.'s experiments were adopted to reasonably predict the movement of smoke during a fire scenario.
Furthermore, Hynynen et al. 28 highlighted that modern vehicles are predominantly constructed with plastic materials. Consequently, in this simulation, the fire source was modeled as PVC material, which is simplified to the chemical formula C₂H₃Cl based on the FDS manual. The mixture fraction model [20] in FDS was employed to calculate the mixing of fuel and oxidizer (oxygen), as well as the generation and tracking of combustion products. During the combustion process, stoichiometric calculations were used to divide the reaction into two cases: Complete combustion (sufficient oxygen), where the primary products are carbon dioxide (CO₂), water (H₂O), and hydrogen chloride (HCl), and incomplete combustion (limited oxygen), where the products include carbon dioxide (CO₂), carbon monoxide (CO), water (H₂O), hydrogen chloride (HCl), and soot (C). Using these combustion equations, stoichiometric ratios were applied to calculate the consumption of fuel and oxidizer, as well as the spatial distribution and evolution of combustion products in the simulation.
This simplification allows for a more computationally efficient simulation while maintaining sufficient accuracy in predicting the distribution of combustion products. This approach ensures accurate simulation of combustion dynamics under different oxygen conditions.
Configuration of automatic sprinkler system
Numerical simulation is employed to assess the impact of automatic sprinkler equipment settings on disaster area control. According to NFPA, 29 the minimum requirement for sprinkler density of indoor parking space sprinkler equipment is 8.1 mm/minute with a protection area of 140 m². The sprinkler head designed in this study will be simulated at a discharge pressure of 1 kgf/cm² and a flow rate of 80 L/minute, as shown in Figure 4. These sprinklers are of the closed-type design, equipped with a glass bulb that acts as the heat-sensitive element, which fractures upon reaching its rated activation temperature of 68 °C, thereby initiating water discharge.

Numerical simulation of sprinkler protection design drawing.
Criteria for occupant safety and fire spread assessment
Although numerous studies have indicated that electric vehicle fires generate toxic gases, particularly hydrogen fluoride (HF), which poses significant risks to emergency responders, Larsson 17 conducted seven combustion tests on four types of lithium-ion batteries, all of which produced HF. In addition, NFPA and NIST 12 conducted water quality analyses during fire suppression experiments involving lithium-ion batteries, suggesting that HF and HCl may be generated during the extinguishing process. Hynynen 19 reported that HF concentrations ranging from 120 to 859 g were observed in electric vehicle fire experiments.
Owing to the limited availability of specific toxic gas tests, inconsistencies in measurement methods, and the strong dependence of environmental impact on release timing, it is challenging to incorporate HF effects into the current fire source assessment. Therefore, HF effects were excluded from this evaluation.
For occupant safety assessment, SFPE performance-based design criteria, 30 such as temperature, carbon monoxide (CO) concentration, and visibility, were adopted to evaluate the environmental conditions and their potential impact on human safety, as summarized in Table 1.
Evaluation criteria applied in this study.

The increased use of automotive plastics in the overall vehicle design has caused fire load issues. 5 From 1970 to 2020, the proportion of plastic in total vehicle weight increased from 6% to 18%. Research 31 also indicated that the distance between vehicles in their study was 0.6 m, and that the thermal decomposition temperature of the polyurethane material commonly used in vehicles was approximately 200 °C. In this study, whether the temperature reaches 200 °C at 0.6 m from the vehicle was used as the benchmark for fire spread and combustion.
Mesh size dependency analysis
To evaluate the mesh size dependency of the simulation results, four different mesh sizes—10, 20, 40, and 80 cm—were tested. The temperature at a height of 1.8 m above the vehicle was compared for each case. As shown in Figure 5, the results for the 10 and 20 cm mesh sizes were exceptionally similar, indicating that a mesh size of 20 cm was expected to provide sufficient resolution for the simulation.

Mesh size dependency (temperature profile over time at 1.8 m above the ground on the vehicle roof).
Results and discussion
Parking space field investigated results
To comprehend the parking space planning of large shopping centers in Taiwan, this study conducted interviews with 20 large shopping malls. The aim was to investigate and analyze the parking patterns of people driving electric vehicles, the location and number of charging stations, on-site fire safety equipment, and the surrounding conditions. Moreover, potential risks were assessed to understand the architectural parking space planning of shopping centers co-constructed with parking spaces. The field investigation results are showcased in Table 2.
Parking space field survey results.
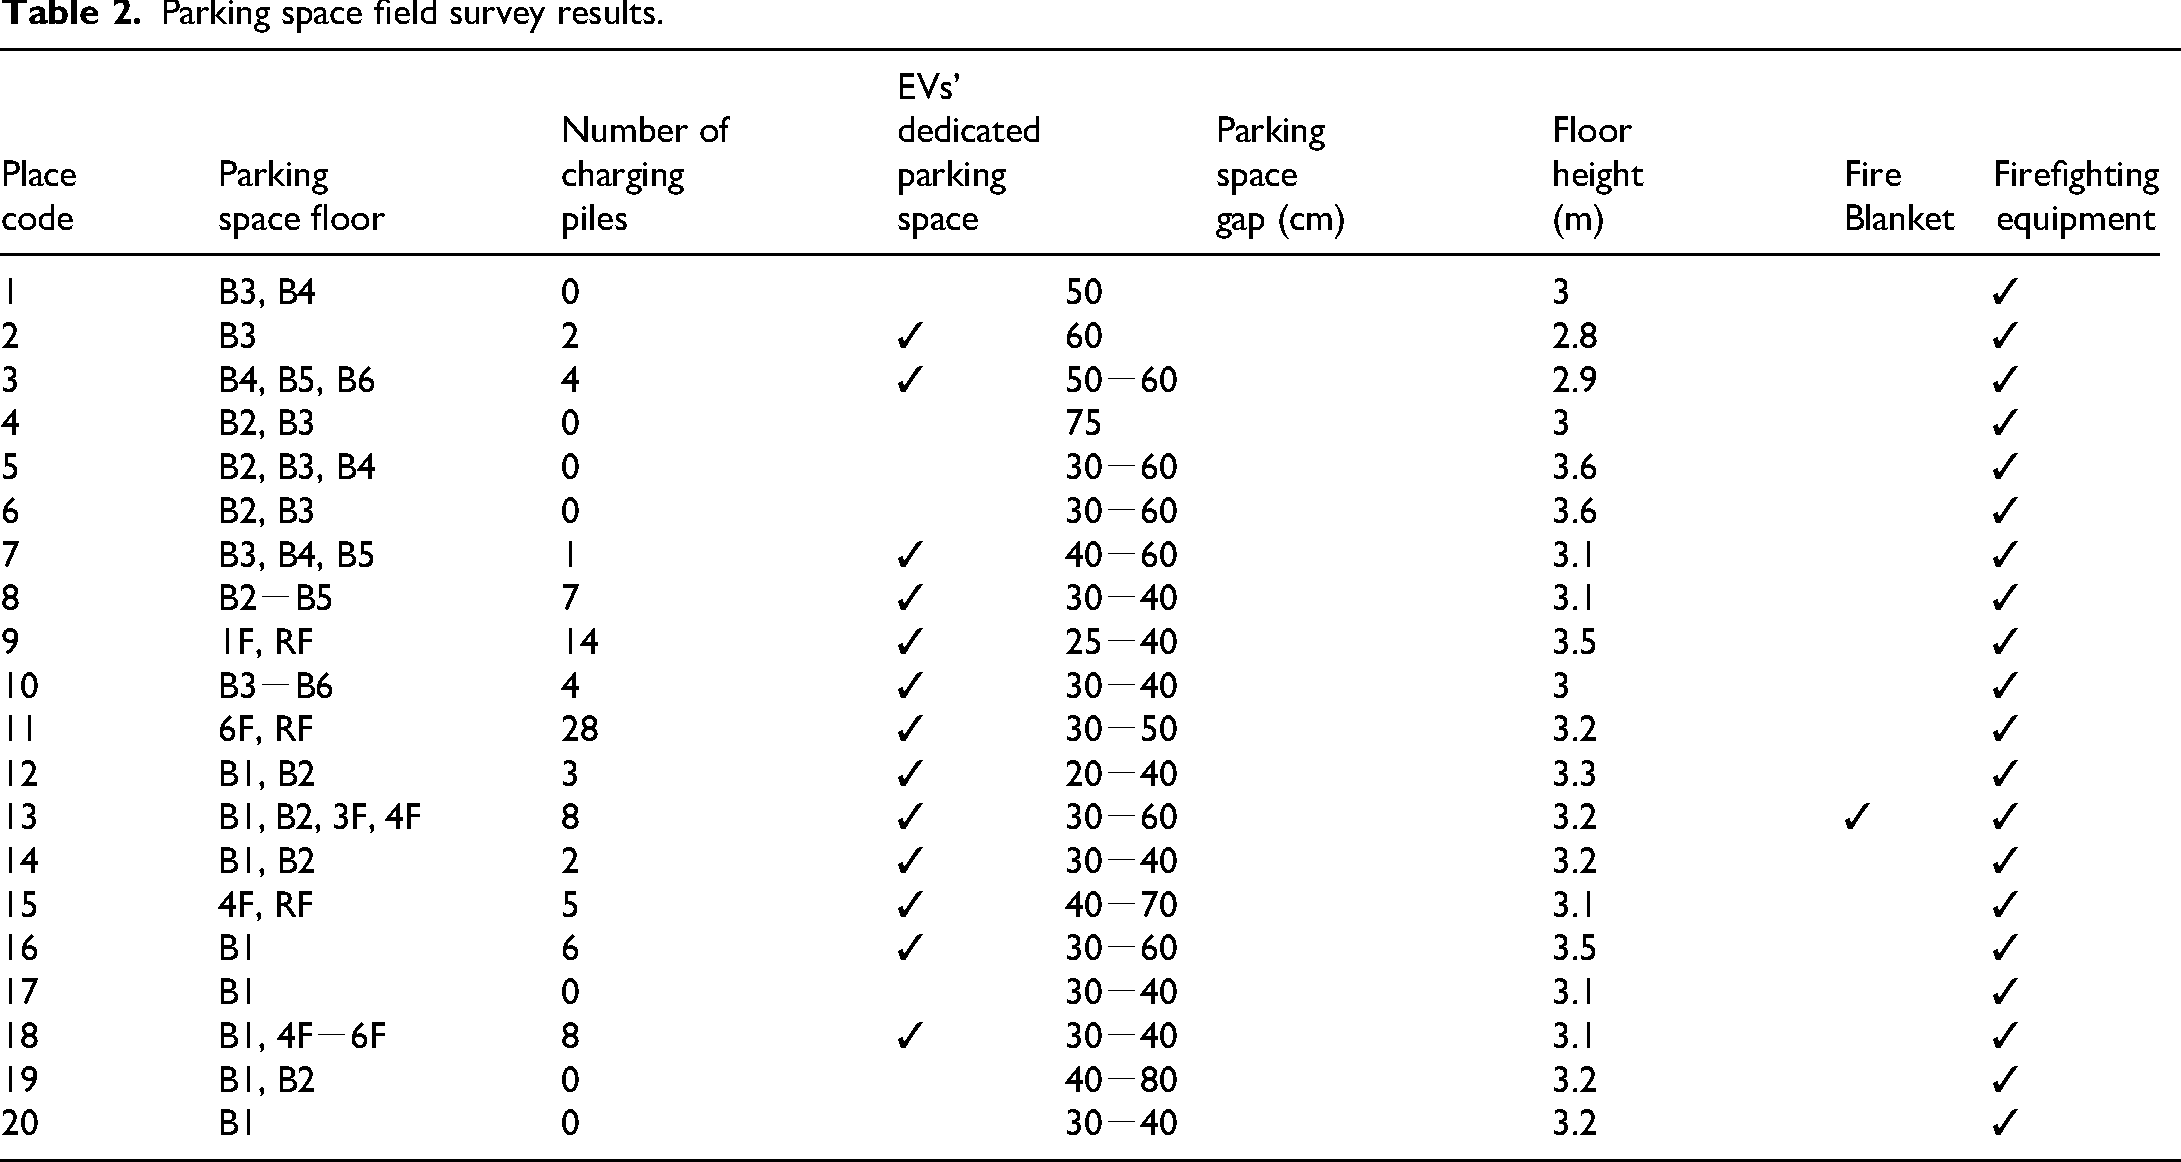
As can be seen from Table 2, the survey results show that the 20 large shopping mall indoor parking lots have some similarities. First, all parking spaces in shopping malls are equipped with fire-fighting equipment, including fire detectors, foam nozzles, dry powder fire extinguishers, indoor fire hydrants and other measures to ensure safety. Although parking lots varied in size, the ceiling to floor height was consistent, in most cases 2.8‒3.6 m. Parking spaces, both surface and mechanical, were mostly located within buildings, and most parking lots were equipped with several electric vehicle chargers. Vehicle parking spaces gaps were generally between 30 and 80 cm, and electric vehicles and traditional fuel vehicles shared parking spaces.
Also, the variations between indoor parking spaces in large shopping centers were observed. While most of the venues share similar safety equipment and basic specifications, there were differences in management practices, design of dedicated parking spaces, and configuration of special safety equipment. The design and management of parking areas for electric vehicles (EVs) varied among venues. Some had dedicated areas for EVs, while others shared them with conventional fuel vehicles. Certain venues were equipped with special fire safety equipment, such as smoke extraction equipment or fire blankets, while others were not.
Simulation results
Since the fire source was positioned at the center of the vehicle's undercarriage, smoke and flames primarily emanated from the bottom of the vehicle. The simulation captured the three-dimensional flow of smoke or the combined interaction of smoke and flames, as illustrated in Figure 6. Based on this simulation, the environmental conditions were evaluated for parking lots located on the lowest underground level, the B1 level, and the ground level. These evaluations considered proximity to or distance from the spiral driveway, as well as the presence or absence of sprinkler systems.

Three-dimensional flow of smoke and flames generated from the fire source located at the center of the vehicle's undercarriage. (a) Vehicle body and smoke, (b) vehicle body, smoke and flame, (c) vehicle body and flame.
Analysis of fire smoke propagation near and far from the spiral driveway
In both the lowest underground level and the B1 level, the fire-induced smoke near and away from the spiral driveway predominantly spread toward unobstructed areas, as indicated by the direction of the red arrows in Figure 7, due to the confinement of the fire by surrounding walls. Regardless of proximity to the spiral driveway, the smoke on both the lowest underground level and the B1 level filled the entire ceiling area within approximately 300 seconds.

Smoke spread patterns in different parking space fires: (a) the lowest level near the spiral driveway at 100, 200, and 300 seconds; (b) B1 level near the spiral driveway at 100, 200, and 300 seconds; (c) ground level near the spiral driveway at 100, 200, and 300 seconds; (d) the lowest level far from the spiral driveway at 100, 200, and 300 seconds; (e) B1 level far from the spiral driveway at 100, 200, and 300 seconds; (f) ground level far from the spiral driveway at 100, 200, and 300 seconds.
When the fire source was located on the ground level, the absence of surrounding walls allows some of the smoke to flow outdoors, thereby delaying the spread of smoke into the parking area, as shown in Figure 7(c). Additionally, when the fire source was on the ground level and away from the spiral driveway, the proximity to outdoor spaces enabled a portion of the smoke to disperse directly outside, making this phenomenon even more pronounced, as illustrated in Figures 7(f) and 8.

Smoke and heat are discharged from the ground-level parking space through the open area connected to the external environment. The simulation of temperature vector diagrams and smoke diffusion diagrams clearly shows the outward spread of smoke.
Evaluation of parking locations for electric vehicles
Based on hazard parameters measured at a height of 1.8 m above the floor, the time during which visibility was reduced to less than 10 m in the lowest underground level, both near and away from the spiral driveway, is approximately 200‒300 seconds. A temperature of 60 °C was observed around the vehicle environment at 500‒600 seconds, while the carbon monoxide (CO) concentration in the parking area reached approximately 750 ppm at 600 seconds, as shown in Figure 9.

Distribution of hazard times for temperature, visibility, and carbon monoxide concentration in the lowest underground level near and away from the spiral driveway: (a) temperature near the spiral driveway at 500 and 600 seconds; (b) visibility near the spiral driveway at 200 and 300 seconds; (c) carbon monoxide near the spiral driveway at 500 and 600 seconds; (d) temperature far from the spiral driveway at 500 and 600 seconds; (e) visibility far from the spiral driveway at 200 and 300 seconds; (f) carbon monoxide far from the spiral driveway at 500 and 600 seconds.
The simulation results for the B1 level show a similar trend. When considering hazard times based on parameters, such as carbon monoxide concentration, temperature, and visibility, visibility had the most immediate impact on the environment. A detailed hazard assessment of visibility under various scenarios would be conducted in the following sections.
In ground-level areas, the visibility hazard times caused by fires near or away from the spiral driveway are approximately 300‒400 and 500‒600 seconds, respectively, as shown in Figure 10(a) and (b). Under this heat release rate scenario, the visibility hazard times are prominently delayed compared to the enclosed environments of the lowest underground level and the B1 level, which are approximately 200‒300 seconds. This indicated that, in the absence of sprinkler systems, parking spaces for electric vehicles should be prioritized in ground-level areas.

Visibility distribution at a height of 1.8 m near and away from the spiral driveway: (a) visibility near the spiral driveway at 300 and 400 seconds ; (b) visibility far from the spiral driveway at 500 and 600 seconds .
Fire scenario analysis for the lowest underground level and B1 level
In fire scenarios occurring in the lowest underground level and the B1 level, whether near or away from the spiral driveway, visibility was reduced across most of the space within 200‒300 seconds. However, in fires near the spiral driveway, the dense smoke tended to accumulate close to the spiral driveway. In addition, the airflow induced by the fire draws air into the fire source through the spiral driveway. At this point, the dense smoke collided with the incoming air at the spiral driveway entrance, forming turbulence that swiftly diminished visibility at the spiral driveway entrance. This phenomenon was clearly demonstrated in the simulated airflow vector diagrams, as shown in Figure 11.

Smoke and entrained air collide near the spiral driveway, creating turbulence that rapidly reduces visibility.
In contrast, for fires far from the spiral driveway, the direction of airflow resulted in distinct stratification between smoke and air, and turbulence did not immediately form at the spiral driveway entrance. This created an area near the spiral driveway with relatively higher visibility. The differences at the B1 level are illustrated in Figure 12(a) and (b), while the differences at the lowest level are shown in Figure 12(c) and (d). This indicated that locating the fire away from the spiral driveway provided a buffer zone with higher visibility within the first 5 minutes of the incident, which can facilitate the deployment of emergency response personnel.

Visibility distribution at a height of 1.8 m for fires near and far from the spiral driveway at specific times: (a) near the spiral driveway at 200 and 300 seconds in the B1 level, (b) far from the spiral driveway at 200 and 300 seconds in the B1 level, (c) near the spiral driveway at 200 and 300 seconds in the lowest level, and (d) far from the spiral driveway at 200 and 300 seconds in the lowest level.
Sprinkler system installation in indoor parking areas
Simulation results, as shown in Figure 13(a) and (b), indicated that for an electric vehicle fire near the spiral driveway on the B1 level, regardless of whether an automatic sprinkler system is present or activated, visibility at a height of 1.8 m drops to below 10 m across most areas by 300 seconds. The impact of whether the sprinkler system is activated is illustrated in the simulation results for fires far from the spiral driveway, as shown in Figure 13(c) and (d). In such scenarios, the use of an automatic sprinkler system can maintain visibility above 10 m over a larger area within 300 seconds, as shown in Figure 13(d). However, owing to the enclosed nature of the underground space, smoke cannot effectively dissipate, leading to visibility reducing to less than 10 m at a height of 1.8 m across the entire area by 400 seconds.

Visibility distribution at a height of 1.8 m on the B1 level under the influence of the presence or absence of automatic sprinklers at 200 and 300 seconds : (a) visibility near the spiral driveway without automatic sprinklers, (b) visibility near the spiral driveway with automatic sprinklers, (c) visibility far from the spiral driveway without automatic sprinklers, and (d) visibility far from the spiral driveway with automatic sprinklers.
Figure 14 illustrates the significant impact of sprinkler system activation on smoke behavior in the B1 level. At 200 seconds, as indicated by the black square in Figure 14, the visibility around the fire source decreases significantly when the sprinkler system is activated. This is further supported by simulation results, which show that the activation of the sprinkler system causes a noticeable reduction in visibility around the fire source due to water spray. Data recorded from the measurement point, located 3 m horizontally from the electric vehicle and 1 m above the ground, further illustrates visibility changes over time. After the sprinkler head is activated, the visibility at this point drops rapidly, as shown by the blue line in Figure 15. In contrast, without the influence of sprinklers, the visibility decreases more gradually, as indicated by the red line in Figure 15. This comparison demonstrates that the sprinkler system effectively controls the dense smoke around the fire source, thereby slowing its spread and accumulation toward the spiral driveway.

Visibility distribution along the X-axis at 200 seconds with the sprinkler system activated, highlighting a substantial reduction in visibility in the area surrounding the fire source.

Visibility changes over time at the measurement point located 3 m horizontally from the electric vehicle and 1 m above the ground. At 200 seconds , after the sprinkler head is activated, the visibility (blue line) drops rapidly. In contrast, at the same measurement point, the visibility (red line) decreases more slowly without the influence of the sprinkler system.
As shown in Figure 16, from 300 to 600 seconds, the visibility profile revealed a clear stratification between smoke and cleaner air. At 400 seconds, the visibility slices along the X-axis indicated that the area with visibility below 10 m only reaches the boundary at 1.8 m above the ground, while the visibility in the area below this boundary remains above 30 m, as shown in Figure 17. By 550 seconds, the area with visibility below 10 m descends to the boundary at 1 m above the ground.

Visibility distribution along the X-axis from 300 to 600 seconds with the sprinkler system activated, highlighting the clear stratification between smoke and cleaner air.

Position with visibility below 10 m is approximately at a height of 1.8 m above the floor, while the visibility in other areas remains above 30 m.
In contrast, Figure 18 shows that without a sprinkler system, smoke quickly spread toward the spiral driveway within 200 seconds. Unlike scenarios with sprinklers, visibility around the fire source did not decrease substantially. By 300 seconds, as shown in Figure 19, smoke near the spiral driveway expeditiously settled due to wall obstructions. By 500 seconds, the stratification between smoke and air almost completely disappears, with areas of visibility <10 m concentrated near the ground.

Visibility distribution along the X-axis at 200 seconds without sprinklers, showing rapid smoke expansion toward the spiral ramp and no significant visibility drop near the fire source.

Visibility distribution along the X-axis from 300 to 600 seconds without sprinklers, showing rapid smoke settling near the ramp and the disappearance of smoke-air stratification.
Therefore, for electric vehicle parking or charging stations located in the lowest basement and B1 levels, it was recommended to position these facilities far from the spiral driveway and installed sprinkler systems. This ensured a buffer time of 300‒400 seconds for emergency responders to arrive on-site.
Simulation results indicate that without sprinklers, the time required for the entire area to reach visibility-related hazard values is approximately 300‒400 seconds for fires near the spiral driveway (Figure 20(a)) and 400‒500 seconds for fires farther from the spiral driveway (Figure 20(c)). With the installation of automatic sprinklers, this time is significantly extended to 400‒500 seconds for fires near the spiral driveway (Figure 20(b)) and beyond 600 seconds for fires farther from the spiral driveway (Figure 20(d)).

Visibility hazard time distribution in the ground-level parking space compares the effects of sprinkler installation and non-installation near and far from the spiral driveway at specific times. For fires near the spiral driveway without the installation of automatic sprinklers, the visibility hazard occurs between 300 and 400 seconds (a). With the installation of automatic sprinklers, this time extends to 400–500 seconds (b). For fires farther from the spiral driveway, the visibility hazard occurs between 400 and 500 seconds without sprinklers (c), while with sprinklers, it is delayed to 500–600 seconds (d).
This demonstrated the effectiveness of automatic sprinklers, particularly for fires occurring far from the spiral driveway. In these scenarios, the fire source was promptly suppressed by the sprinkler system, causing visibility around the fire source to decrease rapidly. Meanwhile, the smoke near the ceiling was slowed in its spread to surrounding areas, and the smoke can flow outward from the parking space rather than accumulating rapidly. This created a safer space for firefighting and rescue operations.
Therefore, it was recommended to install sprinklers in ground-level parking areas as well, with the optimal location for electric vehicle parking being far from the spiral driveway.
Automatic sprinkler installation and fire spread assessment
The literature indicates that when the temperature reaches 200 °C, the fire can spread to adjacent vehicles up to a distance of 60 cm. 31 According to field research results, the distance between parked vehicles ranged from 20 to 85 cm. Figures 21 and 22 respectively represent scenarios near and far from the rotary driveway, with or without the installation of automatic sprinklers. The red areas in the figures show the maximum observed range of 200 °C during the simulation period.

For 200 °C temperature range near the spiral driveway, with and without sprinklers, is shown for (a) lowest level, (b) B1 level, and (c) ground level. Red areas represent the maximum observed range of 200 °C during the simulation.

For 200 °C temperature range far from the spiral driveway, with and without sprinklers, is shown for (a) lowest level, (b) B1 level, and (c) ground level. Red areas represent the maximum observed range of 200 °C during the simulation.
Since the battery was located in the chassis of the vehicle, if the vehicle was positioned in the center of an area without surrounding structural elements (such as walls or columns), the resulting flames and smoke would spread symmetrically. However, based on the actual site environment, the presence of structural elements near the electric vehicle's parking location caused the flames to spread asymmetrically.
The temperature range shown in Figure 21 indicates that if sprinklers were not installed, the 200 °C high-temperature range produced by a burning vehicle extends to 1.1, 0.6, and 0.6 m in Figure 21(a) to (c), respectively. After installing sprinklers, these distances were reduced to 0.6, 0.6, and 0.35 m in Figure 21(a) to (c), respectively. Figure 21 shows the condition where the burning vehicle was near the spiral driveway. All distances fell within the spacing range observed in the field study, indicating the potential for fire spread.
The temperature range shown in Figure 22 illustrates the scenario where the burning vehicle is located far from the spiral driveway, comparing the results in Figure 22(a) to (c) for the lowest basement level, B1 basement level, and ground level, respectively. If sprinklers were not installed, the 200 °C high-temperature range extends to 1, 0.4, and 0.9 m in Figure 22(a) to (c), respectively. After installing sprinklers, these distances are reduced to 0.9, 0.9, and 0.8 m in Figure 22(a) to (c), respectively. These distances also indicate the potential for fire spread.
Regardless of whether sprinklers were installed, simulation results indicated that the maximum impact of the 200 °C can exceed 60 cm, suggesting that burning electric vehicles may pose a risk of fire spread. However, simulations also showed that this impact range can be effectively limited. Nevertheless, the flow rate and pressure of the sprinkler system needed to be reconsidered to ensure safety. From a safety perspective, the installation of sprinklers can further reduce the risk of fire spread. Therefore, it is still recommended to install sprinklers to enhance fire safety measures.
Discussion
Electric vehicles and internal combustion engine vehicles exhibited substantial differences in fire behavior, presenting unique challenges for EV fires. One key difference was the HRR, which was higher and lasted longer in EV fires due to thermal runaway reactions in batteries. This resulted in more complex fire dynamics, greater thermal radiation, and prolonged burning, often accompanied by re-ignition risks. EV fires also produced more smoke with higher concentrations of toxic gases, such as hydrogen fluoride (HF), compared to the carbon monoxide (CO) and hydrocarbons emitted by internal combustion engine (ICE) fires. In addition, EV fires spread faster as thermal runaway can quickly engulf the entire vehicle, while ICE fire spread depends on fuel leakage. EV fires are also harder to extinguish, requiring hours or days and large amounts of cooling agents to prevent re-ignition.
The stronger thermal radiation and higher peak temperatures in EV fires posed greater risks to nearby structures and vehicles. These hazards, including toxic gas emissions and re-ignition potential, made EV fires particularly dangerous in enclosed spaces like underground parking lots. Addressing the unique risks of EV fires required heightened caution and specialized strategies.
This study, through field investigations and simulation analysis, revealed the hazardous characteristics of EV fires in parking lots and the effectiveness of automatic sprinkler systems. Simulation results showed that during fires on the lowest underground level and the B1 level, smoke promptly filled the ceiling area within 300 seconds , reducing visibility to less than 10 m. Furthermore, within 500‒600 seconds, temperatures around the fire source can exceed 60 °C, and CO concentrations can reach 750 ppm, posing significant threats to human safety. The results further demonstrated that visibility was the most critical factor affected by the fire, as it was the earliest parameter to deteriorate, directly impacting evacuation and rescue operations.
In addition, the simulation results indicated that the activation of automatic sprinkler systems can effectively suppress the spread of smoke. Particularly in fire incidents far from the spiral driveway, sprinkler systems slowed the quick spread of smoke toward the driveway and created more distinct stratification between smoke and air, delaying the expansion of areas with visibility below 10 m. This effect provided more buffer time for rescue operations. In scenarios far from the spiral driveway and without sprinkler systems, high-temperature zones of 200 °C can extend up to 1.0 m (on the lowest underground level) and 0.4 m (on the B1 level), posing risks of fire spreading to nearby vehicles. However, with the installation of sprinkler systems, the high-temperature zones were curtailed to 0.9 m, effectively lowering the likelihood of fire propagation.
On the ground level, because of its partially open structure, the spread of smoke was slower, and visibility deterioration was delayed to 300‒400 seconds (near the spiral driveway) or 500‒600 seconds (far from the spiral driveway). This indicated that ground-level parking areas provided a greater buffer advantage in fire scenarios. However, underground levels, particularly the lowest level, face greater challenges due to their enclosed structure, which prevented effective smoke dissipation. As a result, visibility deteriorated more quickly, posing significant challenges for evacuation and rescue. While sprinkler systems can effectively slow smoke spread, the impact on visibility remains critical. For both ground and underground levels, future considerations for EV parking spaces should include the installation and evaluation of smoke extraction systems, especially in enclosed underground spaces where smoke cannot be effectively removed, to further improve safety in fire scenarios.
Based on these findings, it is recommended to prioritize the placement of EV parking spaces on ground or rooftop levels. If EV parking was required in underground levels, these areas should be located away from spiral driveways and equipped with automatic sprinkler systems. In addition, the installation of smoke extraction systems helped improve visibility and reduce fire hazards, particularly on the lowest underground level and the B1 level. These findings provide practical recommendations for the fire safety design and management of EV parking lots and lay the foundation for future research in this field.
The primary objective of this simulation was to evaluate the smoke propagation behavior during an EV fire in underground parking spaces and to examine the impact of sprinkler activation on fire dynamics. To ensure a conservative assessment, a car body model was placed above the battery to prevent direct contact between the sprinkler water and the battery (i.e. the fire source), allowing the simulation to better reflect fire behavior under extreme conditions. Tesla vehicle dimensions were selected for modeling due to their accessibility and precision, while the HRR was referenced from the experimental curve measured by Kang et al. Since Kang et al.'s HRR curve primarily reflects the combustion characteristics of nickel-manganese-cobalt oxide (NMC)-type batteries, the results of this study are applicable to the overall fire dynamics and smoke propagation behavior of EVs with NMC-type batteries. However, for EVs like Tesla that use lithium iron phosphate (LFP)-type batteries, fire behavior may differ, and further research is needed to validate its applicability.
Conclusions
This study evaluated the installation locations and areas of electric vehicle parking and charging stations in large shopping mall parking lots through field studies and numerical simulations. The conclusions were based on objective data and analysis. The findings of the study were illustrated as follows:
The priority order for selecting the locations and areas for electric vehicle parking and charging stations is as follows: Outdoor areas on the ground floor of the building, rooftop levels, above-ground floors, and lastly, underground floors. If the installation of electric vehicle parking and charging stations must be located indoors, and automatic sprinkler systems are available, the priority order is as follows: Above-ground floors far from spiral driveways, above-ground floors near spiral driveways, B1 basement levels far from spiral driveways, B1 basement levels near spiral driveways, and finally, basement levels below B2. Therefore, above-ground floors remain the preferred choice. Without considering water supply capacity, simulation results showed that while sprinkler systems cannot directly extinguish fires, they did play a role in controlling hazardous environmental parameters, except for visibility. This attenuated the extent or severity of hazards. Coordinating the placement of charging stations and parking areas for electric vehicles can provide emergency responders and firefighters with more time for rescue operations. In the absence of sprinkler systems, hazardous parameters, such as carbon monoxide, temperature, and visibility would more quickly affect the surrounding spaces of the fire. Therefore, the installation of sprinkler systems was still recommended. Vehicle parking is often overly dense, and with the increasing use of plastic materials in car bodies, simulation results revealed that the surrounding temperature during an electric vehicle fire still posed a risk of fire spread. Therefore, it is recommended to install automatic sprinkler systems to prevent the spread of fire. However, given the unique characteristics of electric vehicle fires, the radiation pressure and water volume of the automatic sprinkler system should be further studied and optimized to ensure its effectiveness and safety. Owing to the significant impact of visibility, and the difficulty of controlling it solely through sprinkler systems, it was recommended to consider smoke extraction or removal equipment in the parking lots of large shopping malls to more effectively maintain safety in the environment. Electric vehicles present greater fire hazards and uncertainties than traditional internal combustion engine vehicles, including higher heat release rates, longer burn durations, more toxic smoke, and faster fire spread. These risks demand heightened attention to fire safety and risk assessment when planning EV parking and charging facilities. The HRR in this study was based on the curve measured by Kang et al., which primarily applies to the combustion behavior of NMC batteries. However, for EVs using LFP batteries, their fire behavior may differ, and further research is needed to validate its applicability.
Footnotes
Conflicting interests
The authors declared no potential conflicts of interest with respect to the research, authorship, and/or publication of this article.
Funding
The authors received no financial support for the research, authorship, and/or publication of this article.