
Abstract
Firefighters are exposed to the risk of burns at fire scenes. In 2020, the National Fire Agency of the Republic of Korea surveyed 50,527 firefighters and identified 242 burn-related incidents. The body parts affected by these burns were the hands (28.51%), ears (10.74%), and neck (10.33%), with hands and facial areas accounting for ∼50% of all burns. This trend implies that gloves and hoods do not provide sufficient protection against burns. Firefighters alternate between activity and rest during firefighting operations to enhance mission efficiency. However, the accumulated heat in their hood and gloves from these repeated cycles has not been considered thus far. This study investigated thermal accumulation patterns based on the moisture content of hoods and gloves, reflecting repeated cycles of work and rest for firefighters. Consequently, heat accumulation occurred in a dry state in both the hood and gloves, and the degree of heat storage was higher in the hood. The glove stored heat even when wet because of its multilayer structural characteristics. These results suggest that repeated activities (work–rest) with gloves and hoods under dry/wet conditions can generate residual heat and heat accumulation, causing burns on the hand and face. This study clearly demonstrated the impact of the moisture conditions of gloves and hoods in repetitive situations where they are exposed to relatively low levels of heat radiation and are then subject to rest periods. The results of this study are expected to be valuable in designing new protective gear to prevent burn injuries and developing efficient firefighting tactics.
Introduction
Firefighters wear personal protective equipment (PPE) during fire suppression to protect themselves from flames, radiant heat, and other hazards. The PPE includes firefighter protective clothing (FPC), an air respirator set, helmets, fire gloves, fire hoods, and safety boots. Most PPE materials are thermally insulating; however, the work environments during firefighting become excessively hot under prolonged exposure. According to the NFPA 1584 standard, 1 firefighters must rest for a minimum of 20 min after working with a self-constrained breathing apparatus (SCBA) cylinder or after 40 min of intense work without SCBA. During these rest periods, effective recovery through rehabilitation helps maintain working efficiency. Therefore, the internal temperature of the PPE fluctuates because of repeated activity and rest, necessitating the consideration of residual heat generation and accumulation within the equipment.
Firefighters sweat significantly when the ambient temperature increases during intense firefighting activities, thereby soaking the clothes in contact with their skin. 2 Consequently, there is considerable moisture inside PPE because of the fire-extinguishing water and sweat generated during these activities. The moisture trapped in the garments alters their thermal properties, such as thermal conductivity within the protective clothing system, thereby significantly affecting heat transfer.3–6 Moreover, moisture trapped in fabric layers can evaporate, move toward the skin, and condense, potentially causing burns.3,5 Su et al. 7 investigated the moisture distribution and transfer in an FPC exposed to low-intensity radiation, whereby exposure to dry heat gradually decreased the moisture content in the fabric layers, whereas hot steam increases the moisture content and accelerated moisture transfer to the skin surface. Thus, the moisture content in the FPC when exposed to hot steam could cause steam burns. The same results are expected for fire hoods and gloves. Steam burns can occur suddenly without direct contact with flames, 4 resulting in more severe injuries than dry burns. Firefighters who suffer steam burns often fail to immediately recognize the rising internal temperatures of their equipment because of the hot fire and thick PPEs, only discovering burns during rest or upon return. Consequently, they may continue to work at a fire scene even when injured, potentially worsening their condition.
Several studies investigated the effects of moisture and humidity on PPE using various approaches. Moisture distribution and quantity, the structure of the fabric system, and exposure intensity affect the thermal protective performance (TPP) of clothing. 8 Malaquias et al. 9 correlated the initial water content under exposures to heat in the range of 0–80 kW/m² and second-degree burn times. External moisture increased the burn times, whereas internal moisture has the opposite effect at high heat fluxes. Moreover, several studies explored the effects of moisture under high-level radiant heat or flash fires.2,10–14 Zhang et al. 13 investigated the effect of exposing the moisture within outer shells and thermal liners to an intense heat of 84.3 kW/m² from a flash fire on the heat and moisture transfer and consequently, skin burns. Further, studies have examined the effects of moisture under medium-intensity levels of radiant heat.15,16 Zhang et al. 15 observed that external moisture increased the burn times under exposure to radiant heat of 15.4 kW/m², whereas the presence of moisture in the thermal liners reduced the burn times. The effects of moisture on firefighting gear exposed to low-level radiant heat have also been investigated.8,17–20 Barker et al. 20 analyzed the effect of moisture levels in garments under exposure to radiant heat of 6.3 kW/m² and found that lower fabric moisture content correlates with decreased time to reach second-degree burns. However, studies on moisture and humidity in PPE focus on FPC and involve experiments and numerical simulations that do not replicate actual fire scenarios. Studies on the influence of moisture under radiant heat conditions that induce burns have mainly focused on TPP and second-degree burn time. Therefore, they have not considered the repeated activity–rest situations of the firefighters. Moreover, the heat accumulation patterns within the gear have not been considered.
Veghte 21 investigated the effect of moisture on the burn potential of firefighting gloves and indicated that wet gloves provided more thermal protection under exposure to a heat of 2.3 cal/cm² compared to dry gloves. Kim et al. 22 evaluated the usability of wet gloves under exposure to low-intensity radiant heat and demonstrated that wet gloves have a lower risk of causing first-degree burns than dry gloves. Kim et al. 23 confirmed through a full-scale fire test the higher average temperature of wet gloves than that of dry gloves after flame exposure. However, these studies overlooked scenarios involving repeated firefighting activities and rest, and they did not consider the residual heat accumulation emitted from the gear during exposure.
Therefore, this study evaluates the contribution of moisture to heat accumulation during activities using firefighting hoods and gloves, which are the most vulnerable to burn protection. The assessment entails both material and complete product assessments, assuming repeated application of heat exposure and removal during the firefighters’ activity–rest cycles. To examine a relatively low-temperature range of 40–70 °C, which is below the temperatures that typically cause severe burns, the study exposes hoods and gloves to low-radiant heat fluxes of 3 and 5 kW/m², respectively, investigating the effect of their moisture state on heat accumulation. This study provides technical insights into the thermal accumulation in hoods and gloves worn by firefighters during actual firefighting situations.
Experimental setup
Materials
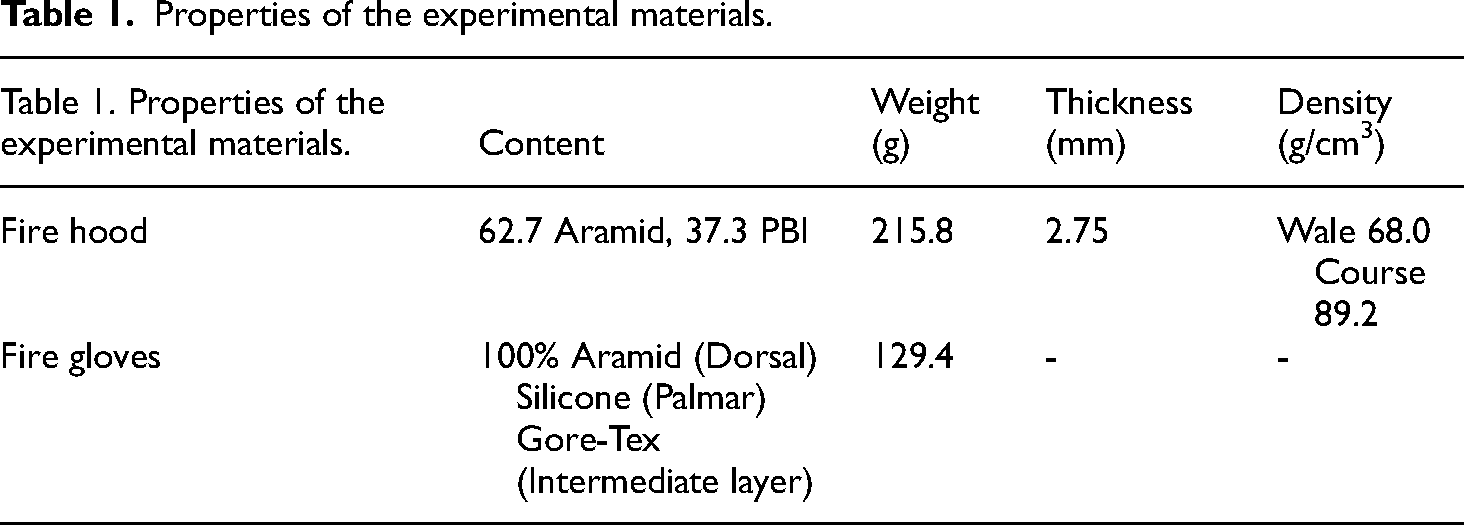
Firefighting hoods and gloves used by South Korean firefighters during fire suppression were used as the experimental materials. The firefighting hood used in the experiment was composed of aramid (62%) and polybenzimidazole (PBI, 38%) for both the outer shell and liner. The firefighting gloves were composed of 100% aramid on the dorsal, silicone on the palm, and para-aramid and Gore-Tex for the lining and intermediate layers. The properties of the experimental materials are listed in Table 1.
Properties of the experimental materials.
Evaluation
Material assessment was conducted using parts of the PPE samples, and a complete product assessment was conducted using the entire PPE sample. Table 2 lists the differences between the two assessment conditions. The material assessment considers only the heat transfer from the radiant heat. According to ISO 5660-1, referring to the cone-calorimeter method, 24 100 × 100 mm specimens were positioned at a distance of 25 ± 1 mm from the top of the cone heater. The hood was cut to the size of the test specimen. The gloves were separated at the middle finger and prepared as specimens. The materials were continuously exposed to radiant heat from a cone calorimeter heater. In contrast, the complete product assessment comprehensively considers the effects of radiant, flame, and convective heat. The evaluation was conducted under conditions that mimicked the actual compartment fire operations of firefighters. In particular, the compartment facility was a container structure measuring 3.0, 3.0, and 2.4 m in length, width, and height, respectively, with a front opening of 1.8 (width) × 2.1 m (height). This opening enables firefighters to enter and exit the fire compartments. The entire PPEs were exposed to various heat-transfer conditions using a sand burner manufactured according to ISO 13784-2 ignition source–burner specifications. 25 The sand burner was a propane gas burner with an upper surface finished with inert, porous sand. The burner dimensions were 300 mm in width, 300 mm in length, and 200 mm in height, and its structure allowed the gas flow to be evenly released through the opening. The sand burner was positioned at the center bottom of the compartment, and the mannequin wearing the hood and gloves was positioned at a distance determined through preliminary experiments.
Differences between two assessment conditions.

Scenario
Both assessments reflected the same three scenarios. Each scenario instructed firefighters to enter the fire compartment, work for a certain period, and exit the compartment to rest outside while wearing their equipment. The scenarios differed in terms of the dry/wet conditions of the equipment, methods of heat exposure and removal during work, and whether the equipment was removed during the resting period. The scenarios are as follows:
Scenario 1: Firefighters enter the fire compartment wearing dry hoods and gloves. They work, exit, and rest outside while wearing their equipment. Scenario 2: Firefighters enter the fire compartment wearing wet hoods and gloves. They work, exit, and rest outside while wearing their equipment. Scenario 3: Firefighters enter the fire compartment wearing dry hoods and gloves. They work, exit, and remove their equipment before resting.
Evaluation scenarios were implemented by incorporating Scenarios 1–3. Table 3 lists the setup of the scenarios for the specimens in both evaluations.
Scenario composition for each experimental specimen.

The material assessment was repeated three times for each scenario, whereas the complete product was assessed once for each scenario. Figure 1 illustrates the procedure for a complete product assessment.

Procedure of the complete product assessment.
Specimen conditioning
Dry specimens were prepared according to the ISO 17492 standard. 26 The specimens underwent five washing and drying cycles, followed by conditioning at a temperature of 20 ± 2 °C and a relative humidity of (65 ± 2)% for over 24 h. Wet gloves were conditioned following NFPA 1971 standard. 27 They were fully immersed in water at 21 ± 3 °C for 2 min while worn, removed from water, and oriented with the glove openings downward to drain excess water for 5 min. No separate guideline was provided for the conditioning procedure of the wet hoods; as such, this was conducted using the same procedure as that of the gloves. Table 4 shows the moisture contents of the specimens after wet conditioning.
Moisture contents of the specimens after wet condition.
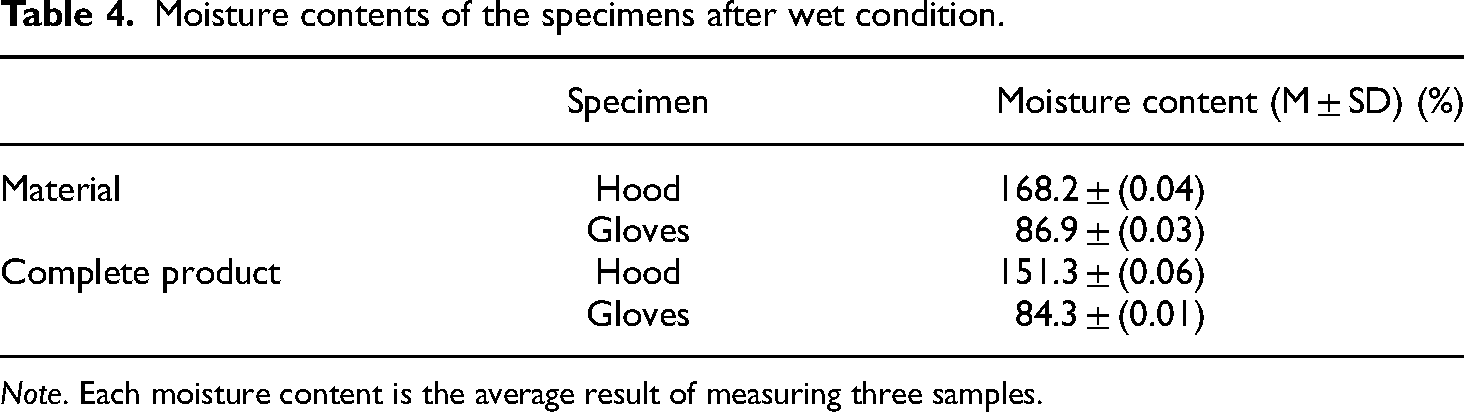
Note. Each moisture content is the average result of measuring three samples.
Temperature measurements
The two assessments compared the temperature changes in the specimens based on heat exposure and removal. A pigskin layer, which closely resembles human skin, was positioned at the bottom layer of the fabric structure of the equipment to measure the temperature inside the equipment. The temperature was measured using K-type thermocouples at 1-s intervals, with a diameter of 0.32 mm and a measurement range of up to 200 °C. The measured value was 100 °C (−0.6 °C). In the material assessment, the thermocouple was placed between the bottom layer of the specimen and the pigskin, and the temperature change due to radiant heat exposure in the center of the cone calorimeter, as outlined in ISO 5660-1, was recorded. In the complete product assessment, thermocouples were installed at a height of 1.8 m from the floor in each corner of the fire compartment to control the operation. Similar to the material assessment, the thermocouple was placed between the specimen and the pigskin, and the temperature changes were recorded in areas commonly injured by burns in firefighters, such as the area between the cheek and ear, as well as the fingers. Figure 2 illustrates the placement of the thermocouples inside and outside the specimen for the complete product assessment.
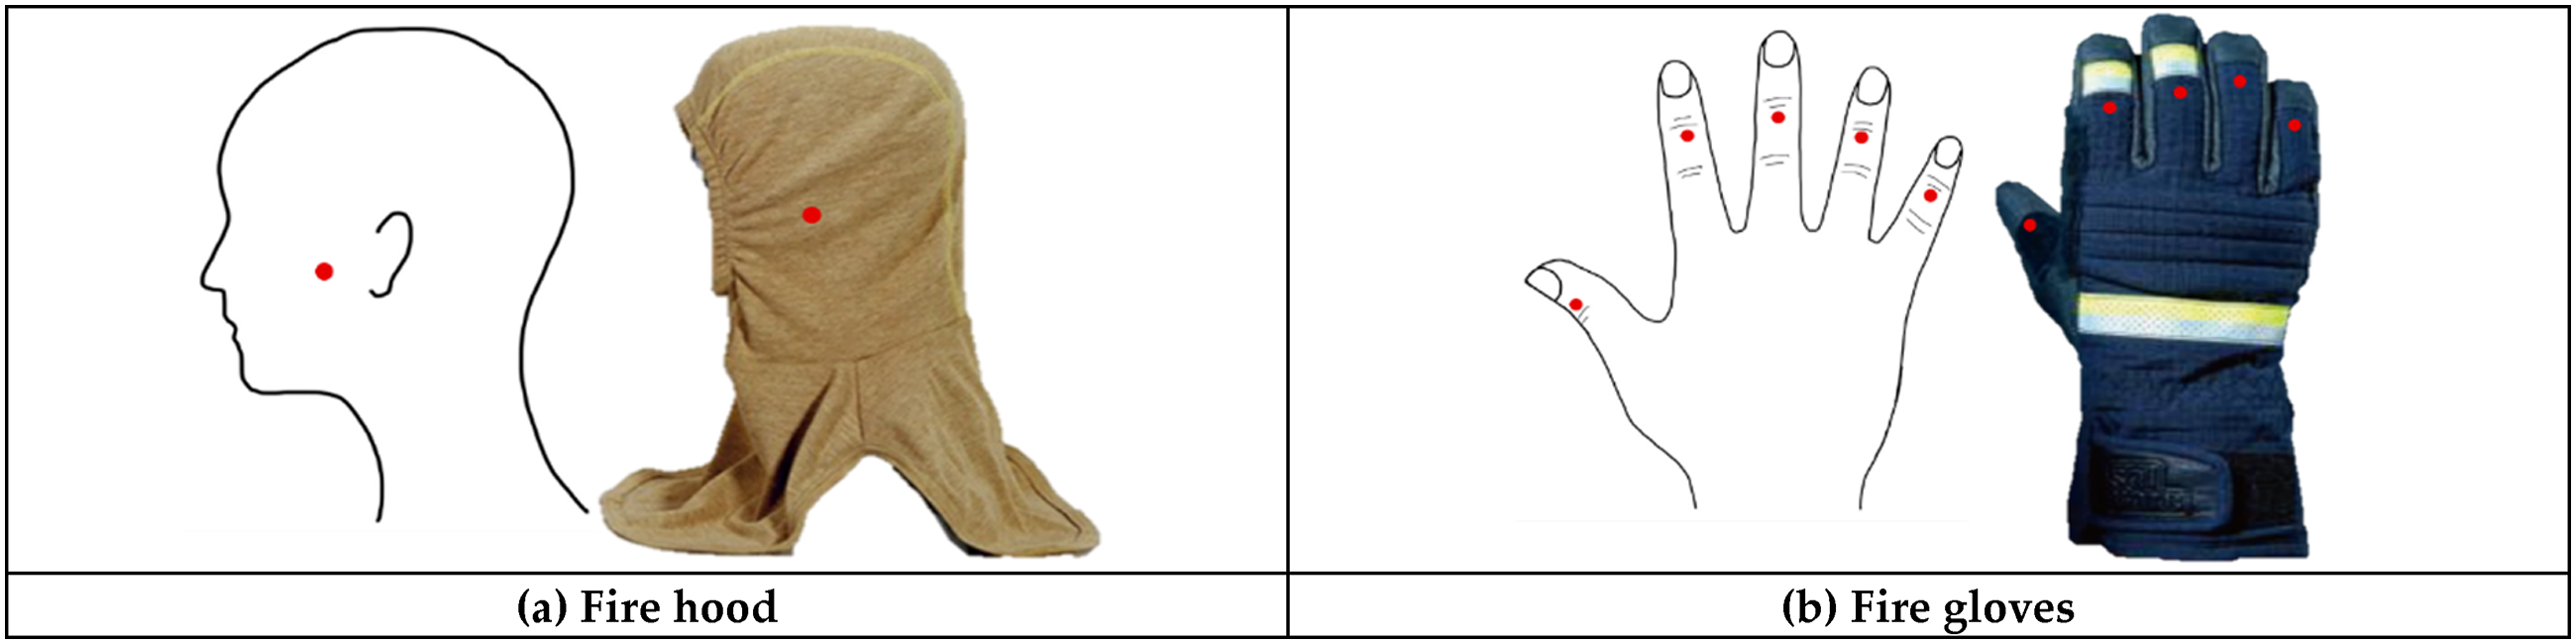
Placement of the thermocouple attached inside and outside the specimen for the complete product assessment. (a) Fire hood (b) Fire gloves.
Pre-experiments
Pre-experiments were conducted to determine the appropriate radiant heat exposure and duration for the specimens used in the main experiments. This study focused on assessing the effect of moisture trapped in the gear on residual heat accumulation patterns in fire scenes. Therefore, in the pre-experiments conducted under conditions identical to the main experiments, the heat source and exposure time required for the temperature inside the equipment to reach 40–70 °C were determined.
Material assessment
Each specimen was exposed to a constant radiative heat flux for an extended period using the test apparatus specified in ISO 5660-1 (ISO, 2015). According to the test method outlined in the standard for the vertical direction, the specimen holder was positioned such that the exposed surface of the specimen was 25 mm away from the bottom surface of the cone heater. The specimen was then exposed to the radiative heat flux from the cone heater in the vertical direction, with the ignition device attached. In particular, the hood and glove specimens were exposed to heat fluxes of 4 and 5 kW/m², respectively, for 5 min. Figure 3 shows the internal and external temperature changes in the hood and glove specimens. As a result of 5 min of exposure, the internal temperatures of the hood and gloves specimens increased to 69.7 and 56.5 °C, respectively; consequently, the exposure time for the specimens was determined to be 5 min.

Internal and external temperature changes of the hood and glove specimens during the material assessment.
Complete product assessment
The specimens were exposed to a heat flux using a sand burner inside a constructed container. Figure 4 illustrates the heat fluxes applied to the hood and gloves. The mannequin was positioned at 1 m away from the burner, with the hood placed at 1 m and height of 1.75 m from the burner, and the gloves at a distance of 0.7 m and height of 1.25 m. After 60 s, the heat fluxes stabilized at 3.81 and 5.14 kW/m² for the hood and gloves at their respective positions, respectively. The measured heat fluxes were consistent with those applied during material assessment. Figure 5 shows the internal and external temperature changes in the hoods and gloves. As a result of 5 min of exposure, the internal temperatures of the hood and gloves specimens increased to 50.8 and 66.4 °C, respectively; thus, the exposure time for the specimens was determined to be 5 min.

Heat flux at the hood and glove position during the complete product assessment.

Temperature inside and outside the hood and gloves during the complete product assessment.
Based on the pre-experiment results, the distance between the burner and mannequin was set to 1 m for the complete product assessment. The specimens were exposed to heat for 5 min, considering the temperature changes inside the equipment, followed by a 10 min period of rest outside the compartment. At this point, the combustion heat of the propane gas burner was 46.4 kJ/g, and the total gas flow rate during heat exposure was 245.83 g/s. Therefore, the heat release rate of the burner was calculated to be 11,406.6 kW. Figure 6 illustrates the internal configuration of the fire compartment and the mannequin functions during the complete product assessment. Each mannequin performed its role based on the evaluation scenario. Figure 7 shows the placement of the thermocouple and heat-flux measurement during the complete product assessment. Figure 8 schematically depicts the procedures of the assessments.

Internal configuration of the fire chamber and role of mannequins in the complete product assessment.

Placement of the thermocouple and heat-flux measurement during the complete product assessment.
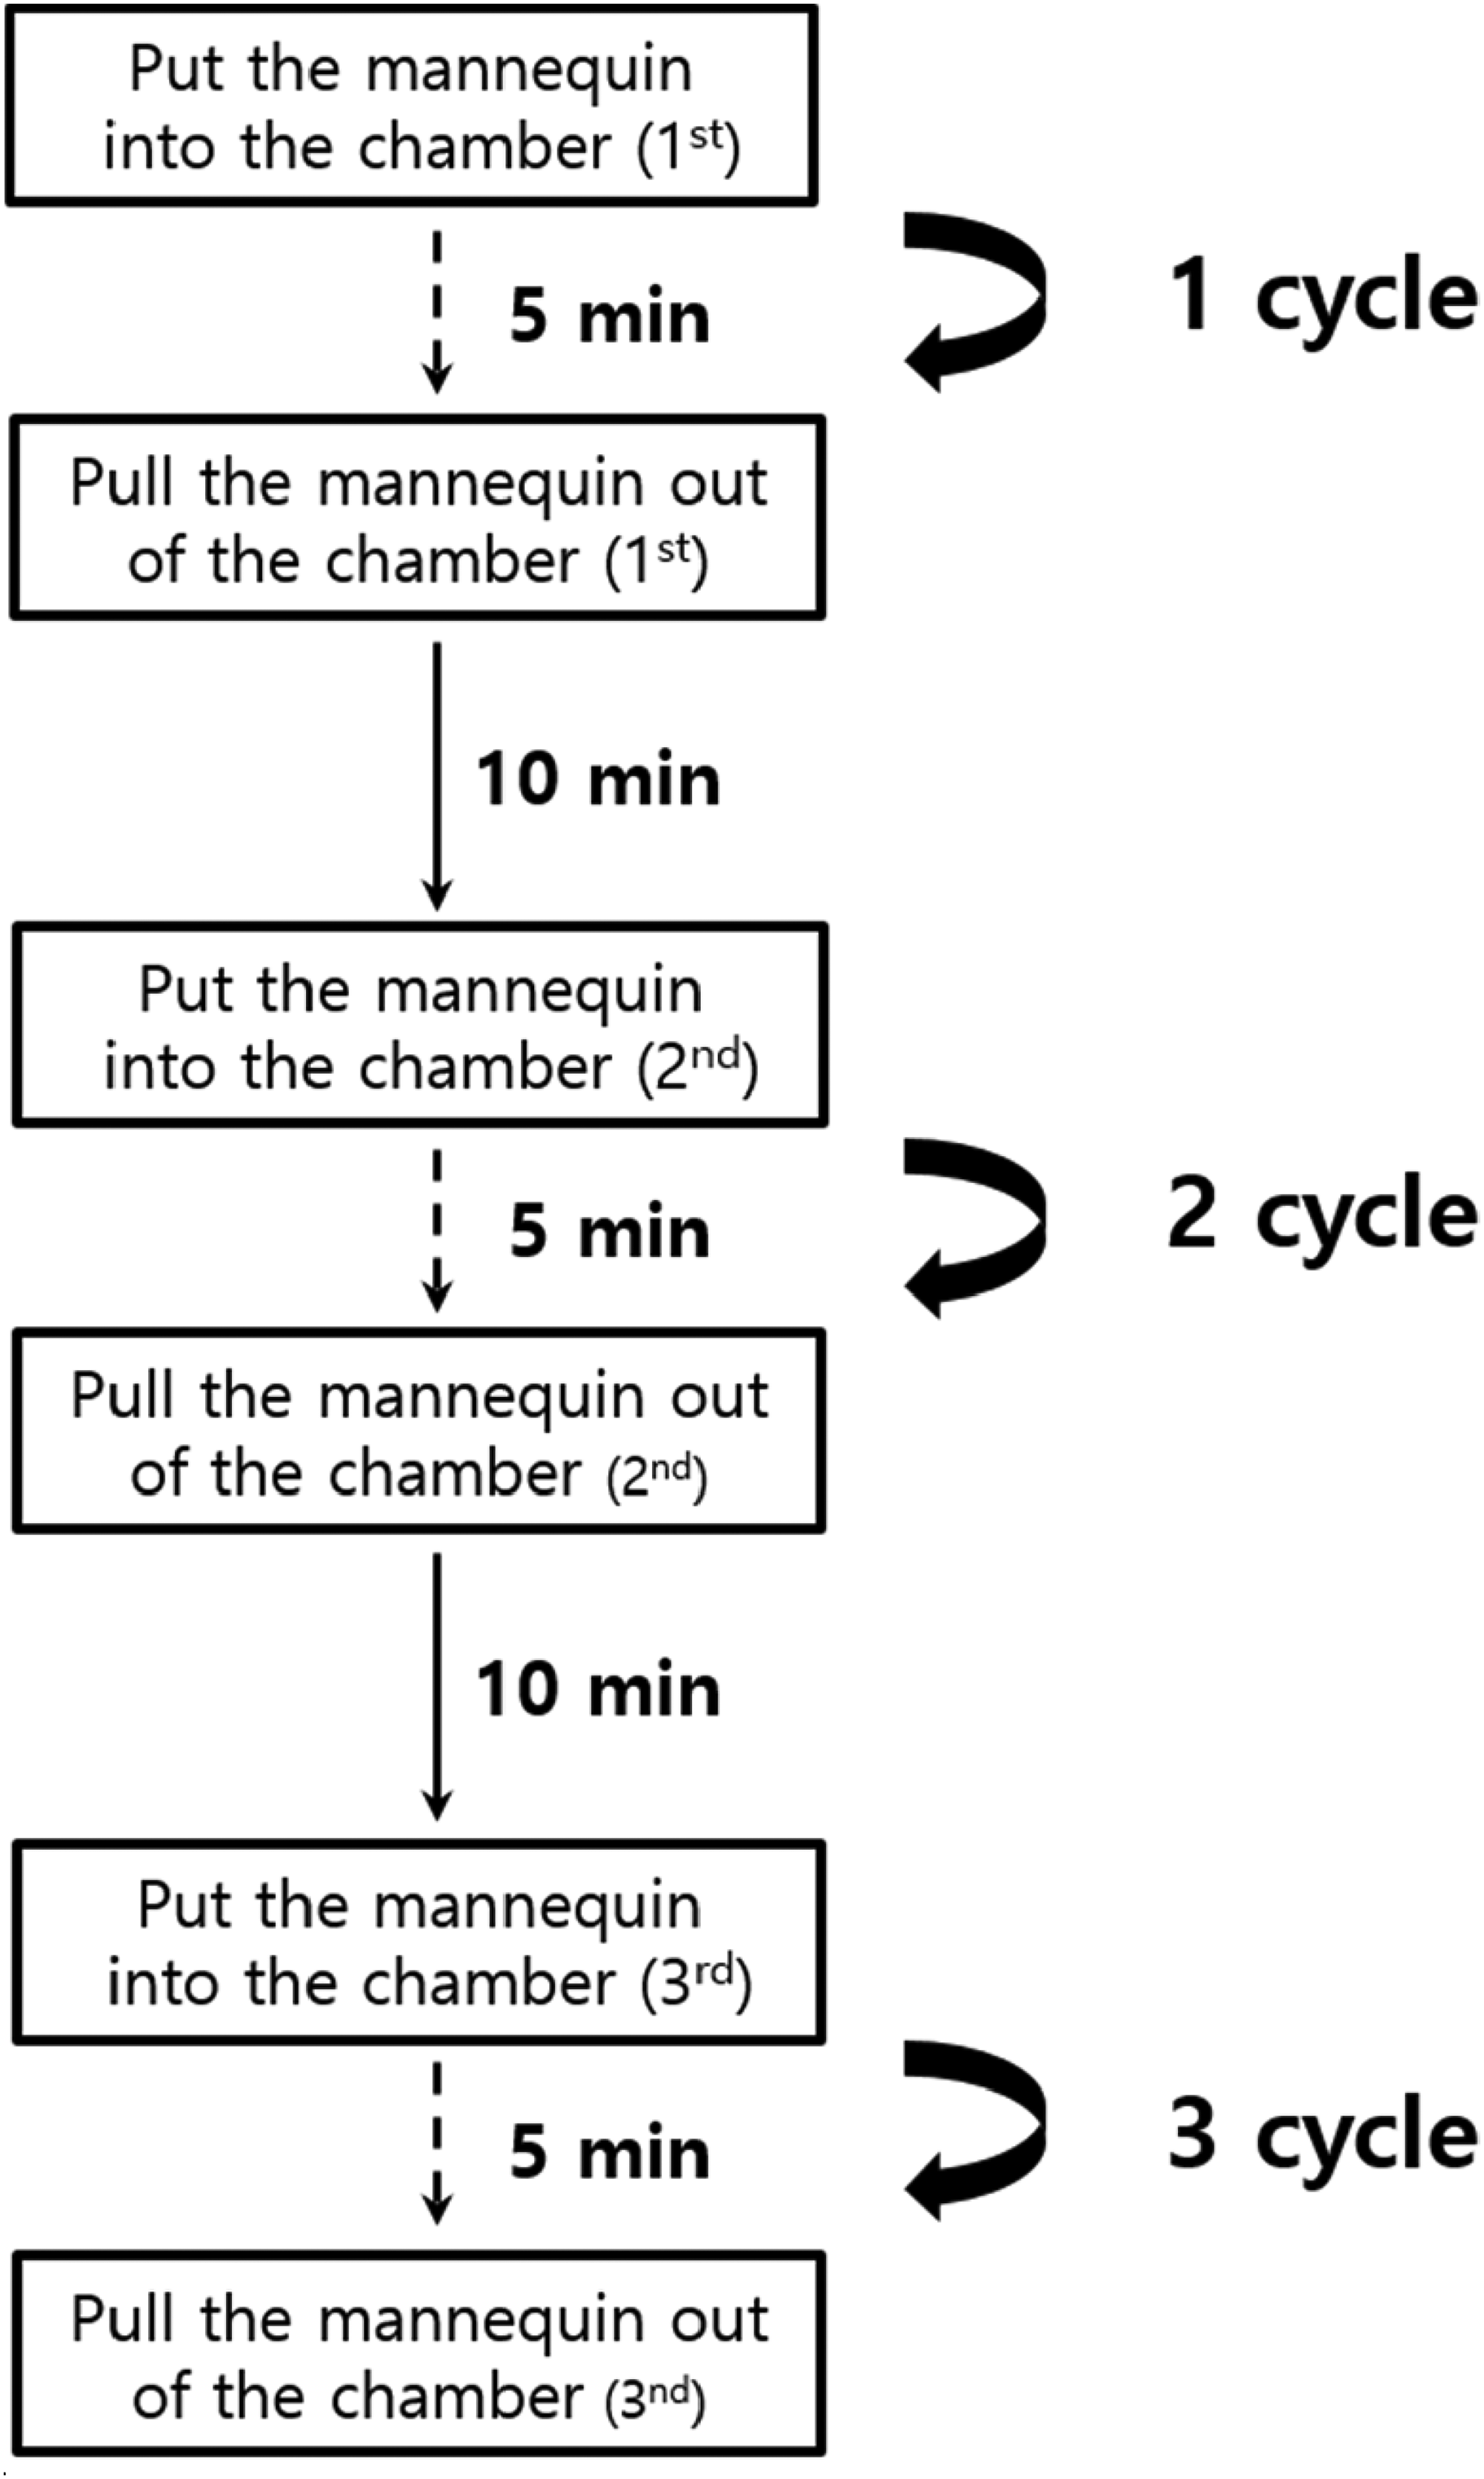
Schematic of the evaluation procedures.
Results and discussion
Fire hood
Figure 9 shows the temperature changes inside the hood for the three scenarios during the material assessment. Each temperature change curve is the average of three measurements, with error bars representing the standard deviation of the values. The maximum temperature inside the hood increased progressively with each iteration when the dry hood was subjected to three cycles of heat exposure and removal. The maximum temperatures changed from 68.8 °C to 72.0 °C and then to 75.2 °C, resulting in a 9.3% increase from the first to the third heat exposure. The temperature rise was 48.0 ± 0.6 °C when the dry hood material was repeatedly exposed to heat, and the temperature decreased by 44.5 ± 0.5 °C when the heat was removed, indicating that the temperature rise was greater than the temperature decrease, resulting in a continuous increase in the maximum temperature with repeated heat exposure–removal cycles. In contrast, despite repeated heat exposure for the wet hood in the two scenarios, the maximum internal hood temperature was maintained at an average value of 50.9 °C. The wet hood exhibited a limited temperature increase during heat exposure. Compared with the first heat exposure, the temperature increase was 5.1% during the third heat exposure, and the detached wet hood had a temperature increase of 3.2%. Wet hoods exhibited a lower rate of temperature increase during repeated heat exposure compared to dry hoods.
Temperature of the thermocouple inside the hood for the three scenarios in the material assessment.
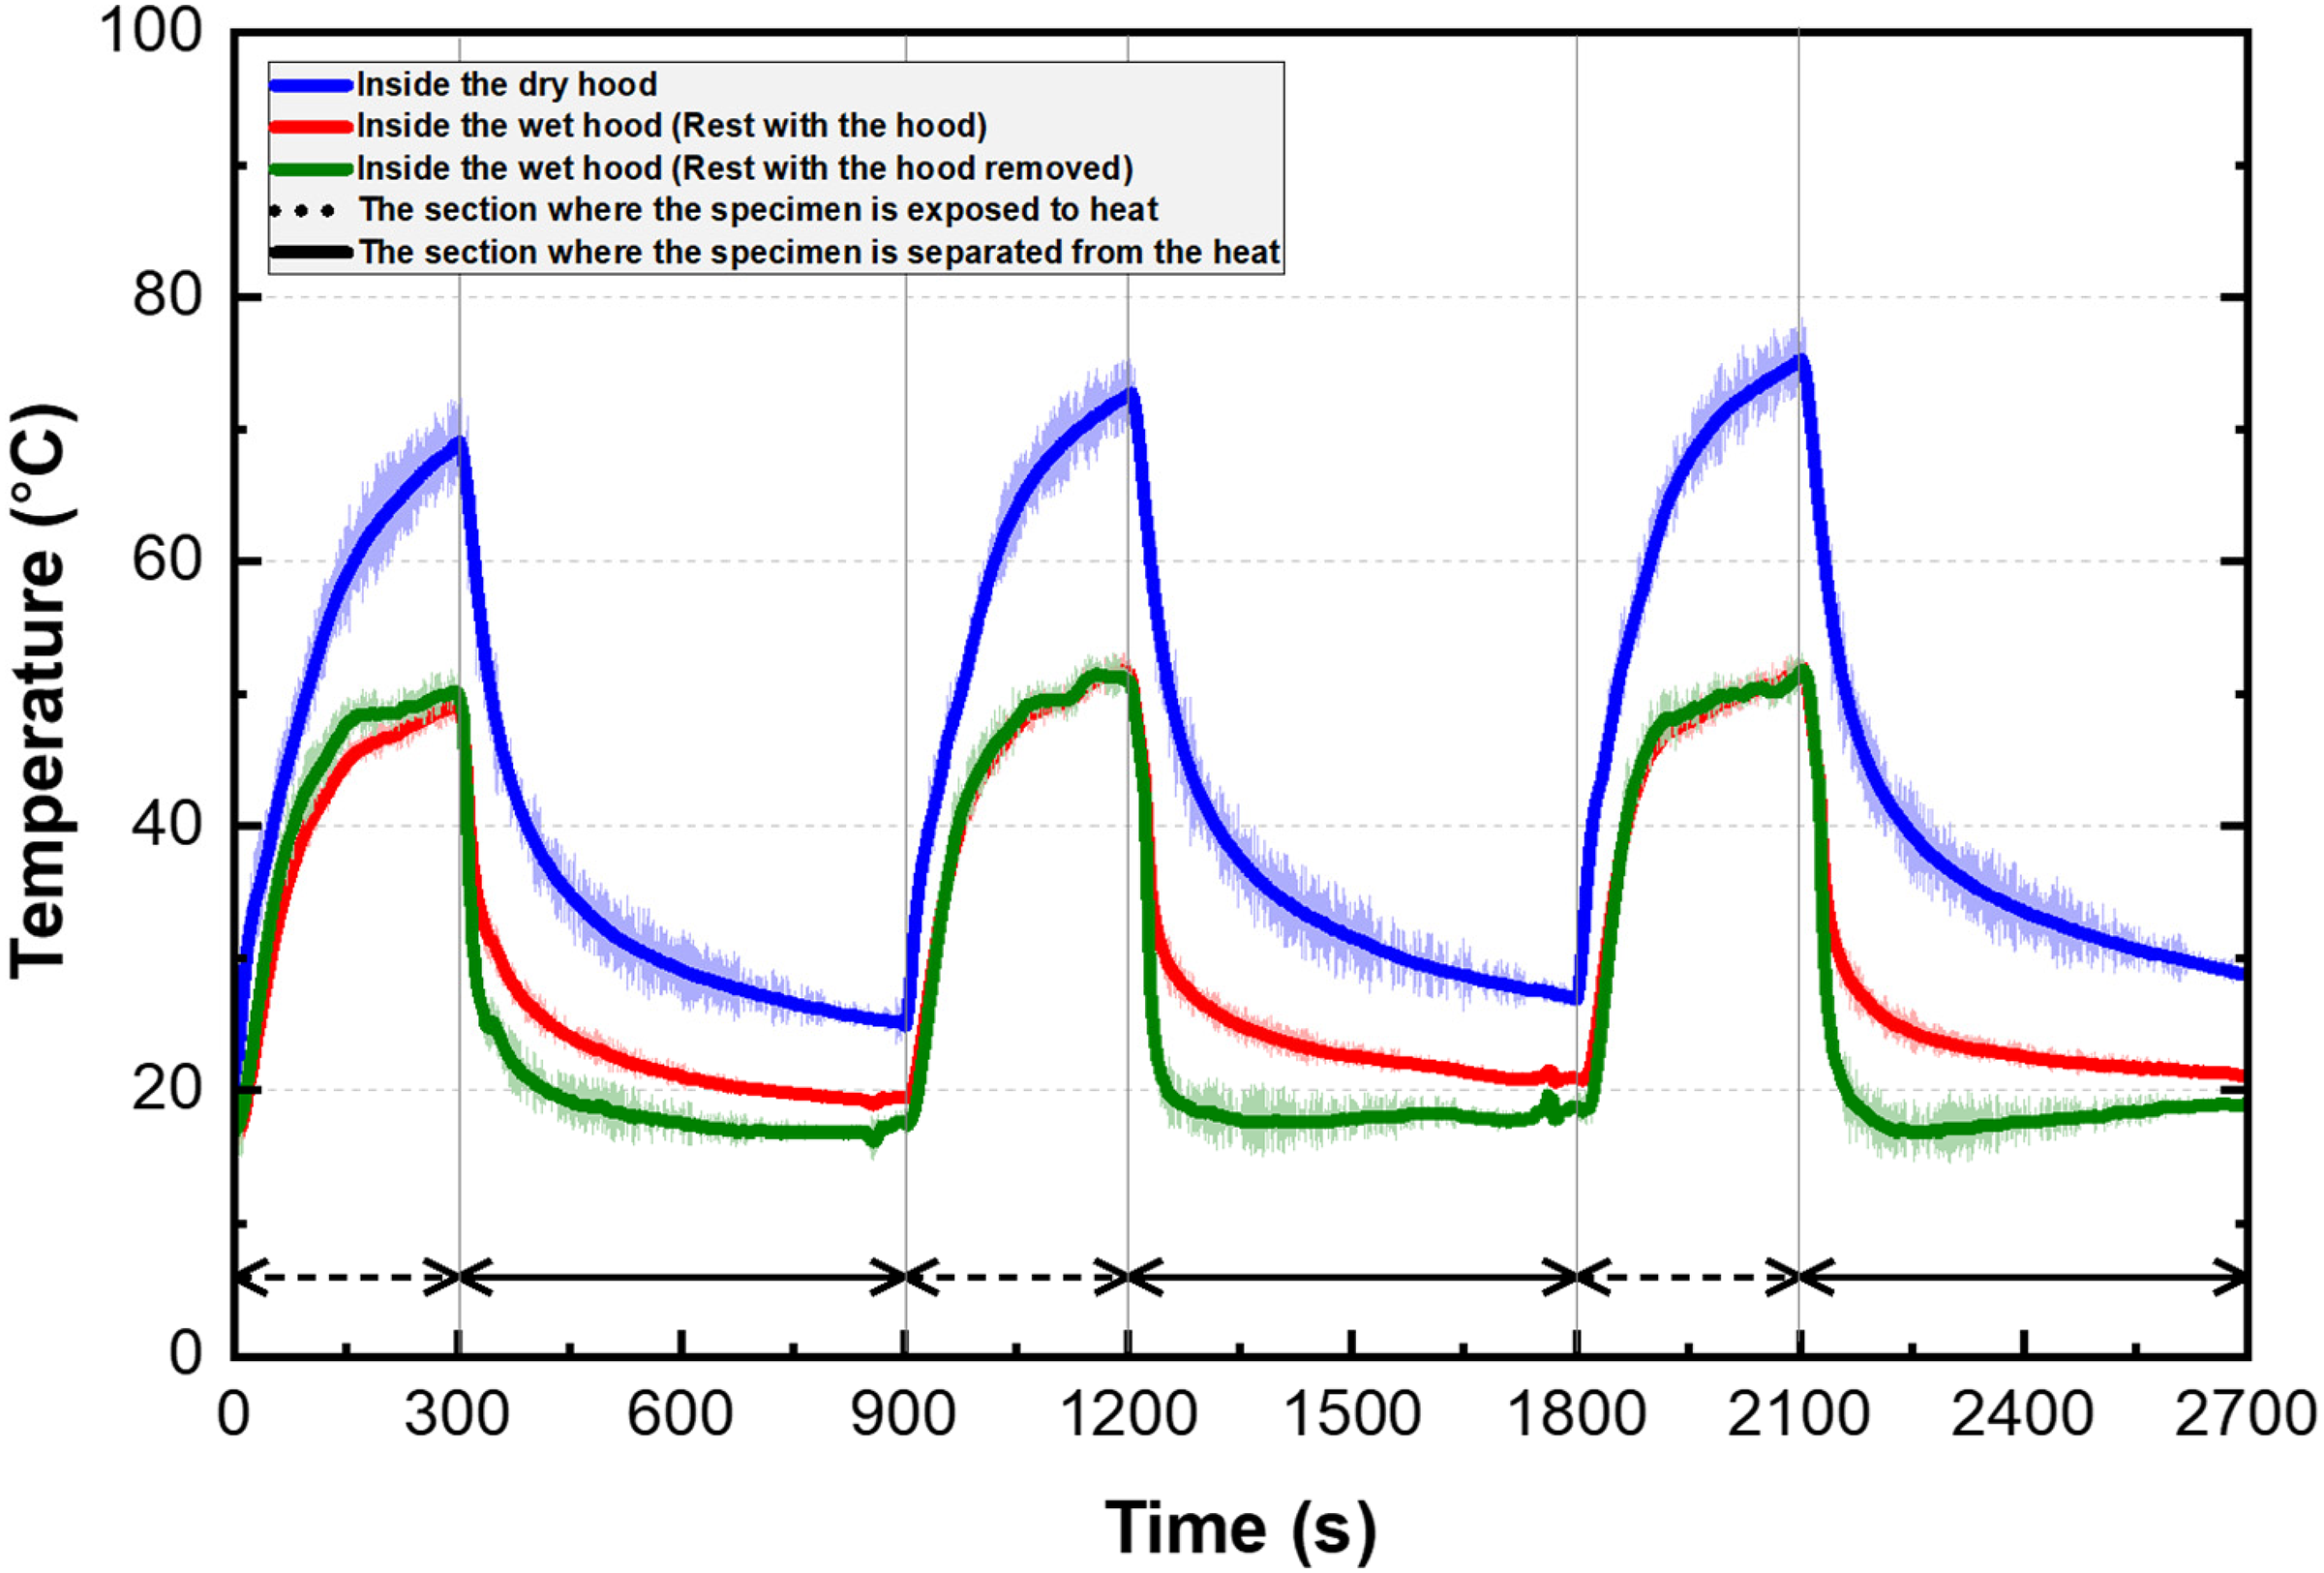
Figure 10 shows the temperature changes inside the hood for the three scenarios during the complete product assessment. The maximum internal temperature of the dry hood gradually increased with each heat exposure cycle. The temperature changed from 63.4 °C to 77.5 °C and then to 81.4 °C, resulting in a 28.4% increase from the first to third heat exposure. The average temperature rise was 32.2 ± 3.1 °C when the dry hood was repeatedly exposed to heat, and the average temperature decrease was 21.9 ± 1.9 °C when heat was removed. The increased value of the temperature increase suggests the continuous increase in the maximum temperature inside the hood with repeated cycles of heat exposure and removal. In contrast, for the wet hood in the two scenarios, the maximum internal hood temperature remained consistently at approximately 58.8 °C and 59.7 °C despite repeated heat exposure. The wet hoods exhibited a limited temperature increase during heat exposure. Compared to the first heat exposure, the third heat exposure showed a temperature decrease of 0.3%, and the detached wet hood showed a temperature decrease of 1.7%. This implies the absence of cumulative heat accumulation with repeated heat exposure cycles in the wet hoods. The wet hoods exhibited a significantly lower rate of temperature increase during repeated heat exposure compared to that of the dry hoods.

Temperature of the thermocouple inside the hood for three scenarios in the complete product assessment.
The two assessments of the hoods showed similar heat accumulation levels. The dry hoods exhibited a gradual increase in the maximum internal temperature with each heat exposure step, whereas the wet hoods had limited temperature rise, resulting in minimal heat accumulation. In addition, the internal temperature changes in the hoods in Scenarios 2 and 3 were similar.
Fire gloves
Figure 11 shows the temperature changes inside the gloves for three scenarios during the material assessment. The temperature change history is the average of three measured temperatures, with error bars representing the standard deviation between the values. The maximum internal temperature of the gloves increased progressively with each cycle when the dry gloves were subjected to three cycles of heat exposure and removal. The maximum temperatures changed from 56.2 °C to 63.6 °C and then to 66.5 °C, resulting in an increase of 18.3% from the first to the third heat exposure. For the gloves subjected to Scenario 2, the maximum internal glove temperature increased from 47.4 °C to 51.9 °C and then to 53.4 °C, showing a 12.7% increase from the first to the third heat exposure. In Scenario 3, the maximum internal glove temperature increased from 48.4 °C to 49.6 °C and then to 53.0 °C, resulting in a 9.5% increase from the first to the third heat exposure. All three scenarios demonstrated heat accumulation within the gloves with repeated heat exposure. The gloves in Scenario 1 resulted in higher heat accumulation than the other gloves.

Temperature of the thermocouple inside the gloves for the three scenarios in the material assessment.
Figure 12 shows the temperature changes inside gloves for the three scenarios during the complete product assessment. The maximum internal temperature of the gloves increased progressively with each cycle when the dry gloves were subjected to three cycles of heat exposure and removal. The maximum temperatures changed from 65.2 °C to 83.1 °C and then to 85.7 °C, resulting in a 31.4% increase from the first to the third heat exposure. For gloves subjected to Scenario 2, the maximum internal glove temperature increased from 59.5 to 67.3 °C when repeatedly exposed to heat, showing a 13.1% increase from the first to the third heat exposure. In Scenario 3, the maximum internal glove temperature increased from 52.4 °C to 59.1 °C, resulting in a 12.8% increase from the first to the third heat exposure. All gloves tested under the three scenarios demonstrated heat accumulation with repeated heat exposure. The gloves in Scenario 1 exhibited higher heat accumulation than the other gloves.

Temperature of the thermocouple inside the gloves for the three scenarios during the complete product assessment.
The two assessment methods of the gloves exhibited similar trends of heat accumulation. In both evaluations, all gloves demonstrated a gradual increase in the maximum internal temperature with each heat exposure step. However, the degree of heat accumulation varied. Dry gloves exhibited higher heat accumulation than wet gloves. Among the wet gloves, those subjected to Scenario 2 had slightly higher heat accumulation than those subjected to Scenario 3.
This study revealed that both the dry and wet conditions of hoods and gloves significantly affect the generation and accumulation of residual heat. Generally, because water has a higher thermal conductivity than air, the temperature was predicted to rise more quickly when the fabric was soaked. However, this study confirmed that in the case of firefighters’ repetitive patterns (5 min of heat exposure and 10 min of rest), the moisture in the hood can have a beneficial effect by mitigating heat transfer. In this study, the moisture trapped inside the equipment limited the temperature increase, compared to the dry conditions when textiles were exposed to heat. Moreover, when heat was removed, lower temperatures were achieved owing to evaporation. Therefore, dry hoods and gloves experienced a higher rate of temperature increase than wet hoods when exposed to heat, accumulating heat continuously with repeated work–rest cycles. In contrast, wet gloves showed heat accumulation with repeated activities, indicating that wet fabrics have higher thermal conductivity, thereby accelerating heat transfer. However, unlike wet hoods, wet gloves exhibited good thermal storage characteristics. As hoods are made of woven fabrics with inner and outer layers, whereas gloves are made of thick multilayer materials (outer shell, intermediate layer, and lining), the structural differences reduced the heat dissipation in the gloves. Removing the equipment during rest periods promoted heat dissipation more than while wearing it; however, the degree of residual heat accumulation was largely unaffected by equipment removal with repeated heat exposure.
The aim of this study was to investigate the impact of the wetness of the hood and gloves on heat accumulation, considering the cyclic pattern of firefighter activities (activity–rest) at a fire scene. When the firefighter mannequins wore dry equipment and wet gloves during the simulated activities, heat accumulated owing to repeated heat exposure. However, when wearing a wet hood, the heat accumulation was relatively minimal. These results can help firefighters recognize potential hazards, such as burns, while wearing their actual hoods and gloves in real-life situations. Therefore, considering the fabric structure of the firefighting hoods, gloves, and firefighting activities is crucial to preventing burn injuries and devising safe firefighting tactics. The effect of moisture at relatively low levels of heat exposure is influenced by factors such as the amount of heat and moisture and the insulation properties of the fabric. In the future, the impact of moisture on heat accumulation when the moisture content changes during exposure should be evaluated. In this study, the equipment was constrained to low heat-flux conditions to simulate a relatively low temperature range of 40–70 °C. Further research is warranted to investigate heat generation and accumulation under high-velocity or flash fire conditions, wherein firefighters may be engulfed in sudden flames.
Conclusions
This study compared the extent of heat accumulation in fire hoods and gloves based on their wetting conditions during repeated firefighting activities and rest periods. Material and complete product assessments were conducted to investigate the residual heat patterns in the hoods and gloves subjected to cycles of work and rest. Consistent heat accumulation patterns were observed for the hoods and gloves in both evaluations. In repeated firefighting scenarios, the moisture conditions of the hoods and gloves influenced the generation and accumulation of residual heat. Dry hoods and gloves accumulated residual heat due to firefighting activities, with repeated work as the main factor. This was because re-exposure occurred before all the heat was dissipated. In contrast, the moisture content led to varying residual heat patterns between the hoods and gloves because of structural differences in their materials. No significant residual heat generation was observed in wet hoods, whereas wet gloves exhibited heat accumulation. The moisture remaining in the hood when exposed to external heat first blocks the heat and then dissipates the remaining heat during the rest period. However, gloves have a multilayered structure that makes it difficult for heat to dissipate. Armed with this knowledge, firefighters can either enter recovery before heat accumulation occurs or replace their gear with spare equipment to prevent risks. Therefore, this study can be used to implement safety measures for protecting firefighters from burns at fire scenes and contribute to establishing and revising firefighting operation standards (e.g. adjusting rest periods) and safety guidelines.
Footnotes
Acknowledgements
This work was supported by the Technology and Development to Support Firefighting Activities grant (1761002821) and funded by the National Fire Agency of Korea. The funding agency had no role in the study design; collection, analysis, and interpretation of data; writing of the report; and decision to submit the article for publication.
Author contributions
The conceptualization and original draft preparation were performed by Tae-Sun Kim. The data curation and visualization were performed by Ji-Hyun Yang and Tae-Hee Park. Jin-Suk Kwon performed supervision. All authors read and approved the final manuscript.
Declaration of conflicting interests
The author(s) declared no potential conflicts of interest with respect to the research, authorship, and/or publication of this article.
Funding
The author(s) disclosed receipt of the following financial support for the research, authorship, and/or publication of this article: This research was supported by the Technology and Development to Support Firefighting Activities grant (1761002821) and funded by the National Fire Agency of Korea.