
Abstract
The importance of solar systems as a renewable source has recently captured significant efforts from governments around the world to reduce their dependency on fossil fuels. Improving the efficiency of these systems, in general, is an important topic. Specifically, enhancing the control method used for controlling the DC–DC converter occupies a significant place in the efforts dedicated to increasing the efficiency of the solar system. The nonlinearity of such systems might deteriorate the performance of traditional controllers, such as PIDs. Therefore, this paper suggests a new scheme which consists of a PI controller and a neuro-fuzzy controller in a cascade manner. Particle swarm optimization is used for optimally designing the parameters of the PI controller for improving the system's dynamic and steady-state responses. Also, the proposed PI controller has only two tuning parameters which significantly reduce the design time. The system inputs of the proposed fuzzy controller are the power and the current changes, and its output is the duty cycle which directly affects the desired output voltage. On the other hand, the input of the PI controller is the error signal between the desired voltage and the output voltage of the DC–DC converter which forms the controlled variable. The main contribution of the paper is to enhance the efficiency of the system via connecting the optimal PI and neuro-fuzzy controller, which can store human experiences. Different scenarios are used to test the proposed controller and obtain optimal maximum power point tracking under different weather conditions. Results show that the proposed controller significantly improves the efficiency percentage of the DC–DC converter relative to the neuro-fuzzy controller alone by at least 15%. Also, the integral square error index indicates the proposed method has small tracking errors either for the setpoint tracking or disturbance rejection.
Introduction
Because of the efforts made to combat global warming, renewable energy sources have recently attracted a lot of attention. In this regard, photovoltaic (PV) systems are considered one of the most important sources of renewable energy. One of the primary advantages of these sources is their affordability. 1 The capability to generate clean energy, ease of access, and environmental friendliness are other advantages of PV systems. 2
To get the greatest amount of solar energy out of the PV units, a DC/DC boost converter is required to be used since, in comparison to other DC/DC converters, it offers reduced input current fluctuation and good power tracking capabilities. 3 In order to control the duty cycle of the DC/DC boost converter for maximum power point tracking (MPPT), several techniques have been developed and used in the literature to date. These techniques might include the Perturb-and-Observe (P&O) technique, the Hill Climbing (HC) technique, the incremental conductance (INC) technique, the artificial neural network (ANN) technique, and the fuzzy logic (FL) technique. The most important critique of P&O and HC is that the maximum power point (MPP) fluctuates. 4 On the other hand, INC improves the performance relative to P&O and HC algorithms. Unfortunately, it suffers from a steady state oscillation issue because it generates a duty cycle with a fixed step. 5 ANN technique provides enhanced performance compared to the classical methods such as P&O and HC techniques. Nevertheless, a huge amount of training data and accurate design are needed to build ANN. 6 Thus, ANN training is time-consuming. Also, the design parameters of ANN might negatively affect its accuracy if these parameters are not correctly selected. Robustness, model freedom, the universal approximation theorem, and rule-based algorithms are the main benefits of the FL technique. It is regarded as a practical tool for addressing complex nonlinear systems’ control issues. 4 Thus, it sounds like FL is a perfect solution relative to the abovementioned algorithms for improving the performance and efficiency of PV systems.
The majority of researchers today focus on creating and developing MPPT approaches based on soft computing techniques such as FL and particle swarm optimization (PSO). The benefits of these approaches include strong robustness, nonlinear problem resolution, and intelligence capacity.7,8 The advantages of an FL controller include a shorter MPP settling time, simpler architecture, and better dynamic response.
9
It was also mentioned earlier in this section that FL outperformed other intelligent techniques, such as ANN. Thus, FL is considered in this research. More precisely, artificial neuro-fuzzy interface systems (ANFIS), a special type of FL, is deemed in this study. It has been reported that ANFIS gives better performance when it is used for controlling DC–DC converters relative to FL.
9
In fact, the main advantage of ANFIS is its ability to deal with the nonlinear characteristics of PV systems. The nonlinear problem of these systems might lead to unstable systems and cause fluctuations. Thus, using ANFIS to control them can solve this problem. Also, FL, in general, has the capability to deal with unmodeled dynamics.
10
Other features of ANFIS, which make it better than FL and ANN, include its quick learning curve, adaptability, and lack of need for specialized knowledge.
11
In order to get the maximum power levels from a PV system, ANFIS uses the operational temperature and irradiance levels as inputs. For further improvement in the control performance, few studies use PI controller in a series or parallel connection with ANFIS.12–14 These studies have not considered the optimal design of the PI controller using heuristic algorithms such as PSO. Generally speaking, traditional methods such as Zeigler Nichols is used for designing the PI controller.
15
However, this method is time-consuming and has less accurate performance for systems with nonlinearities and time delays.
16
Heuristic approaches are employed for identifying the PI gains in order to get around these limitations. Additionally, these methods enhance the system's dynamic and steady-state responses.
17
As mentioned above, few studies have deemed connecting the PI controller with ANFIS. These studies have ignored the optimal design of the PI controller. Thus, the main novelties of this paper are as follows:
The PI controller is designed and tuned using the PSO algorithm to avoid the problems of the traditional design methods of the controller and improve the system’s dynamic and steady-state responses. Also, this helps improve the efficiency of the DC–DC converter. Relative to the fractional order PID Controller in Refs,18,19 the proposed control has only two parameters to be adjusted and thus it requires a short time to be set. Using ANFIS to form MPPT algorithms that mimic human-like decision-making processes based on expert knowledge and observations. This combination can lead to more efficient PV systems capable of boosting energy harvest under dynamic environmental conditions. Moreover, nonlinearity and unmodeled dynamics of the studied system can be handled by ANFIS. Connecting the proposed PI controller with the ANFIS system for further improvement in the performance. ANFIS specifically assists in improving the efficiency of the MPPT algorithm. Thus, two improvements to the efficiency of the system have been added. The first one is augmented to the MPPT algorithm via ANFIS, and the second one is achieved by the optimal PID controller adjusted by PSO.
The subsequent sections will be structured as follows. In Background of the studied system section, the basic layout of the studied system is outlined. In Proposed controller section, the proposed controller's design is investigated. The findings from the experiments and the investigation are discussed in Simulation results section. The overall investigation’s findings are presented in the Concluding section.
Background of the studied system
This section will be divided into two subsections. In the first of them, the mathematical model of the PV is investigated. On other hand, background about the boost DC/DC converter is outlined in the second subsection.
The mathematical model of the PV system
In this section, the mathematical model of the PV system is investigated. A bifacial PV cell model, shown in Figure 1, is considered for conducting this study. The equivalent model of bifacial PV cell consists of two current sources, four diodes, and series/parallel resistances for the front and back face of the solar cell.
20
The MPP of the current of a bifacial solar cell can be represented by the sum of the current Io generated by the absorbed light from the front, and the current Ib generated by the absorbed light from the back [15], as shown in Figure 1. The following equation can be used to describe the relation explained above:


The equivalent circuit for a bifacial solar cell, where the arrows in the picture represent the sun irradiation.
where


Boost DC/DC converter
A power electrical device called the boost DC–DC converter, see Figure 2, is utilized to provide a greater regulated output voltage from a smaller unregulated input voltage. A capacitor C, a switch S, an inductor L, a diode D, and a load resistor R make up the converter. The converter's operation could be explained as follows: The diode is OFF when the switch is in the ON position. In this mode, the input source of voltage is directly connected to the inductor, which stores energy. In the meantime, the capacitor powers the load. The diode is ON while the switch is in the OFF mode. In this mode, the load is powered by both the input voltage source and the energy that is stored in the inductor. Thus, a voltage level greater than the amount of input voltage is generated. The following formulas are used to compute the converter’s capacitor and inductor values, respectively
21
:


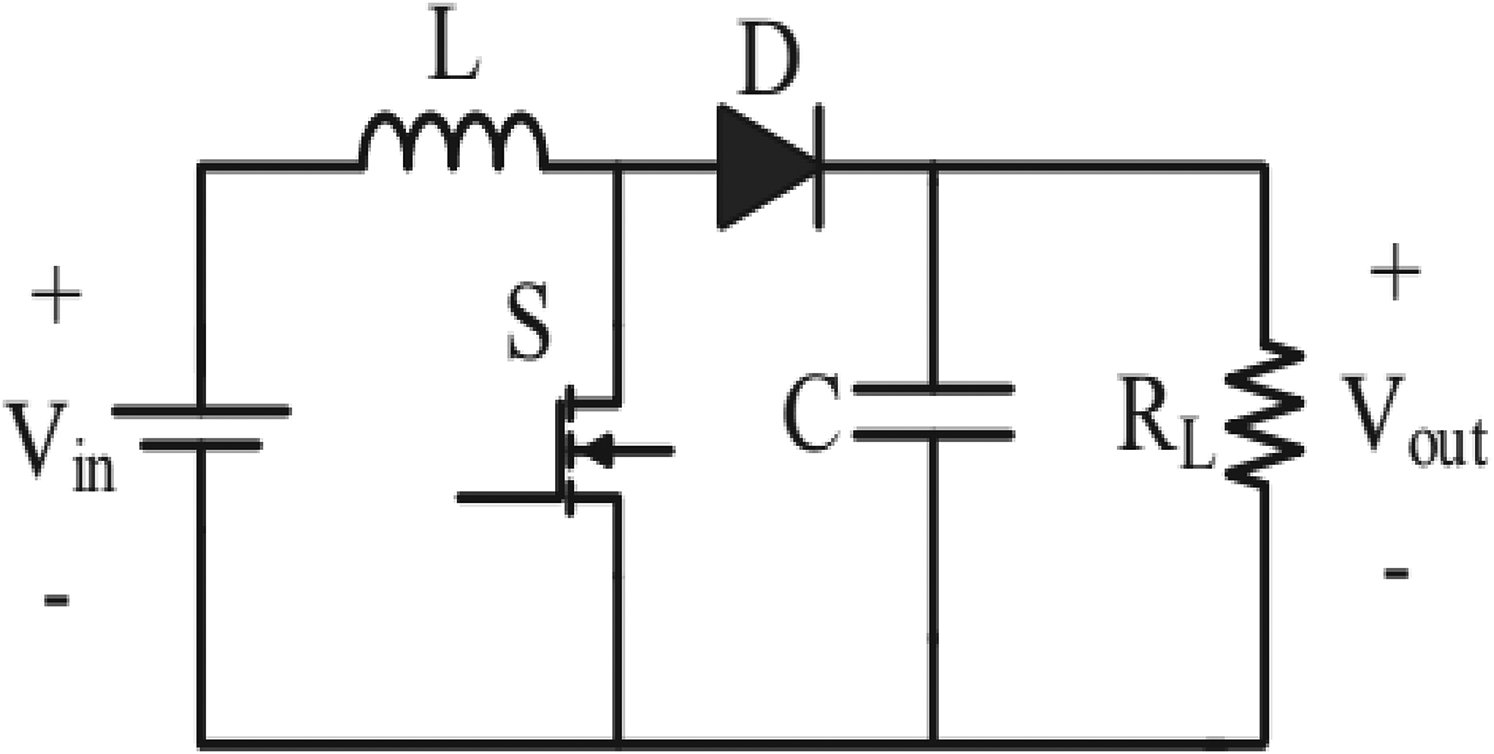
Circuit for boost converter. 21
In the above equations, D is the duty cycle, which is the ratio of the pulse duration to the period of a rectangular waveform.
In the above two subsections, background about PV and the boost DC/DC converter was provided. Figure 3 illustrates the whole investigated system. Here, the control goal is to maintain the output voltage at a desired value in the face of variations in resistive load levels and solar irradiation. The next section will develop a new control scheme for achieving the above-mentioned goal.
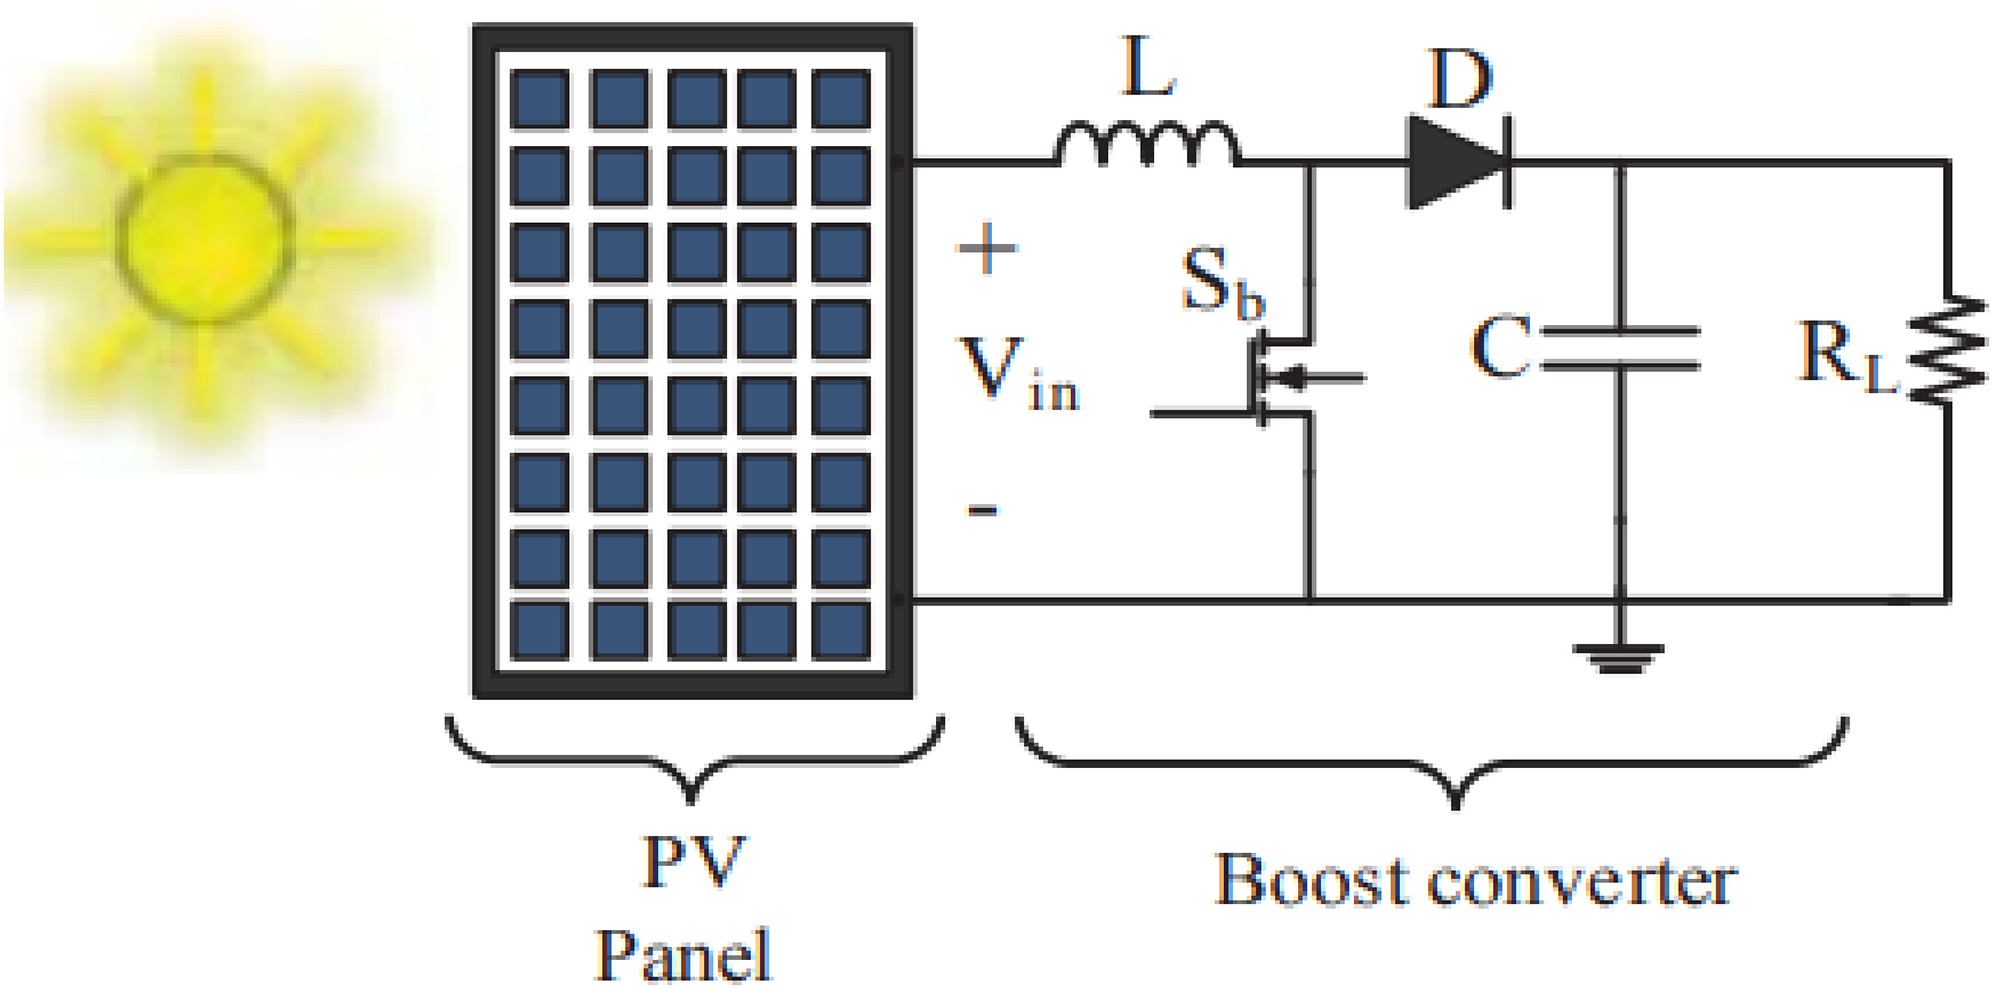
The whole investigated regime. 21
Proposed controller
The proposed controller, see Figure 4, is a two-stage controller in which ANFIS and the PI controller are employed. Here, ANFIS is used for generating the reference voltage while the PI controller is used for maintaining the output voltage at a desired level. The section will further break into two parts to explain the proposed controller.

The whole proposed controller.
The ANFIS controller
The ANFIS controller pursues the MPP by changing the duty cycle, and this in turn makes the output voltage on the ANFIS controller most appropriate to achieve the largest harvest power for the solar system. The proposed ANFIS controller consists of two inputs, namely the power change (

Design stages of fuzzy systems.
This paper selects seven fuzzy input sets: NB: Negative Large, NM: Negative Moderate, NS: Negative Small, Z: Zero, PS stands for Positive Small, PM stands for Positive Medium, and PB is for Positive Big. The selection of the fuzzy output sets (consisting of seven sets) is as follows: NB: Negative Large, NM: Negative Moderate, NS: Negative Small, Z: Zero, PS: Positive Small, PM: Positive Medium, and PB: Positive Big. The input sets are shown in Figures 6 and 7 while the sets of the output are illustrated in Figure 8.

Fuzzy sets of the power change.
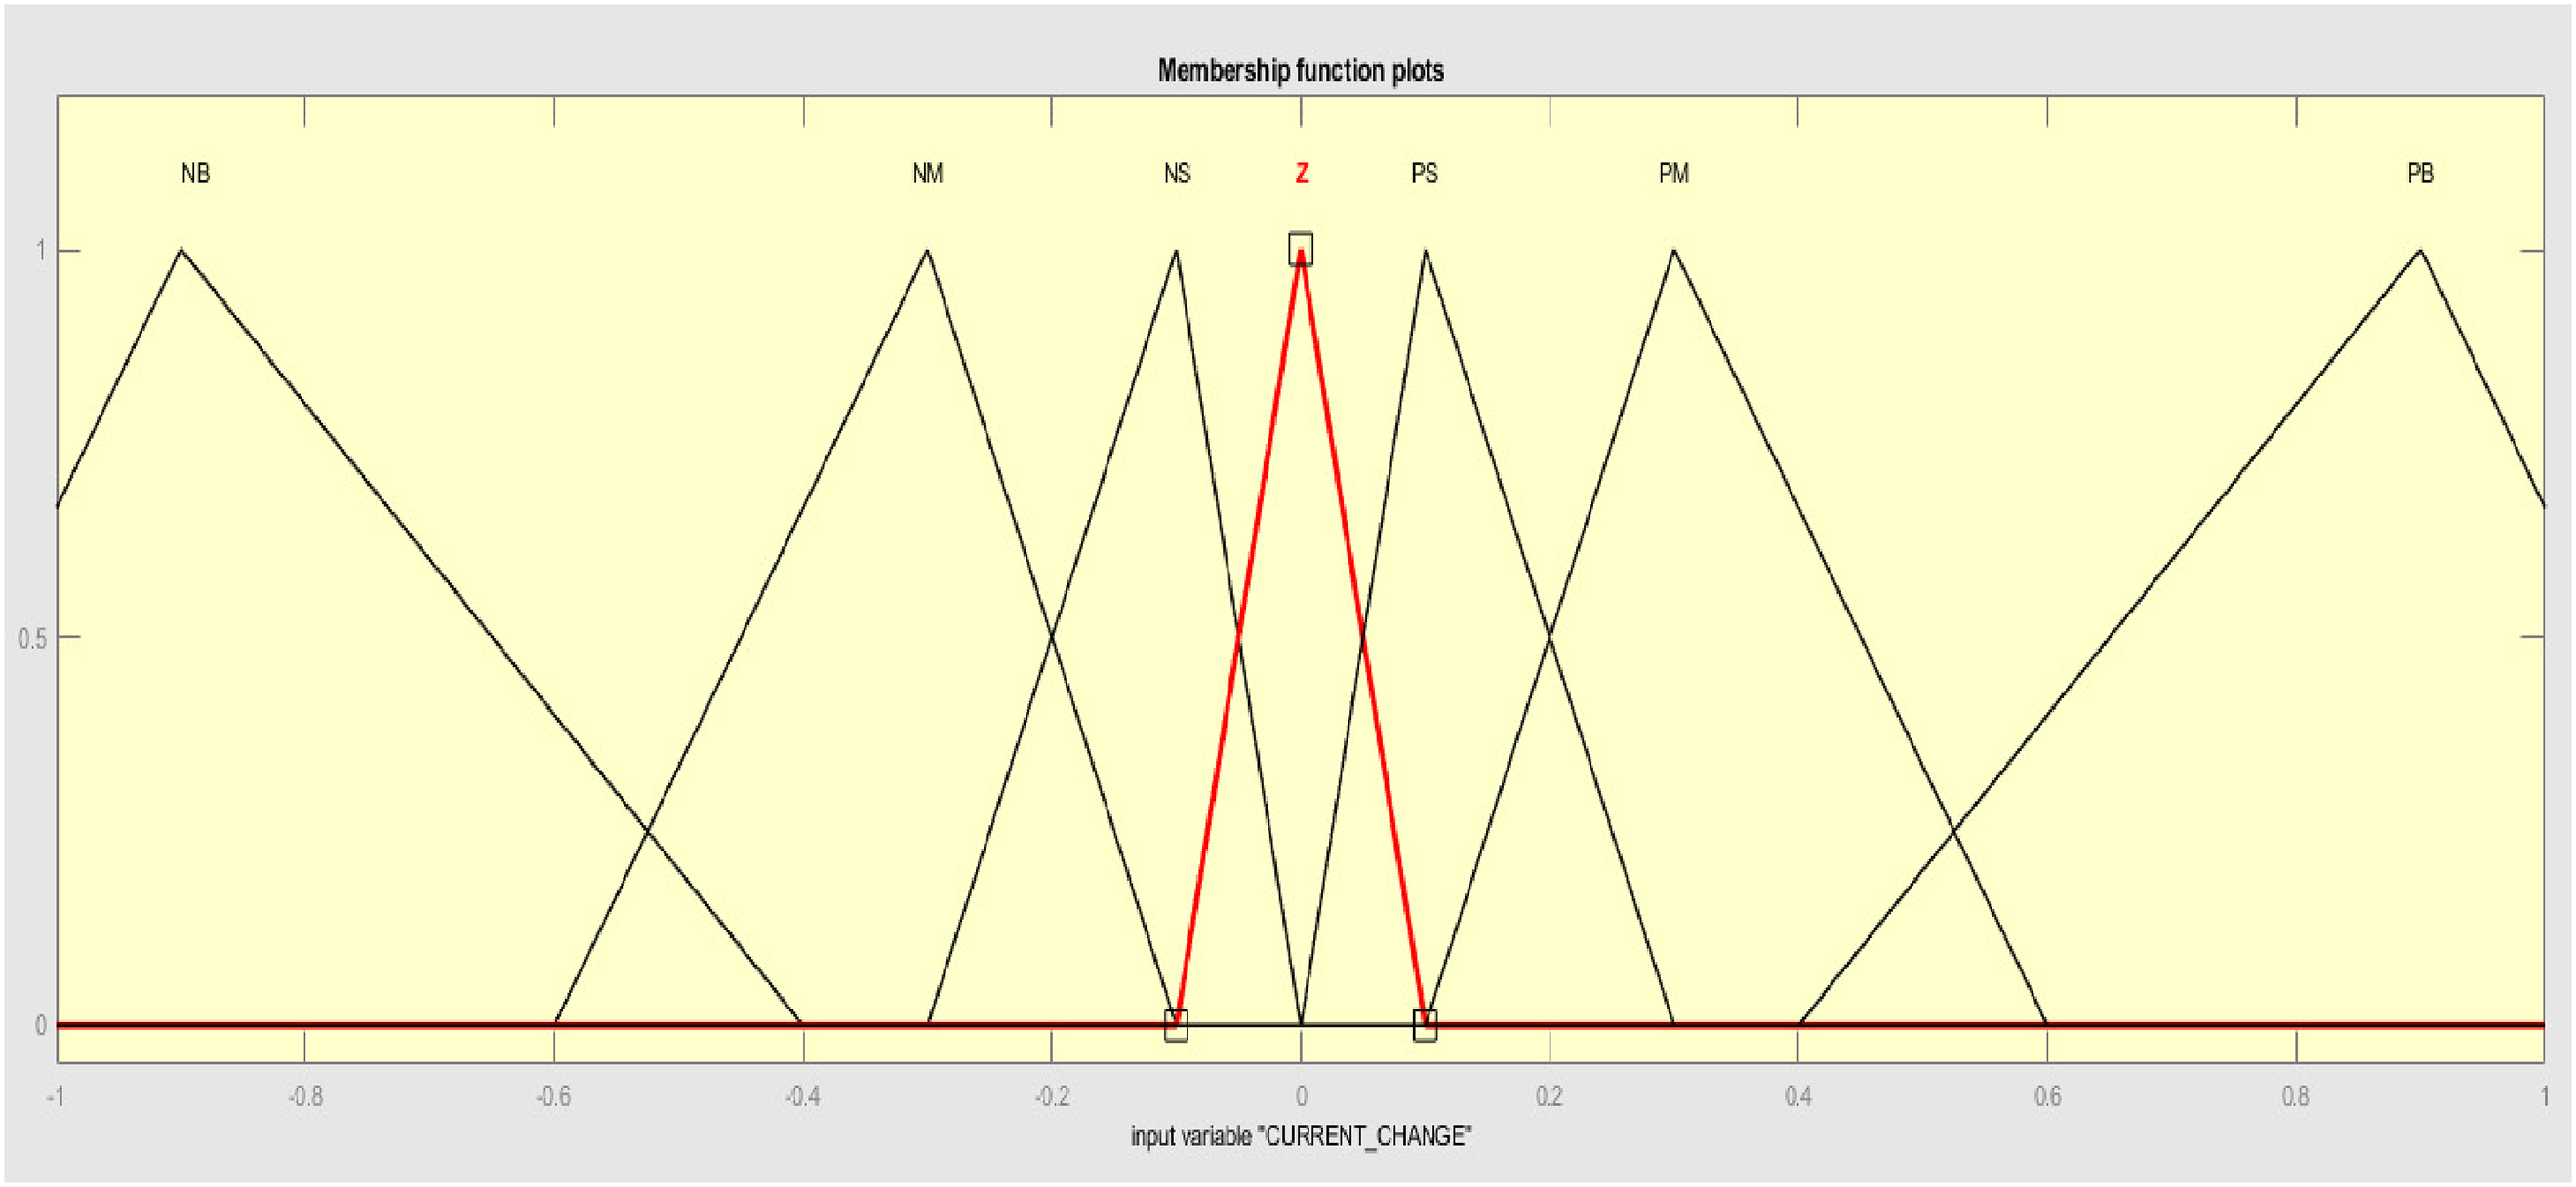
Fuzzy sets of the current change.

Fuzzy sets of the duty cycle.
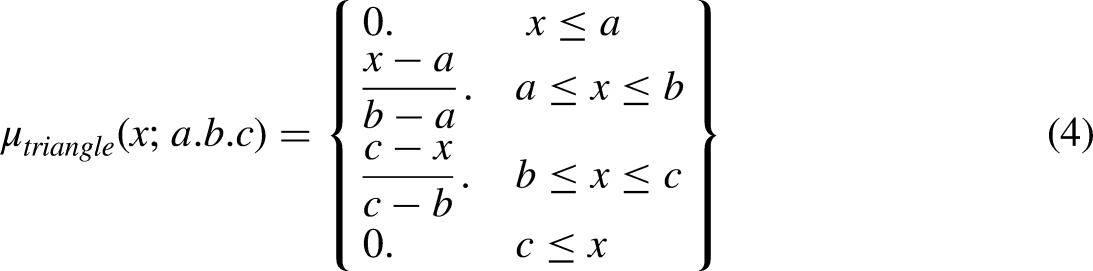
Forty-nine of Maximum–minimum Mamdani rules can be extracted from Table 1 and they are shown in Table 2. Initial membership functions for all fuzzy sets are the same triangular membership function represented by equation below:
Fuzzification rule.

ANFIS rules.

These functions can be modified during the adaptive phase. In this paper, AND-type rules are only generated, which take into account the combined effects of multiple variable classifications. The more scenarios are presented, the more generalizable the ANFIS model will be, so it is important to use large rule generation sets. However, weight, location, and function adaptation differ from cross-validation in that it involves making changes to preexisting rules.
In 1996, Driankov et al. were the first to develop adaptive training specifically for ANFIS.
22
Because not all possible configurations for the training are tried out, the results are not comprehensive. Adjustments are made to the membership function, the position of fuzzy set prototypes, and the weights. This study utilizes a sample of data for which it would be beneficial to reduce the quadratic error. When defining the quadratic error, one uses the following relation:
The center-of-area approach was selected as a method for defuzzification:
The PI controller
The PI controller is a simple feedback control loop which is very common in engineering application.23–25 The DC–DC converter system needs to have good control performance, simple implementation, and high reliability. Due to its ease of use and reliability, the PI controller has found widespread application in DC–DC converters. Although PI controllers are easy to tune, obtaining optimum performance depends on the designer due to the difficulties introduced by the nonlinearity of the load. In order to minimize overshoot, minimize transient response, and obtain low steady state error due to load variations in a PV system, an optimal design of the PI controller's parameters using a PSO algorithm optimization technique is employed. To this end, the optimal values of Kp and Ki in real-time operation will be explored to guarantee that a PSO-based optimization method can function as intended and deliver quick responses. Whenever there is an error in the system's input, the PSO algorithm optimization technique will act instantly to fix the problem. The proposed model of the inverter control system using PSO is depicted in Figure 9. In order to reduce the discrepancy between the ANFIS output voltage and the DC–DC converter output voltage, a PI-based PSO algorithm is implemented. Below, a detailed explanation of the PSO algorithm's fitness function and its associated constraints will be illustrated. The PSO algorithm allows for quick implementation with a single solution space, leading to the best possible values for the PI controller's parameters and the fastest possible response times.

The adjustment of the PI controller gains using PSO.
PSO is an effective method for attaining the ideal solution in a system with nonlinear dynamics. This technique is derived from the inherent behaviors of bird flocks that navigate in groups inside a D-dimensional world. During each iteration, every particle in the swarm advances towards the most optimal solution found up to that point. Continuing this contact, the particle persistently seeks a superior solution to the earlier one and advances towards it, so exhaustively investigating the region.
26
In the searching space vector, the ith swarm particle's position and velocity are shown as Xi = [X1, X2, … , Xi] and Vi = [V1, V2, … , Vi], respectively. For the ith swarm of particles, the optimal prior solution was Pi = [P1, P2, … , Pi], and the global best position is Bi = [B1, B2, … , Bi]. The following equations form the basis for the next iteration’s modified particle positions and velocities.
26
:

In order to determine the optimal value for every variable in the entire swarm and compute fitness, the PSO algorithm arbitrarily starts the particles at the beginning. Figure 10 shows the PSO algorithm's process diagram. Here you will find a description of the optimization stages of the PSO method.
1. Initialize the parameters:

The PSO flowchart.
In this step, the algorithm's parameters are explicitly specified. The Number of Population is one of these parameters (N), lower and higher bounds (lb, hb), the maximum number of iterations (k), weight coefficients ( 2. Initialize the swarm population: 3. Initialize the swarm population: 4. Conduct fitness evaluation: 5. Stopping criterion:
In this step, the swarm population with dimension of kV *k is created as follows:
A swarm stores the most favorable encounters it has encountered (Pbest) in its memory, together with the collection of the most favorable encounters (Bbest). During this particular stage. A new swarm is formed by updating the velocity and position of the swarm in the following manner:
After being improved in accordance with the aforementioned rule, the new vector is assessed using a fitness function. The following is an updated version of the individual and global best:
The optimization process is terminated if the maximum number of iterations is exceeded. If not, continue to steps 2 and 3.
The fitness function, which is also known as the function of aim or cost functions, is the best way to evaluate the search area in the preceding steps. The integral of the mean square error is formulated as an objective function to be minimized in order to obtain the optimal PI controller parameters 
In DC–DC converter system, the problem constraints are expressed as given below.

In the expressions above,
Simulation results
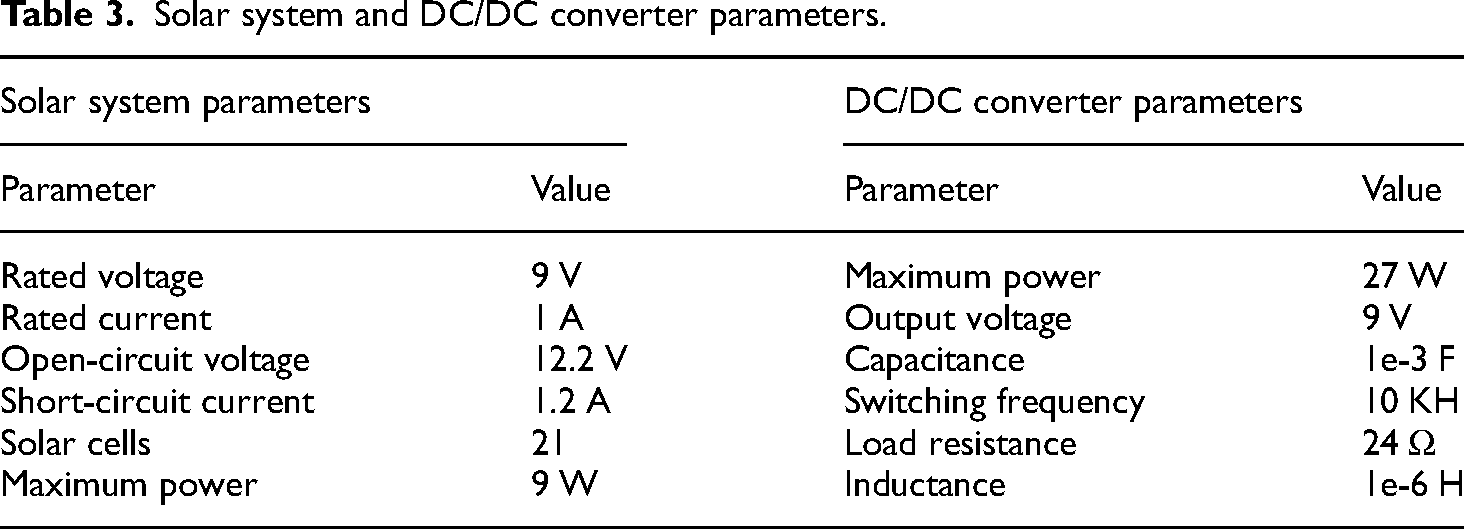
In this section, the efficiency of the proposed controller will be shown under different weather conditions. To do so, the performance of the suggested controller (PI controller plus ANFIS) will be compared with the ANFIS controller. ANFIS controller alone has the same structure and scheme as the ANFIS connected with the PI controller for fair comparison. The solar system and the DC/DC converter parameters are given in Table 3. A PV array of 20 series, a single parallel panel, and a resistive load will be built and simulated using MATLAB. PV cells are subject to weather-related factors, such as temperature, which affects voltage output, and solar insolation, which affects current output. The (P–V) and (I–V) curves, which identify the PV panels employed for generating electricity, are characteristics of PV systems. The solar panel parameters shown in Table 3 determine the responses of the solar cells’ voltage and power (P–V), current, and voltage (I–V). The (I–V) and (P–V) curves at a temperature of 25° are given in Figure 11 while Figure 12 illustrates the same curves but for different temperatures. Acquiring the maximum electrical energy output from solar panels is challenging because of these non-linear features, see Figures 11 and 12, caused by operating under variable environmental conditions. Due to the non-linear voltage-current characteristic of PV panels, maximum power is produced at a specific point that is strictly dependent on the temperature of the panel as well as the irradiation condition. Thus, controlling such systems is challenging. Consequently, the proposed method is a key remedy for this problem.
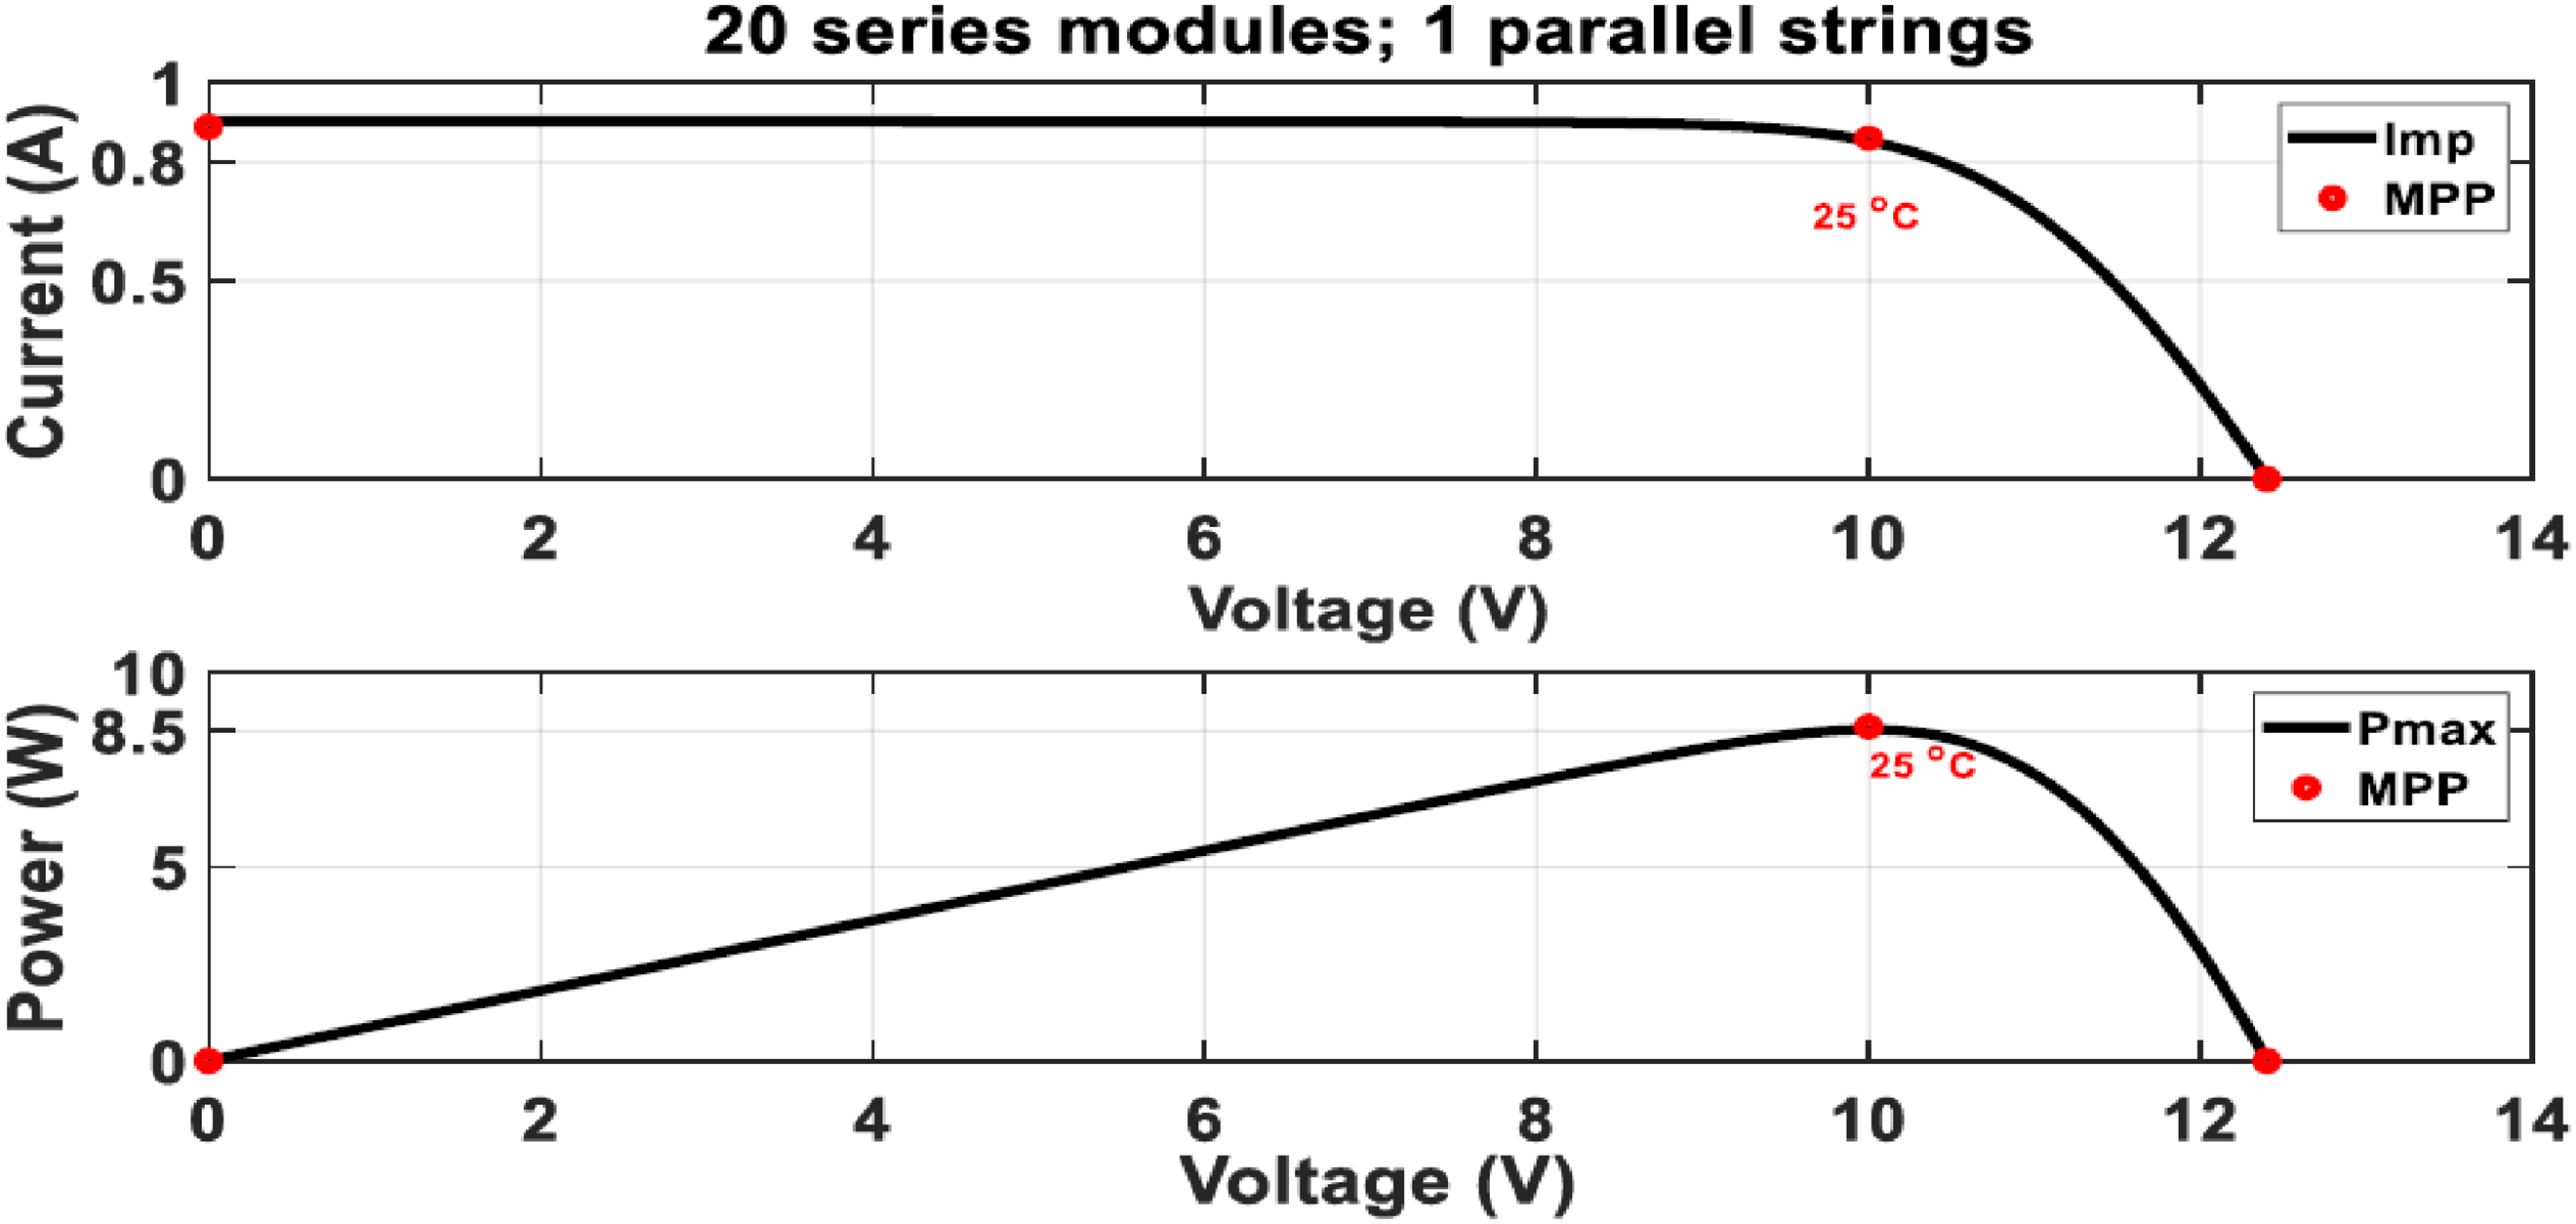
(I–V) and (P–V) curves at 25°.

(I–V) and (P–V) curves at different temperatures.
Solar system and DC/DC converter parameters.
Here, the design of the PI controller parameters will be illustrated. In this study, these parameters are optimally designed using PSO. The flowchart of the PSO algorithm is given in Figure 10. The PI controller parameters are adjusted using the structure given in Figure 4. Here, the PI parameters that meet the minimum value of the objective function, given in equation (9), will be chosen as the best solutions of the control problem. The PSO tuning parameters, which are the size of the swarm, inertia weight, the local learning factor, and the global learning factor are, respectively, chosen to be 35, 0.9, 0.12, and 1.2. Those parameters are selected by trial and error. After running the PSO algorithms for 80 iterations, one sees from Figure 13 that the cost function (J) is leveled off after the 20th iteration which indicates that the optimum values of the controller are obtained. The final values of the controller parameters are found to be Kp = 9.9872, and Ki = 0.3120.

Convergence curves of PSO.
The whole system is implemented in MATLAB Simulink using Figure 4. The flowing scenarios are used to test the proposed algorithm:
Gradual changes in the solar irradiation
The performance of the proposed controller (optimal PID controller plus ANFIS controller) and ANFIS controller are compared under a scenario in which the solar irradiation is slowly changed, see Figure 14. For this scenario, the solar irradiation changed between 0 and 300 W/m2 in a gradual way at the moments between t = 0 and t = 5 s At the moment t = 5 s, a sharper change has been applied to reach to 700 W/m2 solar irradiation. A maximum solar irradiation of 1000 W/m2 has been applied between t = 6 and t = 8 s Next, a sharper decrease in the solar irradiation by 500 W/m2 is fed at t = 8 s. Between t = 9 and t = 10 s, the solar irradiation has been gradually decreased to reach to 200 W/m2. Finally, a constant solar irradiation of 100 W/m2 has been simulated between t = 10 and 20 s The associated changes in the duty cycle generated at the output of ANFIS are shown in Figure 15. The voltages, currents, and powers of the solar panel associated with the above-mentioned scenario are shown in Figures 16–18. The response of the proposed controller is illustrated in Figure 19. One can notice from the figure that the proposed controller significantly improves the performance relative to the ANFIS controller. It is clear from the figure that the proposed controller has almost no steady-state errors in comparison to the ANFIS controller which generates larger steady-state errors. Moreover, a disturbance with an amplitude of 1 at t = 5 s has been injected into the closed-loop system of the DC–DC converter to have a simulation scenario, which emulates a real-time implementation. The outcomes of the reported controllers after adding the disturbance are revealed in Figure 20. One can realize from the figure that the proposed controller has a robust performance against disturbances, which might suggest that this controller is suitable to function in harsh operating conditions. On the other hand, the performance of the ANFIS controller is deteriorated by the disturbance and as a result, it totally loses its stability as is evident in Figure 20. To numerically prove the superiority of the proposed controller, the system efficiency has been analyzed and studied. The percentage of output power to input voltage determines the boost converter's efficiency. The superiority in terms of the efficiency of the proposed controller over the ANFIS controller is numerically shown in Figures 21 and 22. From Figure 21, one can observe that the proposed controller has an efficiency percentage of 99.96% relative to 85% for the ANFIS controller. Thus, the proposed controller nearly contributes to 15% improvement. This assures that the proposed controller could improve the efficiency of the DC–DC converter relative to the other controller. This fact can clearly be observed once again in Figure 22 where the proposed controller (PI plus ANFIS) could maintain an efficiency percentage of above 90% under the injected disturbance at t = 5 s On the other hand, the ANFIS alone totally loses its efficiency under disturbances as seen from Figure 22.
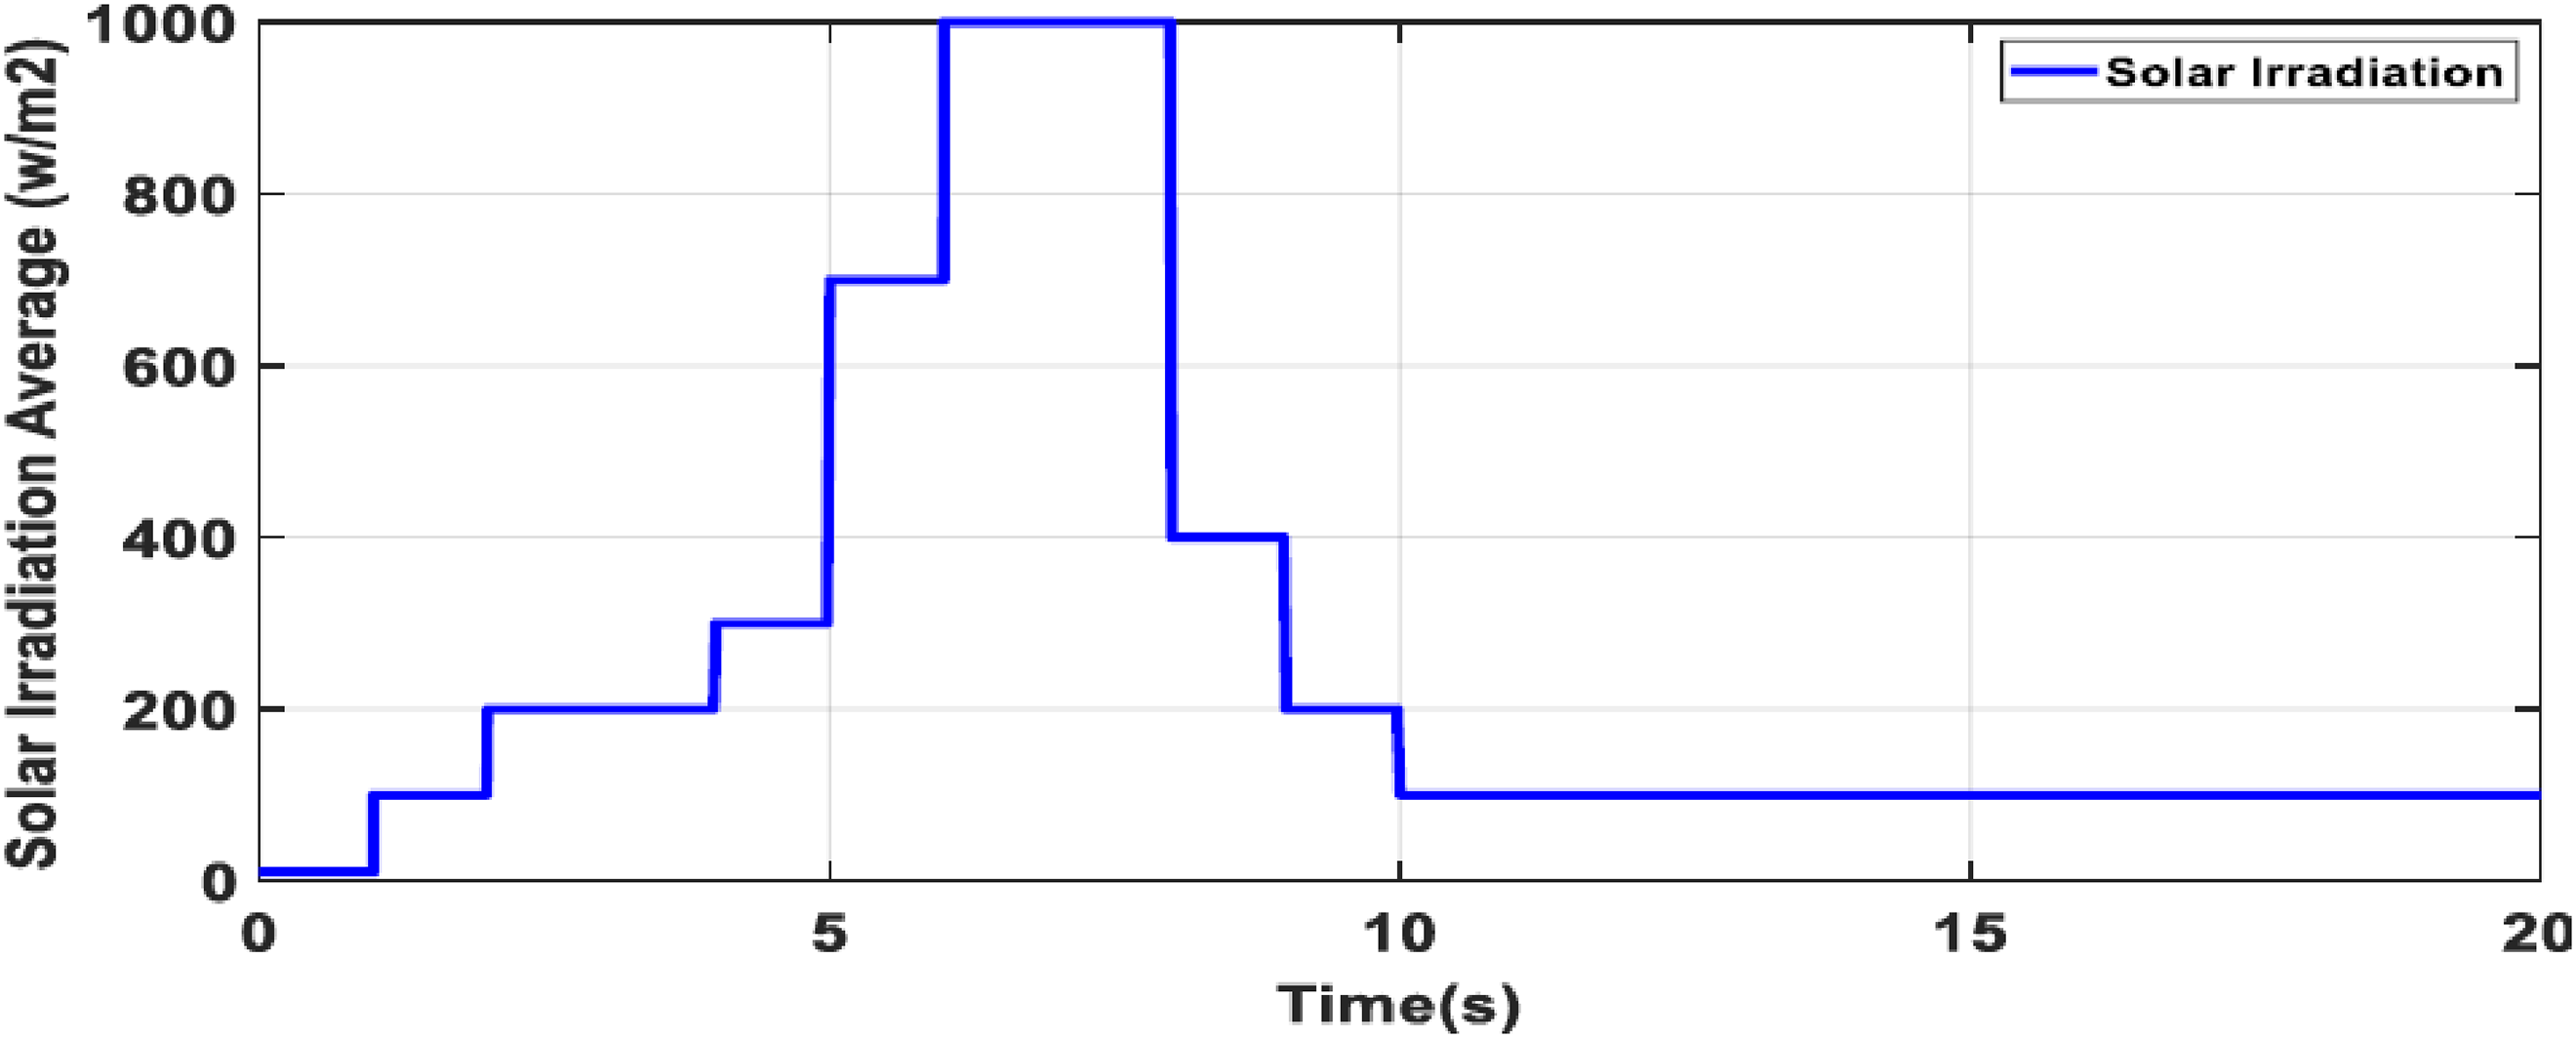
Gradual changes in the solar irradiation.

Duty cycle changes at the output of ANFIS for the scenario presented in Figure 14.

The voltage of the solar panel for the scenario presented in Figure 14.

The current of the solar panel for the scenario presented in Figure 14.

The power of the solar panel for the scenario presented in Figure 14.

Response of the investigated controllers for the scenario presented in Figure 14.

Response of the investigated controllers under disturbances for the scenario presented in Figure 14.

Efficiency percentages of the investigated controllers for the scenario presented in Figure 14.

Efficiency percentages of the investigated controllers under disturbances for the scenario presented in Figure 14.
Suden changes in the solar irradiation
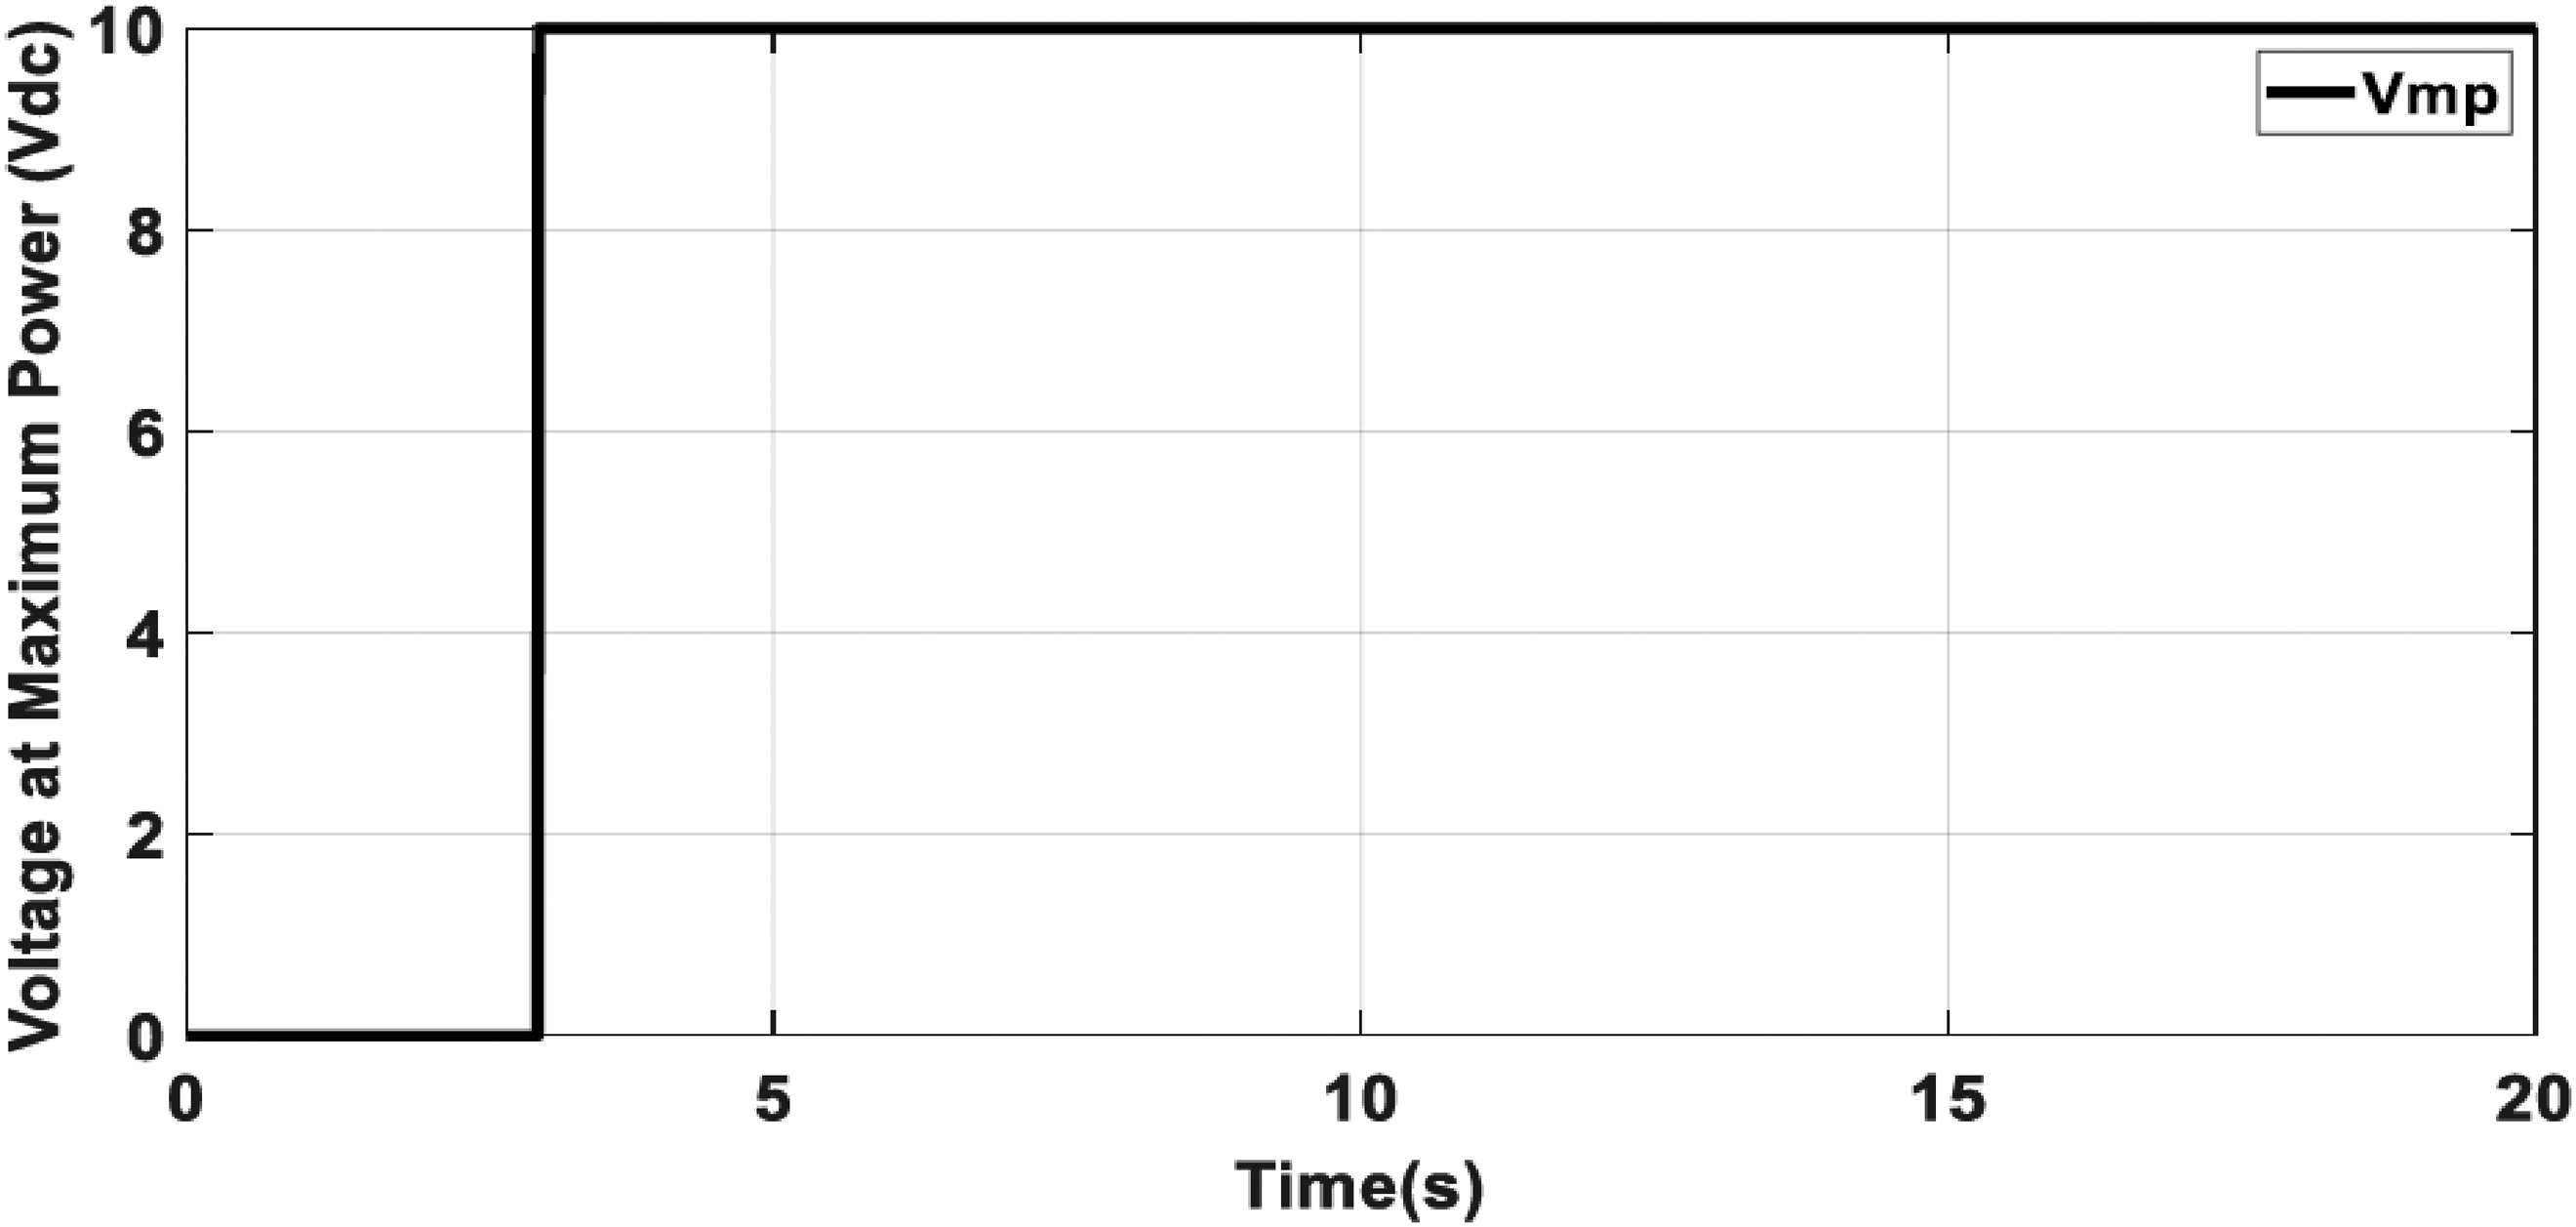
Also, the performance of the investigated controllers is examined under a scenario in which the solar irradiation suddenly changes to have a solar irradiation of 100 W/m2 at t = 3 s This scenario might imitate the changes between sunny and cloudy moments. The above-mentioned scenario is illustrated in Figures 23–31. Where the Sudden changes in the solar irradiation, the duty cycle changes,voltages, currents and power of the solar panel associated with this scenario are shown in Figure 23, Figure 24, Figure 25, Figure 26 and Figure 27. Once again, one can notice from Figures 28 and 29 that the proposed controller notably outperforms the ANFIS controller for a scenario free from disturbances and for a scenario with disturbances (applied at t = 7 s). This efficiency of the presented controller is numerically assured by checking the values of efficiency percentages displayed in Figures 30 and 31. Once again, the proposed controller has an efficiency of above 90% even under disturbance, as can be seen from Figure 31. On the other hand, the other controller completely loses its stability and efficiency under disturbances. All the above tested scenarios confirm the suitability of the given controller for implementation in real-time scenarios, either for slow and quick changes in the solar irradiation and under the effect of harsh disturbances.

Sudden changes in the solar irradiation.

Duty cycle changes at the output of ANFIS for the scenario presented in Figure 23.
The voltage of the solar panel for the scenario presented in Figure 23.

The current of the solar panel for the scenario presented in Figure 23.

The power of the solar panel for the scenario presented in Figure 23.

Response of the investigated controllers for the scenario presented in Figure 23.

Response of the investigated controllers under disturbances for the scenario presented in Figure 23.

Efficiency percentages of the investigated controllers for the scenario presented in Figure 23.

Efficiency percentages of the investigated controllers under disturbances for the scenario presented in Figure 23.
Injection impulse disturbances
In the previous scenarios, the robustness of the proposed controller was only tested for a step disturbance. Here, a more difficult test is applied in the form of impulse disturbance. The disturbance curve is presented in Figure 32. The results of the test are illustrated in Figure 33. It is clear from the figure that the proposed controller is less affected relative to the other controller, which is unstable at the moments at 5.8 and 9 s This ensures once again the quality of the proposed controller.
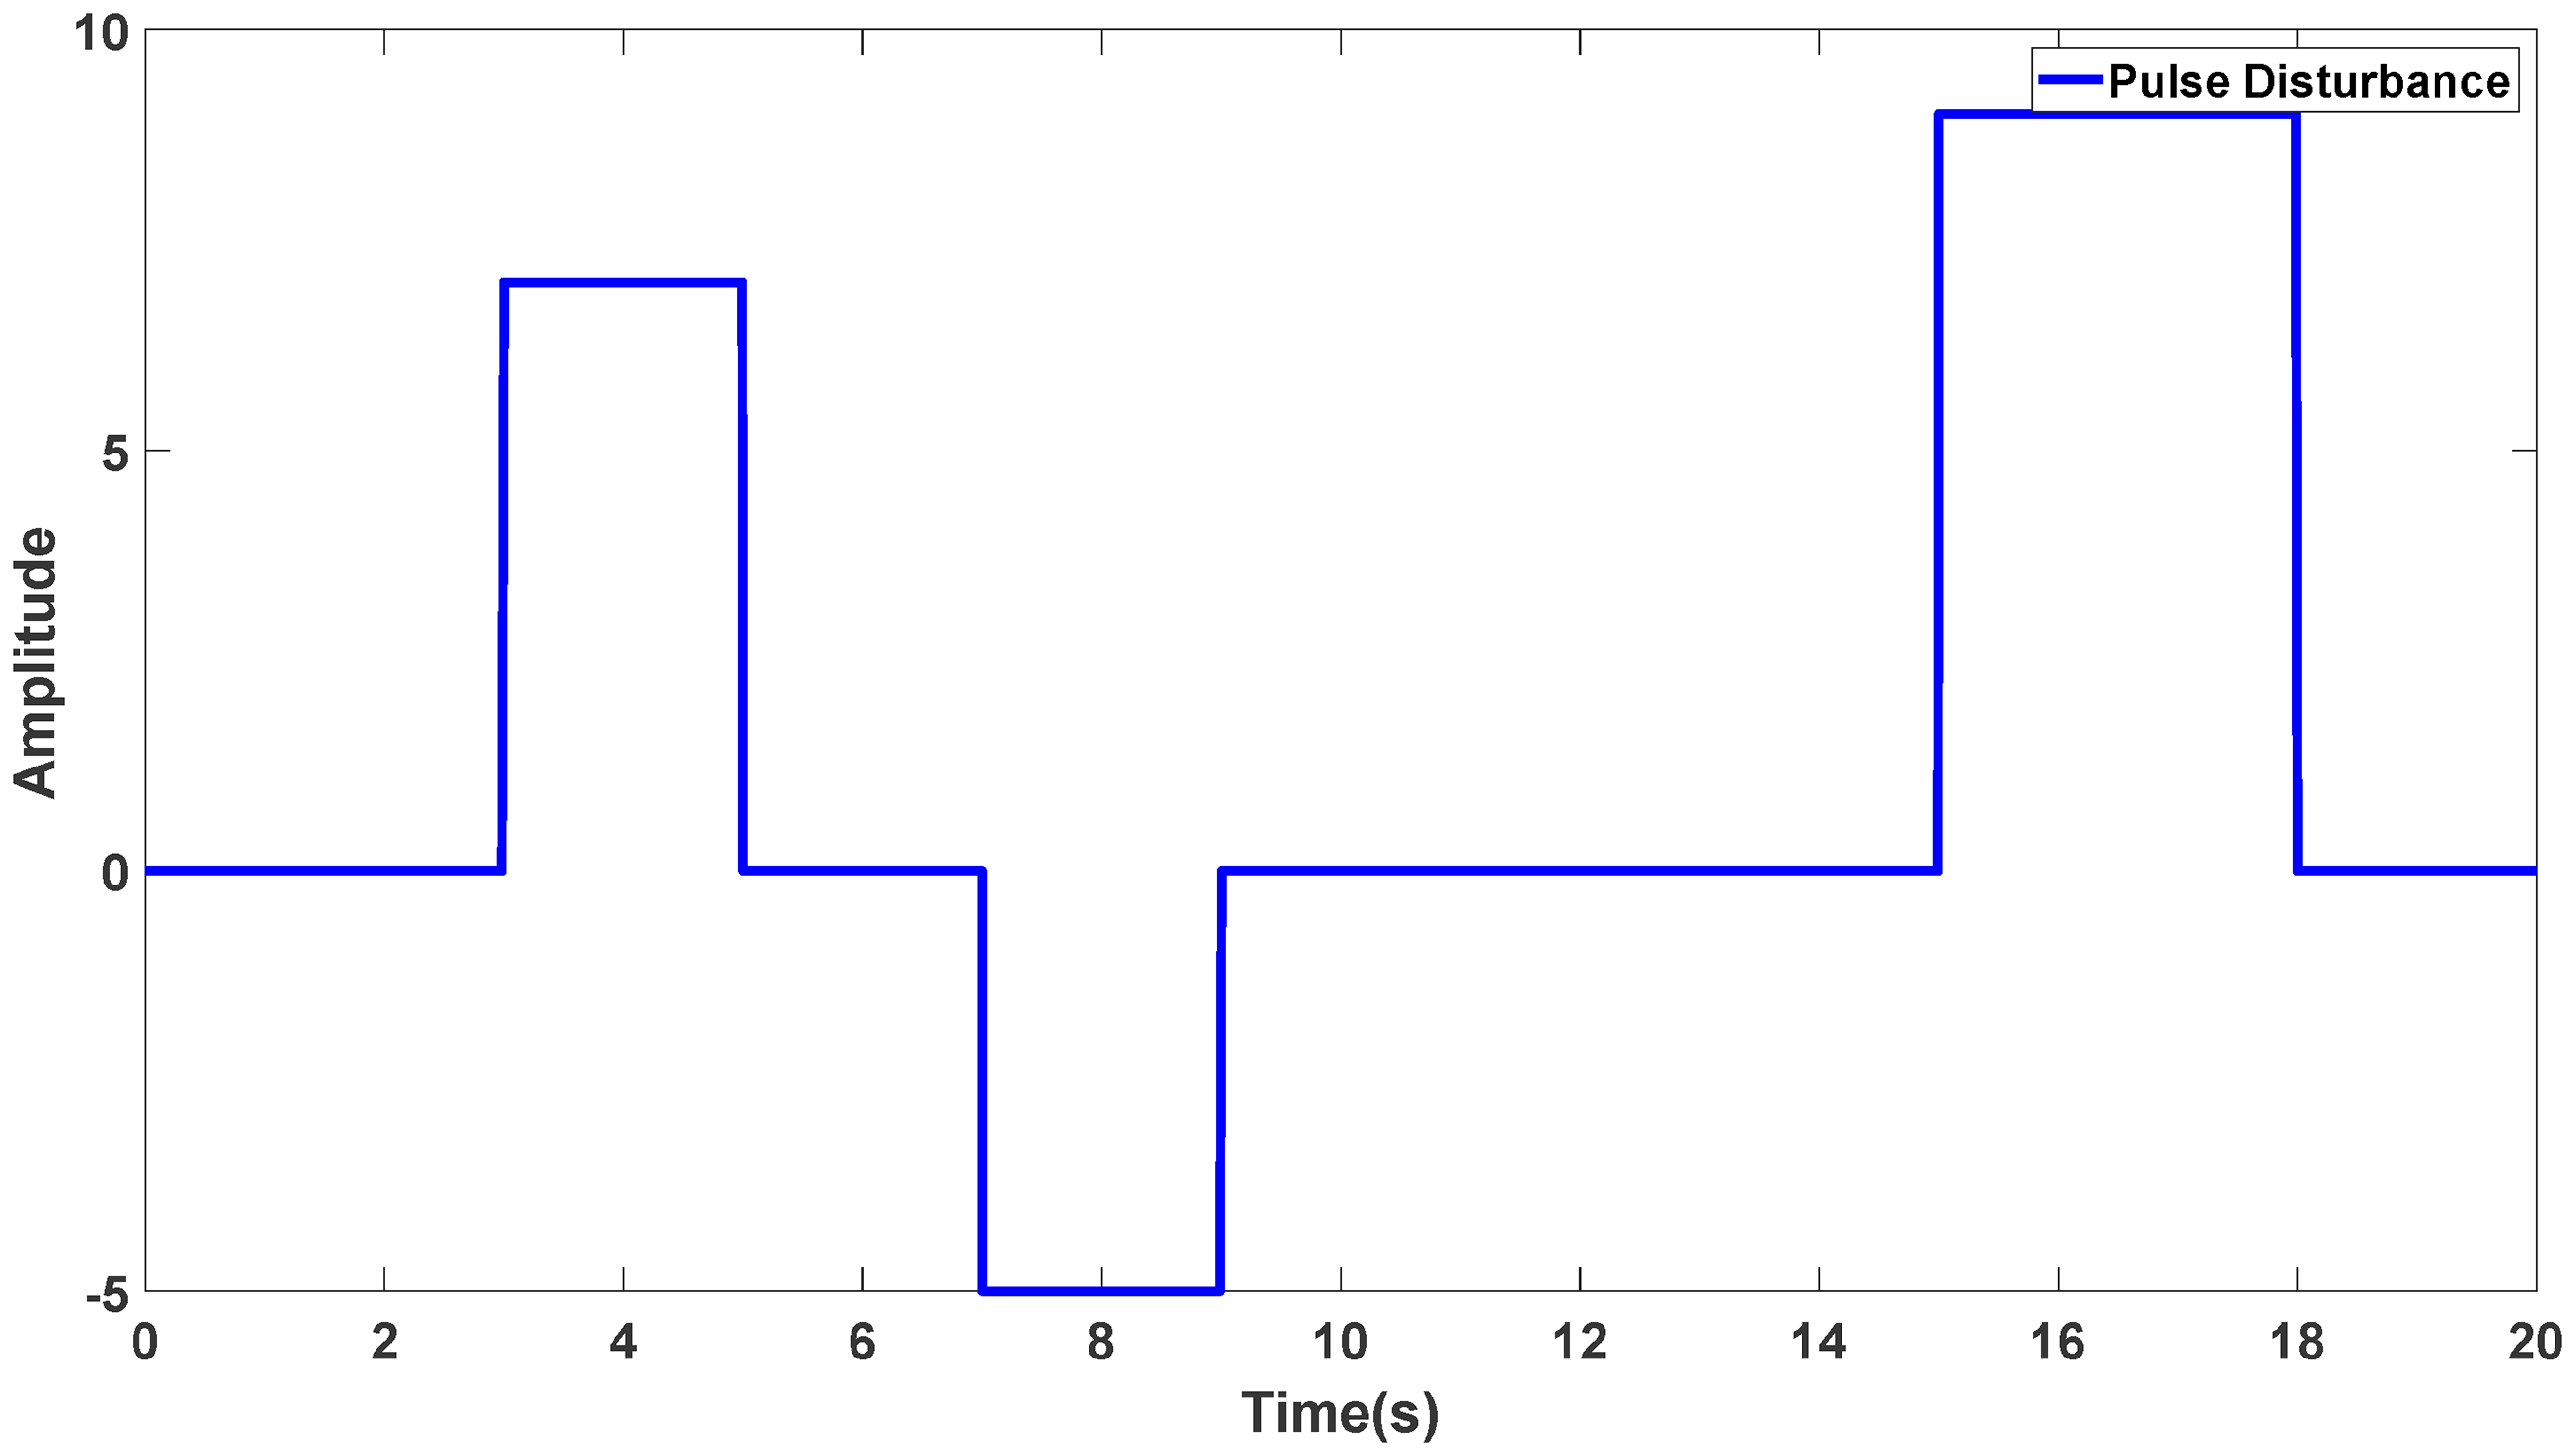
Applied impulse disturbance.

Output voltage under the impulse disturbance.
To summarize the important results in the discussions under the above scenarios, Table 4 is provided. In the table, integral square error (ISE) is used to numerically evaluate the studied methods as well. One can refer to Refs27,28 for more information about ISE. Its small values refer that the proposed method gives satisfactory results relative to ANIFS alone. Also, Appendices 1–3 provide further performance investigations.
Performance comparison for the studied methods.

Conclusions
This research introduced a new method for controlling solar systems. The proposed controller integrated the strong features of PSO and ANFIS to produce a strong scheme for controlling DC–DC converters. Results displayed that the proposed controller significantly improves the performance relative to the ANFIS controller alone. Different scenarios of solar irradiation, disturbances, parameter variations, shadow effects, and impulse disturbances were used to test the suggested scheme. Responses to varying levels of solar radiation, both with and without disturbances, demonstrated that the suggested controller considerably increased the energy efficiency of solar systems when compared to ANFIS controllers. This might increase the utility of these systems in the practical stage. Also, the proposed method shows robust performance against parameter variations and changes in the shadow which once again proves the feasibility of the proposed method. All above superiorities are numerically shown using ISE and power efficiency percentages. Future works include practically testing the proposed algorithm with developing an online optimization algorithm, such as the algorithm reported in Ref, 29 suitable for real-time tests. Also, the theoretical stability, which has not been studied in this paper to avoid having a lengthy paper, will be studied. For more information on the stability of neuro-fuzzy controllers, one can refer to Ref. 30
Footnotes
Declaration of conflicting interests
The authors declared no potential conflicts of interest with respect to the research, authorship, and/or publication of this article.
Funding
The authors received no financial support for the research, authorship, and/or publication of this article.
Appendix 1: Shadow effects on the system
PV panels can be affected by shadows, which prevent the sunlight from reaching the solar cells. As a result, the system can lose energy as less electricity can be generated by solar panels under the shadow. Therefore, it is necessary to test the shadow effect on the proposed controller. The suggested remedy must lessen shadow impacts while maintaining satisfactory performance and reliability. Different percentages of shadows given in Figure A1 are used to simulate the shadow effect. The outcomes that respond to this test are shown in Figure A2. One can witness that the proposed controller could maintain satisfactory performance under the shadow effects in comparison to the ANFIS alone.
Appendix 2: Robustness against measurement noise
In order to assess the resilience of the controllers under investigation against measurement noise, a band-limited white noise signal with a power of 0.0001 is introduced into the DC–DC converter's closed loop system. The results for that are displayed in Figure A3. It is evident from the figure that both of the analyzed controllers respond similarly when there is measurement noise. Furthermore, Figure A3 clearly shows that, in spite of noise, the suggested controller continues to perform better than the ANFIS controller alone.
Appendix 3: Robustness against parameter variations
It is important to analyze the robustness of the proposed method against parameter variations. As it is known, the parameter of the DC–DC converter might change under the operation conditions. This in its turn affects the controller performance, which was originally designed using the nominal values of the system. To implement this scenario, the nominal values of capacitance, load resistance, and inductance have changed to be 1120e-3 F, 0.2e-6 H, and 14 Ω. Results for the parameter change scenario are given in Figure A4. One can notice that both regulators are similarly affected, and the proposed controller could maintain good performance against parameter variations. This might indicate the proposed solution can provide satisfactory performance in real-time scenarios.