
Abstract
Accurately measuring the mechanical properties of high-strength stainless steels is of great significance for ensuring structural safety, predicting long-term performance and optimizing design. However, the standardized tensile test specimens used to obtain strength properties must be fabricated from bulk materials from an in-service structure or component, result in the loss of structural integrity or a reduction in remaining service life. Small punch tests require only miniscule material samples and are widely used to estimate in-service component material characteristics. This study performed small punch tests on three high-strength stainless steels—X17CrNi15-2, 15-5PH, and PH13-8Mo—to obtain the correlations between the small punch tests and the uniaxial tensile test results for each material. The estimated yield stresses obtained from the small punch tests were distributed within a factor of 1.5 on both sides of the unity line when compared with those obtained from the uniaxial tensile tests; the ultimate strength values estimated from the small punch tests correlated quite well with those obtained from the uniaxial tensile tests. An iterative finite element analysis was subsequently established to simulate the small punch tests and thereby obtain the coefficients for a Ludwik power law correlation representing the true stress–strain properties. The finite element predicted force–deflection curves agreed well with the small punch test results, which were also compared with the predictions obtained from empirical equations proposed in previous studies. Finally, the fracture mechanisms of the small punch test specimens were characterized through scanning electron microscopy, indicating that the dimple fracture mechanism dominated the failure mode. The results of this study are expected to inform the application of small punch test to evaluate in-service high-strength stainless steel materials.
Introduction
Strength properties such as yield stress and ultimate strength represent fundamental properties of materials that are essential for the design of structural and machinery components.1–3 In particular, the assessment of the integrity and remaining life of in-service structures and components strongly relies on the characterization of material strength properties.4–7 Normally, the standardized tensile test specimens used to obtain strength properties must be fabricated from bulk materials.8–11 However, it is generally difficult or even impossible to remove bulk materials from an in-service structure or component as this can result in the loss of its structural integrity or a reduction in its remaining service life. In contrast, small punch tests (SPTs) require only miniscule material samples to fabricate test specimens, 12 and as such are widely used to estimate in-service component material characteristics including tensile properties,13–15 fracture toughness,16,17 and creep properties.18,19
Various standard test methods have been developed to interpret the data obtained from SPTs, including ASTM E3205, 20 CEN CWA 15672, 21 GB/T 29459.2, 22 and EN ECISS/TC101/WG1. 23 These standard methods correlate the elastic–plastic transition force, Fe, and maximum force, Fm, obtained from SPTs with the yielding stress, Rp0.2, and ultimate strength, Rm, obtained from conventional uniaxial tensile tests. Many studies have been conducted to establish empirical SPT models for predicting the strength properties of different materials. Mao and Takahashi 24 conducted pioneering work to correlate the Fe and Fm values from SPTs with tensile test-obtained Rp0.2 and Rm values. Recently, Song et al. 25 developed empirical correlations between the results of SPTs and uniaxial tensile tests for an anisotropic ASTM A350 alloy extracted from a failed forging flange. García et al. 26 discussed the effects of using different methods to obtain Fe from SPTs on the accuracy of the yield stress estimation; Bruchhausen et al. 13 performed mode modifications of the empirical correlations based on their results. Janča et al. 27 summarized and compared different methods for obtaining Fe, and Lucon et al. 17 established empirical correlations for SPTs conducted on additively manufactured Ti–6A–14V produced using different processing parameters and heat-treatment conditions.
Multiple numerical calculation methods, including finite element (FE) analyses, boundary element method, 28 phase field method, 29 have been used in many studies to interpret SPT results. Hyde et al. 30 performed two-dimensional FE analyses on the small punch creep testing of 316 stainless steel and P91 steel at elevated temperatures. Hu and Ling 31 performed three-dimensional FE simulations incorporating the Gurson–Tvergaard–Needleman plastic damage constitutive model to predict the plastic damage in a zirconium small punch specimen. Zhong et al. 32 established a numerical procedure for estimating the strength properties of SPTs using FE simulations in conjunction with hybrid particle swarm optimization. Simonovski et al. 33 developed three-dimensional FE models for SPT fuel cladding tube specimens and compared the results with those for standard flat-disc specimens having different geometric parameters. Finally, Haroush et al. 14 performed FE analyses of thin 316L stainless steel foils with thicknesses of 25–500 µm.
This study conducted SPTs on three high-strength stainless steels and correlated the results with uniaxial test results using empirical equations. The correlation factors for these equations were determined using the methods provided in several standards. Two-dimensional FE analyses were subsequently performed to predict the SPT results for different stainless steels, and the results were compared with those obtained using the empirical equations derived in this study and proposed by previous researchers. Finally, the fracture mechanisms of the ruptured SPT specimen surfaces were characterized by scanning electron microscopy (SEM). The contribution of this study comprises its determination of the mechanical properties of high-strength stainless steels using SPT to evaluate the structural integrity of in-service structures and components.
SPT materials and methods
Test specimens
Three high-strength stainless steels—a martensitic stainless steel (X17CrNi15-2) and two martensitic precipitation-hardening stainless steels (15-5PH and PH13-8Mo)—were evaluated in this study. The chemical properties of these stainless steel are listed in Table 1. Uniaxial tensile tests were conducted to determine the tensile strength properties of these three stainless steels, with the results shown in Figure 1. The load speed was 0.5 mm/min. The yield stresses and ultimate strengths of X17CrNi15-2, 15-5PH, and PH13-8Mo were obtained from Figure 1 and are reported in Table 2.

Uniaxial tensile test data of the three stainless steels.
Chemical compositions of test specimens (wt-%).

The yielding stresses and ultimate strengths.

The disc-shaped SPT specimens for each type of each stainless steel had a diameter of 10 mm, thickness of 0.5 mm, and nominal arithmetic mean roughness, Ra, of 0.4 µm in accordance with GB/T 29459.2-2012. 22 An approximate thickness of 0.65 mm was initially obtained using the electric discharge machining method and the resulting surface was polished to achieve the final thickness of 0.5 mm.
Test apparatus and procedure
Figure 2 depicts a schematic of the test apparatus used in this study, which consisted of small punch sample, retaining block, ceramic ball, compression bar, clamp, etc. The diameter of the ball was 1.25 mm, the hole diameter of the receiving die was 4 mm, and the radius of the receiving die chamfer was 0.2 mm at 45°. A constant punch displacement rate of 0.5 mm/min was applied during all SPTs. An RDF-LF3 force sensor and analog SHSCYQ 0-1 voltage sensor were used to detect the punch force and disc deflection, respectively. An RDC-DAQ high-speed data acquisition system was used to log all test data. Three SPTs were performed on each type of stainless steel to minimize the scatter of the test results.

The test apparatus of small punch tests.
SPT results and estimation of tensile properties
SPT results
Figure 3 shows the force–deflection curves obtained by the SPTs of the stainless steel specimens, in which the repeatability and reproducibility of the SPT force–deflection data are remarkable for all three materials. The average Fm obtained by the SPTs of X17CrNi15-2, 15-5PH, and PH13-8Mo, were derived from Figure 3 as 2159 N, 2469 N, and 2213 N, respectively.

The force–deflection curves of SPTs for the three stainless steels.
Correlating SPT data with uniaxial tensile test data
The correlations between the tensile strength properties—i.e. Rp0.2 and Rm—and the characteristic points on the force–deflection curves obtained by the SPTs have been proposed in previous studies (e.g. 13,24–27) and are given by


Determination of
Many researchers have proposed approaches to determine 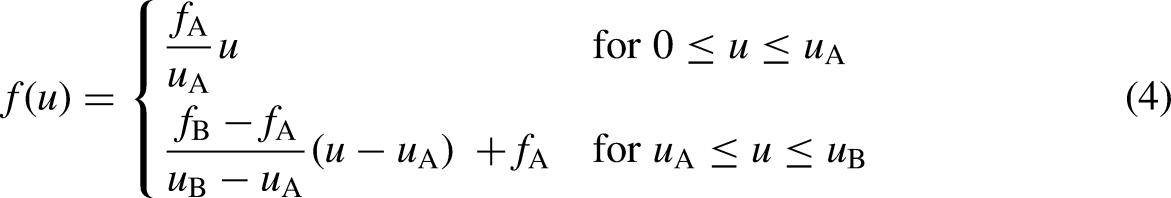

Figure 4 shows a typical result when determining

A typical result for determining
Determined

Determination of Rp0.2 and Rm
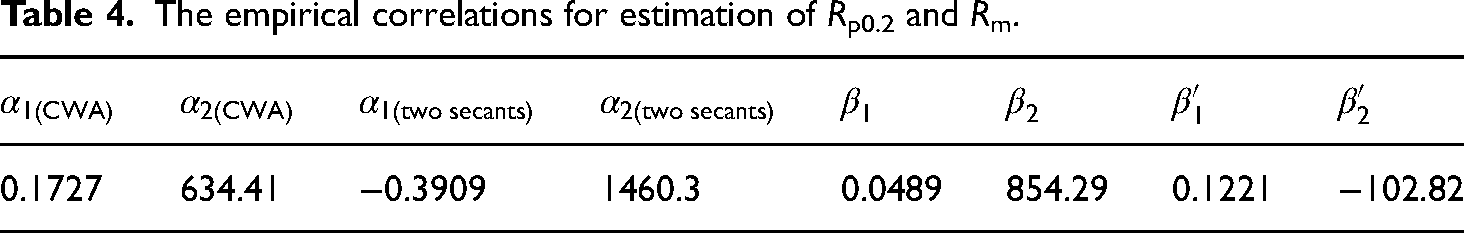
The empirical correlation factors employed in Equations (1) to (3) can be obtained by correlating the SPT-obtained
The empirical correlations for estimation of Rp0.2 and Rm.
The Rp0.2 determined from the SPT data for the three stainless steels using two different methods to characterize Fe are compared with the tensile test-obtained Rp0.2 in Figure 5, in which the offsets are clearly distributed within a factor of 1.5 above and below the unity line, indicating that the predictions of Rp0.2 using SPT data are reasonable.

Estimated R0.2 from SPTs against uniaxial results for the three stainless steels by use of the CWA and two secants methods for determining Fe.
Figure 6 compares the Rm values estimated from the SPT results using Equations (2) and (3) based on the empirical correlation factors in Table 4 with those obtained from the uniaxial tensile tests of the three stainless steels. The figure shows that the Rm values estimated from the SPT results are distributed near the unity line relative to the Rm values obtained from the uniaxial tensile tests, confirming that the proposed estimation method can provide accurate predictions of Rm for the three high-strength stainless steels.

Estimated Rm from SPTs against uniaxial results for the three stainless steels for the normalization Fm by umh0 and
FE prediction
A two-dimensional FE model was developed to simulate the SPT process. The two-dimensional model was axisymmetric. The sample was a deformable body, and the sample fixture and ceramic beads subjected to load were set as analytical rigid bodies. The four-node reduced-integration bilinear plane stress quadrilateral (CPS4R) element was used to mesh the SPT disc specimens with an element size of 0.05, as this allowed large strains and deformations to be modelled.
36
The ball and upper and lower clamps were modelled using rigid bodies to eliminate any effects of potential deformation during the simulation. A small sliding assumption was used to model the ball-to-disc and clamp-to-disc contacts with a constant friction coefficient of 0.2, as suggested in Refs.37,38 The steel ball was applied displacement load to press down on the specimen and the force applied to the steel ball was obtained. The deflection changes of the sample through node 1 was recorded to obtain the force deflection curve. Both the upper and lower fixtures fixed all degrees of freedom. In addition to the true stress–strain curve, the required material mechanics parameters for FE simulation include a Young's modulus E of 200 GPa and a Poisson's ratio v of 0.3. The grid size is 0.05 mm × 0.05 mm, which is widely used for simulating small punch bar tests and can converge. The software used was Abaqus 2022. The stress–strain curve was fitted following the form of the Ludwik power law correlation, as proposed in previous studies32,39,40 and given by
Zhong et al.
32
developed a procedure for predicting the SPT force–deflection results using an iterative FE analyses. Thus, the Ludwik model parameters were determined in this study by extracting the true stress–strain curve from iterative FE-simulated SPT force–deflection curves using the procedure presented in Figure 7. These force–deflection curves were compared with the test results using the objective function f of the Ludwik model parameters to minimize the difference between the FE predictions and test results as follows:
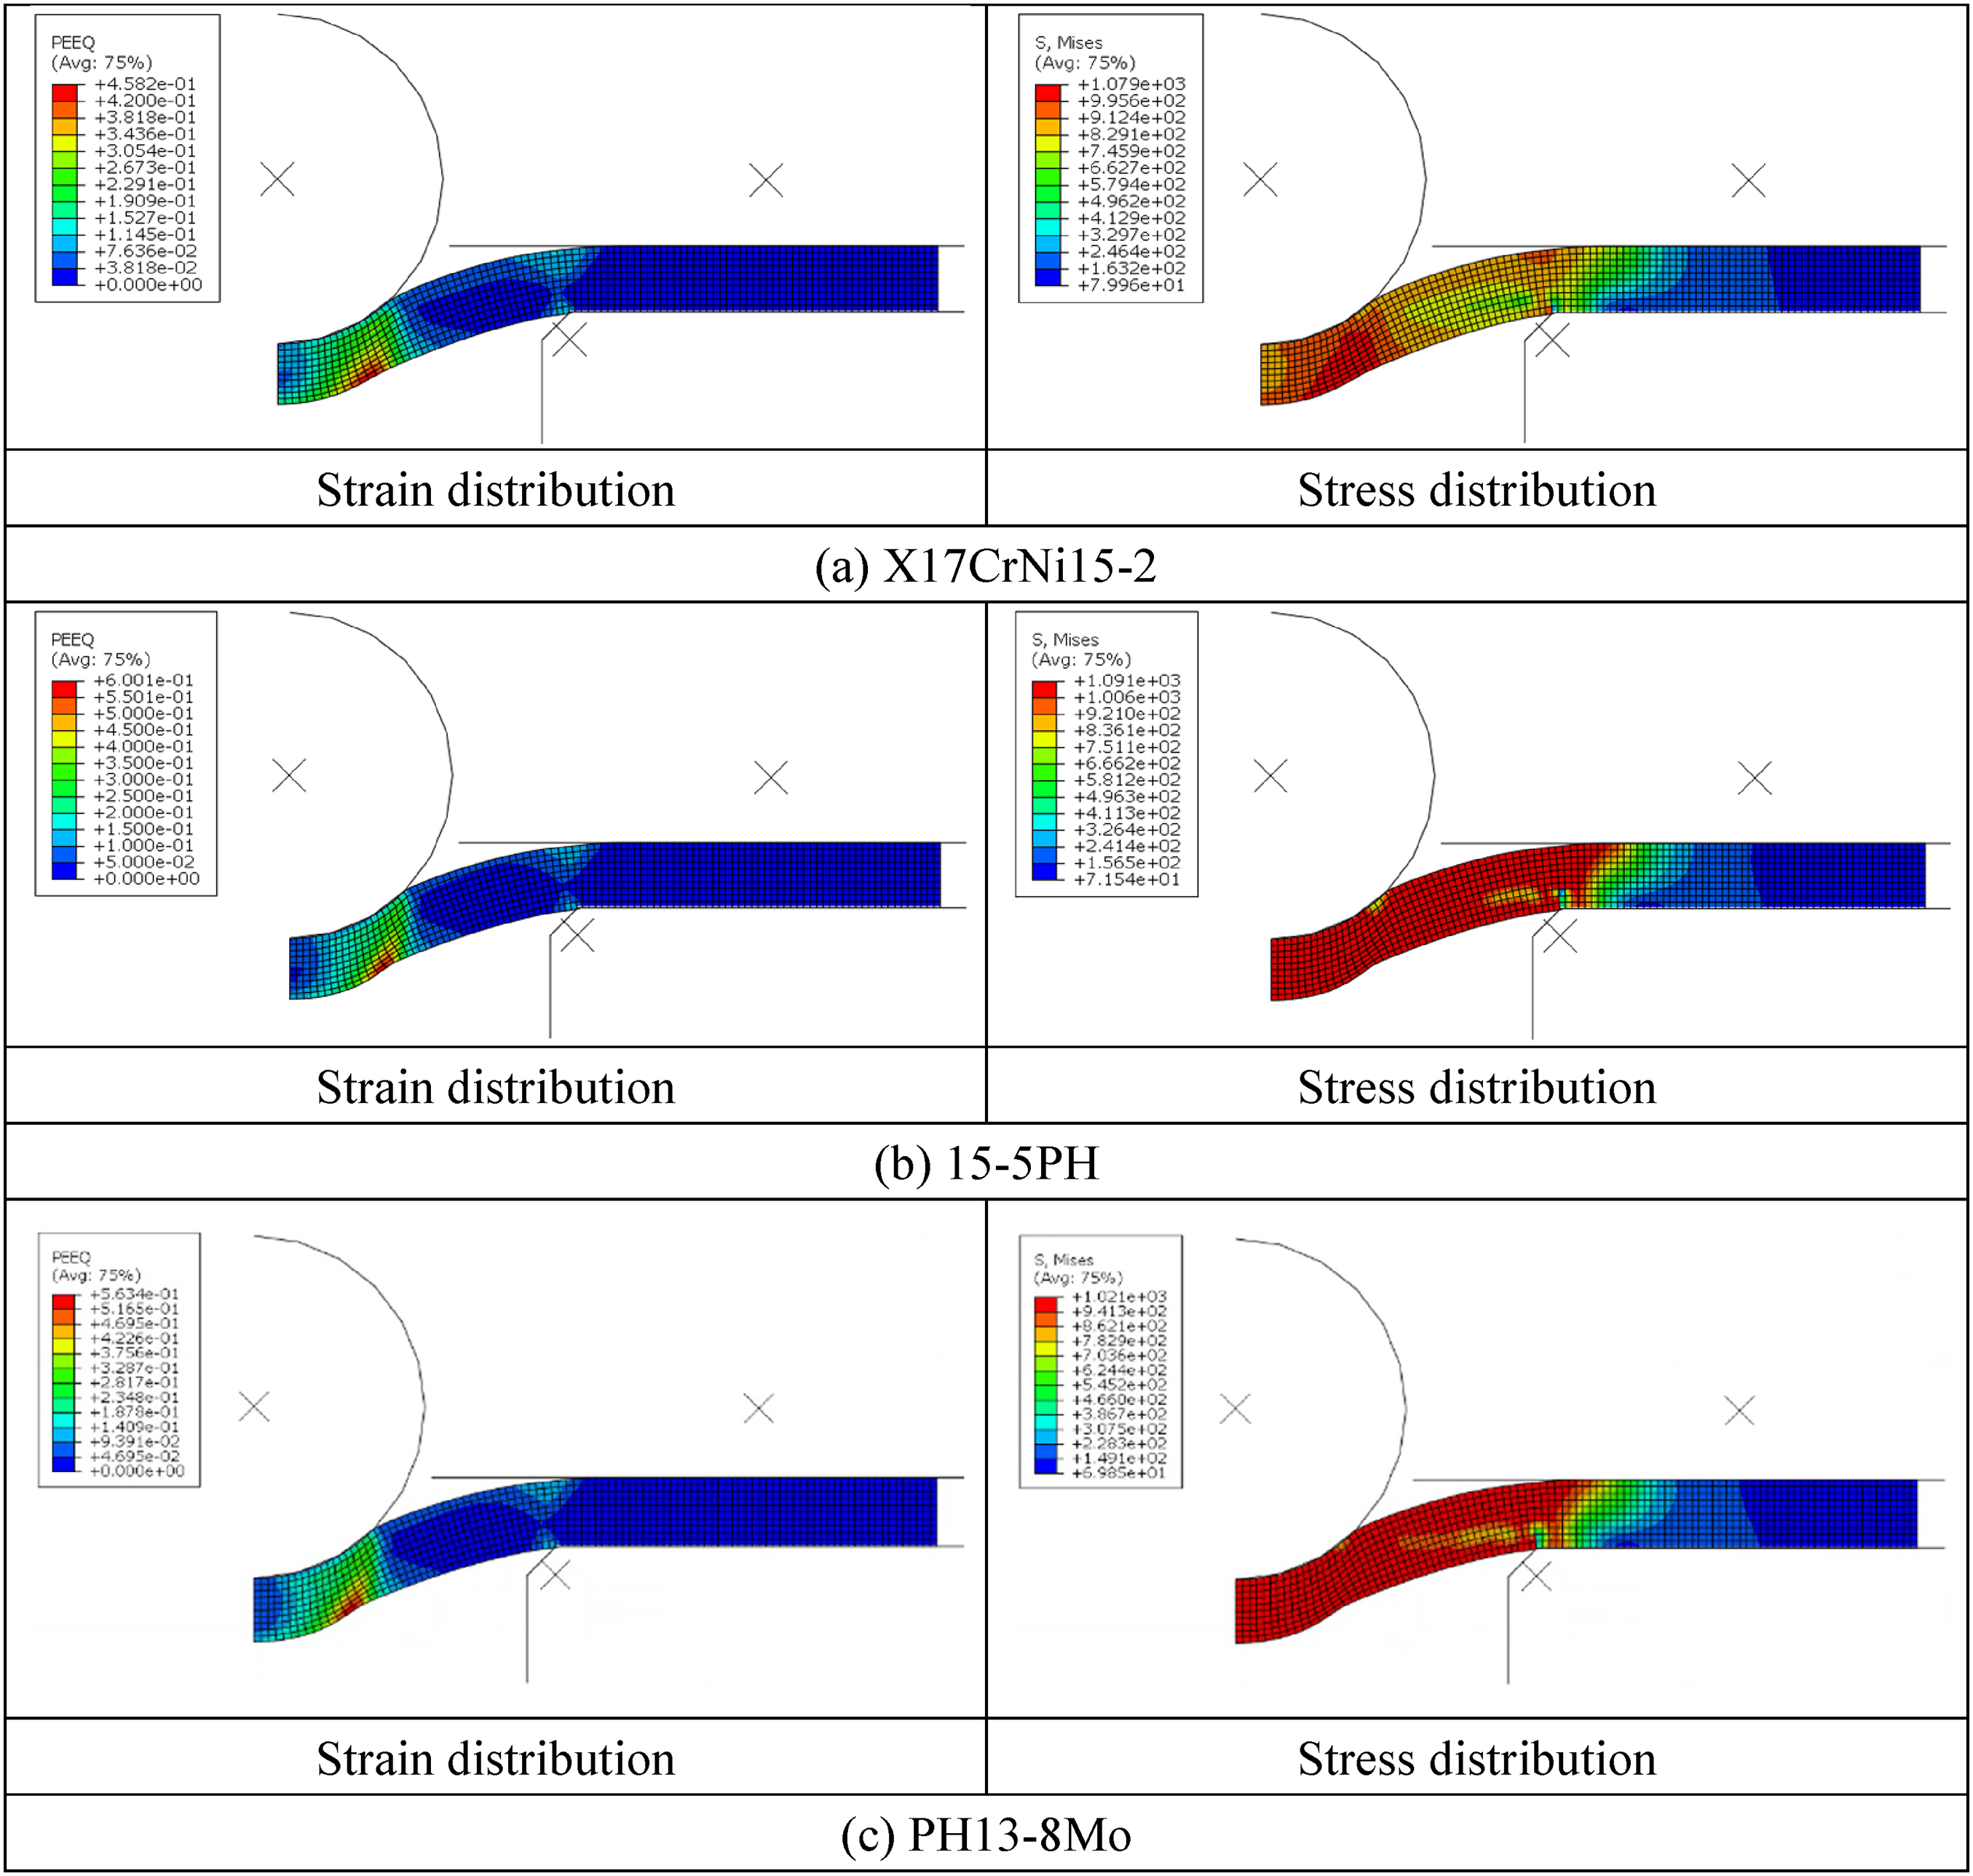
Strain and stress distributions for the three stainless steels obtained from FE analyses with the same deflection of 0.7 mm.
Discussion
Comparison between the proposed empirical correlation and FE predictions
The FE-predicted stress and strain distributions for the three stainless steels at a deformation of 0.7 mm are provided in Figure 8, which shows that the stress distributions in the deformation areas of the 15-5PH and PH13-8Mo specimens were more uniform than those of the X17CrNi15-2 specimen, indicating that the yield strength ratio of X17CrNi15-2 was smaller. The predicted force–deflection curves for the three stainless steels are also shown in Figure 8, confirming that the FE-predicted force–deflection curves agreed well with the test results in the approximately linear section of each SPT curve. Hence, the Ludwik model parameters obtained for the three stainless steels using the iterative FE analyses, listed in Table 5, can be considered verified.

Comparison between the experimental and FE-predicted SPT force–deflection curves for three stainless steels.
The Ludwik model parameters for the three stainless steels obtained from iterative FE analyses.

Comparison between the proposed empirical correlation and previous models
Table 6 lists the empirical correlations obtained in previous studies. The estimated Rp0.2 values determined by the different methods in Table 4 are shown according to the uniaxial yield stress in Figure 9. Only the Rp0.2 values estimated by the Lucon et al. 17 model agreed well with the values obtained using the correlation derived in this study, as shown in Figure 10.

Estimated R0.2 from SPTs against uniaxial results for the three stainless steels by use of the different models.

Estimated R0.2 from SPTs against uniaxial results for the three stainless steels by use of the correlations developed in this study and Lucon et al.'s model. 5
Empirical correlations for SPTs proposed by previous studies.

Figure 11 compares the Rm values estimated using the different models with those obtained by the uniaxial tensile tests. The predictions of the models developed by Song et al. 25 and García et al. 26 were underestimated for all three stainless steels, showing considerable offsets below the unity line. The results obtained using the models developed by Janča et al., 27 Bruchhausen et al., 13 and Lucon et al. 17 were consistent with those estimated using the equations derived in this study.
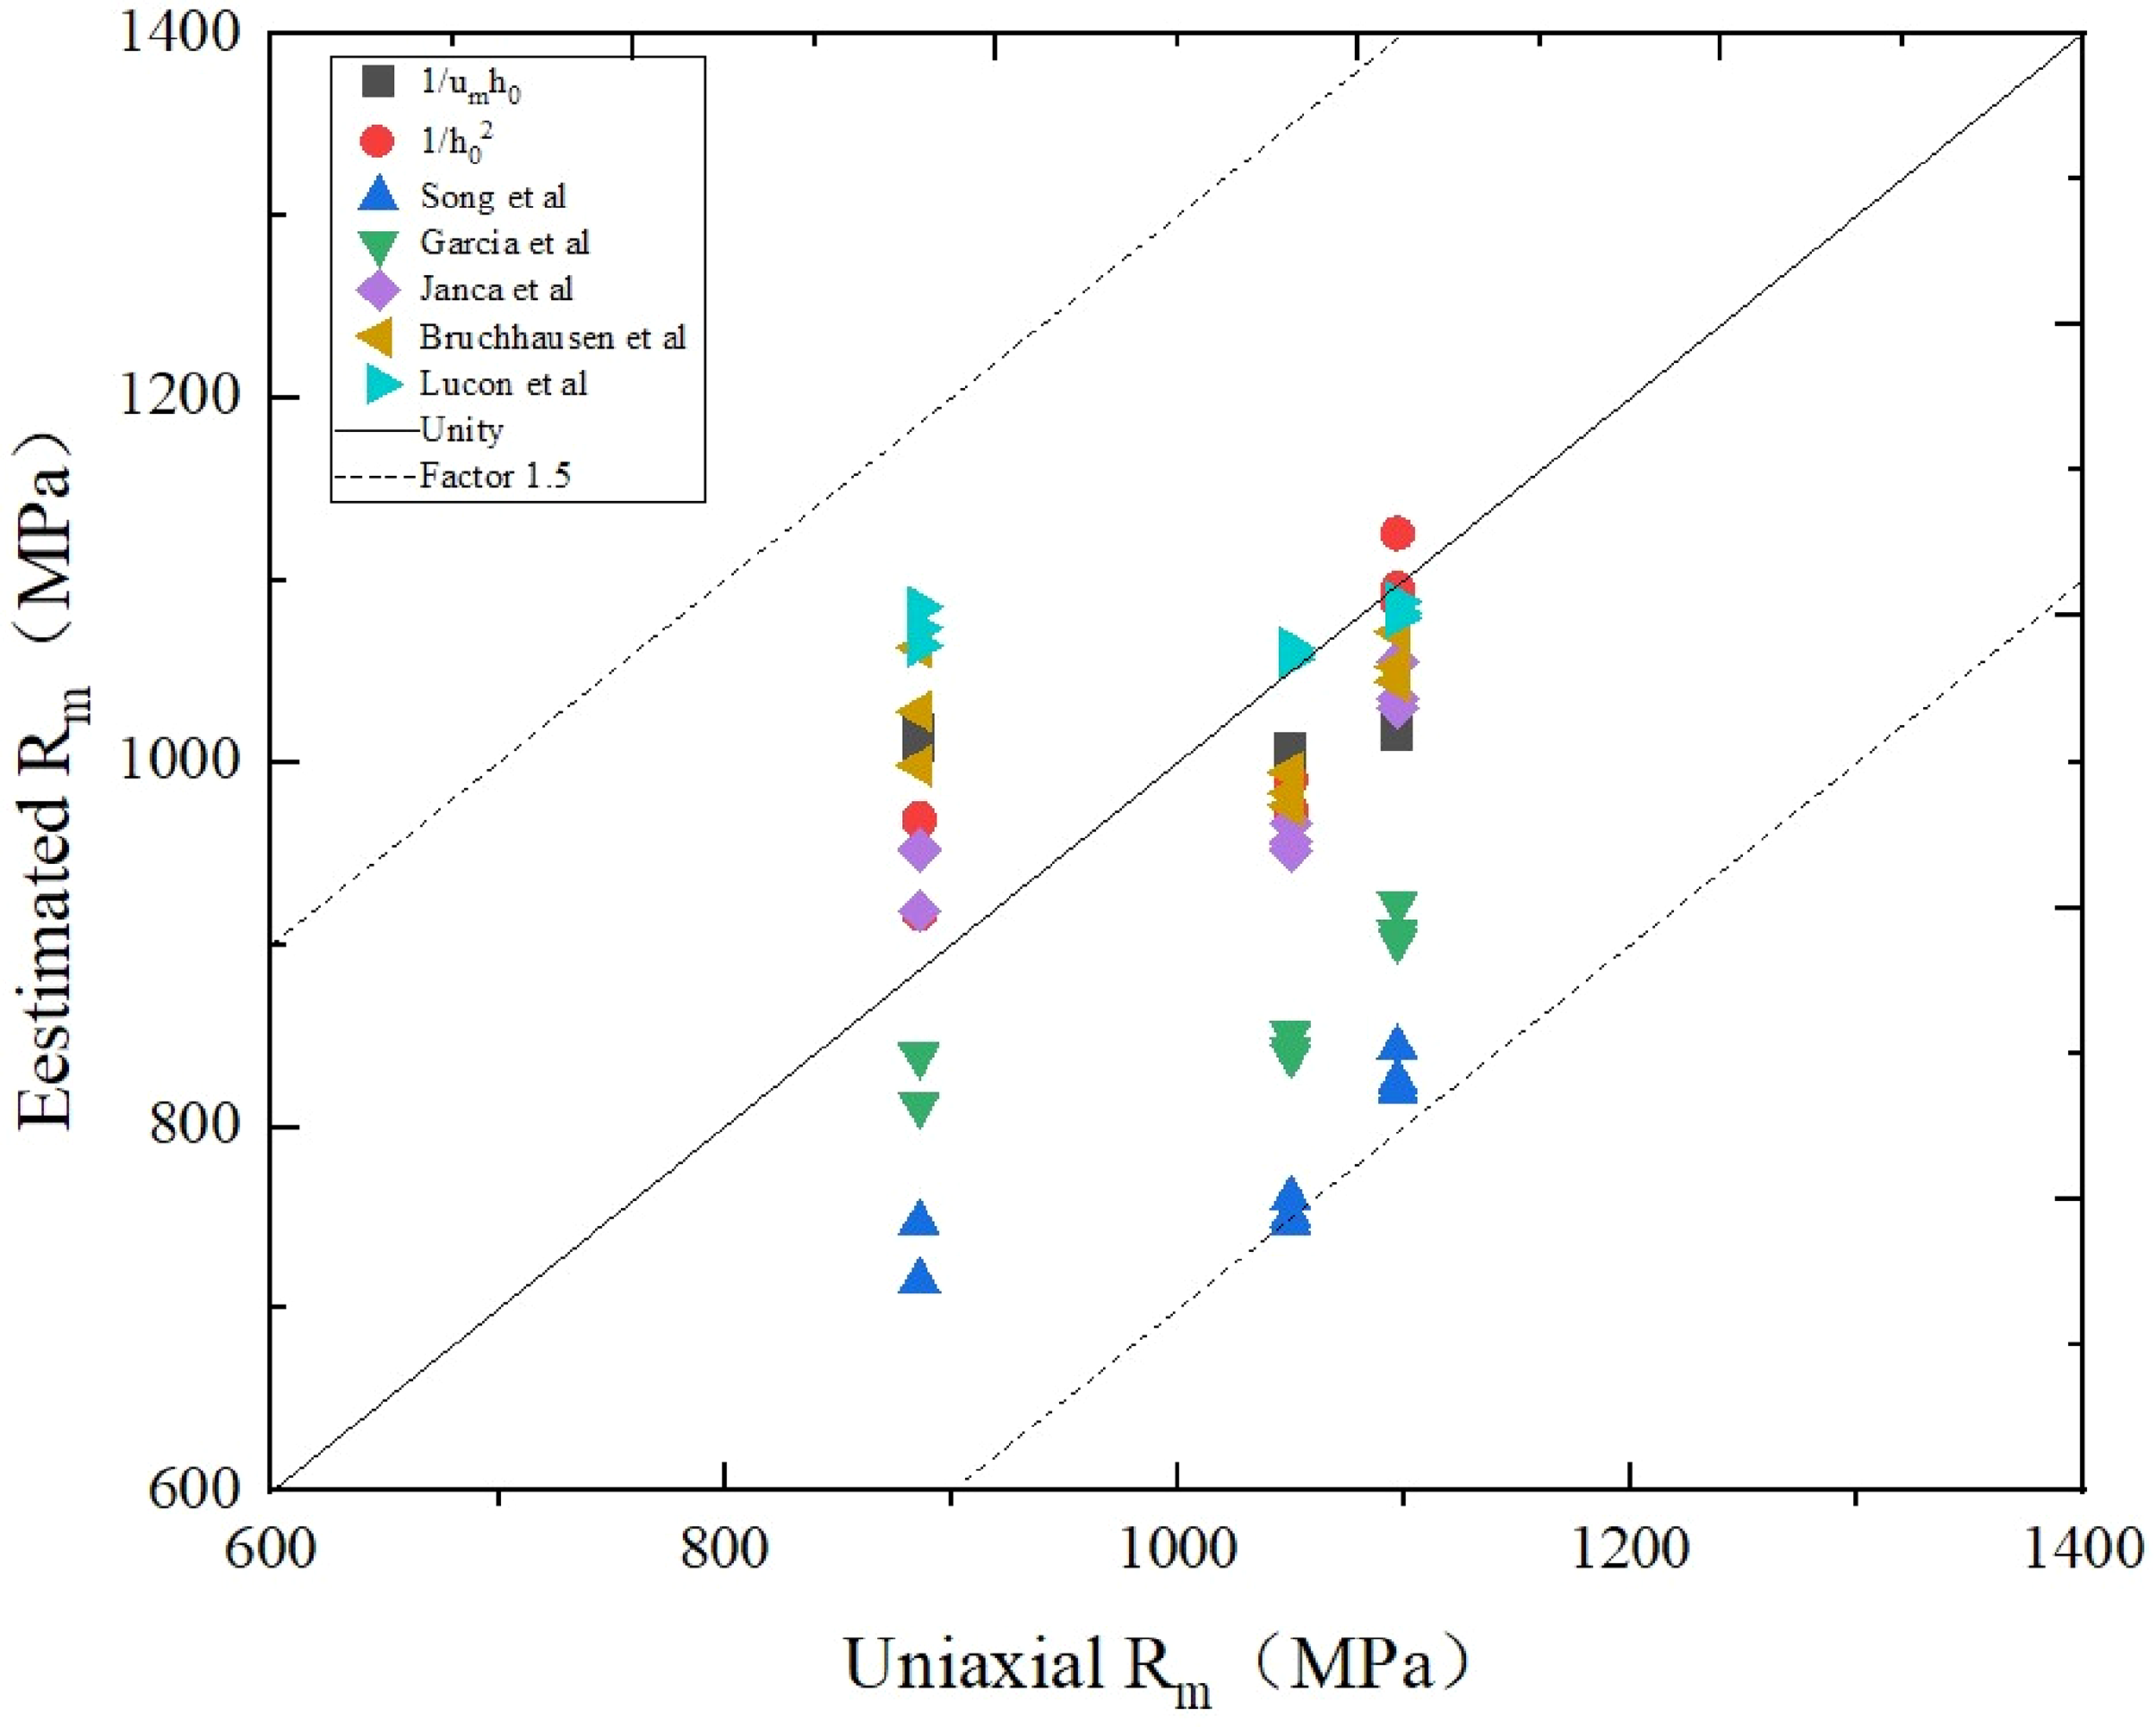
Estimated Rm from SPTs against uniaxial results for the three stainless steels by use of the different models.
Although the model proposed by Lucon et al. 17 was originally established to predict the tensile strength of additively manufactured Ti–6Al–4V, it is also clearly applicable to the stainless steel. The results of these comparisons confirm the accuracy of the empirical coefficients obtained for Equations (1) to (3) from the SPT results in this study.
SEM analyses of deformed and ruptured specimens
Figure 12 shows SEM fractographs depicting the ruptured surfaces of the SPT specimens of the three considered stainless steels. As shown in Figure 12(a), the ruptured surface of the X17CrNi15-2 specimen indicated a transgranular ductile fracture characterized by the presence of dimples caused by microvoid coalescence. As shown in Figure 12(b), considerable plastic deformation and dimple fracture were observed in the 15-5PH SPT specimen. Finally, Figure 12(c) shows that the ruptured surface of the PH13-8Mo SPT specimen was dominated by the dimple fracture mechanism and associated with the shear fracture mode.
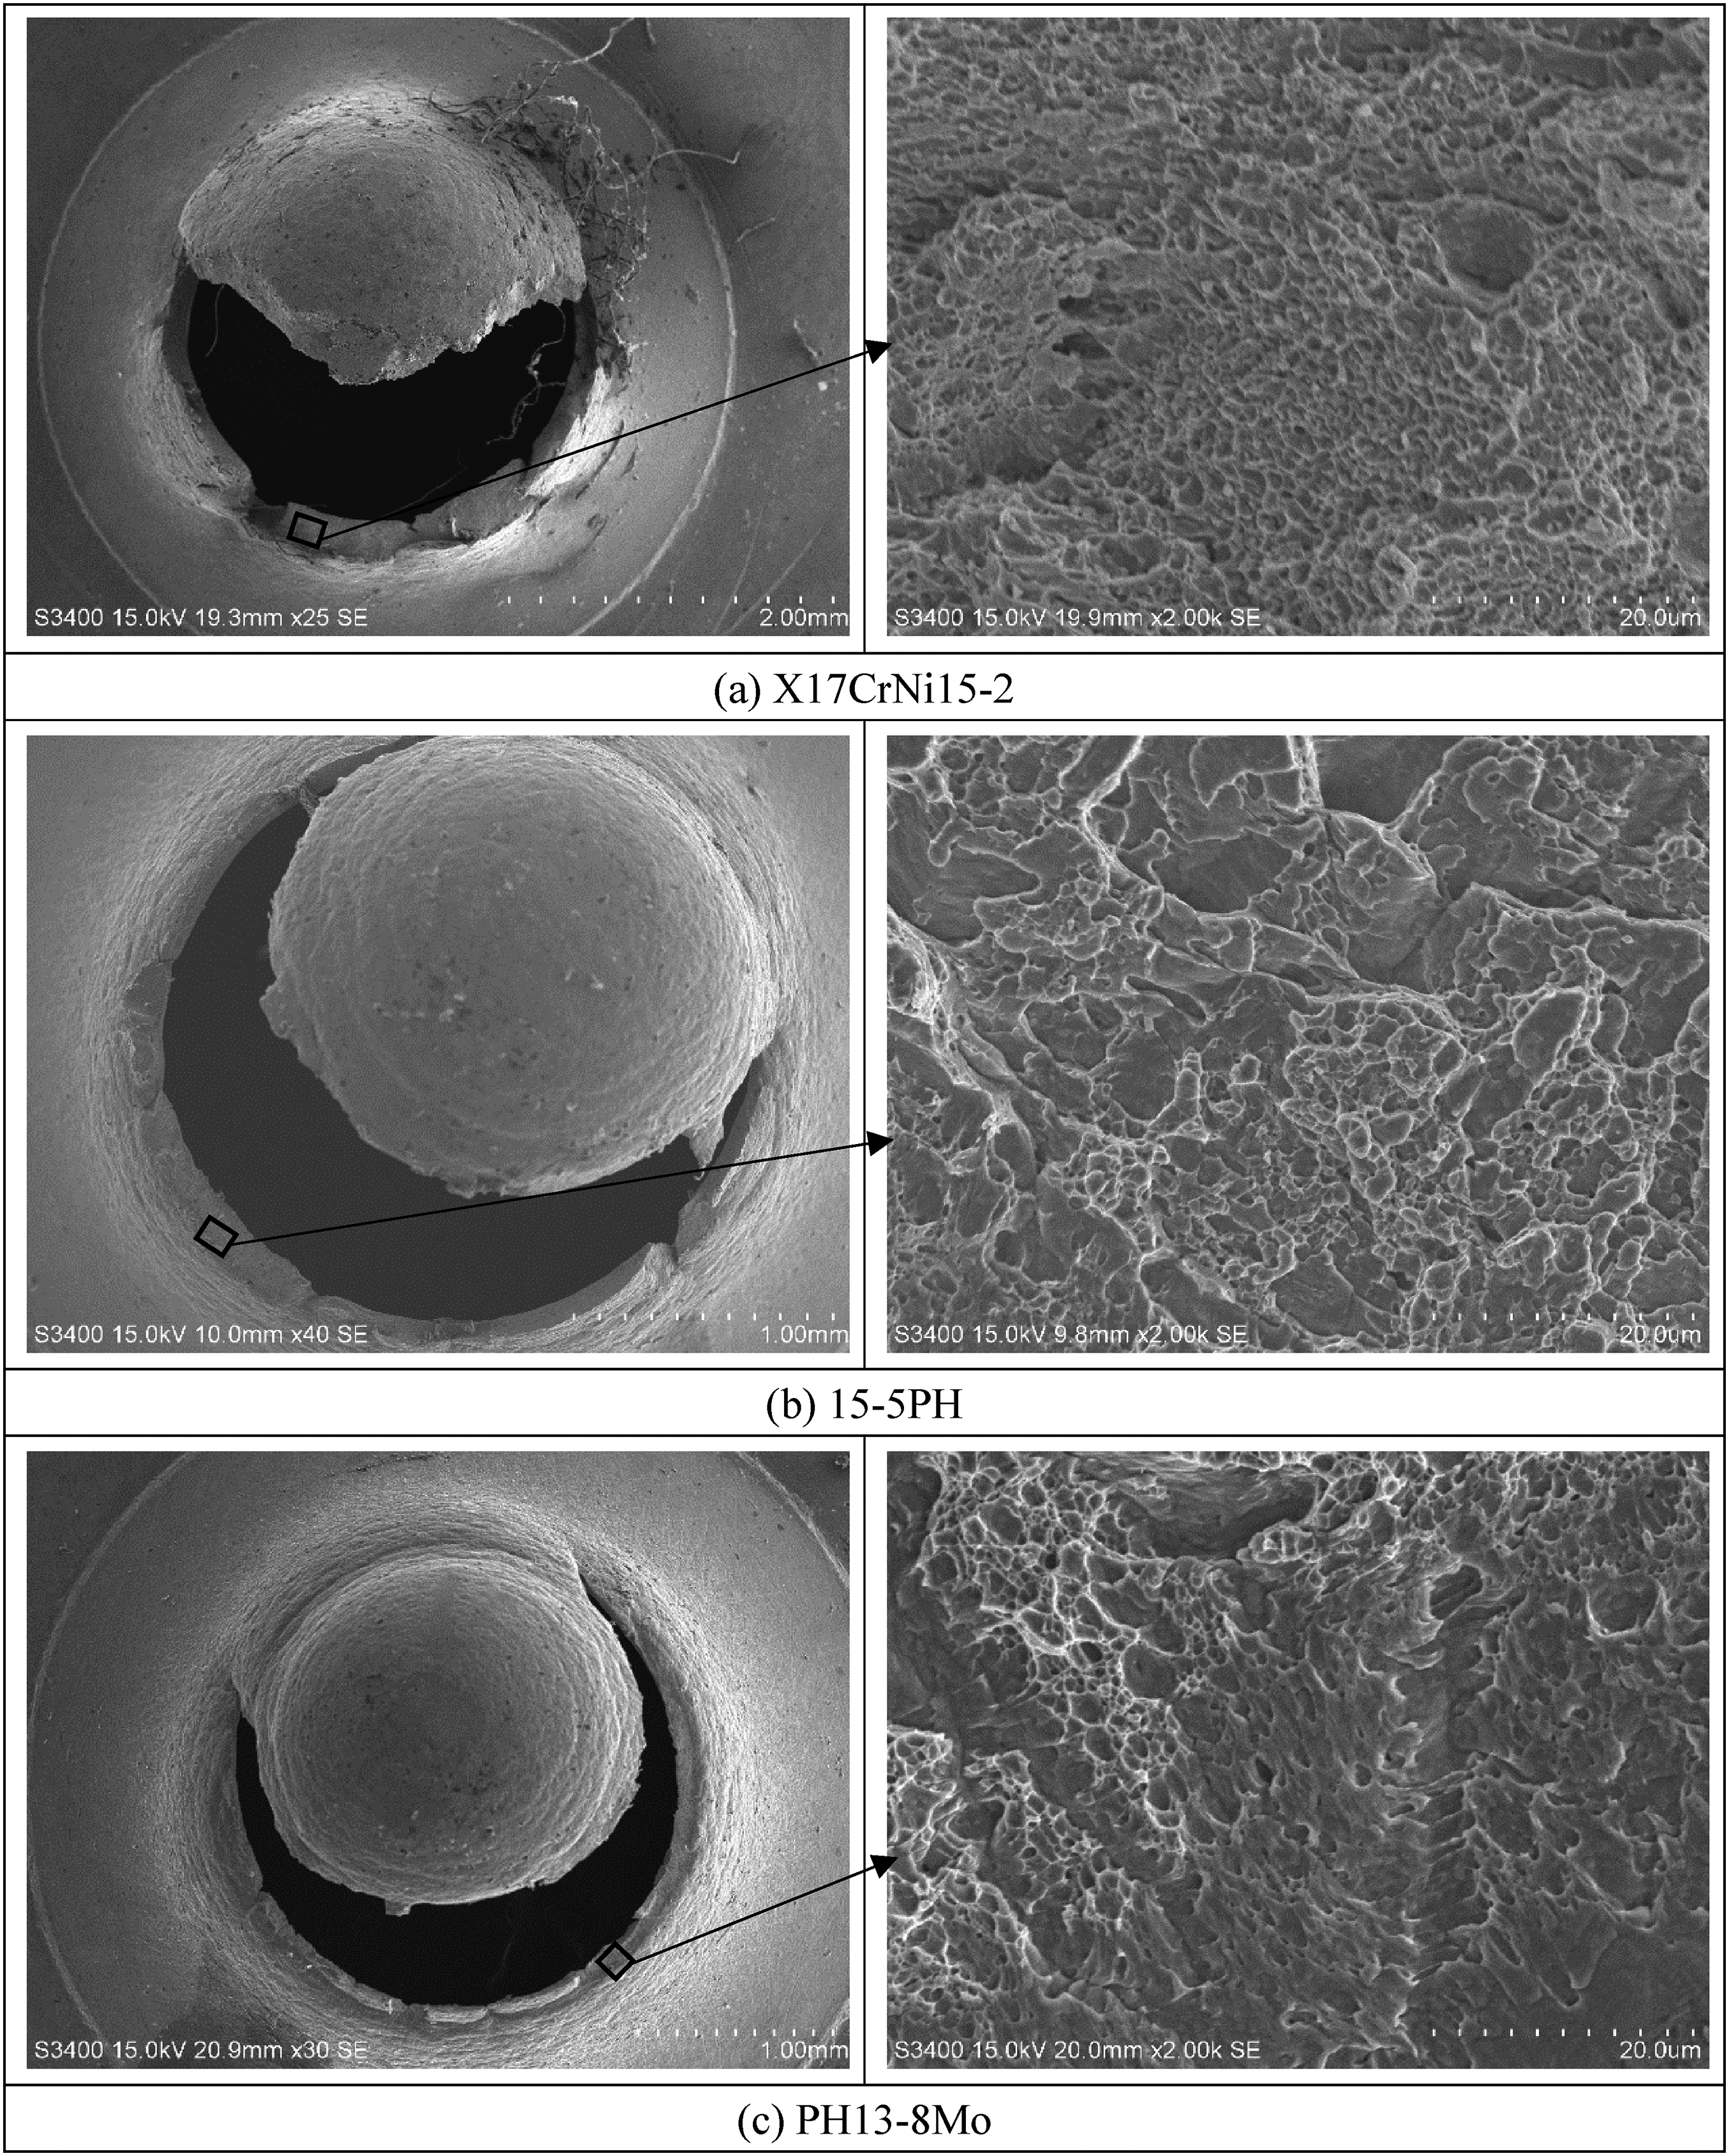
SEM fractographs on the ruptured surface of the SPT specimens for the three stainless steels.
Conclusions
This study estimated the strength properties of three high-strength stainless steels by conducting SPTs of 10 mm diameter, 0.5 mm-thick disc specimens. The correlations between the tensile strength properties and characteristic points on the SPT-obtained force–deflection curves were captured using different methods and compared.
Iterative FE analyses were subsequently used to simulate the SPT results and obtain the Ludwik model parameters representing the true stress–strain correlation. The FE-predicted force–deflection curves agreed well with the test results in the approximately linear section of each SPT curve. The SPT results were also compared with those of several empirical equations developed in previous studies; the SPT-derived Rp0.2 and Rm were generally consistent with the values obtained using the model proposed by Lucon et al. 17
Finally, SEM analyses were conducted on the ruptured surfaces of the stainless steel SPT specimens. The resulting SEM fractographs indicated that the dimple fracture mechanism dominated the fracture mode, with transgranular ductile fracture occurring in all three stainless steels. The shear fracture mode was also detected in the PH13-8Mo SPT specimen.
Footnotes
Acknowledgments
This research was supported by CCTEG Project (2023-TD-MS015, 2023-TD-QN004) and TMIC Project (2022TM-167M) funding, China.
Author contributions
Conceptualization was done by Ran Li and Wenshu Wei; formal analysis by Ran Li; investigation by Yuehua Lai; data curation by Rongming Chen and Mengyu Wu; writing—original draft preparation by Ran Li; writing—review and editing by Yuehua Lai. All authors have read and agreed to the published version of the manuscript.
Declaration of conflicting interests
The authors declared no potential conflicts of interest with respect to the research, authorship, and/or publication of this article.
Funding
The authors disclosed receipt of the following financial support for the research, authorship, and/or publication of this article: This work was supported by the China Coal Technology Engineering Group (grant numbers 2023-TD-MS015, 2023-TD-QN004).