
Abstract
Background:
Sudden sensorineural hearing loss is a prevalent ear disorder requiring acute intervention, characterized by unclear etiology and challenging therapeutic interventions. This study aims to identify potential biomarkers for sudden sensorineural hearing loss through metabolomic profiling.
Methods:
We analyzed metabolomic data samples from a database associated with sensorineural hearing loss. Metabolomic analysis identified significantly differential metabolites in reversed-phase liquid chromatography and hydrophilic interaction liquid chromatography modes. We further validated abnormal metabolites using plasma samples from 51 sudden sensorineural hearing loss patients and 26 healthy controls in the case-control study.
Results:
Metabolomic analysis revealed 75 and 76 significantly differential metabolites in reversed-phase liquid chromatography and hydrophilic interaction liquid chromatography modes, respectively. Integrating metabolomic and transcriptomic analyses, we validated four abnormal metabolites—triglyceride, lipase, S-adenosyl methionine, and cholesterol—in our cohort. In the serum of patients with sudden sensorineural hearing loss, the contents of triglyceride, lipase, S-adenosyl methionine, and cholesterol were significantly increased. These metabolites demonstrated significant discriminatory potential in distinguishing sudden sensorineural hearing loss patients from healthy controls.
Conclusions:
Our findings underscore the promising utility of metabolomic profiling as a valuable approach for identifying potential biomarkers and unraveling the underlying mechanisms of sudden sensorineural hearing loss.
Keywords
Introduction
Sudden sensorineural hearing loss (SSNHL), commonly known as sudden deafness (SD), is characterized by the National Institute on Deafness and Other Communication Disorders as a swift decline (< 3 days) of more than 30 dB sensorineural hearing loss which refers to any cause of hearing loss due to a pathology of the cochlea, auditory nerve, or central nervous system, across at least three contiguous frequencies. It constitutes a frequent ear emergency, compelling patients to seek immediate assistance from otolaryngologists and audiologists. In some cases when a central hearing loss is observed, neurological care is also necessary. Cases with an identifiable cause are categorized as non-idiopathic SSNHL. The incidence of SSNHL ranges from 5 to 27 per 100,000 people annually. 1 The etiology of SSNHL remains a matter of debate. Causative factors for SD/SSNHL include primary and secondary origins. Primary causes are commonly attributed to viral infection, vascular insufficiency, and autoimmune disorders.2–4 In contrast, secondary SSHL can be linked to Ménière's disease and neoplasm, stroke, and irradiation.5–8 Given its medical significance, a thorough examination to identify potential causes and prompt initiation of treatment are crucial for enhancing hearing outcomes in SSNHL patients. Despite numerous studies aiming to identify diagnostic and prognostic biomarkers for SSNHL, reliable indicators in clinical practice remain elusive.9–11
Metabolomic profiling, an evolving field, involves the comprehensive analysis of small-molecule metabolites in biological samples, such as blood, urine, and tissues.12–14 This approach can offer valuable insights into the metabolic changes associated with diseases and facilitate the identification of potential biomarkers for diagnosis and treatment.15–18 Consequently, our study aimed to explore the metabolomic profile of SSNHL patients and identify potential biomarkers for this disorder.
We hypothesize that the metabolomic profile of SSNHL patients differs from that of healthy controls, and specific metabolites could serve as potential biomarkers for SSNHL. To investigate this hypothesis, we assembled patient arrays comprising 51 SSNHL patients and 26 controls for metabolomic analysis. Additionally, we conducted a metabolomics–transcriptomics combination analysis using raw data from databases and further validated our findings in serum samples. Subsequently, we identified four differential serum metabolites in SSNHL patients, providing insights into potential biomarkers. Our findings aim to enhance the understanding of SSNHL pathogenesis and contribute to the development of targeted therapies for this disorder.
Materials and methods
Experimental samples and preoperative preparation
Between January 2023 and April 2023, a total of 51 patients diagnosed with idiopathic SSNHL, including unilateral and bilateral deafness, and 26 healthy control subjects were recruited consecutively from outpatient otolaryngology clinics for the case-control research according to the general formula for calculating the sample size. The reporting of this study conforms to the STROBE case-control checklist. 19 All participants were informed about the study's purpose and procedures, providing written consent before participation. The study was conducted in accordance with the Helsinki Declaration of 1975 as revised in 2013. Ethical approval was obtained from the Ethics Committee of Longgang E.N.T Hospital & Shenzhen Key Laboratory of E.N.T, Institute of E.N.T, Shenzhen (Approval No. 2022-0253). All the participants completed relevant otologic examinations, including examination of the periauricular skin and lymph nodes, otoscopy, and tympanometry to rule out lesions in the outer and middle ear. Otoacoustic emission (OAE) screening mild or severe hearing loss, and distinguishes between sensorineural and neural hearing loss. Temporal bone magnetic resonance imaging assessment of pathological changes in patients with sudden deafness excluded cerebellopontine angle lesions such as acoustic neuroma. SSNHL diagnosis was established using a pure tone audiometer (PTA) in accordance with Chinese Academy of Otolaryngology (CMAO) guidelines (Editorial Board of the Chinese Journal of Otolaryngology H, 2015). 20 Pure-tone audiometry in a sound isolation room to ensure accurate hearing threshold measurements includes air conduction testing to measure the ability of the entire auditory system to hear using earphones, and bone conduction testing to distinguish between conductive and sensorineural hearing loss by measuring the inner ear response by bypassing the outer and middle ears with a bone vibrator placed on the mastoid or forehead. The audiometry tests were conducted using the R27A Resonance® Audiometer, manufactured by Resonance (Gazzaniga (BG) Italy). Exclusion criteria encompassed refusal to participate, known etiology of SSNHL, treatment delay exceeding 30 days, 18 years or older, and under 65 years of age, recent use of anti-diabetes or lipid-lowering drugs, significant heart, kidney, or metabolic diseases, and acute inflammation. Demographic and clinical data, including age, gender, affected side, and pure-tone thresholds, were collected before treatment initiation. For the statistical analysis, the normality of the data distribution was assessed using the Shapiro-Wilk test via SPSS version 26.0 (IBM, Chicago, IL, USA). Then serum samples of all the participants were collected. We quantified the concentration of triglyceride (TG), lipase (LIP), S-adenosyl methionine (SAMY), and cholesterol (CHOL)) of the samples for confirming the differential metabolite changes by enzyme-linked immunosorbent assay (ELISA) kits (Meimian, Nanjing, China), following the kit manufacturer's instructions. On a microplate reader (SpectraMax® absorbance readers, Molecular Devices, Shanghai, China), the optical density was read at 450 nm. All the samples were analyzed in a single step and in duplicate.
Data sources
Raw data were retrieved from Supplemental Material in the paper by Ji et al. 21 at 10.1038/s41598-019-45385-8. This dataset comprised 30 samples, including 15 mice exposed to noise (100 dB SPL for 2 hours) forming the experimental group and 15 control mice, which were divided into three biological replicate experiments, each with 5 animals per group (exposed to noise and control). Temporal bones were harvested immediately post-exposure, and samples were divided into three batches for analysis using Agilent 1290 UHPLC and 6490 Triple Quadrupole (QqQ) Mass Spectrometer (LC-MS/MS). Two liquid chromatography methods—reversed-phase liquid chromatography (RPLC) for hydrophobic/non-polar metabolites and hydrophilic interaction liquid chromatography (HILIC) for polar/ionic metabolites-generated two datasets per batch—additionally, mouse cochlear hearing-loss gene chip expression profile data (GSE84735) from NCBI GEO, uploaded by Kashio A and Someya S, were downloaded. Each dataset contained 10 samples, including five noise-induced deafness mice (experimental group), and five control mice.
Data processing and analysis of the metabolomics data
MetaboAnalyst 5.0 (http://www.metaboanalyst.ca)22,23 was utilized to analyze metabolite and pathway differences between experimental and control groups. Missing values were replaced by 1/5 of the min positive values. Metabolites with Student's t-test P value < 0.1 were further investigated. The volcano plot displayed differentially expressed metabolites (DEMs) with low Student's t-test P values and large fold changes (FCs) (|log2(FC)| > 0.58). Venn diagrams illustrated common DEMs between batches.
Pathway analysis of the metabolomics data
MetaboAnalyst 5.0 was employed for pathway analysis using hypergeometric tests with Holm-Bonferroni-corrected P values. Significantly enhanced metabolic pathways were identified at P < 0.05, while pathways with P < 0.15 were considered significantly enriched. Pathway topological analysis relied on relative betweenness centrality.
Data normalization and identification of differentially expressed genes
Raw files from GEO were pre-processed and normalized using the robust multiarray average (RMA) method in R software (Version 4.0.1) affy package. The Limma package analyzed differences between groups, visualized via a volcano plot. Criteria for differentially expressed genes (DEGs) were log2(FC) > 1 or < −1 and P value < 0.05. Heatmaps visualized significantly expressed genes.
Metabolomics–transcriptomics combination analysis
Nine pathways with P < 0.1 were further analyzed. DEMs and DEGs were extracted, and data from the Kyoto Encyclopedia of Genes and Genomes (KEGG) database were used to map DEMs and associated DEGs in respective metabolic pathways.
Statistical analysis
SPSS Version 26.0 (IBM, Chicago, IL, USA) was employed for statistical analysis. Results were presented as means ± standard deviation (SD) or medians (interquartile range) for continuous variables and frequencies or percentages for categorical variables. Student's t-test or Mann-Whitney U test determined differences between groups, with P values < 0.05 considered statistically significant. ROC analysis assessed the performance of the metabolic biomarker panel.
Results
Clinical characteristics of participants
The study encompassed 51 patients with SSNHL and 26 control subjects. Plasma samples were collected from SSNHL patients before treatment. Table 1 outlines the clinical characteristics of the study participants. We observed a significant difference in pure tone hearing between the two groups. However, the non-significant age difference between them suggests they are suitable for further analyses.
Clinical characteristics of this study.

NC: normal control; SSNHL: sudden sensorineural hearing loss.
Mean ± SD.
Unpaired t-test.
Chi-square test.
Identification of differential metabolites in Hl samples
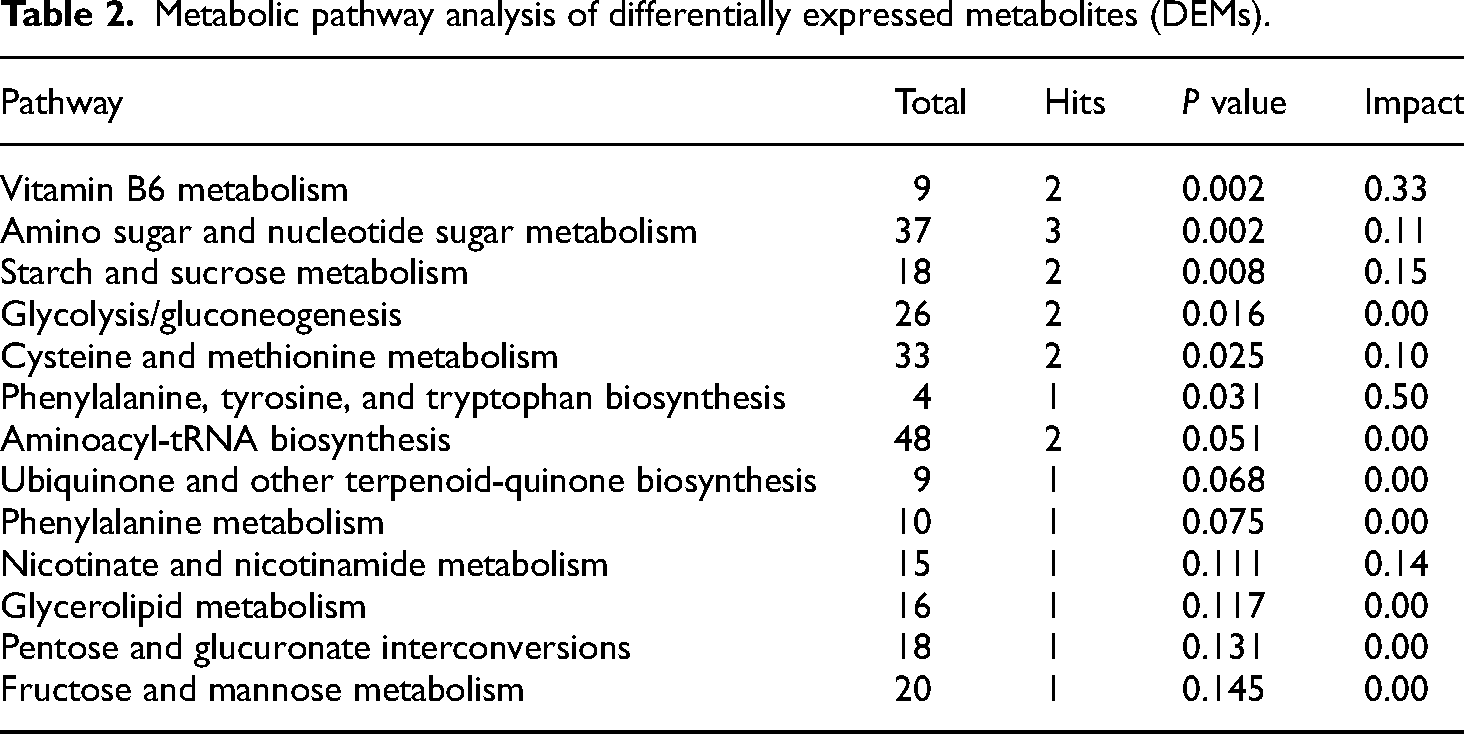
From three biological replicate experiments, each with 5 samples per group (hearing loss and control group), we identified 209, 221, and 225 metabolites in the RPLC modes, derived from experiments 1, 2, and 3, respectively. Additionally, in the HILIC modes, 214 and 212 metabolites were identified in experiments 2 and 3. Among the quantifiable metabolites, using the criteria (P < 0.1; |log2(FC)| > 0.58), a total of 75 and 76 differential metabolites were identified in the RPLC and HILIC modes. In the RPLC modes, there were 28 (with 14 enriched and 15 depleted metabolites), 23 (with 13 enriched and 10 depleted metabolites), and 51 (with 36 enriched and 15 depleted metabolites) significantly differential metabolites altogether in these three biological replicate groups, respectively (Figure 1(a) to (c)). In the HILIC modes, there were 40 (with 33 enriched and seven depleted metabolites) and 48 (with 34 enriched and 14 depleted metabolites) significantly differential metabolites altogether in the two biological replicate groups, respectively (Figure 1(e) and (f)). Then, we conclude all the differential metabolites in replicate experimental batches, which were consistent across all the experiments and present in at least 50% of all samples. Elevated differential metabolites included D-ribose 5-phosphate, pyridoxal 5-phosphate, D-fructose 6-phosphate, phosphoglyceric acid, phosphoenolpyruvic acid, AICAR monophosphate, dihydroxyacetone phosphate, guanosine 5-diphosphoglucose, cytidine 5-diphosphate, 3-phosphoserine, guanosine 5-monophosphate, pyridoxal 5-phosphate, d-glucosamine 6-phosphate, and 2 deoxy-D-ribose, whereas decreased metabolites included L-tyrosine and 2-methylmaleate (Figure 1(d) and (g)). To evaluate potentially altered metabolic pathways, we found that these differential metabolites were enriched in 15 pathways in comparison (P < 0.15) (Table 2 and Figure 1(h)), which encompass diverse types including vitamin B metabolism, glycometabolism and amino acid metabolism, and others. It would be beneficial to identify the parameters with the highest impact, including L-tyrosine, L-methionine, D-fructose 6-phosphate, pyridoxal phosphate, D-glucosamine 6-phosphate, pyridoxamine, and glycerone phosphate. These parameters were ranked based on their impact on hearing loss. While metabolic pathways encompassed the highest count, this pathway essentially encompasses all content of this analysis, rendering it unsuitable for effectively distinguishing between the hearing-loss group and the NC group. Hence, metabolic pathways were excluded from selection. Therefore, the critical question remains: which specific differential metabolites exhibit the most pronounced differences, offering greater insights for SSNHL diagnosis?

Differential expression metabolites and pathway analysis: (a) Volcano plot in experiment 1 with RPLC; (b) volcano plot in experiment 2 with RPLC; (c) volcano plot in experiment 3 with RPLC; (d) Venn diagram with RPLC; (e) volcano plot in experiment 2 with HILIC; (f) volcano plot in experiment 3 with HILIC; (g) Venn diagram with HILIC; and (h) pathway analysis of DEMs. The red plots represent the upregulated metabolites and the purple plots represent the down-regulated metabolites.
Metabolic pathway analysis of differentially expressed metabolites (DEMs).
Transcriptomics analysis of Hl samples
Transcriptome analysis of the cochlear tissues in the experimental and control groups was performed. Of the 106 DEGs recorded (P < 0.05; |log2(FC)| > 1), down-regulation was observed for 87 DEGs, and up-regulation was observed for 19 DEGs (Figure 2(a)). Hierarchical clustering heatmaps were constructed based on the top 50 DEGs (Figure 2(b)).
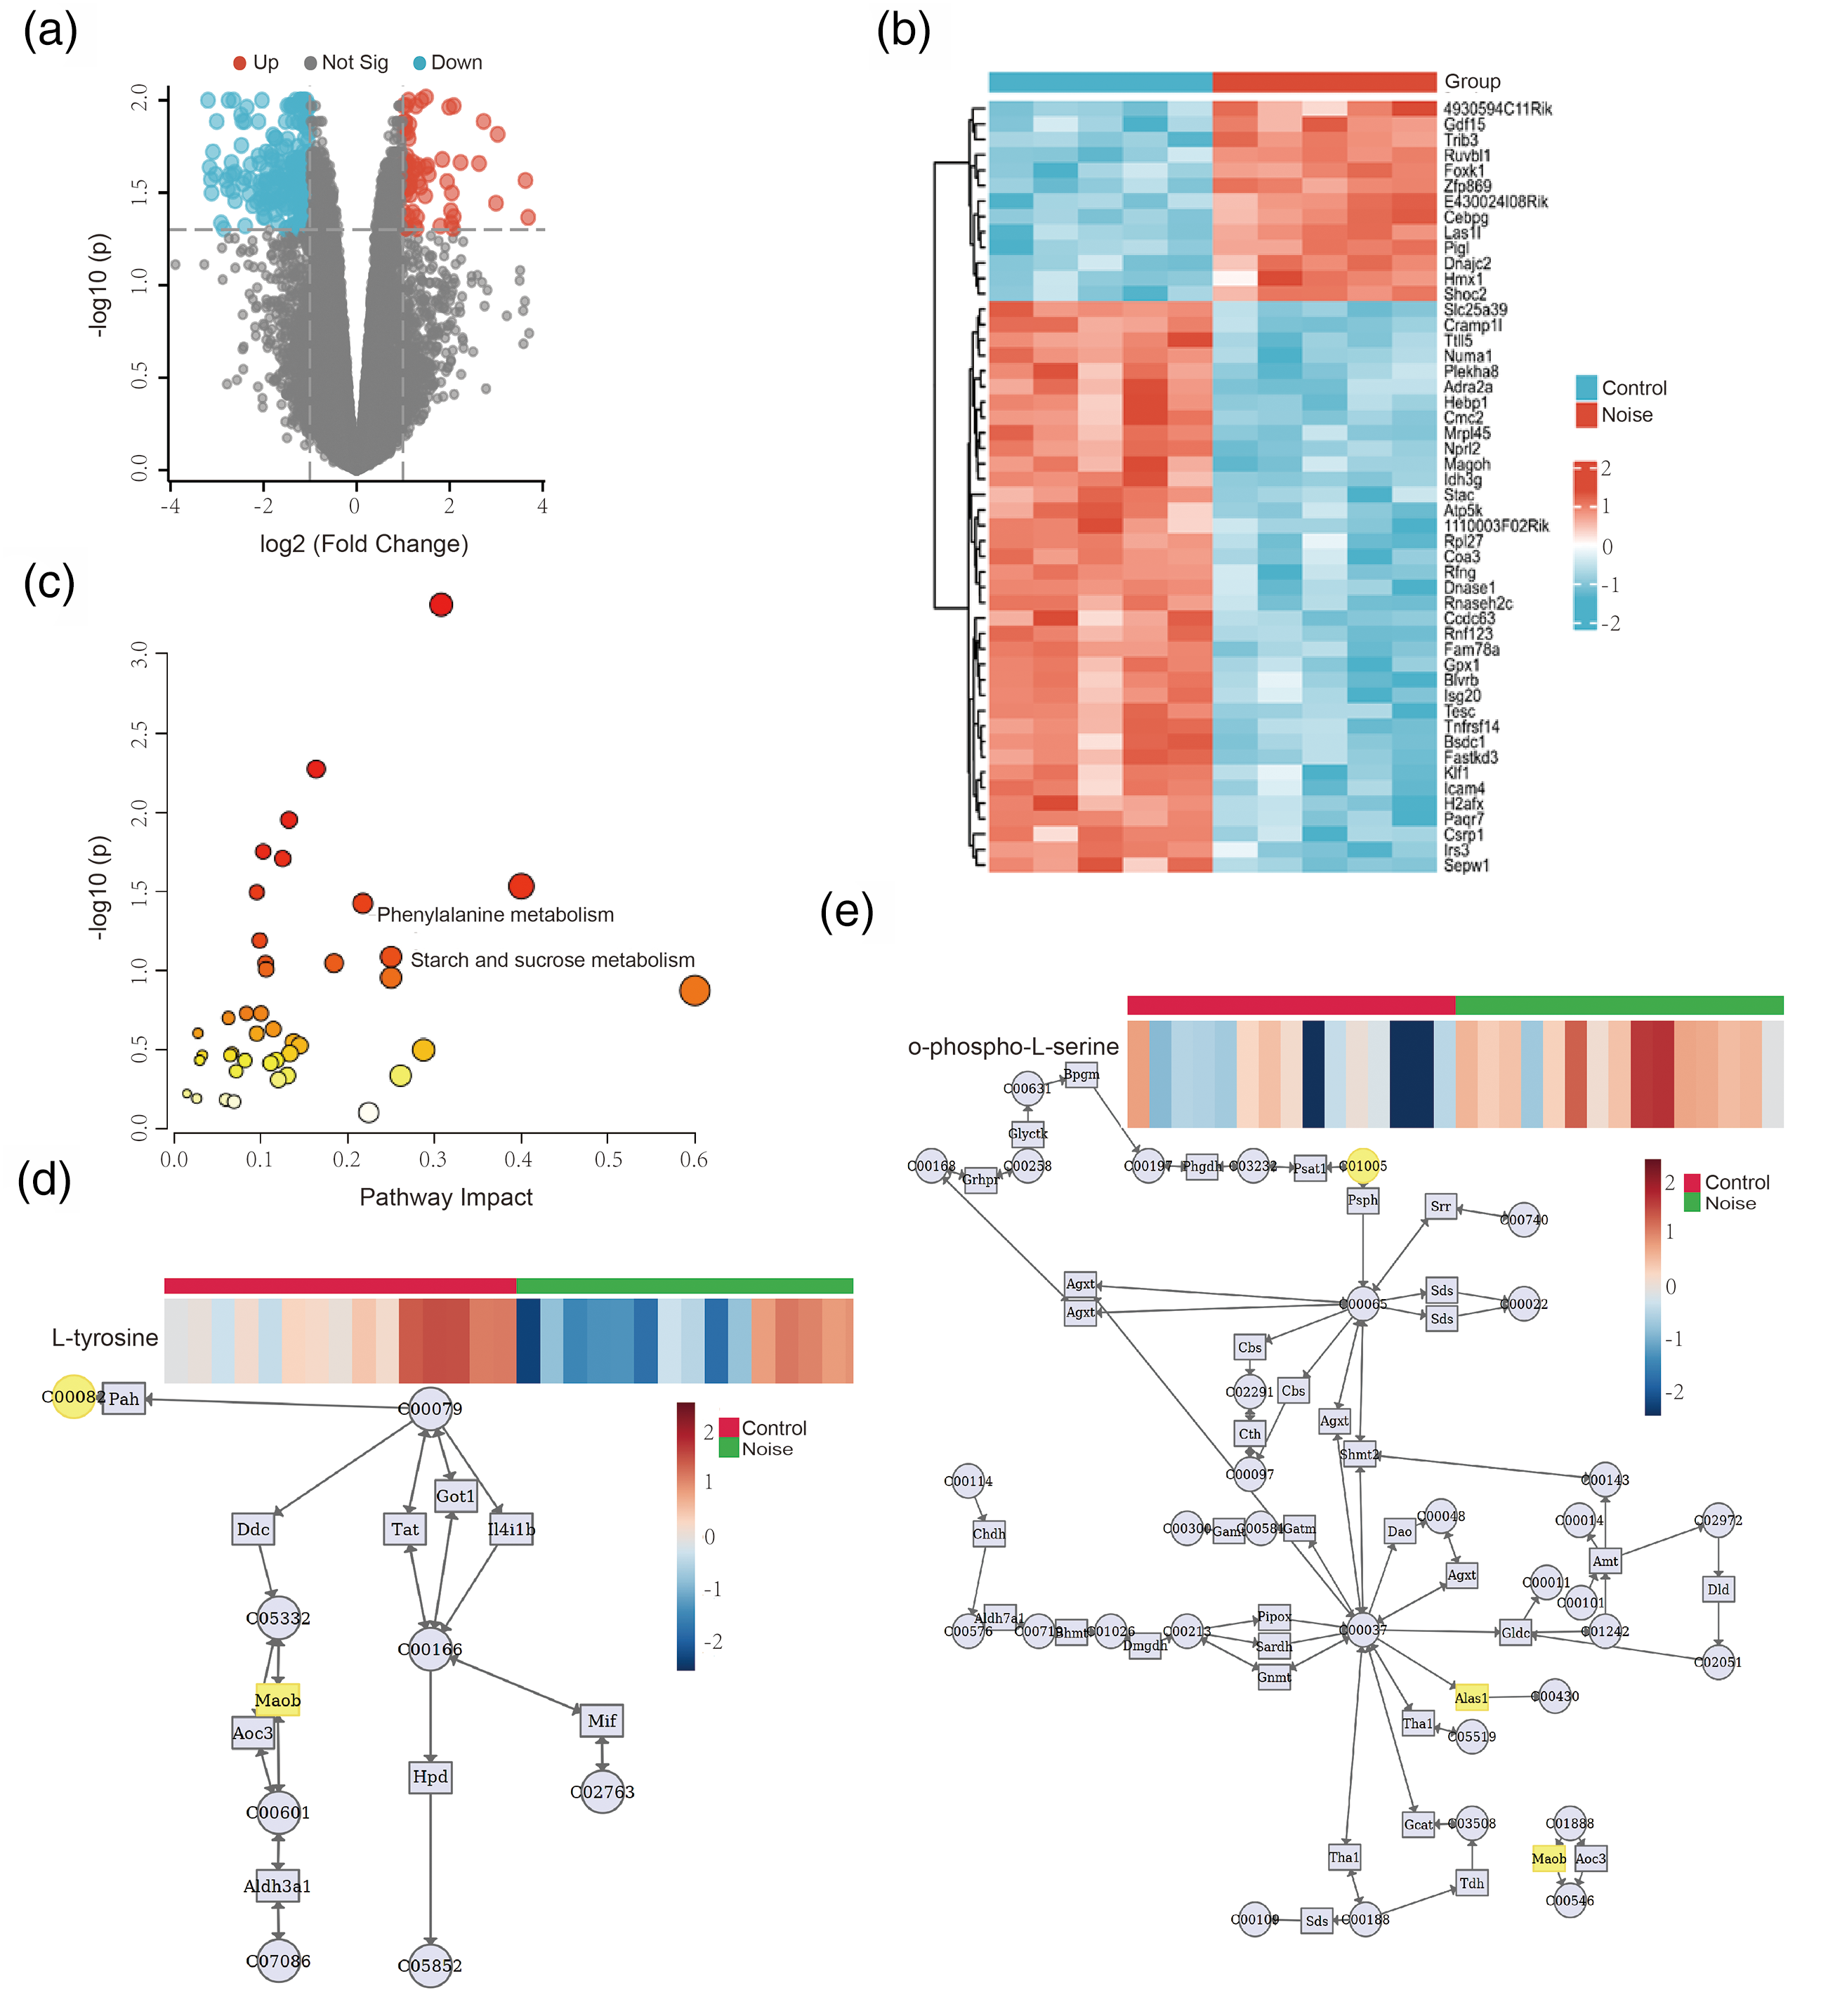
Identification of DEGs and metabonomics–transcriptomics combination analysis. (a) Volcano plot of DEGs between the hearing loss and control group. The red plots represent the upregulated genes, the gray plots represent the nonsignificant genes, and the blue plots represent the down-regulated genes. (b) Heatmap of DEGs. Red rectangles represent the high expression, and green rectangles represent the low expression; (c) pathway analysis of DEMs and DEGs; (d) phenylalanine metabolism; and (e) glycine, serine, and threonine metabolism.
Metabolomics–transcriptomics combination analysis
DEMs obtained under the RPLC and HILIC modes and the transcriptome data were subjected to conditions of the metabolomics–transcriptomics combination analysis method. Furthermore, we employed a significant pathway plot to analyze the top 15 enriched pathways (P < 0.1) (Figure 2(c)), which encompass diverse types including lipid metabolism, amino acid metabolism, vitamin B metabolism, and others. Table 3 detailed the specific differential pathways with the most pronounced differences combining to DEMs and DEGs, offering insights for SSNHL diagnosis. Finally, through comprehensive metabolomics and metabolic transcriptomic results, two common metabolites were identified, respectively, L-tyrosine altered decreasing in the phenylalanine metabolism pathway, and o-phospho-L-serine altered increasing in glycine, serine, and threonine metabolism pathway (Figure 2(d) and (e) and Table 3) (these two metabolites are consistent in at least two experimental batches from metabolomics analysis).
Metabolic pathway analysis of DEMs and DEGs.

DEGs: differentially expressed gene; DEMs: differentially expressed metabolites.
Patients with SSNHL have multiple metabolite abnormalities
Based on the above analysis results, DEMs and DEGs were mainly enriched in lipid metabolism and amino acid metabolism. However, given the difficulty of clinical detection of all identified differential metabolites, as well as the financial burden on patients, further analysis is needed to obtain profiles of common differential metabolites with more common clinical detection methods. Surprisingly, we found that sn-glycerol 3-phosphate was significantly increased in the glycerolipid metabolism pathway, whose downstream TG, and LIP were widely detected in clinical practice. Also, L-methionine was significantly decreased in cysteine and methionine metabolism pathways, whose downstream is SAMY from Table 2. For the same advantage, we also choose CHOL which altered increasingly in experiment 3. Therefore, we decided to verify whether the abnormal metabolites, including TG, LIP, SAMY, and CHOL, had the same trend in patients with SSNHL. We analyze the contents of TG, LIP, SAMY, and CHOL in the plasma of SSNHL and control groups. Significantly higher contents of TG, LIP, SAMY, and CHOL were observed in the SSNHL groups. We found TG (P = 0.0345), LIP (P = 0.0067), SAMY (P = 0.0419), and CHOL (P = 0.001) in the plasma of participants, as shown in Figure 3(a) to (d). Then we used the data from 88 participants to assess the diagnostic performance. Significantly, the biomarker panel was capable to discriminate of patients with SSNHL from controls with AUC reaching 93.44% (95% CI: 88.05%–98.83%) and 88.24% sensitivity, 88.46% specificity (Figure 3e). These results with high sensitivity and specificity suggest the potential of the metabolic biomarker panel in the competent diagnosis of SSNHL.
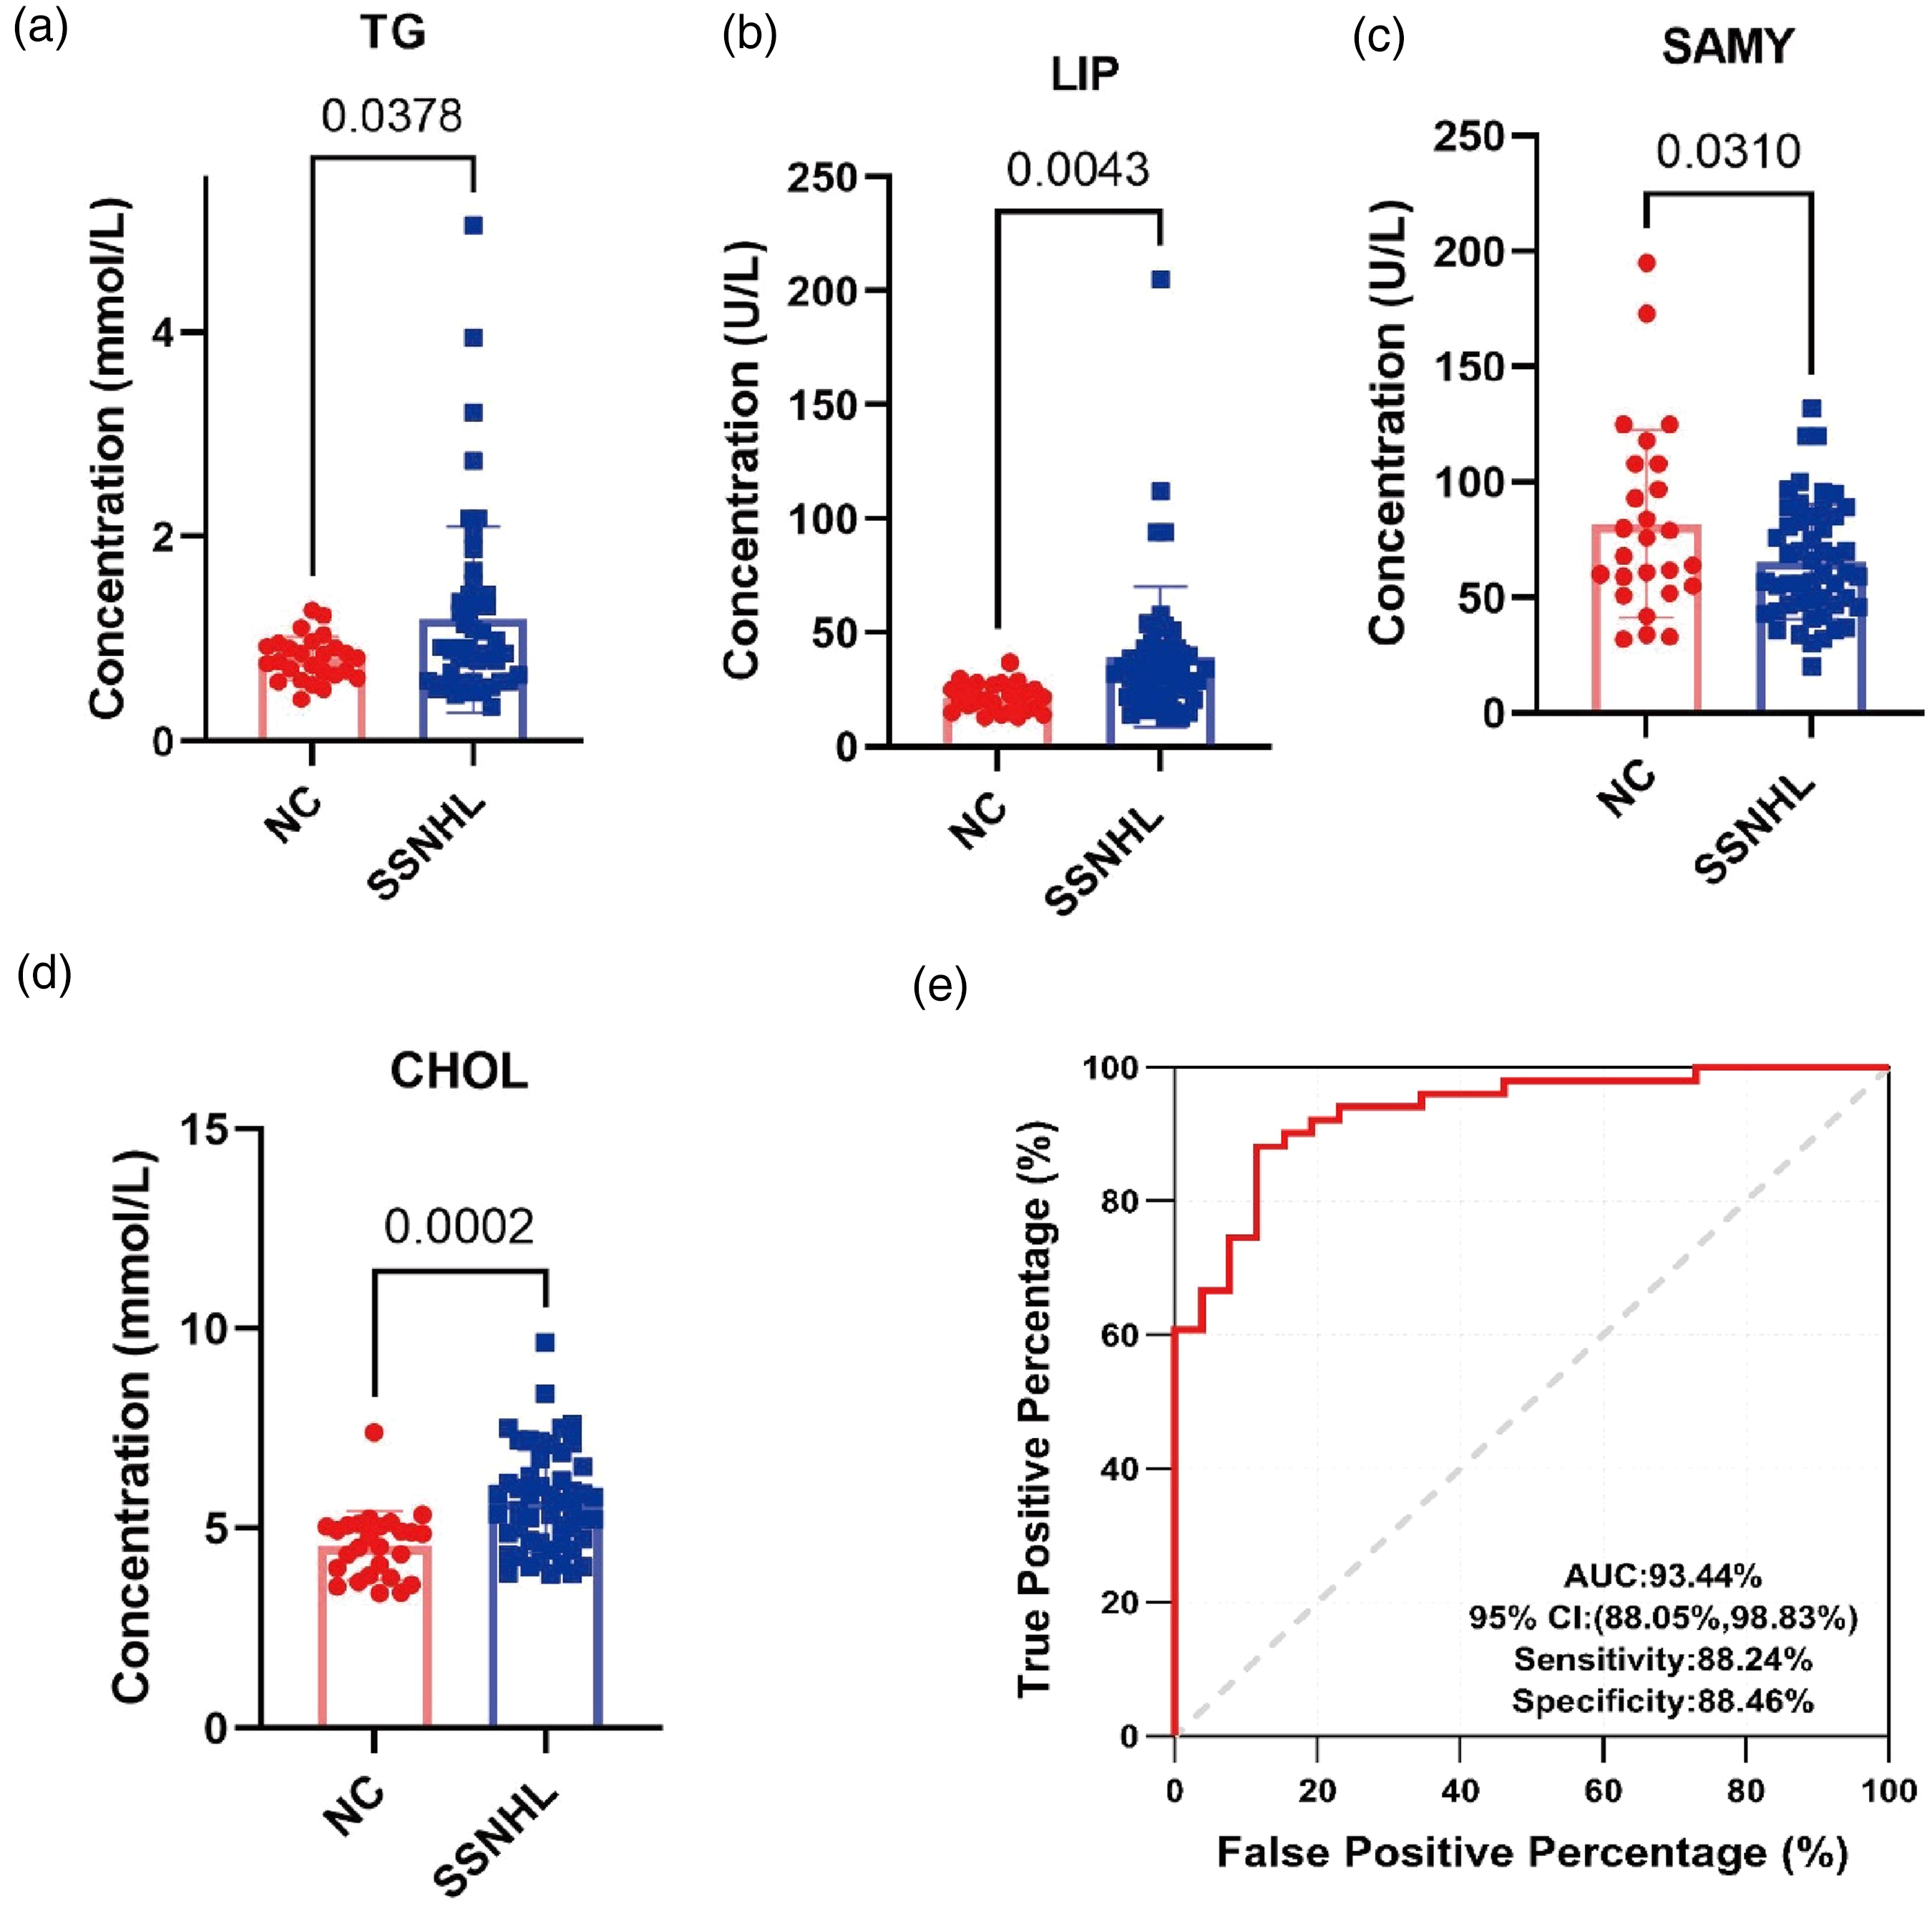
Clinical data from patients with SSNHL confirmed the metabolomic characteristics. Plasma levels of total (a) TG, (b) LIP, (c) SAMY, and (d) CHOL in patients with SSNHL. Statistical test: Student's t-test; significance level = 0.05; (d) receiver operating characteristic (ROC) analysis for discriminating patients with SSNHL from controls with four biomarkers (TG, LIP, SAMY, and CHOL).
Discussion
SSNHL presents as an abrupt and non-undulating impairment, often with an unknown etiology, posing a significant challenge in treatment. While SSNHL is frequently idiopathic, in some cases, a specific cause can be identified. Untreated cases often result in irreversible hearing loss. In this study, a machine learning model in the study objectives and methods based on the expression levels of 75 and 76 differential metabolites, derived from data in the RPLC and HILIC modes, was constructed. Integrating metabolomic analysis and metabolomics–transcriptomics combination analysis, and considering the clinical detection challenges and financial constraints, we opted to validate four abnormal metabolites—TG, LIP, SAMY, and CHOL—using plasma from 51 SSNHL and 26 control subjects.
Metabolites within our classifier (Figure 3) encompass various lipids including TG and CHOL, as well as LIP associated with lipid metabolism. These biomolecules hold potential as predictors for SSNHL and also could be used to screen for patients at higher risk of sensorineural hearing loss. Our findings suggest that distinctive alterations in metabolite levels could contribute to the establishment of a diagnostic model for identifying SSNHL cases. The classifier also includes other anomalously low metabolites such as SAMY. Previous studies have indicated a higher prevalence of hypercholesterolemia and hypertriglyceridemia in SSNHL patients. Hyperlipidemia may play a significant role in the pathogenesis of SSNHL by affecting the vascular, inflammatory, oxidative, and coagulative status of the inner ear. Evaluated TG and CHOL levels may play crucial roles in the pathogenesis of SSNHL.24–28 Our data reveal molecular alterations in SSNHL plasma that could serve as critical diagnostic biomarkers for further etiological investigations.
Both L-tyrosine and L-methionine exhibited decreases in SSNHL samples compared to controls, which are the essential amino acids in the human body and are involved in protein synthesis. Because it cannot be produced in the body itself, it must be obtained externally. Methionine deficiency leads to a shortage of SAMY, a key downstream metabolite, consequently hindering protein synthesis and contributing to oxidative damage. Lipid peroxides damage primary and secondary lysosomal membranes, causing the release of acid phosphatases contained in lysosomes as hydrolyzed enzymes, causing damage to important organelles such as cell and mitochondrial membranes. Methionine fights these damages in a variety of ways.29,30 The study observed a decline in essential amino acid levels in SSNHL patient plasma, which was previously unassociated with SSNHL, raising intriguing possibilities concerning the role of essential amino acids in the occurrence of SSNHL.
Through comprehensive content analysis, TG, LIP, SAMY, and CHOL emerge as potential diagnostic biomarkers and could potentially reveal the pathogenesis of SSNHL.
In a comprehensive content analysis, TG, LIP, SAMY, and CHOL emerge as potential diagnostic biomarkers, offering insights into the potential pathogenesis of SSNHL. These findings not only contribute to diagnostic advancements but also pave the way for further exploration of underlying molecular mechanisms and therapeutic interventions for SSNHL.
Our findings align with previous research that has also identified the significance of metabolic changes in SSNHL. Studies by Wang et al. (2022) and Sanderson et al. (2019a) have shown similar metabolic alterations in patients with SSNHL. Our study extends this body of work by integrating metabolomics and transcriptomics, thereby providing a more comprehensive understanding of the underlying mechanisms.
This study has certain limitations as it is based on the database and past blood sample results, lacking additional potential indicators. Despite the promising findings, our study has several limitations. The relatively small sample size may limit the generalizability of our results, and the retrospective nature of the study introduces potential biases. Additionally, while we identified significant metabolites and pathways, the observational design of the study precludes establishing causal relationships. Future studies with larger cohorts and prospective designs are needed to validate our findings and explore the causal mechanisms involved in SSNHL.
Conclusion
In conclusion, our metabolomic profiling identified significant differential metabolites in patients with SSNHL, providing potential biomarkers for diagnosis and insights into the disease's underlying mechanisms. Despite the limitations of our study, these findings contribute to the growing body of knowledge on SSNHL and highlight the potential of metabolomics in advancing our understanding and management of this complex disorder.
Footnotes
Acknowledgements
We would like to thank all participants for their contribution to this study. Special thanks to the Third Affiliated Hospital of Guangzhou Medical and Sun Yat-Sen Memorial Hospital for their support in data collection.
Authors’ contribution
All authors contributed to the study's conception and design. Material preparation, data collection, and analysis were performed by Lanyu Cai, Xueping Huang, and Huasong Zhang. The first draft of the manuscript was written by Xueping Huang, and Huasong Zhang, and all authors commented on previous versions of the manuscript. All authors read and approved the final manuscript.
Data availability statement
The data that support the findings of this study are available from the corresponding author upon reasonable request.
Declaration of conflicting interests
The author(s) declared no potential conflicts of interest with respect to the research, authorship, and/or publication of this article.
Funding
The author(s) disclosed receipt of the following financial support for the research, authorship, and/or publication of this article: This work was supported by grants from the Medical and Health Science and Technology Plan of Longgang Shenzhen (LGKCYLWS2022019) and the National Natural Science Foundation of China (82171160).
Ethical approval
Ethical approval was obtained from the Ethics Committee of Longgang ENT Hospital & Shenzhen Key Laboratory of ENT, Institute of ENT, Shenzhen (approval no. 2022-0253).