
Abstract
Computer-advanced technologies have a significant impact across various fields. It is widely recognized that diseases have a detrimental effect on crop productivity and can significantly impact the economy, particularly in agricultural countries. Tomatoes hold great economic importance among cash crops, second only to potatoes. Globally, tomato production reaches a staggering 160 million tons annually, making it even more crucial for agricultural development. Unfortunately, the tomato crop is susceptible to several diseases, with early blight and late blight as two prominent culprits responsible for a production decrease of around 79%. Traditional disease detection and identification methods are time-consuming, expensive, and destructive, often requiring pathologists’ expertise. Thus, the primary research objective is to enhance disease identification accuracy by leveraging deep learning techniques. A model based on the inception-V3 architecture has been devised to classify diseases affecting tomato plant leaves. The model was trained and tested using the PlantVillage dataset, which comprises 6000 sample images of tomato leaves. The training and testing process utilized an 80 : 20 ratio, resulting in an impressive classification accuracy of 97.44% for the proposed model. The proposed solution aims to enable the tomato industry to thrive in the global market by mitigating the impact of tomato leaf diseases. By reducing the prevalence of these diseases, the solution can increase demand and contribute to the industry’s growth.
Keywords
Introduction
Agriculture plays a key role in the economic development of advanced and underdeveloped countries. Since most of the increasingly growing population lives in rular areas and relies on agriculture for survival, agriculture employed the vast majority of the human population before the industrial revolution. 1 Pakistan, the land of the Indus Valley civilization, covers an area of 796,096 square kilometres (sq. km). Pakistan has a climate ideal for growing various nuts, flowers, fruits, grains, and vegetables. The agriculture sector is the most important contributor to Pakistan’s economy, accounting for 18.9% of gross domestic product and 42.3% of the labour force. 2 As per the Sixth Population and Housing Census of Pakistan 2017, the country’s populace is increasing at 2.4% per annum. The need for a growing population increased, such as shelter, health, education, and food. The horticulture sector grew at a significant rate of 3.81% in 2017–2018 and outperformed against the targeted growth of 3.5%. 3
The importance of agriculture is not only limited to feeding the ever-increasing population but also an essential energy source. It also solves the catastrophic effects of global warming. 4 However, crop diseases diminish crop production, influencing food security and the agricultural economy worldwide. 5 Generally, yield losses caused by micro-organisms, creatures, and weeds account for 20% to 40% of global agriculture productivity losses. 6 Most disease infestations might not attack the entire plant but infest the chunks of crop plants, that is, roots, stems, leaves, or fruits. This may considerably impact farmers’ income, food security, and the nation’s economy. Therefore, prevention and control of plant diseases are very important.
Plant diseases
Plant diseases are mainly characterized as fungal, bacterial, or viral. Fungi and fungi-like organisms cause approximately 85% of crop diseases. Apart from fungal diseases, some other vital diseases are caused by prions, viroids, viruses, bacteria, and certain nematodes. 7
Plants are unfortunately prone to diseases by several plant micro-organisms, which cause many diseases as shown in Figure 1 and slowly destroy their health, aesthetic value, and marketability. 1 Some diseases are asymptomatic, and their effects become visible and noticeable at delay stages, so modern and advanced analysis is obligatory. 8

Types of plant diseases.
Visual identification of crop plant diseases is inefficient, difficult, and expensive because experts may tire and lose concentration; it also needs the expertise and skills of a trained plant pathologist. 9 Nowadays, diseases are transferred globally more easily than before. The efforts of farmers and expenditures on controlling plant diseases are often useless if they are not aided by information technology (IT). This is particularly true in developing countries, where experts and nearby lack sufficient experts to attain timely information. The early detection and timely preventative measures thereby exacerbate the damage. Soybean rust (fungal disease in soybean) has caused massive fiscal losses. By eliminating only 20% of the infection, growers can benefit from about 11 million US dollars. 10 Therefore, one of the most basic requirements of successful and precise agriculture is timely and accurate diagnosis of crop plant diseases. 8
Previously, leaf samples were taken to local agricultural centres to recognize the disease. The farmer and agrarian professionals visually screen the crops to find any attack on these crops and plants and classify them. Certain diseases don’t have any visible indication connected; therefore, planters and agrarians can’t identify them easily. In Ethiopia, for example, farmers must walk long distances to seek expert advice on plant diseases. In other cases, the symptoms can only be detected by imaging devices, covering almost all electromagnetic spectrum (EMS) ranging from gamma to radio waves that are not visible to humans as shown in Figure 2. 11

Electromagnetic spectrum. 11
Therefore, looking for less expansive, fast, accurate, and automatic techniques to identify plant diseases is very important. Modern agriculture technologies have offered promising techniques and methods for identifying plant diseases. 12 The image processing approach is a non-invasive technique that provides farmers with a reliable, relatively accurate, time-saving, and cost-effective solution for managing fertilizers and pesticides. 13
Local tomato production
Tomato belongs to the Solana family and is known as the annual herb. After sweet potatoes, flashy berry tomatoes are ranked third in global production. 14 China produces the most tomatoes, with 160 million tonnes annually, followed by the US (United States), with 41.87 million tonnes and 12.90 million tonnes. Tomatoes are a major source of phosphorus, minerals, vitamins, and fibre. Its nutritional value is not too high; however, they are enriched with lycopene-like antioxidants. 15
In Pakistan, tomatoes are nurtured in both seasons, Kharif and Rabi, with consistent accessibility in the home-grown market. In any case, Pakistan can’t satisfy its domestic needs for fresh tomatoes because it has not been given its due significance for expanding sends out both as an item and its derived products. 2
The tomato crop has incredible export potential due to its demand and needs in the international market. The international markets that export tomatoes are China, the USA, India, Afghanistan, Saudi Arabia, Iran, and Sri Lanka. Pakistan also exports its tomatoes to UAE, Iran, and Afghanistan. From 2000 to 2010, the area under tomato crop cultivation in Pakistan has grown from 27.9 to 50 thousand hectares, with production increasing from 268.8 to 476.8 thousand tonnes, as shown in Table 1. The current domestic revenue potential founded on said 10-year average is 10.1 tonnes/ha, which is extremely insignificant. Obtaining high revenue from effective potential, diseases resistant, high-yielding improved varieties of tomatoes, and mechanized production technology needs to be adopted. 16
Area and average yield production of tomatoes in Pakistan.

Pakistan exported USD 0.8 million worth of ketchup to various countries in 2018. Table 2 shows the main export destinations. Although the export volume is very low, the range of export destinations proves that Pakistan can increase its export volume of processed tomatoes as long as there is a suitable environment and sufficient raw materials. 2
Export destination of ketchup from Pakistan.

The manuscript ‘Early and Late Blight Disease Identification in Tomato Plants using a Neural Network-Based Model’ makes the following significant contributions to the field of agricultural productivity and disease management:
By leveraging deep learning (DL) techniques and the inception-V3 architecture, the study achieves a high classification accuracy of 97.44% for detecting early blight (EB) and late blight (LB) diseases in tomato plant leaves, surpassing previous works on the same dataset. The accurate identification of diseases in tomato plants can help mitigate the detrimental effects of EB and LB, which are known to cause significant economic losses and reduce crop yield by up to 79%. The utilization of advanced technologies such as DL models demonstrates the potential for innovative solutions in disease detection and classification, paving the way for more efficient and non-destructive methods in agriculture. The study validates the proposed model through rigorous testing and evaluation, showcasing its effectiveness in accurately classifying diseases from red, green, blue (RGB) images of tomato leaves, thereby contributing to advancing disease detection methodologies. The proposed solution aims to enable the tomato industry to thrive in the global market, increase demand for healthy crops, and support agricultural development by reducing the prevalence of tomato leaf diseases.
The manuscript’s contributions lie in its successful application of DL techniques to address the challenges of disease identification in tomato plants. It ultimately aims to enhance agricultural productivity and economic sustainability in the agricultural sector.
The rest of the paper is organized as Section ‘Background’ discusses the details of the background studies, types of diseases, and study significance. Section ‘Research methodology’ discusses the detailed methodology adopted in this study, including the dataset, preprocessing, machine learning models, and evaluation matrices considered. Section ‘Results and evaluation’ discusses implementation, Image preprocessing, augmentation, labelling, training using Region-based Convolutional Neural Network (R-CNN) and Inception-V3, etc. The section ‘Discussion’ presents the discussion and limitations of the proposed model, and the last section ‘Conclusion’ presents the conclusion and summarizes the paper.
Background
Plant diseases are easily accessed and identified with advancements in computer science, sensor technologies, and progress in the remote sensing domain 17 just like other application domains such as anomaly detection18,19 and student performance prediction.20,21 Spectrometry facts and figures have been utilized for land cover classifications, target detection, environmental sciences, and space surveillance. 22 It can also identify and distinguish various objects even if they have similar shapes, colours, morphological properties, or overlapped spectra. 23 However, the sensor cannot directly collect data on the physiological traits of reflectance attributes of different crop plant characteristics and measurement conditions. Specific regions in the EMS from visible to near-infrared ranges serve as a basis for agricultural decision systems. 24
Types of tomato diseases
Fungal, bacterial, and viral diseases attack tomatoes. Most vital fungal diseases which cause severe damage to tomato crops include stem canker, Alternaria alternate, black shoulder, black mould, EB, corky rot, LB, root rot, grey mould, and verticulum wilt. 25 Likewise, bacterial infections producing bacterial speck, bacterial canker, bacterial spot, bacterial stem and leaf spot, bacterial stem, and fruit rot are utmost vital infections with reported extreme losses. Viral diseases are also overwhelmingly causing awful harm all over the world. Vital syndromes include tomato mosaic, curly top, tomato spotted wilt, tomato necrosis, tomato big bug, tomato plant macho, and tomato yellow leaf curl virus and many other diseases as shown in Figure 3. 26

Types of tomato diseases.
Biologically, plants undergo various stress stages under unfavourable growing conditions. EB (Alternaria solani) is considered one of the most destructive infections globally, which causes a considerable and sufficient reduction in yield and many lesions in fruits in hot and humid environmental conditions. It is widely spread via seed, rain, wind, and infected plant parts/remains. Crop susceptible to EB undergoes significant damage and losses. Circular concentric brown spots appear on the leaves of the infected plant, which gain a diameter of 1.5 cm. Sometimes, small pitches and lumps can be noticed on the stem and leaves, resulting in the yellowing and wilting. 16
Similarly, LB (Phytophthora infestans) cause serious damage and destruction to crops in a region having a humid climate. 27 LB is a hostile fungus that multiplies rapidly in tomato fields. Once the field of tomatoes is infested with LB, its signs and symptoms appear on leaves, decreasing the chlorophyll contents and resulting in yellow leaves. As a result, leaves lower the absorption of red light. Finally, the blight also spreads and infests branches, main stems, and fruits. The LB disease incidence mainly occurs when the crop is in the early fruiting stage. In a few cases, the spectral characteristics of an infected plant are not that clear in the picture for direct detection due to their physio-morphological connections. 28
Nowadays, various techniques, approaches, and protocols are being used to detect different crop plant diseases, out of which the most commonly used are support vector machine (SVM) and artificial neural network (ANN). 8 For example, various automatic classification and identification methods have been applied in agriculture for plant trait approximation, classifications, quantification, predication, and sorting out diseases. 17 Even though analysing, explaining, and interpreting the outputs revealed may be difficult.
Traditional estimation methods such as visual monitoring, microscopic, molecular, microbiological, cytological, and serological are used for detecting, quantifying, and recognizing crop plant diseases, but these are not always suitable. With the rapid advancement of the internet, the use of IT allows for the creation of innovative and effective methods compared to visual monitoring, which can be applied in automated systems, resulting in significantly reduced workload.29,30 Thus, image processing seems to be one of the most promising, common methods to get the most accurate and detailed information about the specimen under observation.7,31
Plant diseases are often linked to physiological and visual changes in their host plants. 32 Some of the difficulties and challenges in implementing advanced methods are linked to factors such as heterogeneity, disease-based characteristics, environmental conditions, and simultaneous incidence of one or more pathogens, implying that the approaches and methods depend on minor differences to differentiate them. 33
A diseased plant responds to protect itself, and these morpho-physiological reactions/changes will reduce the spectral reflectance values because of a reduction in chlorophyll pigmentation and internal structure changes. 34 Plant disease levels can be accurately and directly evaluated by the molecular-level direct method, but it is very difficult to conduct in real-time field experiments. In contrast, the machine vision-based indirect method is easier and more attractive in practice due to its large number of properties and capabilities to detect plant diseases using different traits such as colour, morphological changes, and sometimes temperature fluctuations. 31
Diseases in tomatoes can be caused by many factors, that is, humidity, light, temperature, surplus amount of nitrogen fertilizers and shade, etc. 35 Various diseases affect tomato leaves, including tomato mosaic virus, tomato yellow leaf curl virus, spider mites, leaf mould, target spot, septoria spot, bacterial spot, and EB and LB. Many studies have been performed using machine learning classifiers to identify diseases, but it has been revealed that CNN is the single most favourable classifier. Therefore, this research aims to look at and investigate how a hybrid of CNN and recurrent NN (RNN) can be used to assess EB and LB diseases of tomato plant leaves.
The motivation behind the selection of LB and EB diseases is that when they infect tomato leaves, the signs and symptoms spread very rapidly and cover the whole leaf lamina in suitable environmental conditions 36 due to which the annual economic yield losses are reported about 79%. 37 In case of being left uncontrolled, it can destroy the whole crop within several days. So, it is necessary to continually improve non-destructive methods for timely and accurate disease detection and classification.
Accurately detecting EB and LB diseases in tomato plants is crucial for high production. Advanced techniques for precise detection may help improve accuracy.
Research significance
The paper focuses on identifying diseases from RGB images of tomato leaves using DL techniques. This will help achieve high revenue and a healthy crop so that the public’s necessary and nourishing demands will be satisfied. To validate the proposed model, we have used Matlab. Confusion metrics, F1 score, recall, and precision are used for testing and evaluation.
Research methodology
The methodology is divided into four major steps, that is, dataset, preprocessing, detecting region of interest (ROI), and classification. The matrices used for evaluating the performance of the proposed operational framework, such as accuracy and confusion metrics, are discussed.
For the analysis, the proposed methodology is shown in Figure 4. It is divided into two main phases: (a) the training phase and (b) the testing phase. The following section explains these phases in division-based:

Flowchart of the proposed model.
In the proposed model, the images are initially taken from the publically available PlantVillage and PlantDisease datasets. Augmentation techniques, such as image rotation, transformation, etc., are applied to expand the dataset. Then, the images are labelled according to which class they belong. Then, the object detection technique faster Region-based CNN (R-CNN) is applied to locate the ROI, followed by a hybrid of CNN and RNN to classify the images.
Datasets
Publicly available leaf datasets, PlantVillage and PlantDisease, can be used to assess tomato crop diseases.
PlantVillage dataset
The PlantVillage dataset contains 54,323 photos that are classified into 38 diseased and stable crop groups based on 14 different crop types from the crowed-sourced platform (www.kaggle.com). This dataset is available for download on the Kaggle website. All the images in this dataset are of a single leaf on a solid background with just a class name labelled. As a result, several research authors used this dataset.
PlantDisease dataset
There are 76,265 photos in the PlantDisease dataset, including 42 different classes of both healthy and diseased plants and 12 different crop species. This is the largest labelled crop leaf dataset. From the crowed-sourced platform (www.kaggle.com), the dataset of EB and LB is downloaded.
Data preprocessing
Data preprocessing is typically thought of as a time-consuming and repetitive process. Data preparation in this study primarily consists of a set of preprocessing measures and some data exploration techniques. Once the desired dataset was obtained, machine learning algorithms were used to process the preprocessed data. The dataset is split into two parts: a training dataset and a testing dataset, with a ratio of 80 and 20, respectively.
The most challenging part relating to leaf pattern recognition is extracting destructive and unique features of the leaves. Leaf characteristics such as leaf size, shape, and colour are prominent features in the computational recognition system. For this purpose, CNN could be an efficient and helpful extraction tool to detect and classify leaf venation patterns from the image. However, CNN also extracts and recognizes the features simultaneously; hence it is the quickest recognition method. 38 RNNs are best fitted for series with dependencies among time steps. 39 Therefore, features will be extracted through CNN after preprocessing. The network comprises the input layer, pooling layer, convolutional layer, fully connected (FC) layer, and output layer. 40
Convolutional neural network (CNN)
CNN is a DL algorithm that aims to replicate the visual system of humans. 38 In short, CNN is a combination of biological vision and neural system. 7 Figure 5 shows the basic architecture of CNN, which is composed of multiple convolutional layers, pooling layers, and FC layers. 41 The structure of convolutional layers and pooling layers gives feature extraction of the specimen while FC layers function as a classifier. 42

Convolutional neural network. 41
Convolutional networks first alter the signals into features before mapping them to a particular target value, whereas backpropagation (BP) neural networks (NNs) primarily map features to specific values across the network. However, CNN architectures differ depending on the type of the problem at hand. 43 CNN has remarkable classification accuracy because it can handle high-dimensional arrays and has a high degree of object detection. 7
CNN is considered one of the most effective tools for detecting and distinguishing images and extracting their nonlinear, invariant, and discriminating features. CNN model received the highest data content from image datasets. 27 Traditional methods and approaches for classification tasks rely greatly on predefined features which focus on very few numbers classes, mostly within a single crop. 44 In comparison, CNN can use unprocessed data directly without needing handcrafted features. 45
Recurrent NN (RNN)
RNN is another significant branch of the deep NN (DNN) family, developed primarily for sequtime-consuming. 22 RNN has the property of remembering previous knowledge and applying it to current network output calculations; in other words, RNN can be considered a BP NN whose output is used as the input for the next network. 41
Figure 6 shows the basic pattern of an RNN, with one recurrent layer, which consists of a series of vectors

Recurrent neural network. 22
The long short term memory (LSTM) network is a distinctive form of RNN, which is capable of storing extremely long-term dependencies embedded in sequence data. Language modelling, speech recognition, and machine translation have all benefited from the use of LSTM and RNN in time series data analysis. RNNs are ideally suited where there are dependencies among time stages. Due to the dense sampling of imaging data, they are assumed to have dependencies among bands. 22 Table 3 summarizes CNN and RNN.
Summary of CNN and RNN.

CNN: convolutional neural network; FC: fully connected; RNN: recurrent neural network; LSTM: long short-term memory; IP: image processing; SP: speech; NLP: natural language processing.
Frequently explained classifiers are: ANNs, CNNs, probabilistic NNs, SVMs, and K-nearest neighbour. Some researchers utilized the combined approaches of the said networks for accuracy enhancement. 38 NNs have many unique abilities, such as generalization, learning, and imagination, to sort out truthful analysis of crop plant diseases. NN also has sophisticated and reliable diagnostic capabilities as compared to other learning techniques.
The higher and possibly huge information in leaf images enables DL on naturally identifying crop plant diseases. 46 So, in this research, we proposed an improved model for identifying plant diseases in EB and LB in tomato leaves by applying CNN for feature extraction and RNN for classification to minimize production loss and gain maximum yield.
Evaluation metrics
The choice of an effective measurement metric is highly task-specific, so consider the problem domain and goal when making your decision. 47 Performance metrics are vital in evaluating the quality of learning techniques and determining the loss algorithm to use during model selection and implementation, whether for classification or predictive tasks. 48


Results and evaluation
Implementation
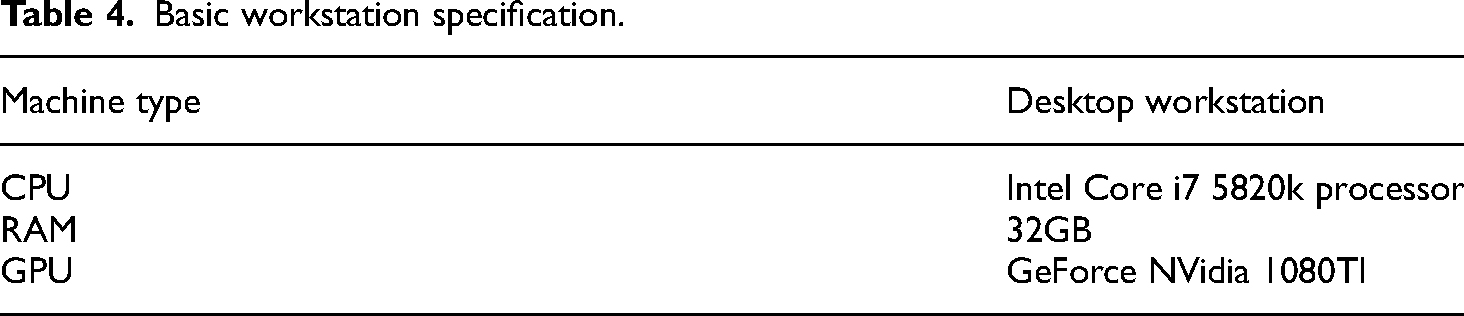
With an Intel core i7 5820k processor extreme generation and a GPU GeForce NVidia 1080TI (32 GB RAM), the R-CNN model is trained and tested. This model is built on the deep network architecture of inception-V3. The R-CNN-trained model is used to conduct the study. The objective of this work, however, is to recognize and classify tomato leaf diseases. In Table 4 a few descriptions of the study are mentioned.
Basic workstation specification.
Data description
The PlantDisease and PlantVillage image repositories are open-access image repositories that are released online at www.kaggle.com and contain over 50,000 images with 38 classes and 70,000 images with 42 different classes, respectively. From these datasets, we only extracted images of tomato leaves of EB, LB, and healthy. Table 5 summarizes our database.
Dataset description.

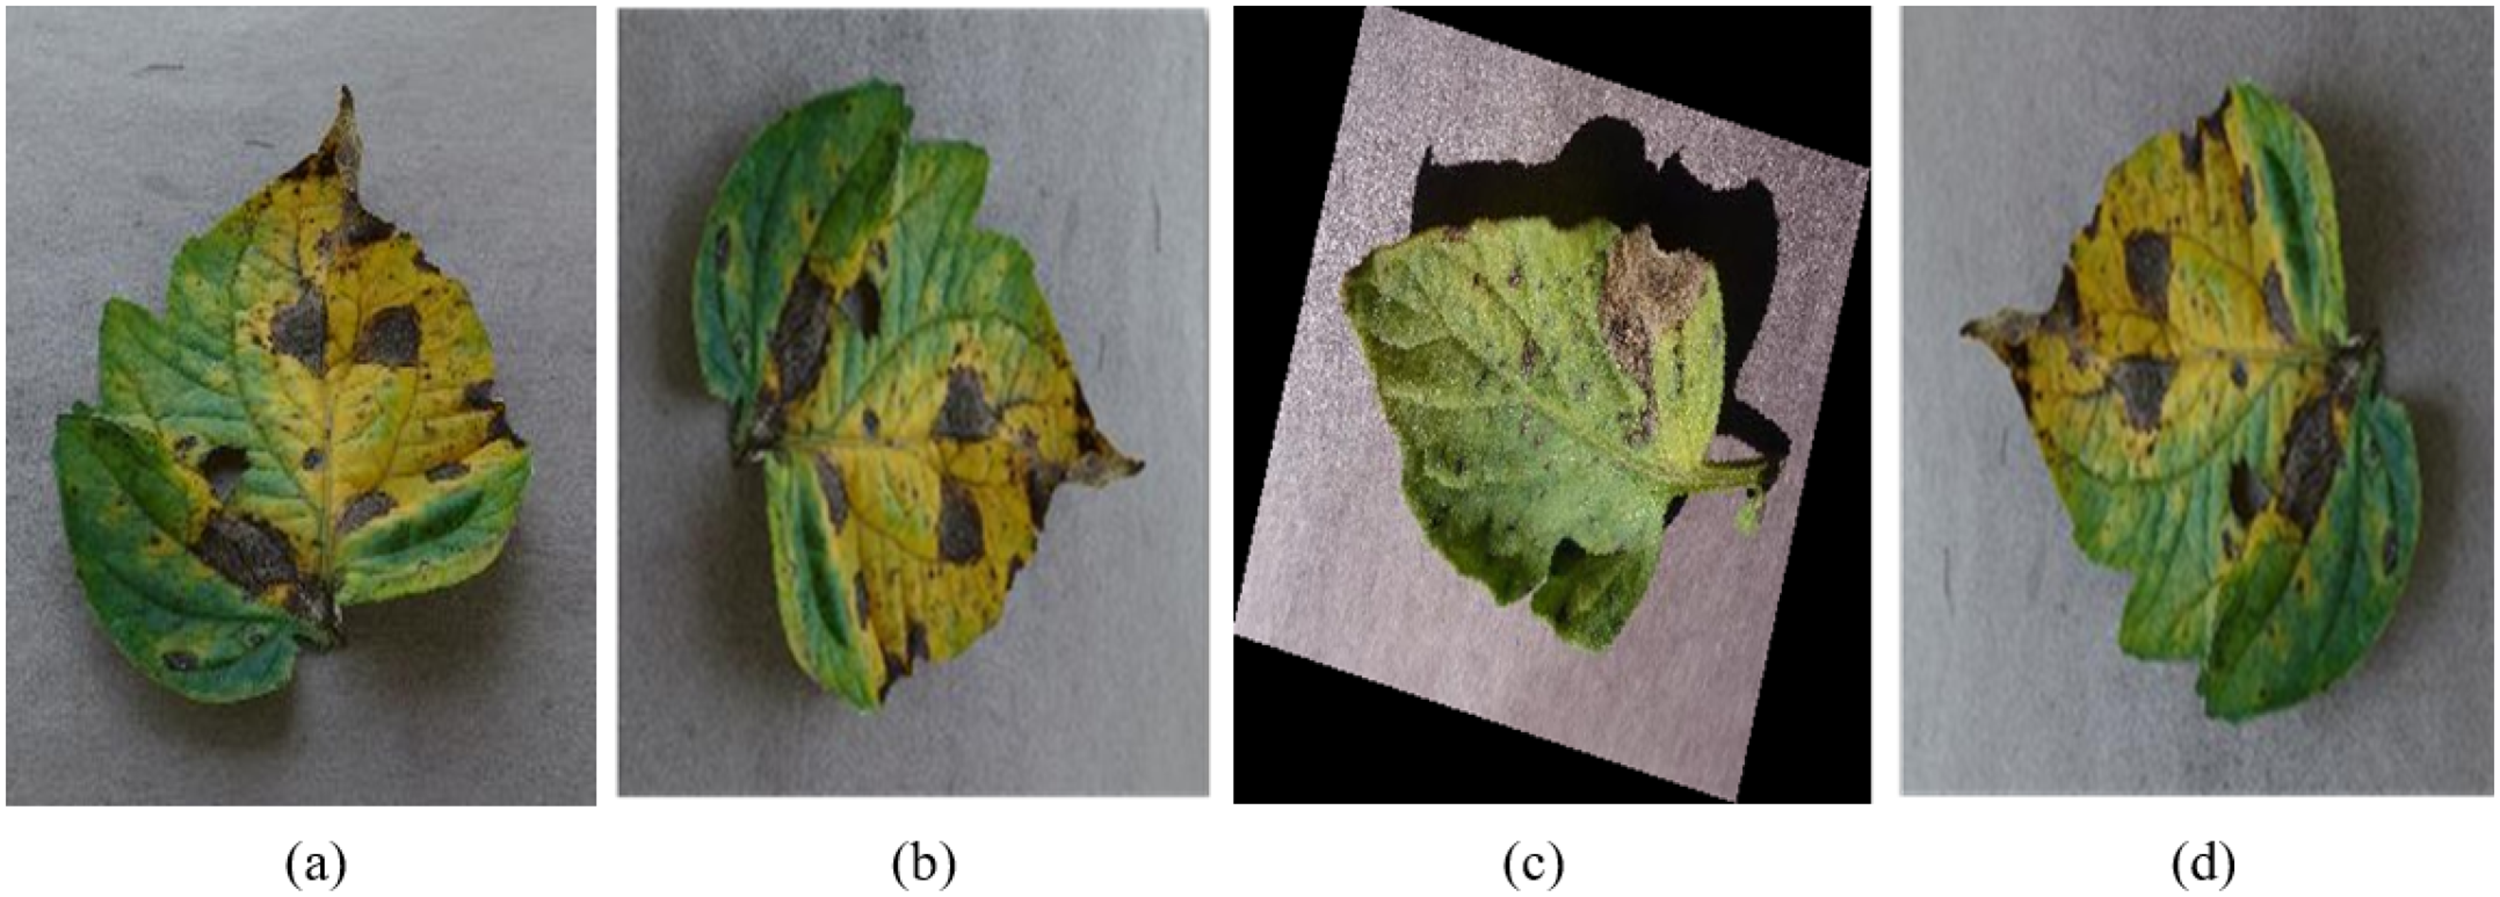
The dataset contains about 4500 images of tomato leaf diseases in varying degrees depending upon the condition in which they are taken and is divided into two classes: EB and LB. To distinguish healthy leaves from diseased leaves, another category containing only healthy leaf images is added to the dataset as shown in Figure 7. Several factors, such as humidity, fertilizers, shade, light, excess of nitrogen, etc., can cause diseases in tomato leaves. The primary goal of the research is to train the network to identify features that distinguish one class from another. As a result of the increased use of augmented images, the network’s chance of learning more suitable features improved.

Images from our database: (a) healthy, (b) early blight, and (c) late blight.
Image preprocessing
The term preprocessing describes the process of converting raw data until feeding into a deep network learning model/algorithm. For example, training a DL model with raw data will result in poor classification performance. Preprocessing, on the other hand, increases performance and is also necessary to expedite the training process. Images in the dataset were in a variety of formats with various resolutions and qualities. PlantVillage images are
Augmentation process
The next step is to add augmented images to the dataset. The main goal of augmentation is to expand the dataset and add minor distortion to the image as shown in Figure 8, which helps to reduce overfitting during the training stage. Affine transformation, perspective transformation, and basic image rotations are among the techniques used in image augmentation. To express translation and rotation on a different axis by various degrees (
Direction disturbance.
Image labelling
After preprocessing, all the images are labelled to the corresponding class. The disease areas in the leaf’s ROI are manually labelled as shown in Figure 9. After that, the data is divided into training and testing sets.
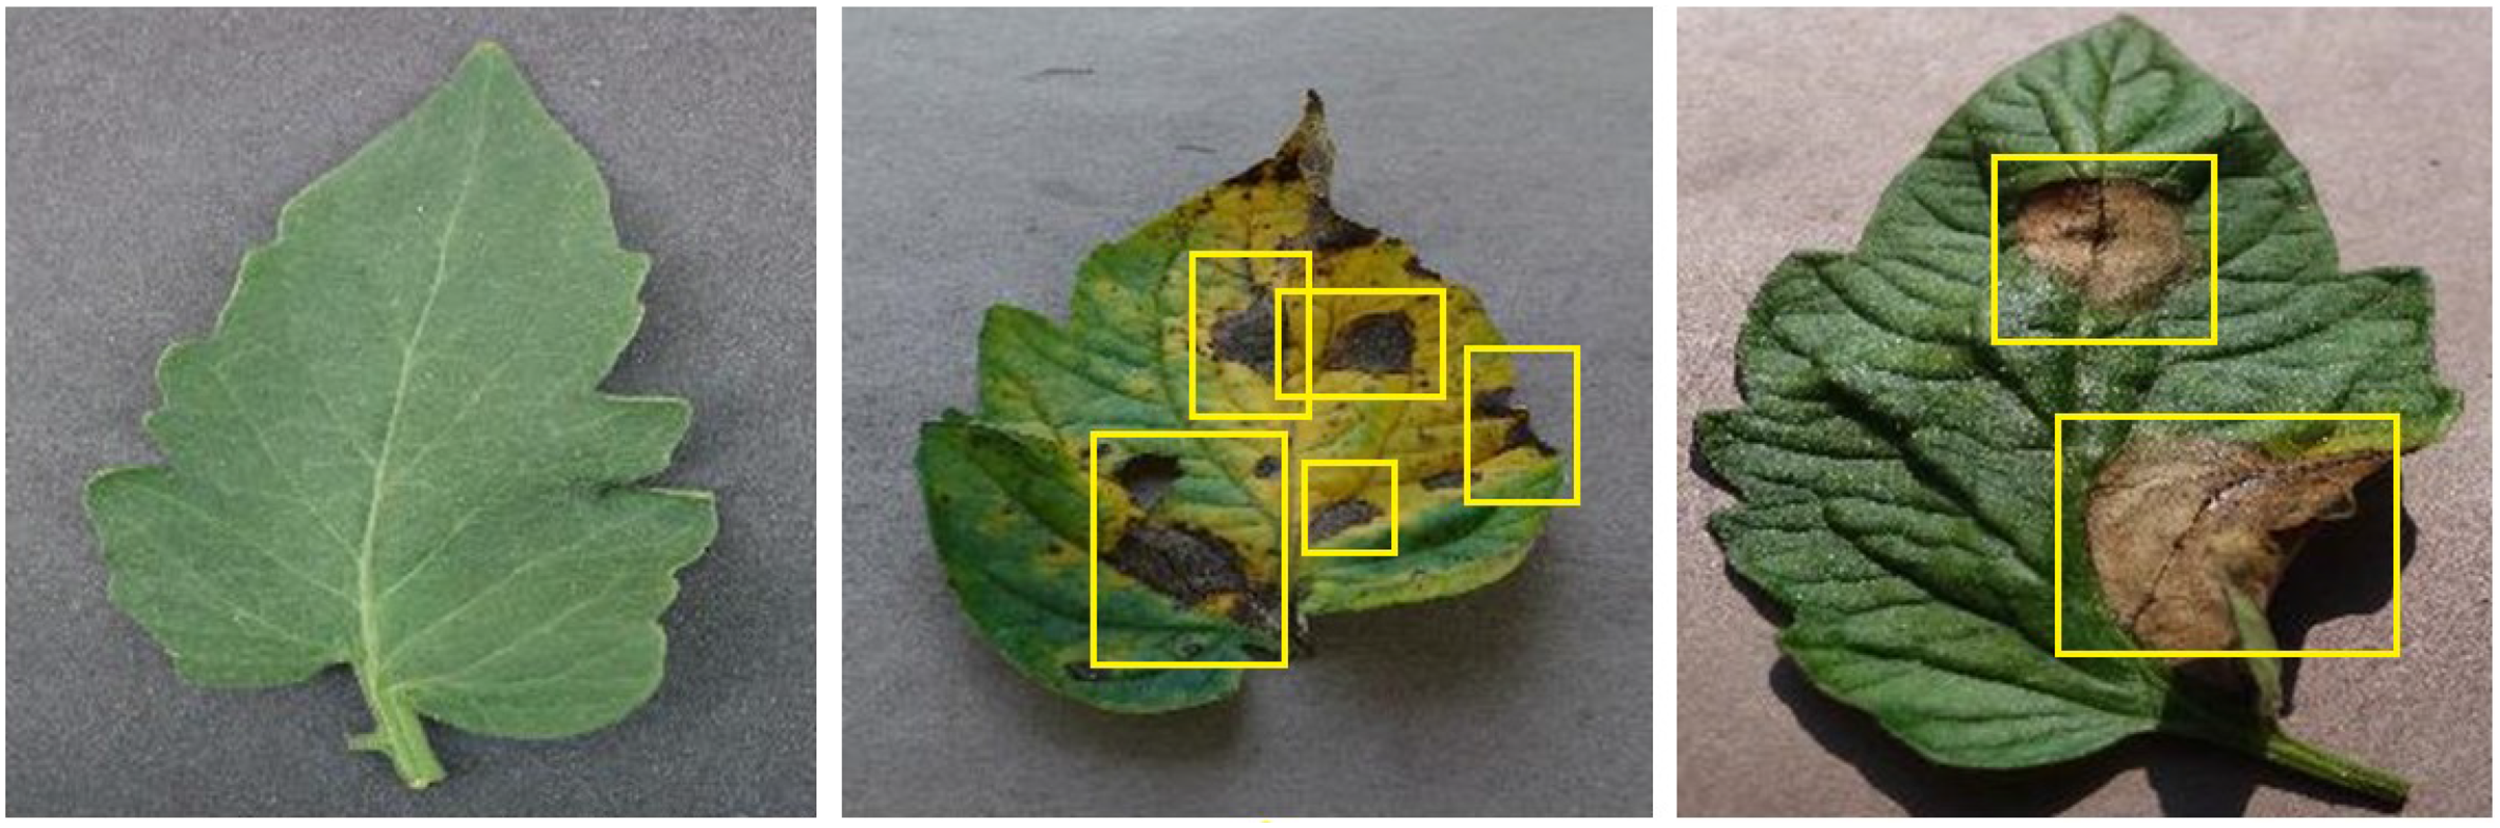
Labelling of images.
Network training
The dataset for training and validation processes is divided into two parts: the training feature set, which is used to train the network model, and the testing feature set, which is used to validate the trained network model’s accuracy.
Faster region-based CNN (Faster R-CNN)
Faster R-CNN, which is an object detection technique, is used to precisely locate the area of interest in the image. To extract original features, deep convolutional NNs (DCNNs) are used, and object detection architecture is used to locate a diseased spot in the feature map. The goal of Faster R-CNN is to locate infected areas in a leaf. Faster R-CNN has the highest results in principle because it achieves the lost failure value. DL architecture inception-V3 is used to create a classifier for tomato plant leaf diseases without handcrafted features. The aim is to use this architecture to improve the accuracy of plant leaf disease diagnosis and detection.
Inception-V3 model
DCNN applications are commonly used in almost every industry for a variety of purposes. In our case, we used the pre-trained model inception-v3 to extract appropriate dataset features. VGG19, AlexNet, VGG16, LeafNet, Resnet50, GoogleNet, and other pre-trained models are available. Google collaborated with several other researchers to create inception. Convolutions, average pooling, max pooling, concerts, dropouts, and completely/FC layers are the building blocks of inception-V3. Feature extraction assists the model in distinguishing and comprehending all the image characteristics for further study. Inception-V3 is depicted in Figure 10.

Architecture of Inception-V3 model.
Hyperparameters of training model
As DL is computationally expensive, it is important to set the optimal hyperparameters for CNN models to improve accuracy. The R-CNN training model is dependent on various hyperparameters (learning rate, batch size, epochs, hidden layers, hidden units, activation functions, etc.), and these hyperparameters are set before training. They are very important since they directly control the behaviour of the training algorithm and have an important impact on the performance of the model under training.
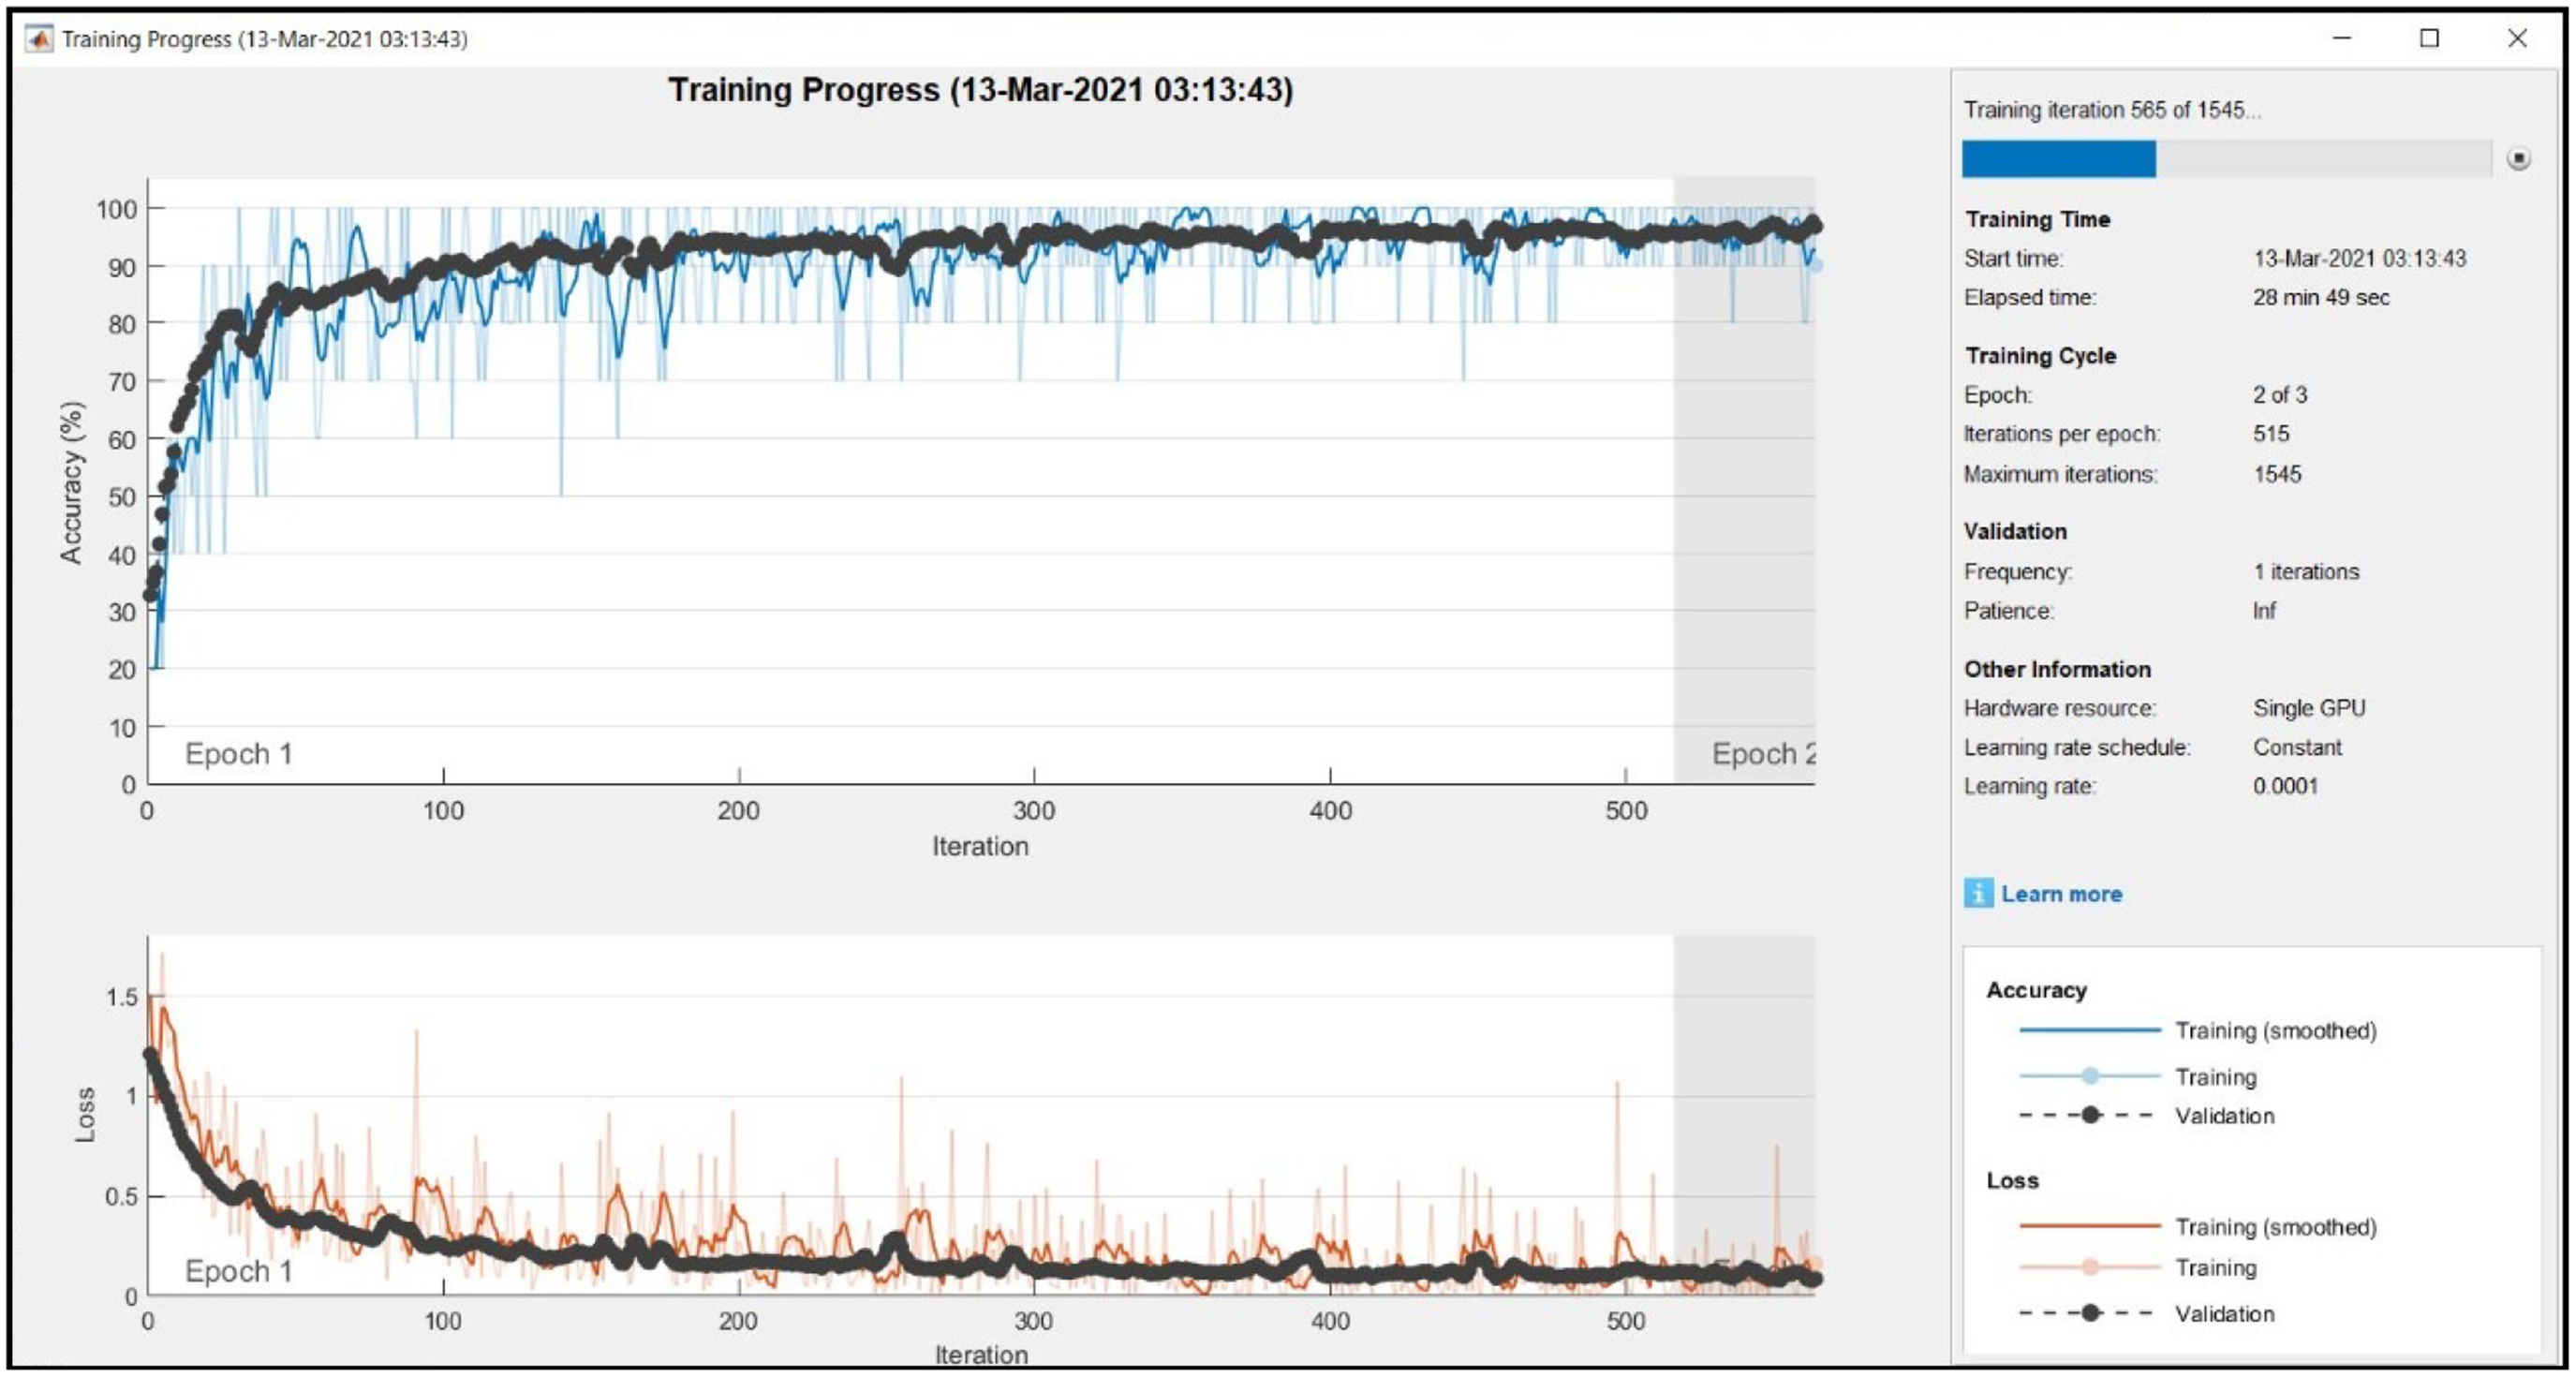
Training depicts the network’s status at a given point in time. It entails deciding or learning appropriate values for all the labelled data’s weights. If the learning rate is much lower than the desired values, reaching an ideal state will take hundreds or thousands of epochs. In the figure above, learning is shown on the
As shown in Figures 11 to 14, accuracy and loss varied throughout the training stage, but as the number of epochs increased, losses decreased, and accuracy increased. One epoch is completed in 29 to 30 min. Accuracy is a metric used in classification tasks that describes what percentage of our data is correctly categorized. However, the implementation process requires a powerful GPU. Our model was trained on a single GPU in 87 min and 12 s and achieved 97.44% training accuracy. The model can also be implemented on a CPU but it requires few parameters and several hours to train and validate.

Training progress.

Training progress.
Training progress.

Training progress.
A hyperparameter is a parameter that is set before the learning process begins. These parameters are tunable and can directly affect how well the model trains. Model hyperparameters are often referred to as parameters because they are parts of machine learning. Table 6 summarizes the hyperparameters of the training model.
The hyperparameters of training.

Discussion
To validate the learned model, training samples and test samples must be segregated. The data is divided into training and test sets and achieved 97.44% training accuracy. For deeper interpretation and analysis of findings, we look at F1 score, recall, and precision. The ratio of correctly identified true classification to total detected true classification is known as precision. The correctly identified true classification to all classifications of the actual class is indicated by the recall. The weighted average of precision and recall is represented by the F1 ranking.
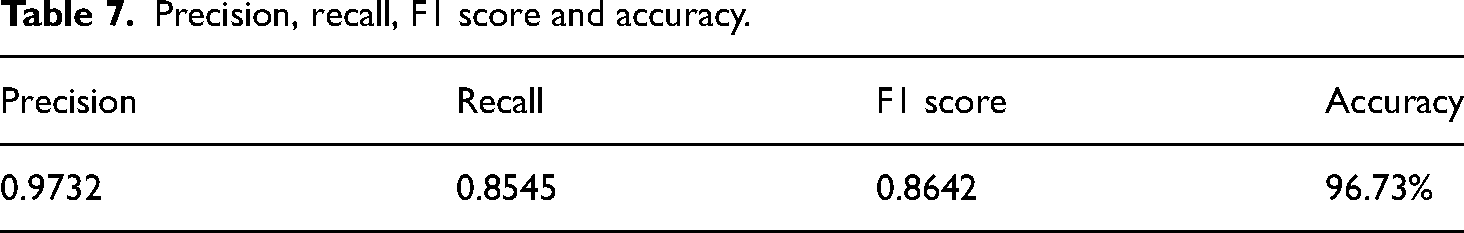
The confusion matrix is used to test the performance of the R-CNN model. A confusion matrix is a table that shows how well the classification model/classifier performs on a collection of test data for which the true values are known. From the confusion matrix, it is simple to determine which data class has the best accuracy and which has the worst accuracy. On 530 test images, we evaluated our R-CNN model. Table 7 summarizes the findings. The model generalization potential is demonstrated by its classification accuracy of 96.73% and precision value of 0.9732. As compared to precision, the recall value is lowered, and the value of the F1 score is 0.8642.
Precision, recall, F1 score and accuracy.
Finally, we utilized test data to evaluate the performance of our trained model by classifying the disease type using individual images of tomato leaves. The anticipated results, upon application to selected test data images, are depicted in the figures below.
Distinct images of leaves were tested, as we can see in Figure 15; it clearly shows from which class it belongs; at the top of each image, the class type is mentioned.

Images of healthy leaves.
Figure 15 (a) and (b) shows images of healthy leaves. The images were randomly tested to test the model performance. Figure 16 (a) and (b) shows the sample images of EB.

Images of early blight.
Figure 17 (a) and (b) shows the sample of Late Blight disease images of different types" for easy understanding.
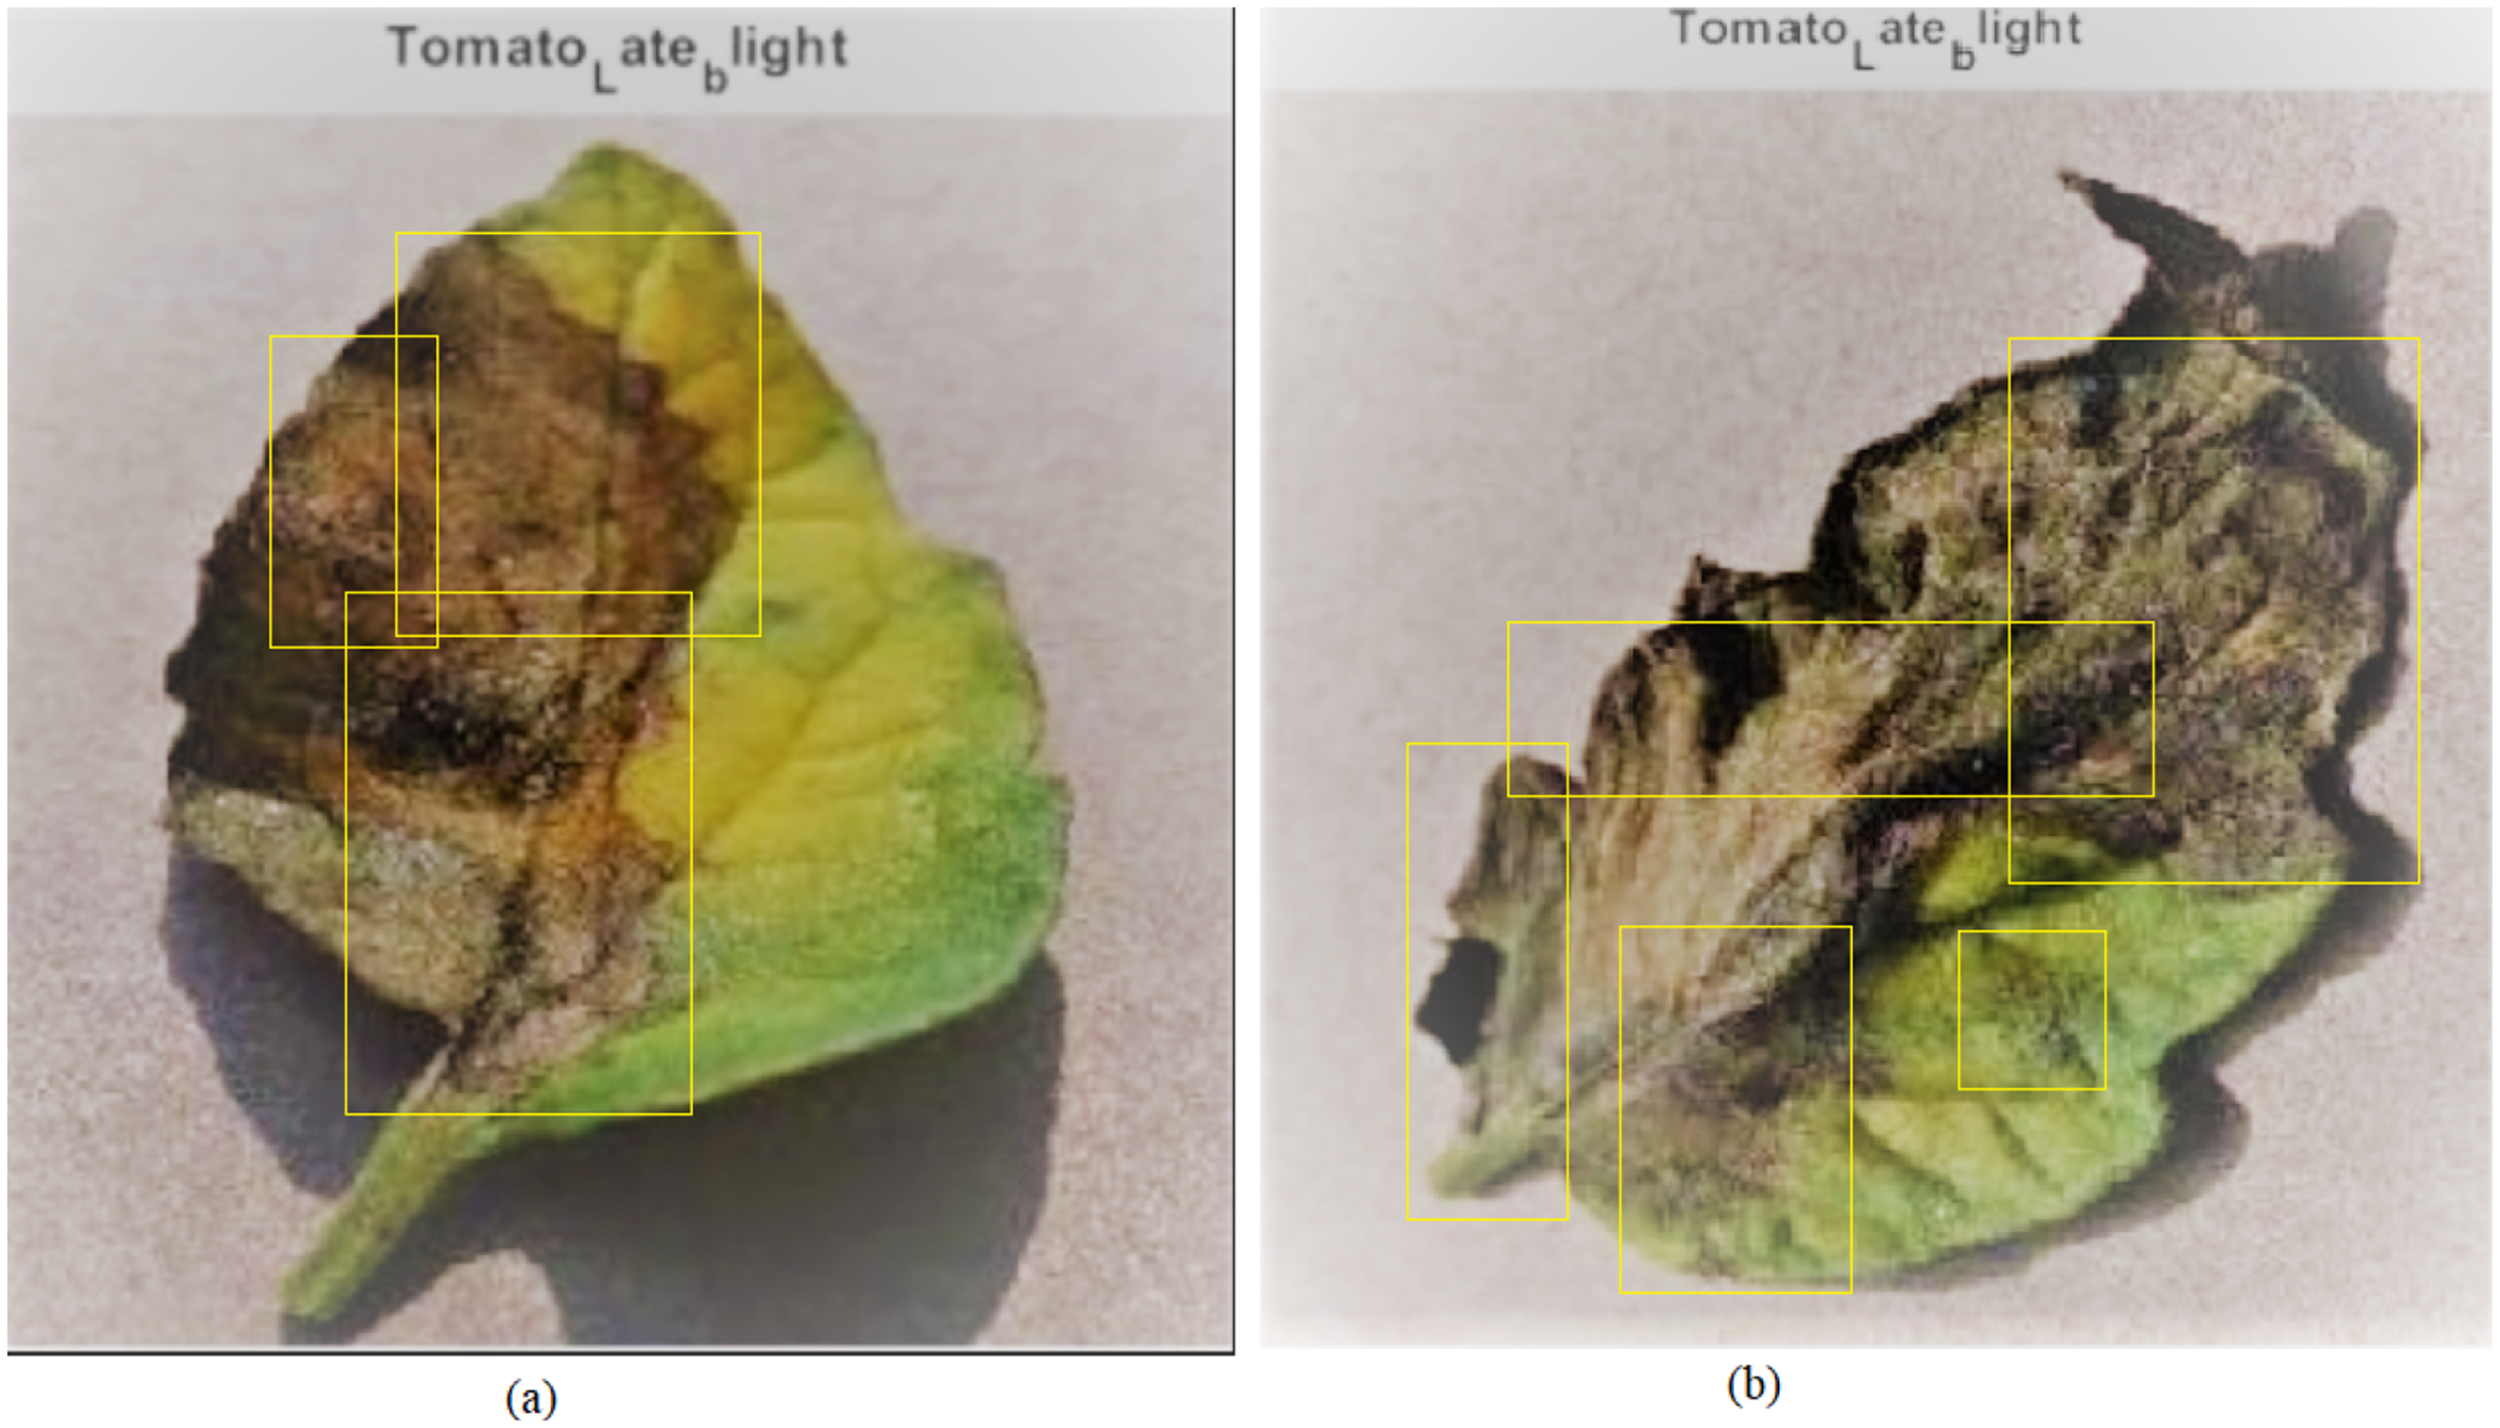
Images of late blight.
The study discovered a few new studies on the detection of tomato disease. Rangarajan et al. 53 used the same dataset as us and got 97.42% accurate results. They used VGG16 as a pre-trained model. In another study, Rangarajan et al. 54 used Alexnet and obtained a 97.29% accuracy rate. Few other studies on disease detection on the same plants have also been discovered. In comparison to other works, the proposed model achieved a 97.44% accuracy rate, which is better than other studies. Table 8 and Figure 18 compare different techniques for leave disease detection.
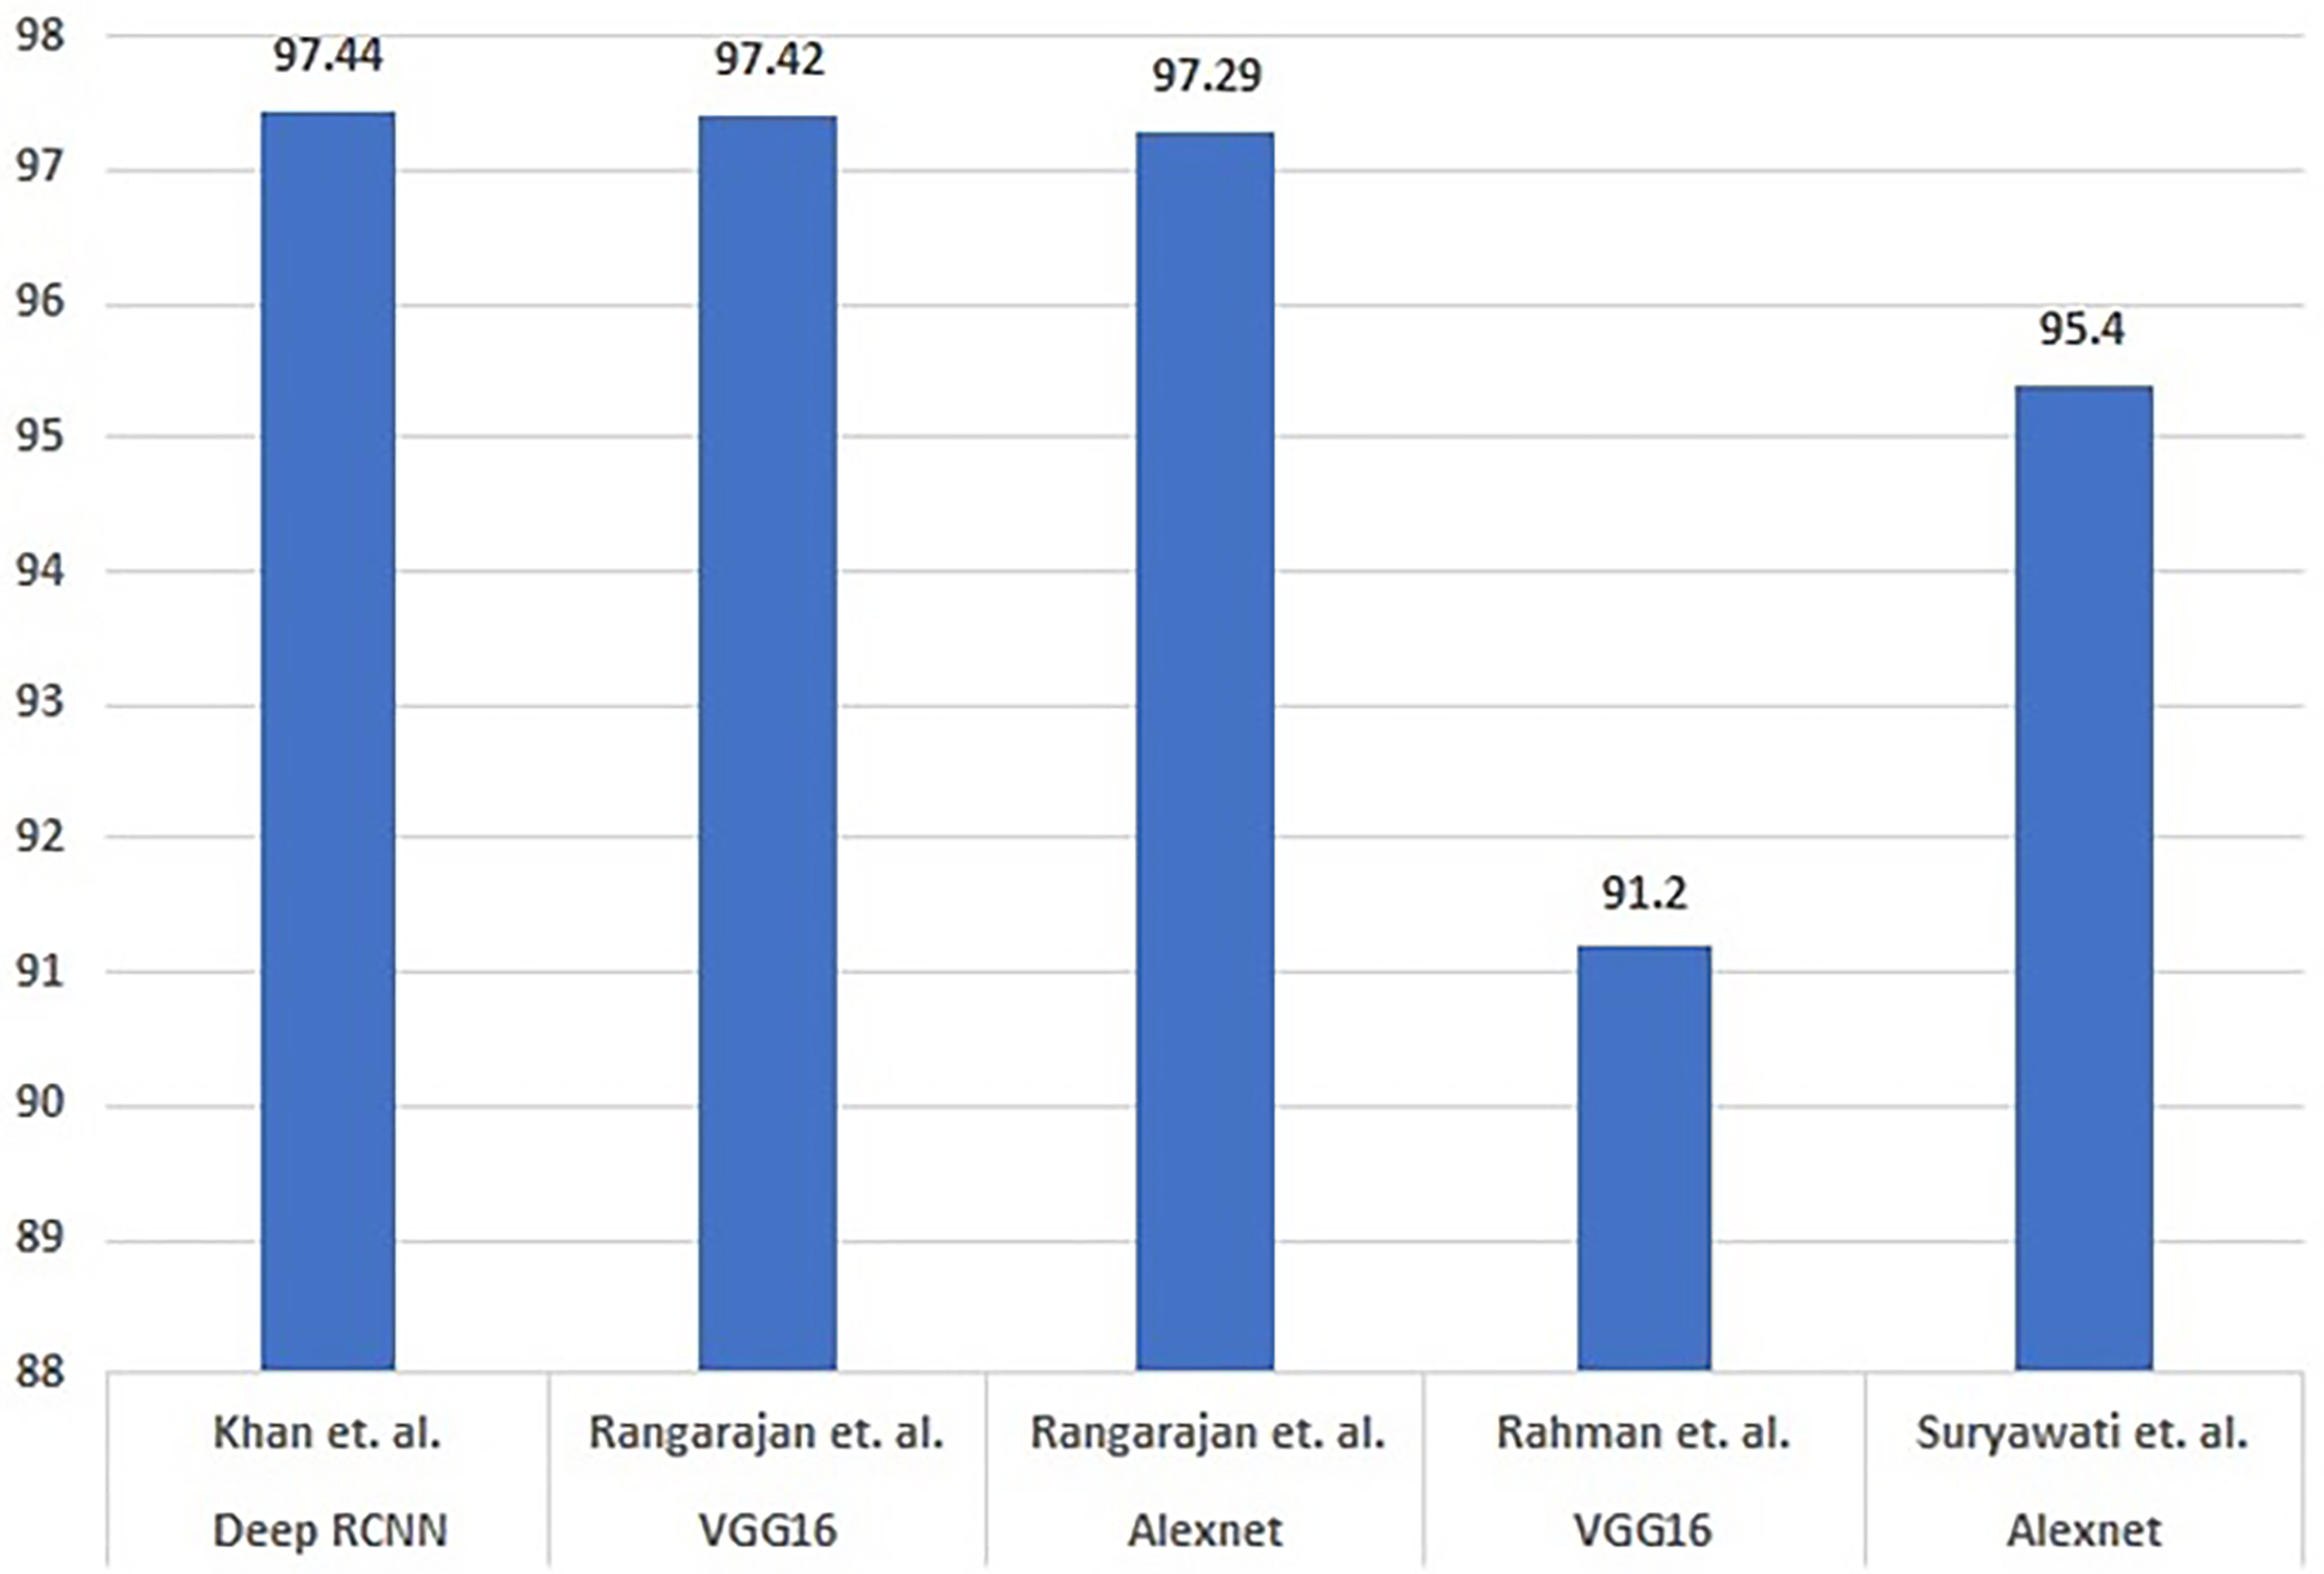
Comparison of proposed model with other models.
Comparison of various leaf disease detection techniques.

R-CNN: region-based CNN.
Limitations of the study
The main limitations of the study on EB and LB disease identification in tomato plants are summarized as follows:
The study may have a narrow focus on only EB and LB diseases, potentially overlooking other diseases that affect tomato plants. The implementation of the R-CNN model relies on specific hardware configurations for computation; in this study, we used an Intel core i7 5820k processor and a GPU GeForce NVidia 1080TI, which may not be readily available to all users. The effectiveness of the model heavily depends on the quality and quantity of the training data or images used. Insufficient training images could impact the model’s performance. The model’s ability to generalize and accurately classify diseases in real-world scenarios outside the training dataset may be limited, leading to potential misclassifications. DL models, such as CNN and RNN, are often considered black-box models, making it challenging to interpret how the model arrives at its decisions, which could be a limitation in agricultural decision-making processes. Implementing and maintaining DL models can be resource-intensive in terms of computational power, time, and expertise required, which may pose challenges for widespread adoption in agricultural settings.
These limitations highlight areas where further research and development can be performed to enhance the applicability and effectiveness of DL techniques in plant disease identification and management and, ultimately, augment agricultural productivity.
Conclusion
Tomatoes, a highly valued crop within the Solanaceae family, are renowned for their nutritional richness, containing essential antioxidant vitamins A and C and lycopene. Despite their nutritional benefits, the agricultural sector has long grappled with significant challenges posed by plant diseases. This study focuses on accelerating disease recognition processes through the innovative application of computer vision techniques, specifically tailored to analyse intricate plant leaf samples effectively. The primary objective of this research was to explore the potential of DL methodologies in detecting tomato leaf diseases. By leveraging distinct characteristics such as colour, patterns, infection status, and leaf position, a deep R-CNN model based on inception-V3 was developed to identify prevalent diseases such asEB and LB from RGB leaf images. The model’s performance was evaluated using the PlantVillage dataset, achieving an impressive accuracy rate of 97.44%, surpassing previous studies on the same dataset. In addition to advancing disease detection capabilities, this research contributes to agricultural technology by demonstrating the efficacy of DL models in enhancing crop health management practices. By harnessing the power of artificial intelligence and computer vision, this study sets a precedent for leveraging cutting-edge technologies to address longstanding challenges in agriculture, ultimately paving the way for more efficient disease monitoring and sustainable crop production.
This research can be applied to other plants to detect disease outbreaks and can be improved further. Besides, in the case of tomato leaf disease in real time, several other DNN models, including Single Shot MultiBox Detector and You Only Look Once, can be applied. Furthermore, Hyperspectral Imaging is a new technology that is applied in a variety of fields of study. In the future, it can be combined with efficient DL models to detect and identify more diseases in a timely and accurate manner, even before the symptoms appear.
Based on the findings and outcomes of the study on EB and LB disease identification in tomato plants using an NN-based model, several potential avenues for future research and development can be considered are summarized as follows:
Further optimization of the DL model, possibly by exploring different architectures or hyperparameters to improve accuracy and efficiency in disease identification tasks. Incorporating additional sensor data, such as hyperspectral imaging or thermal imaging, to complement RGB images and enhance the model’s ability to detect and classify diseases based on a broader range of features. Developing a real-time disease monitoring system that can continuously analyse plant health status using Internet of Things devices and provide timely alerts or recommendations for disease management. Conducting field trials to validate the model’s performance in real-world agricultural settings and assess its practicality and effectiveness under varying environmental conditions. Extending the research to include disease identification in other crops beyond tomatoes, leveraging the same DL framework to address disease challenges in a broader agricultural context. Integrating the disease identification model into an interactive decision support system for farmers, providing actionable insights and recommendations for disease control and crop management. Collaborating with agronomists, plant pathologists, and agricultural experts to incorporate domain knowledge and ensure the model’s alignment with practical agricultural needs and challenges. Exploring the feasibility of using the developed model for long-term disease monitoring and trend analysis to predict disease outbreaks and implement proactive disease management strategies. Investigating the application of transfer learning techniques and data augmentation methods to enhance model generalization and adaptability to new disease types or variations. Focusing on scalability and accessibility aspects to make the disease identification solution more widely available and user-friendly for farmers and stakeholders in the agricultural sector.
Footnotes
Declaration of conflicting interests
The authors declared no potential conflicts of interest for the research, authorship, and/or publication of this article.
Funding
The authors received no financial support for the research, authorship and/or publication of this article.