
Abstract
Covid 19 patients often present with elevated D-dimer levels. The purpose of this study is to evaluate the role of D-Dimer levels in Covid 19 patients to predict mortality and venous thromboembolism (VTE) events. This is a retrospective chart review study from 1 April 2020 to 30 June 2020, during the peak Covid pandemic. A total of 350 patients were enrolled in this study; 69 (19.7%) patients died; 12 (3.4%) had a deep venous thrombosis; and 8 (2.3%) had a pulmonary embolism outcome. Peak D-dimer levels were collected with median levels of 765 ng/ml (266, 3135). Patients with VTE outcomes had significantly higher levels of peak D-dimers than patients in the non-VTE group (4876 vs 680, p < 0.0001). Patients who died had higher peak D-dimer levels than those who survived (4690 vs 501, p < 0.0001). The optimal cutoff point in peak D-dimer in predicting VTE events was 1437, yielding a sensitivity of 84.2% and a specificity of 65.0%. The optimal cutoff point in peak D-dimer in predicting mortality was 2004, yielding a sensitivity of 71.0% and a specificity of 77.9%. This study suggests that D-dimer levels can be elevated in Covid 19 hospitalized patients and can serve as indicators for mortality and VTE events.
Introduction
Coronavirus disease 2019 (Covid19) is known to cause coagulopathy as multiple systemic coagulation and inflammatory responses are activated during infectious complications. In Covid19 patients, coagulopathy presents as an elevated D-dimer level. D-dimer is a fibrin degradation product, widely used as a biomarker for thrombotic disorders. The mechanism of elevated D-dimer levels is unknown, but it is thought to be caused by the hyperinflammation and hypoxia-induced injury causing the dysfunction of endothelial cells and stimulating thrombosis. 1 A D-dimer value less than 500 ng/ml excludes venous thromboembolism, and values increase with increasing age and in pregnancy. Abnormalities in prothrombin time, partial thromboplastin time, and platelet counts are relatively uncommon in initial presentations. 2 The level of D-dimer can also rise with increased severity of community-acquired pneumonia. Rising D-dimer and fibrinogen associated with disseminated intravascular coagulopathy can be seen within 7 to 11 days after the onset of symptoms or 4 to 10 days after hospitalization. 2 Following the outbreak of the Covid 19 pandemic, D-dimer levels have been identified as a potential indicator for prognosis in Covid 19 patients. As much remained unknown with Covid 19 during the study period, research was conducted to understand management of these patients. The objective of the study was to evaluate the role of D-dimer levels in Covid 19 patients to predict mortality and venous thromboembolism (VTE).
Methods
All patients ≥ 18 years old who were admitted to NYU Langone Hospital—Long Island with a primary diagnosis of Covid 19 during 1 April 2020 to 30 June 2020 were included. The only patients excluded from the study were patients < 18 years old. All Covid 19 patients regardless of severity of symptoms were included. Institutional Review Board of NYU Grossman School of Medicine approval was acquired in November 2020 (Study # i20-01301) prior to data collection, and upon permission, the clinical pharmacy IT department ran a report to identify the study patients. Obtaining informed consent from the subjects was waived off by the Institutional Review Board/Ethics Committee. All patients had a positive reverse-transcription polymerase chain reaction Covid 19 test during their admission.
The primary outcome was to evaluate the role of D-Dimer levels in Covid 19 patients to predict mortality and VTE as the value of D-dimer levels along with optimal timing of these levels was lacking at the time. D-dimer levels were analyzed using ACL TOP 500 CTS manufactured by Werfen, Bedford, MA. Imaging studies such as CT angiography and/or ultrasounds were obtained in patients showing signs and symptoms of deep venous thrombosis (DVT) or other thrombotic events. Testing for outcomes such as DVT and pulmonary embolism (PE) was performed based on clinical suspicion of outcomes as well as based on D-dimer levels, if clinically warranted. The incidence of DVT or PE or other thrombotic events, such as stroke and myocardial infarction was recorded. Other outcomes such as bleeding were also studied to further shed insight into patient outcomes.
Electronic medical records were used to conduct a retrospective analysis. The criteria for admission during the study period were the following: dyspnea, respiratory rate > 30 breaths per minute, oxygen saturation < 94% on room air or a decrease in saturation to <90% with ambulation, or outpatient treatment failure. As the study period took place during the peak of the pandemic, D-dimer levels were recorded based on levels obtained routinely and based on physicians’ clinical decisions throughout the course of admission. At the time of the study, the following clinical pathway was followed. Initially, patients were evaluated to confirm if there were any underlying reasons to be on therapeutic anticoagulation, including, but not limited to, previous history of VTE, atrial fibrillation, the presence of mechanical valve, LA/LV thrombus, and others. If patients were on home anticoagulation, they were continued on their regimen during admission unless contraindicated. If there was no prior known indication, D-dimer levels were reviewed, and the rate of rise (> 6x baseline) was monitored by obtaining D-dimer levels roughly every 48 h. Based on the levels, patients were started on prophylactic or therapeutic anticoagulation. D-dimer levels < 500 ng/mL were started on prophylactic doses. D-dimer levels between 500 and 2000 ng/mL were given prophylactic doses if patients were not included in a trial at the time. Therapeutic anticoagulation was considered in patients with high suspicion for DVT/PE. Lastly, D-dimer levels >2000 ng/mL were recommended to consider the use of therapeutic anticoagulation. The duration of anticoagulation was determined by the clinician. If evidence of VTE or if the patient met other requirements indicated for anticoagulation, it was continued as per standard guidelines. Patient data was collected from the day of hospital admission to hospital discharge or death. Patients’ demographic information, co-morbidities, D-dimer levels, renal function, anticoagulant agents received by patients, VTE events, and mortality were collected. Patients with missing data were included in the analysis with unknown data points classified as unspecified or unknown.
All authors contributed to the design and implementation of the research. R.L. and S.W. carried out data collection and wrote the manuscript with contribution from all the authors. All authors provided critical feedback and helped shape the research, analysis and manuscript.
Statistical analysis
Descriptive statistics (mean ± standard deviation or median [25th, 75th percentiles] for continuous variables; frequencies and percentages for categorical variables) were calculated for the overall sample, and then separately by VTE vs. No VTE, and Dead vs. Alive. The two groups were compared using the chi-square test or Fisher's exact test, as deemed appropriate, for categorical variables and the Mann–Whitney test (the non-parametric counterpart to the two-sample t-test) for continuous data.
To explore the risk factors associated with mortality, a multivariable logistic regression model was used. To avoid overfitting in the model, we excluded variables from the univariable analysis if their between group differences were not significant and if the number of events was too small to calculate odds ratios. Best subsets selection 3 was used as a screening method to identify the best set of predictor variables for the multivariable logistic regression model for mortality. Eight candidate variables, age, sex, myocardial infarction, heart failure, coronary artery disease, atrial fibrillation, hypertension, and diabetes, were included in the selection process as they were potential risk factors associated with “mortality.”
The main goal of best subsets selection for a problem with V candidate predictor variables is to find, for the model with only one predictor variable, the model with exactly two predictors, three, and so on, up through all V predictors, which subset for each of these is “best,” according to some criterion. From these V best subsets, the user then chooses one of those models as the final model, according to some criterion. Typically, the model chosen is the one with the least number of predictor variables (parsimony) such that adding more variables does not substantially improve the model.
Best subsets selection was performed by computing the score chi-square for each model and identified the subset with k* variables, where k* was the first subset for which the score chi-square changed from the previous subset by less than 5%. Then, the three models with k*-1, k*, and k* + 1 variables were considered and one of those was chosen as the final model depending on the subjective relevance of each of the models.
Our final model included k = 4 predictors. Age, myocardial infarction, heart failure, and coronary artery disease were included in the final model as this subset of predictors was found to be the best for prediction of “mortality.”
The binary outcomes of VTE and mortality were assessed using univariable logistic regression and receiver operating characteristic (ROC) curve analysis. A numerical measure of the accuracy of the model was obtained from the area under the curve (AUC), where an area of 1.0 signifies near perfect accuracy, while an area of less than 0.5 indicates that the model is worse than just flipping a coin. The following was used as a guide for AUC: 0.9–1.0 Excellent, 0.8–0.9 Very good, 0.7–0.8 Good, 0.6–0.7 Average, and 0.5–0.6 Poor. The AUC, sensitivity, specificity, positive predictive value (PPV), and negative predictive value (NPV) were calculated from the ROC curve. The optimal cutoff value for D-dimer was determined by the value corresponding to the point in the curve closest to the top-left of the ROC graph (0,1) and Youden's index. Based on this cutoff value, patients were categorized into two groups.
The AUC was used as a measure of discriminative power, and sensitivity, specificity, PPV, and NPV at different cutoff points (1000 ng/ml, 1500 ng/ml, 2000 ng/ml, 3000 ng/ml, 4000 ng/ml, and 5000 ng/ml) were also assessed to identify optimal thresholds of peak D-dimer (Figure 1 and Figure 2).

ROC curve for the association between peak D-dimer and VTE. ROC: receiver operating characteristic.

ROC curve for the association between peak D-dimer and mortality. ROC: receiver operating characteristic.
The analysis of “time-to-death” (mortality) was accomplished by applying standard methods of survival analysis, i.e. computing the Kaplan–Meier 4 product-limit curves, where the data were stratified by the above two groups defined by the optimal cutoff value for D-dimer. A separate analysis comparing subjects with and without VTE was also analyzed. In cases where the endpoint event, “death” had not yet occurred, the number of days until last follow-up was used and considered “censored.” The groups were compared using the log-rank test. The median rates for each group were obtained from the Kaplan–Meier/Product-Limit Estimates and their corresponding 95% confidence intervals were computed, using Greenwood's formula 5 to calculate the standard error.
A result was considered statistically significant at the p < 0.05 level of significance. All analyses were performed using SAS version 9.4 (SAS Institute Inc., Cary, NC).
Results
Table 1 summarizes patient demographics and outcomes in regard to VTE vs. no VTE. A total of 350 Covid 19 patients were included in the study. The mean age of patients was 64.2 ± 17.3 years; 163 (46.8%) were females; 71 (20.3%) were African American. Mean body mass index was 29.9 ± 7.3 kg/m2. Common comorbidities included hypertension (n = 191, 54.6%), diabetes (n = 108, 30.9%), and dyslipidemia (n = 141, 40.3%). The median duration of admission was 6.8 (3.7, 11.8) days with 75 (21.4%) patients admitted to an intensive care unit (ICU). Fifty-nine (16.9%) patients were intubated with median length of intubation being 8.5 (4, 17) days. Anticoagulation agents used included heparin, enoxaparin, apixaban, and rivaroxaban. Of the 350 patients, 69 (19.7%) patients died; 12 (3.4%) had a DVT outcome; and 8 (2.3%) had a PE outcome. Eight (2.3%) patients had a myocardial infarction during their admission. There was no stroke or ventricular thrombosis event. Thirty-nine (11.1%) patients had a documented bleeding event. More patients who developed VTE were admitted to the ICU compared to the non-VTE group (42.1% vs 20.2%, p = 0.039). Similarly, more VTE patients died compared to non-VTE patients (26.3% vs 19.3%, p = 0.551). More VTE patients were intubated, although not statistically significant (36.8% vs 15.7%, p = 0.079), with a significantly greater length of intubation days than the non-VTE group (27 days vs 6 days, p = 0.007). Median length of stay was longer in patients who died compared to those who survived (10.5 vs 6.1 days, p = 0.001). Intubation rate was also higher in patients who died (62% vs 5.4%, p < 0.0001). Table 2 demonstrates patient demographics and outcomes in regard to mortality outcomes.
Patient characteristics and outcomes (VTE vs. No VTE).
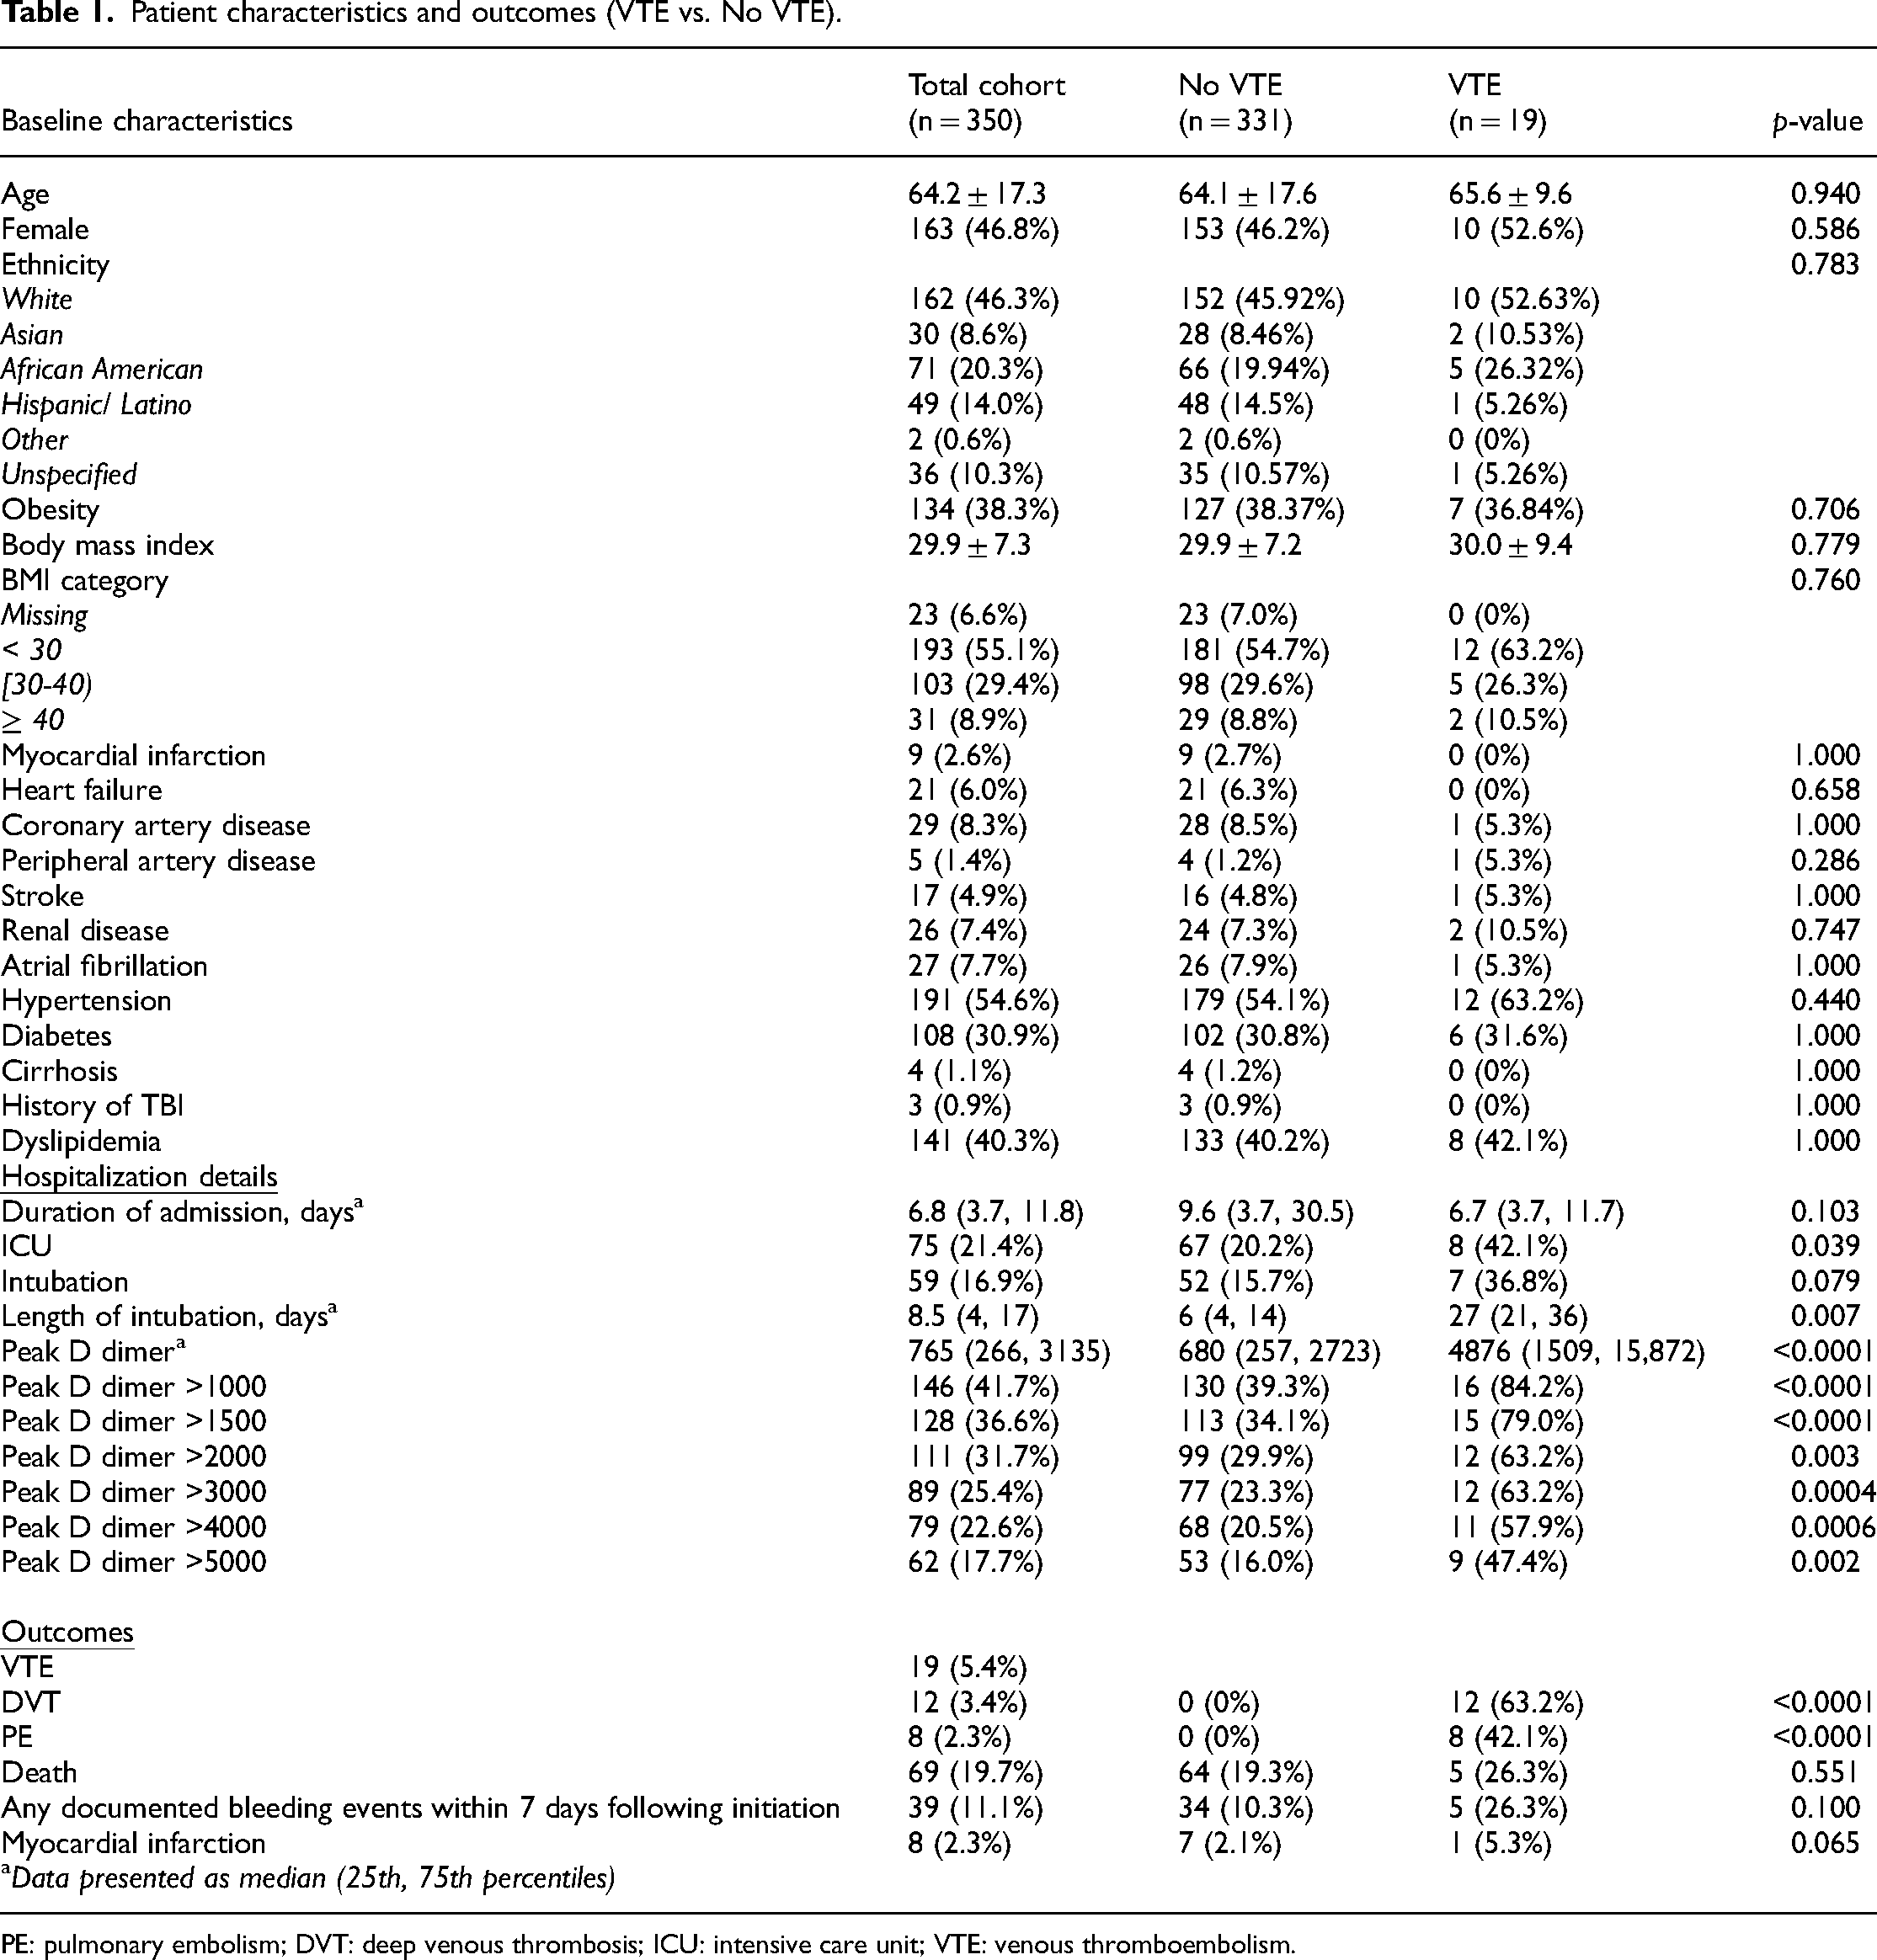
PE: pulmonary embolism; DVT: deep venous thrombosis; ICU: intensive care unit; VTE: venous thromboembolism.
Patient characteristics and outcomes (Dead vs. Alive).
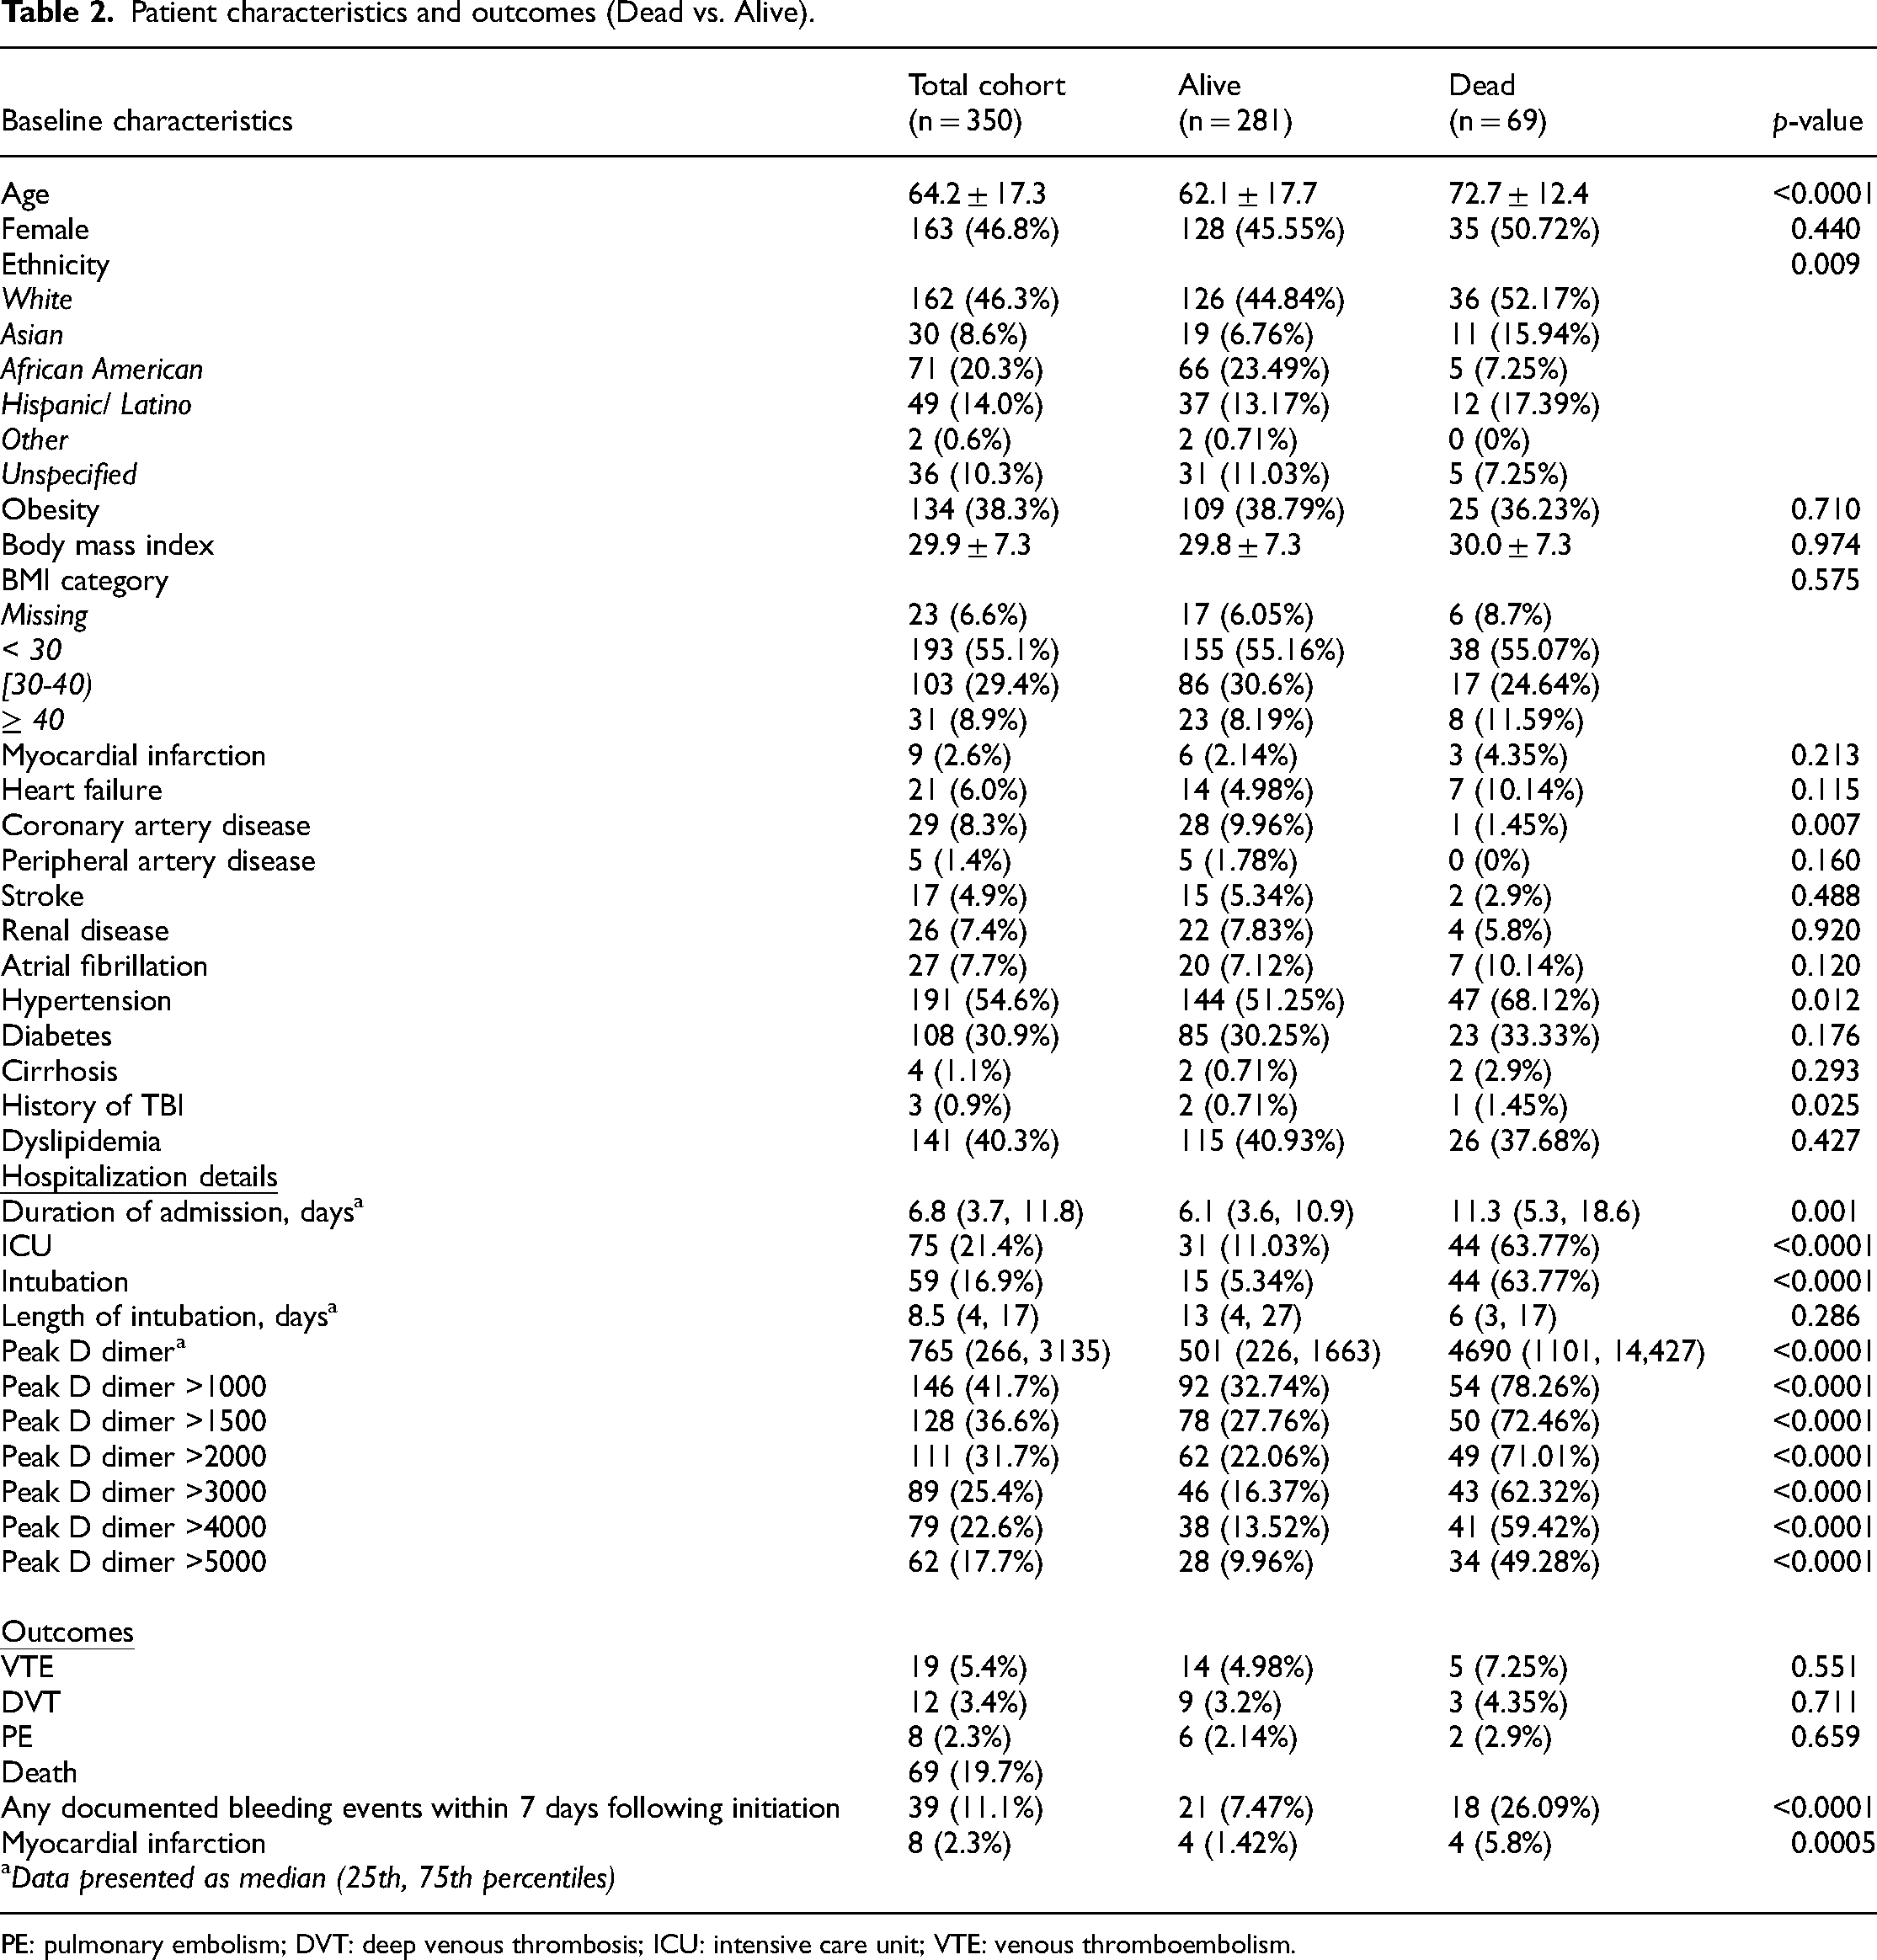
PE: pulmonary embolism; DVT: deep venous thrombosis; ICU: intensive care unit; VTE: venous thromboembolism.
Peak D-dimer levels were collected for the entire hospitalization with median levels of 765 ng/ml (266, 3135). The peak values of D-dimer levels were encountered with a mean of 4.3 days. Patients with VTE outcomes had significantly higher levels of peak D-dimers than those in the non-VTE group (4876 vs 680, p < 0.0001). Patients who died had higher peak D-dimer levels than those who survived (4690 vs 501, p < 0.0001). Table 3 shows the association between peak D-dimer levels and VTE outcomes. Based on Youden's index and the distance closest to (0, 1), the optimal cutoff point in peak D-dimer levels in predicting VTE events was 1437, yielding a sensitivity of 84.2% and a specificity of 65.0% (Figure 1). The AUC was found to be 0.8042 for the association between peak D-dimer and VTE. Table 4 demonstrate the association between peak D-dimer levels and mortality outcomes. The optimal cutoff point in peak D-dimer in predicting mortality was 2004, yielding a sensitivity of 71.0% and a specificity of 77.9% (Figure 2). Similarly, the AUC was found to be 0.8062 for the association between peak D-dimer and mortality outcomes. Patients who died had more bleeding than those who survived (26.09% vs 7.47% respectively, p < 0.0001). Table 5 demonstrates the multivariable logistic regression model for mortality. Figure 3 and 4 demonstrates the Kaplan–Meier curves comparing overall survival at the peak D-dimer and overall survival between those with and without VTE outcomes, respectively. In addition, there was no statistically significant difference in bleeding risk between initial prophylactic anticoagulation dosing and therapeutic anticoagulation dosing (89.66% vs 84.62%, p = 0.2517). Common prophylaxis doses included heparin 5000 units every 8 h and enoxaparin 30–40 mg daily.

Kaplan–Meier curves comparing overall survival at peak D-DIMER (<2004 vs. ≥ 2004).

Kaplan–Meier curves comparing overall survival between those with and without VTE.
Association between peak D-dimer and VTE.
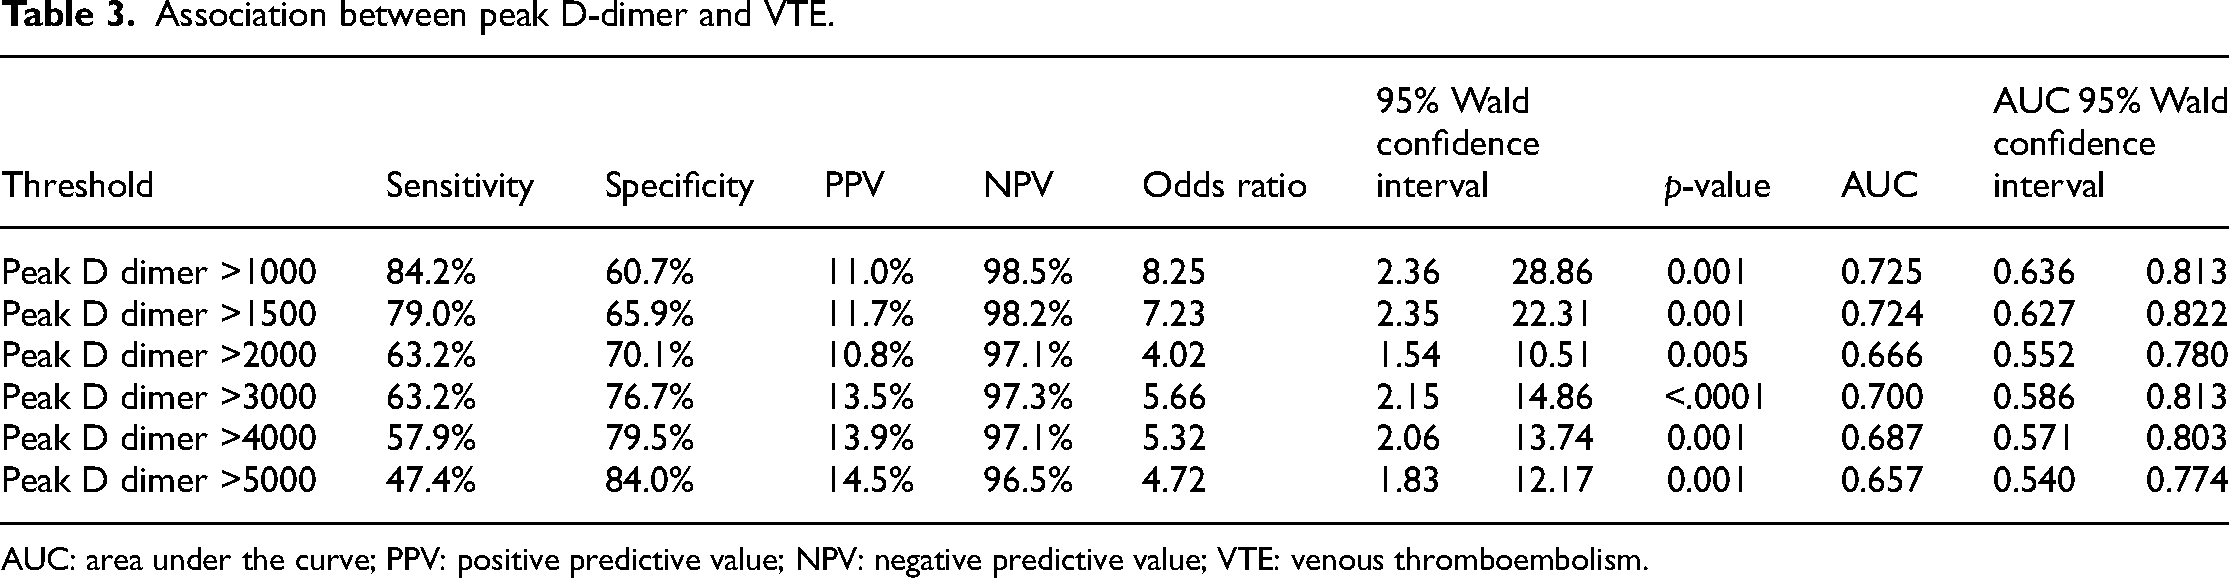
AUC: area under the curve; PPV: positive predictive value; NPV: negative predictive value; VTE: venous thromboembolism.
Association between peak D-dimer and mortality.
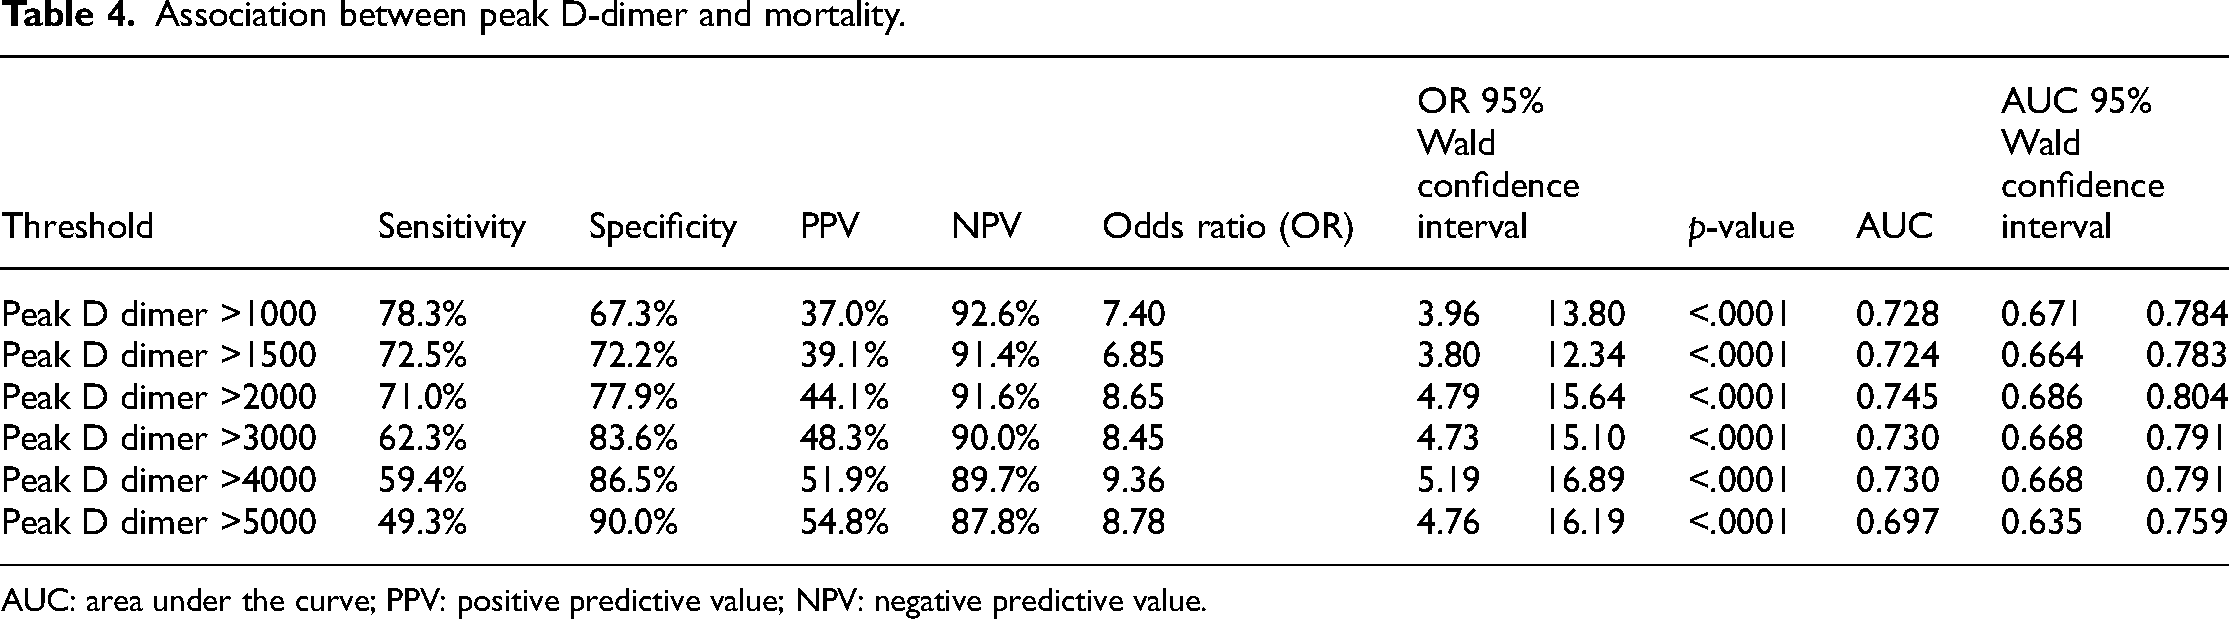
AUC: area under the curve; PPV: positive predictive value; NPV: negative predictive value.
Multivariable logistic regression model for mortality.

Based on Youden's index and the distance closest to (0,1), the optimal cutoff point in peak D-dimer in predicting VTE was 1437, yielding a sensitivity = 84.2% and a specificity = 65.0%.
Based on Youden's index and the distance closest to (0,1), the optimal cutoff point in peak D-dimer in predicting mortality was 2004, yielding a sensitivity = 71.0% and a specificity = 77.9%
Discussions
The results suggest that D-dimer levels are elevated in hospitalized Covid 19 patients, and these levels can serve as an indicator for mortality and VTE. The analysis of D-dimer trends demonstrates that elevated peak D-dimer levels may predict VTE events and mortality. Peak D-dimers greater than 1437 ng/mL yielded an 84.2% sensitivity and 65% specificity in predicting VTE and greater than 2004 ng/mL yielded a 71.0% sensitivity and 77.9% specificity in predicting mortality. A study published by Valerio et al. looked at the highest value of D-dimer levels over the patient's entire hospitalization with findings that higher levels of D-dimer were observed in non-survivors compared with survivors, similar to our study. 6 A study has emerged reporting that D-dimer elevations on the 3rd day of hospitalization is more sensitive predictor of in-house mortality than D-dimer levels taken on admission. 7 Our finding is similar to this study as our peak values of D-dimer levels were encountered with a mean of 4.3 days. Other studies published looked at courses and trends of D-dimer levels. A case–control study published by Yao et al. demonstrated that D-dimer levels > 2140 ng/mL predicted in-hospital mortality with a sensitivity of 88.2% and specificity of 71.3%. 8 Another study conducted by Zhang et al., showed similar findings of the optimal cutoff value of D-dimer levels to predict in-hospital mortality to be 2000 ng/mL with a sensitivity of 92.3% and a specificity of 83.3%. 9 Soni et al. demonstrated that among the measured coagulation parameters, D-dimer levels during hospital stay had the highest C-index to predict in-hospital mortality in Covid 19 patients. 10 Li et al. found that D-dimer levels were identified as an independent predictor for Covid 19 mortality. A series of values including 500 ng/ml, 1000 ng/ml, and 2000 ng/ml could be determined as cutoff points of D-dimer levels for clinic use. 1 The AUC for our study was found to be 0.8042 and 0.8062 for the association between peak D-dimer and VTE and for the association between peak D-dimer and mortality outcomes, respectively. Similarly, the AUC found in the retrospective study by Zhang et al. for all-cause deaths was 0.89 9 and the AUC found in the cohort study published by Wagner et al. for in-hospital mortality was also 0.89 for an optimal D-dimer cutoff point of 2480 mg/mL with sensitivity of 95% and specificity of 58.75%. 11 Although compared to these studies, our study had a slightly lower AUC, the values obtained indicated a high predictive value. Furthermore, a meta-analysis published by Gungor et al. found that D-dimer levels were significantly higher in patients with severe clinical status and mortality. 12 Our results are similar to the findings of other studies strengthening our result suggesting D-dimer levels can serve as an indicator for mortality and VTE in Covid 19 patients. However, it is important to be cautious in interpreting D-dimer levels as it is not an accurate test to rule out thromboembolic events alone and further diagnostic tests should be performed despite the possible association between high D-dimer levels and VTE. Furthermore, there may be a role of using age-adjusted D-dimer cutoff values in elderly patients as these levels have lower specificity in older patients. 13 Measurement and monitoring of D-dimer levels might assist clinicians to take immediate medical actions and predict the prognosis of Covid 19. 1
Abnormalities in prothrombin time, partial thromboplastin time, and platelet counts are relatively uncommon in initial presentations of Covid 19 infection. 2 Rising D-dimer and fibrinogen associated with disseminated intravascular coagulopathy can be seen within 7 to 11 days after onset of symptoms or 4 to 10 days after hospitalization. 2 These abnormalities are seen to be associated with higher requirements for mechanical ventilation, admission to ICUs, and death. 14 Although there is insufficient evidence to recommend obtaining hematologic and coagulation parameters, coagulation labs are generally monitored in Covid 19 patients, especially during the peak pandemic era. Approximately 20–50% of hospitalized patients have hematologic changes in coagulation labs.14,15 Thrombotic events were seen to occur in up to one-third of patients with Covid 19, with predominant events of pulmonary emboli. 16 Therefore, prophylaxis agents such as low molecular-weight heparin or unfractionated heparin are used as prevention of venous thromboembolisms. A study from Amsterdam showed that the incidence of VTE was higher in Covid 19 patients in the ICU than previous ICU rates, despite using standard VTE prophylaxis. The report showed a 42% cumulative incidence of VTE in Covid19 hospitalized patients at 21 days with 59% incidence in ICU patients and 9.2% incidence in general ward patients. 17 Studies found that patients given anticoagulant therapy for 7 days or longer was associated with a lower 28-day mortality when administered to patients with a sepsis-induced coagulopathy score (derived from the platelet count, PT ratio, fibrin degradation products, systemic inflammatory response syndrome score, and a sequential organ system failure assessment) > 4, or a D-dimer level greater than six times the upper limit of normal. 18
Our analysis revealed an overall VTE rate of 5.7% for our study sample of 350 patients. Compared to recent publications in regard to VTE events in Covid19 patients, our VTE rate is lower than observations already published. 19 Similar to the results of the ACTION trial that evaluated therapeutic anticoagulation compared to prophylactic anticoagulation, our study did not show a difference in mortality in regard to initial prophylactic or therapeutic anticoagulation. 20 This demonstrates that therapeutic anticoagulation doses used during Covid19 infections are not beneficial.
Study limitations
The limitations of our study include small sample size and the potential risk of selection bias. Due to COVID-19 being a rapidly evolving disease state, new literature with treatment recommendations on anticoagulation have emerged throughout the study period. This may have led to a decreased correlation seen in our study. Furthermore, as the study was an observational retrospective chart analysis, there were instances where certain information was not able to be assessed due to the lack of documentation or the inability to access information. In particular, there is no information on whether patients were given mechanical VTE prophylaxis. Some patients were also given both prophylactic and therapeutic anticoagulation during the hospital course rendering it difficult to report a comparison between VTE and non-VTE groups in terms of the use of VTE prophylaxis. Additionally, the elevation of D-dimer levels is not specific to venous thromboembolisms and may be falsely elevated due to a variety of other conditions, including malignancy, inflammatory conditions, and infections. Another limitation of our study was that D-dimer levels were not consistently obtained. As this study period occurred during the surge of Covid19, there was a lack of standardization in terms of practices such as obtaining D-dimer levels. Although during the initial data collection, baseline levels, three consecutive initial levels, and the last recorded D-dimer levels were obtained, this did not represent the overall trend of the patient's levels throughout the hospitalization course. As there was no consensus on timing of D-dimer levels, only peak D-dimer levels were included in this report as these levels were deemed to represent the severity of the Covid 19 disease. Another limitation of our study is the use of Youden's index as its value has been questioned due to its possibility of being clinically irrelevant resulting in potential bias, inaccuracy, and poor reproducibility. 21 Lastly, another limitation to our study is the changes in practice due to changes in variants and the value of D-dimer levels in the later phases of the Covid 19 pandemic as there have been reports published demonstrating that patients hospitalized during the second phase of the Covid 19 pandemic have significant reduction of D-dimer levels. 22
Conclusion
Peak D-dimers greater than 1437 ng/mL yielded a 84.2% sensitivity and 65% specificity in predicting VTE and greater than 2004 ng/mL yielded a 71.0% sensitivity and 77.9% specificity in predicting mortality. In summary, our study suggests that D-dimer levels are elevated in hospitalized Covid19 patients, and these levels can serve as an indicator for mortality and VTE.
Footnotes
Author's contribution
All authors contributed to the design and implementation of the research. R.L. and S.W. carried out data collection and wrote the manuscript with contribution from all the authors. All authors provided critical feedback and helped shape the research, analysis and manuscript.
Declaration of conflicting interests
The authors declared no potential conflicts of interest with respect to the research, authorship, and/or publication of this article.
Ethics approval
Ethical approval to report this case was obtained from the Institutional Review Board of NYU Grossman School of Medicine approval was acquired in November 2020 (Study # i20-01301).
Funding
The authors received no financial support for the research, authorship, and/or publication of this article.
Informed consent
Informed consent for patient information to be published in this article was waived off by the Institutional Review Board/Ethics Committee because the study presented no more than minimal risk to privacy since the data will be stored in the HIPAA compliant database, all identifiers will be striped at the earliest opportunity and only investigators listed on the study submission will have access to the data.