
Abstract
Due to inadequate insect-pollinator data, particularly in sub-Saharan African countries like Tanzania, it is difficult to manage and protect these species in disturbed and semi-natural areas. Field surveys were conducted to assess insect-pollinator abundance and diversity and their interactions with plants in disturbed and semi-natural areas in Tanzania's Southern Highlands using pan traps, sweep netting, transect counts, and timed observations techniques. We found that species diversity and richness of insect-pollinators were high in semi-natural areas, and there was 14.29% more abundance than in disturbed areas. The highest plant-pollinator interactions were recorded in semi-natural areas. In these areas, the total number of visits by Hymenoptera was more than three times that of Coleoptera, while that of Lepidoptera and Diptera was more than 237 and 12 times, respectively. Hymenoptera pollinators had twice the total number of visits of Lepidoptera, and threefold of Coleoptera, and five times more visits than Diptera in disturbed habitats. Although disturbed areas had fewer insect-pollinators and fewer plant–insect–pollinator interactions, our findings indicate that both disturbed and semi-natural areas are potential habitats for insect-pollinators. The study revealed that the over-dominant species Apis mellifera could influence diversity indices and network-level metrics in the study areas. When A. mellifera was excluded from the analysis, the number of interactions differed significantly between insect orders in the study areas. Also, Diptera pollinators interacted with the most flowering plants in both study areas compared to Hymenopterans. Though A. mellifera was excluded in the analysis, we found a high number of species in semi-natural areas compared to disturbed areas. Conclusively, we recommend that more studies be conducted in these areas across sub-Saharan Africa to unveil their potential for protecting insect-pollinators and how ongoing anthropogenic changes threaten them.
Introduction
Insect-pollinators provide essential ecosystem services in several environments as they support biodiversity conservation and ecosystem well-being,1,2 as well as crop production, 3 which enhances food security and human nutrition.4,5 The majority of essential fats and micronutrients derived from plants for human consumption and societal well-being are the result of insect pollination. 6 Insect-pollinators are therefore vital for the global crop varieties that humans grow and consume.7,8 About four billion kilograms of fruits, vegetables, and/or seeds are produced by these crops., 8 According to Ollerton et al. (2011), 9 Pires and Maués (2020), 5 and Shuttleworth and Johnson (2009), 10 over 308,000 blooming plant species rely on insect-pollinators as pollen transfer vectors. This implies that the loss of insect-pollinators could result in a decrease in agricultural productivity, particularly in rural African communities whose crops are largely dependent on insect-pollinators. 3 Even though insect-pollinators are essential for life on Earth, there is growing concern over their demise. 11 Previous studies claim that the use of pesticides extensively, habitat loss due to degradation and deforestation, pathogens, diseases,5,11,12 and invasions of alien species or competitors13–16 are contributing factors to the global decline of pollinators.
Despite evidence that insect pollinators are declining globally, it is difficult to determine the magnitude of these decreases, particularly in Africa, due to limited or lack of data.17,18 Tommasi et al. (2021) 12 emphasize that the biggest obstacles to insect-pollinator conservation in Africa are brought on by the continent's severe data deficits when compared to Europe and North America, where the majority of insect-pollinator-based research is conducted. Because of this, national-level planning for pollinator protection becomes even more perplexing. Even though there has been an increase in insect-pollinator studies worldwide, little effort has been made to map and characterize African insect-pollinators, especially in sub-Saharan nations such as Tanzania.1,19–21 For instance, one of the largest barriers to effective insect-pollinator conservation in Tanzania is a severe lack of knowledge of the diversity of species and their interactions with flowering plants, particularly in the southern areas of the country. 3 Some survey effort has attempted to characterize the northern Tanzanian pollinators, especially in Arusha and Kilimanjaro,1,20,21 but the Southern Highlands region is severely data-deficient. 3 As a result, the country has a significant number of insect-pollinator species that are still unidentified. African nations must therefore conduct thorough surveys to evaluate and establish their insect-pollinator databases. Understanding the diversity, species, and abundance of insect-pollinators in both disturbed and semi-natural areas could thus provide a baseline for future studies as well as contribute to the protection of these important organisms and their habitats.
In Tanzania’s Southern Highlands, insect-pollinators are being threatened by ongoing anthropogenic activities (i.e. farming activities, uncontrolled burning, fuel wood collection, and grazing) in disturbed and semi-natural areas. 3 As a result, the habitats and floral resources needed for insect-pollinators to survive are altered. Some insect-pollinators may be dwindling, which could have an adverse effect on how they interact with flowering plants.22–25 Further, insect-pollinator populations and their interaction metrics, such as connectance, linkages per species, generality, linkage density, nestedness, and specialization H2′ index, could be altered in response to change in environmental quality.15,25,26 However, due to insufficient insect-pollinator data in Tanzania's Southern Highlands, our knowledge about their population structure, interactions with plants, and the types of species present is limited. Connectance (or connectivity) is the measure of interactions at the community level. 26 It is the proportion of possible links observed in a network.26,27 Nestedness is an attribute of species-species interaction networks in natural communities. 28 While values close to zero indicate low tendencies of specialists, high values of nestedness indicate high tendencies of specialists to interact with generalists. 28 Specialization H2′, is the degree of species’ speciality in the network while linkage density refers to the average number of links per species in the network.28,29 Low linkage density indicates a decrease in insect–pollinator–plant interaction.30,31 Generality refers to generalized behaviors of insect-pollinators, that is interacting with a larger number of plants (e.g. species with many links).15,30,31 This is calculated based on the number of visits by pollinators to each flowering plant species. 15 These interaction metrics are important as they help to understand insect-pollinator communities and to investigate possible threats to plant diversity and food production if the ecosystem service (pollination) provided by pollinators decreases or their interactions with flowering plants are affected either by natural or anthropogenic changes.30–36
Due to inadequate insect-pollinator data, particularly in sub-Saharan African countries like Tanzania, it is even difficult to manage and protect these vital species in disturbed and semi-natural areas. Thus, the main goal of our research was to assess the diversity, richness, and abundance of insect-pollinators as well as their interactions with plant communities in disturbed and semi-natural areas in Tanzania’s Mbeya region. We hypothesized that (i) disturbed areas have lower levels of insect-pollinator abundance, diversity, and species richness than semi-natural areas; (ii) disturbed areas have few visits from insect-pollinators compared to semi-natural areas; and (iii) disturbed areas have lower levels of plant–pollinator interactions than semi-natural areas.
Materials and methods
Study area
The field surveys were carried out in the disturbed (Iwambi and Mbalizi) and semi-natural (Idugumbi and Loleza forest reserves) areas in the Mbeya region (8.5°S, 33°E, Table 1). From June to October, the region has cool, dry weather with daytime temperatures ranging from 16 to 30°C. 3 Typically, the rainy season runs from December to May and averages 900 mm annually. 32 The primary socio-economic activity of more than two million people that live in the Mbeya region is agriculture, which involves cultivating crops and vegetables that are insect-pollination dependent. 3 Examples of these crops are beans (Phaseolus vulgaris), sunflowers (Helianthus annuus), and watermelon (Citrullus lanatus). Nevertheless, they also produce non-insect-pollinated (or wind or self-pollinated) crops in large amounts, for instance, rice (Oryza sativa), maize (Zea mays) and wheat (Triticum aestivum). Most of the areas in the region are either disturbed or semi-natural areas, yet they provide insect-pollinators with a wealth of floral supplies and nesting sites. 3 Since, these insect-pollinators are yet to be studied, they form the basis of the current study.
Study sites, locations, and their characteristics.

Insect-pollinator surveys
Insect-pollinators were sampled from the disturbed (Mbalizi and Iwambi) and semi-natural (Loleza and Idugumbi) areas (Table 1). Different sampling techniques (e.g. pan traps, sweep netting, transect counts or Pollard walks) were used to study and sample insect-pollinators. The study was conducted between January and May, which is the typical flowering season in the Mbeya region. In 2022, insect-pollinator surveys were conducted in favorable weather and, when practical, within the hours of 0900 and 1800. At 20 m intervals, blue, white, and UV-reflecting yellow pan traps were installed inside 20 × 20 m plots in each study site. Over the course of three days per week, from 0800 h until 1800 h on each day, we installed pan traps. About 300 ml of water and 4 ml of dish soap without any aroma were put into pan traps. Every day, captured insect-pollinators were collected. For a period of 5 months, from January to May 2022, sweep nets were employed to record and/or sample insect-pollinators directly using five transect counts or Pollard walks on fixed-routes of around 20 m. 33 Only insects that were seen landing on flowers inside the 20 × 20 m patch and along the 20-m transect were noted or netted. Three times a week, each day, sweep netting was done between the hours of 0800 and 1100 h, 1300 and 1400 h, and 1600 and 1800 h for 10 weeks. 15 On days with full sun and no heavy wind, sites were surveyed. Throughout the period of the survey, each flower insect visitor that made contact with the floral or reproductive part of a flower (anthers or stigmas) of a flowering plant species was regarded as a possible pollinator.15,16 Whenever possible, insect-pollinators that did not require microscopic examination were identified in the field, while other insect-pollinators were stored in 95% ethanol, and some were dried. Identifications were done with reference to books, 37 and the Tanzania Wildlife Research Institute (TAWIRI)’s taxonomist helped to identify difficult specimens. Insect-pollinators were collected and stored at TAWIRI and MUST laboratories.
Plant–insect pollinator interaction
Additionally, timed observations were conducted randomly across the study sites at intervals of 15 minutes to record plant–pollinator interactions. Timed observations were conducted three times per week. The observer identified and noted each insect-pollinator seen while moving along at a steady 10 m per minute pace. Each study site underwent two rounds of observation each week. We recorded the number of insect-pollinator visits and identified flowering plants being visited at each site. Observations of insect-pollinators were always made between the hours of 0900 and 1700 during clear, windless days. In the field, we identified plants and insect-pollinators to a species level whenever possible, and we identified difficult specimens to a morphospecies level. Using R bipartite package 2.08, 34 plant–pollinator interactions for each study site were constructed based on the frequency of insect-pollinator visits to each flowering plant.15,26
Data analysis
In order to compare the abundance of insect-pollinators across the two habitat types—disturbed and semi-natural—we combined data from the four study sites—Mbalizi, and Iwambi, and Loleza and Idugumbi, respectively. Using the Mann–Whitney test, insect-pollinator abundance in disturbed and semi-natural habitats was compared. Also, it was used to compare the number of interactions or visits of insect-pollinators between and within their order across the disturbed and semi-natural study areas. Using a post hoc test for non-parametric test called the Dunn’s multiple comparisons test, significant differences were confirmed. Diversity metrics, that is, Shannon–Wiener diversity (H′), Evenness (E), Margalef (D), and Fisher alpha (α), were compared across all study sites. These diversity indices were used because they provide vital information on the rarity and prevalence of species in a community. Kolmogorov–Smirnov and Levene’s tests, which assess normality and homogeneity of variance, were used, respectively. The non-parametric Mann–Whitney test was used when the parametric assumptions were not met following transformations using log transformation. All tests had a 5% threshold of significance. The number of insect-pollinator visits to each plant species was used to determine the network-level metrics, including connectance, linkage density, linkages per species, nestedness, generality, and fisher alpha.15,35,36 In order to determine if the over-dominant species A. mellifera is potentially influencing the networks and communities, we performed diversity indices and network-level metrics analysis, excluding and including A. mellifera. Furthermore, we analyzed and presented species accumulation curves. The plant–insect networks were built using R version 3.5.1, and all statistical analyses were performed using Origin (9.0 SR1) and Paleontological Statistics Software (PAST) version 2.17.
Results
Insect-pollinator abundance, diversity, and species richness
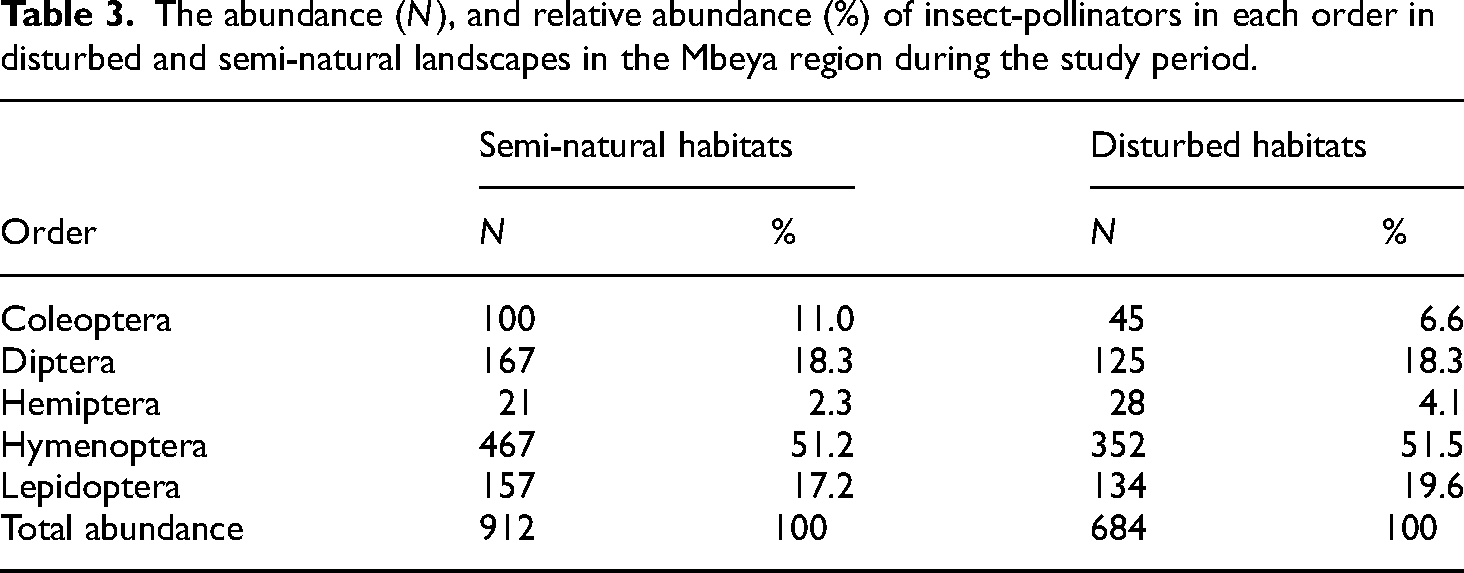
The abundance of insect-pollinators in semi-natural areas (N = 912 ± 2.14) was 14.29% more than in disturbed (N = 684 ± 2.61) areas (Mann–Whitney: U = 1295, p = 0.004, Table 2). While the most abundant insect-pollinators in semi-natural areas were Hycleus lugens, Scarabaidae, and Coccinelidae (Coleopterans); Eristalis spp., Musca domestica, and Syrphidae (Dipterans); and Acraea eponina and Catopsilia florella (Lepidopterans), in disturbed were Coccinelidae and Scarabaidae (Coleopterans); Syrphidae, Muscidae and Bombyliidae (Dipterans); and Mylthris, Danaus chrysippus and Catopsilia florella (Lepidopterans) (Table 2). The Hymenopterans Apis mellifera, Xylocopa cafra and Xylocopa erythrina were abundant in both disturbed and semi-natural areas (Table 2). Overall, Hymenoptera and Diptera were the most abundant orders of insect-pollinators in semi-natural areas compared to disturbed areas (Table 2 and Table 3). Lepidoptera was the second abundant insect-pollinator order following the Hymenoptera in disturbed areas (Table 3). Moreover, there was a significant difference in the abundance of insect-pollinators across the four study sites (H = 41.69, df = 17, p = 0.001, Table 3). The high numbers of insect-pollinators were recorded in semi-natural sites (Table 3). Examples of different insect–pollinators observed during our study are shown in Figure 1. The cumulative species curve revealed that the number of new species decreased with respect to sampling time (Figure 2). There was a high cumulative species richness in semi-natural areas compared to disturbed areas (Figure 2). Apis mellifera influenced diversity indices and network-level metrics (Table 4). Whether A. mellifera was included or excluded in the analysis, we found a high number of species, Shannon–Wiener diversity, Margalef, Evenness, and Fisher alpha diversity index in semi-natural areas compared to disturbed ones (Table 4).

Examples of insect-pollinators visiting some of the flowering plants in the study areas: (a) dotted border butterfly (Mylthris spp.) on Emilia sp. flower, (b) Blowfly (Chrysomya sp.) on Lippia kituensis flower, (c) Groove-winged flower beetle (Melyris sp.) on Emilia spp. flower, (d) Honey bee (Apis mellifera) on Ceratotheca spp. flower, (e) Beewolf (Philanthus sp.) on Bidens pilosa flower, (f) Tachinid fly on B. pilosa flower, and (g) Potato ladybird beetles (Epilachna sp.) on B. pilosa flower. Photos by F. Ojija (2022).
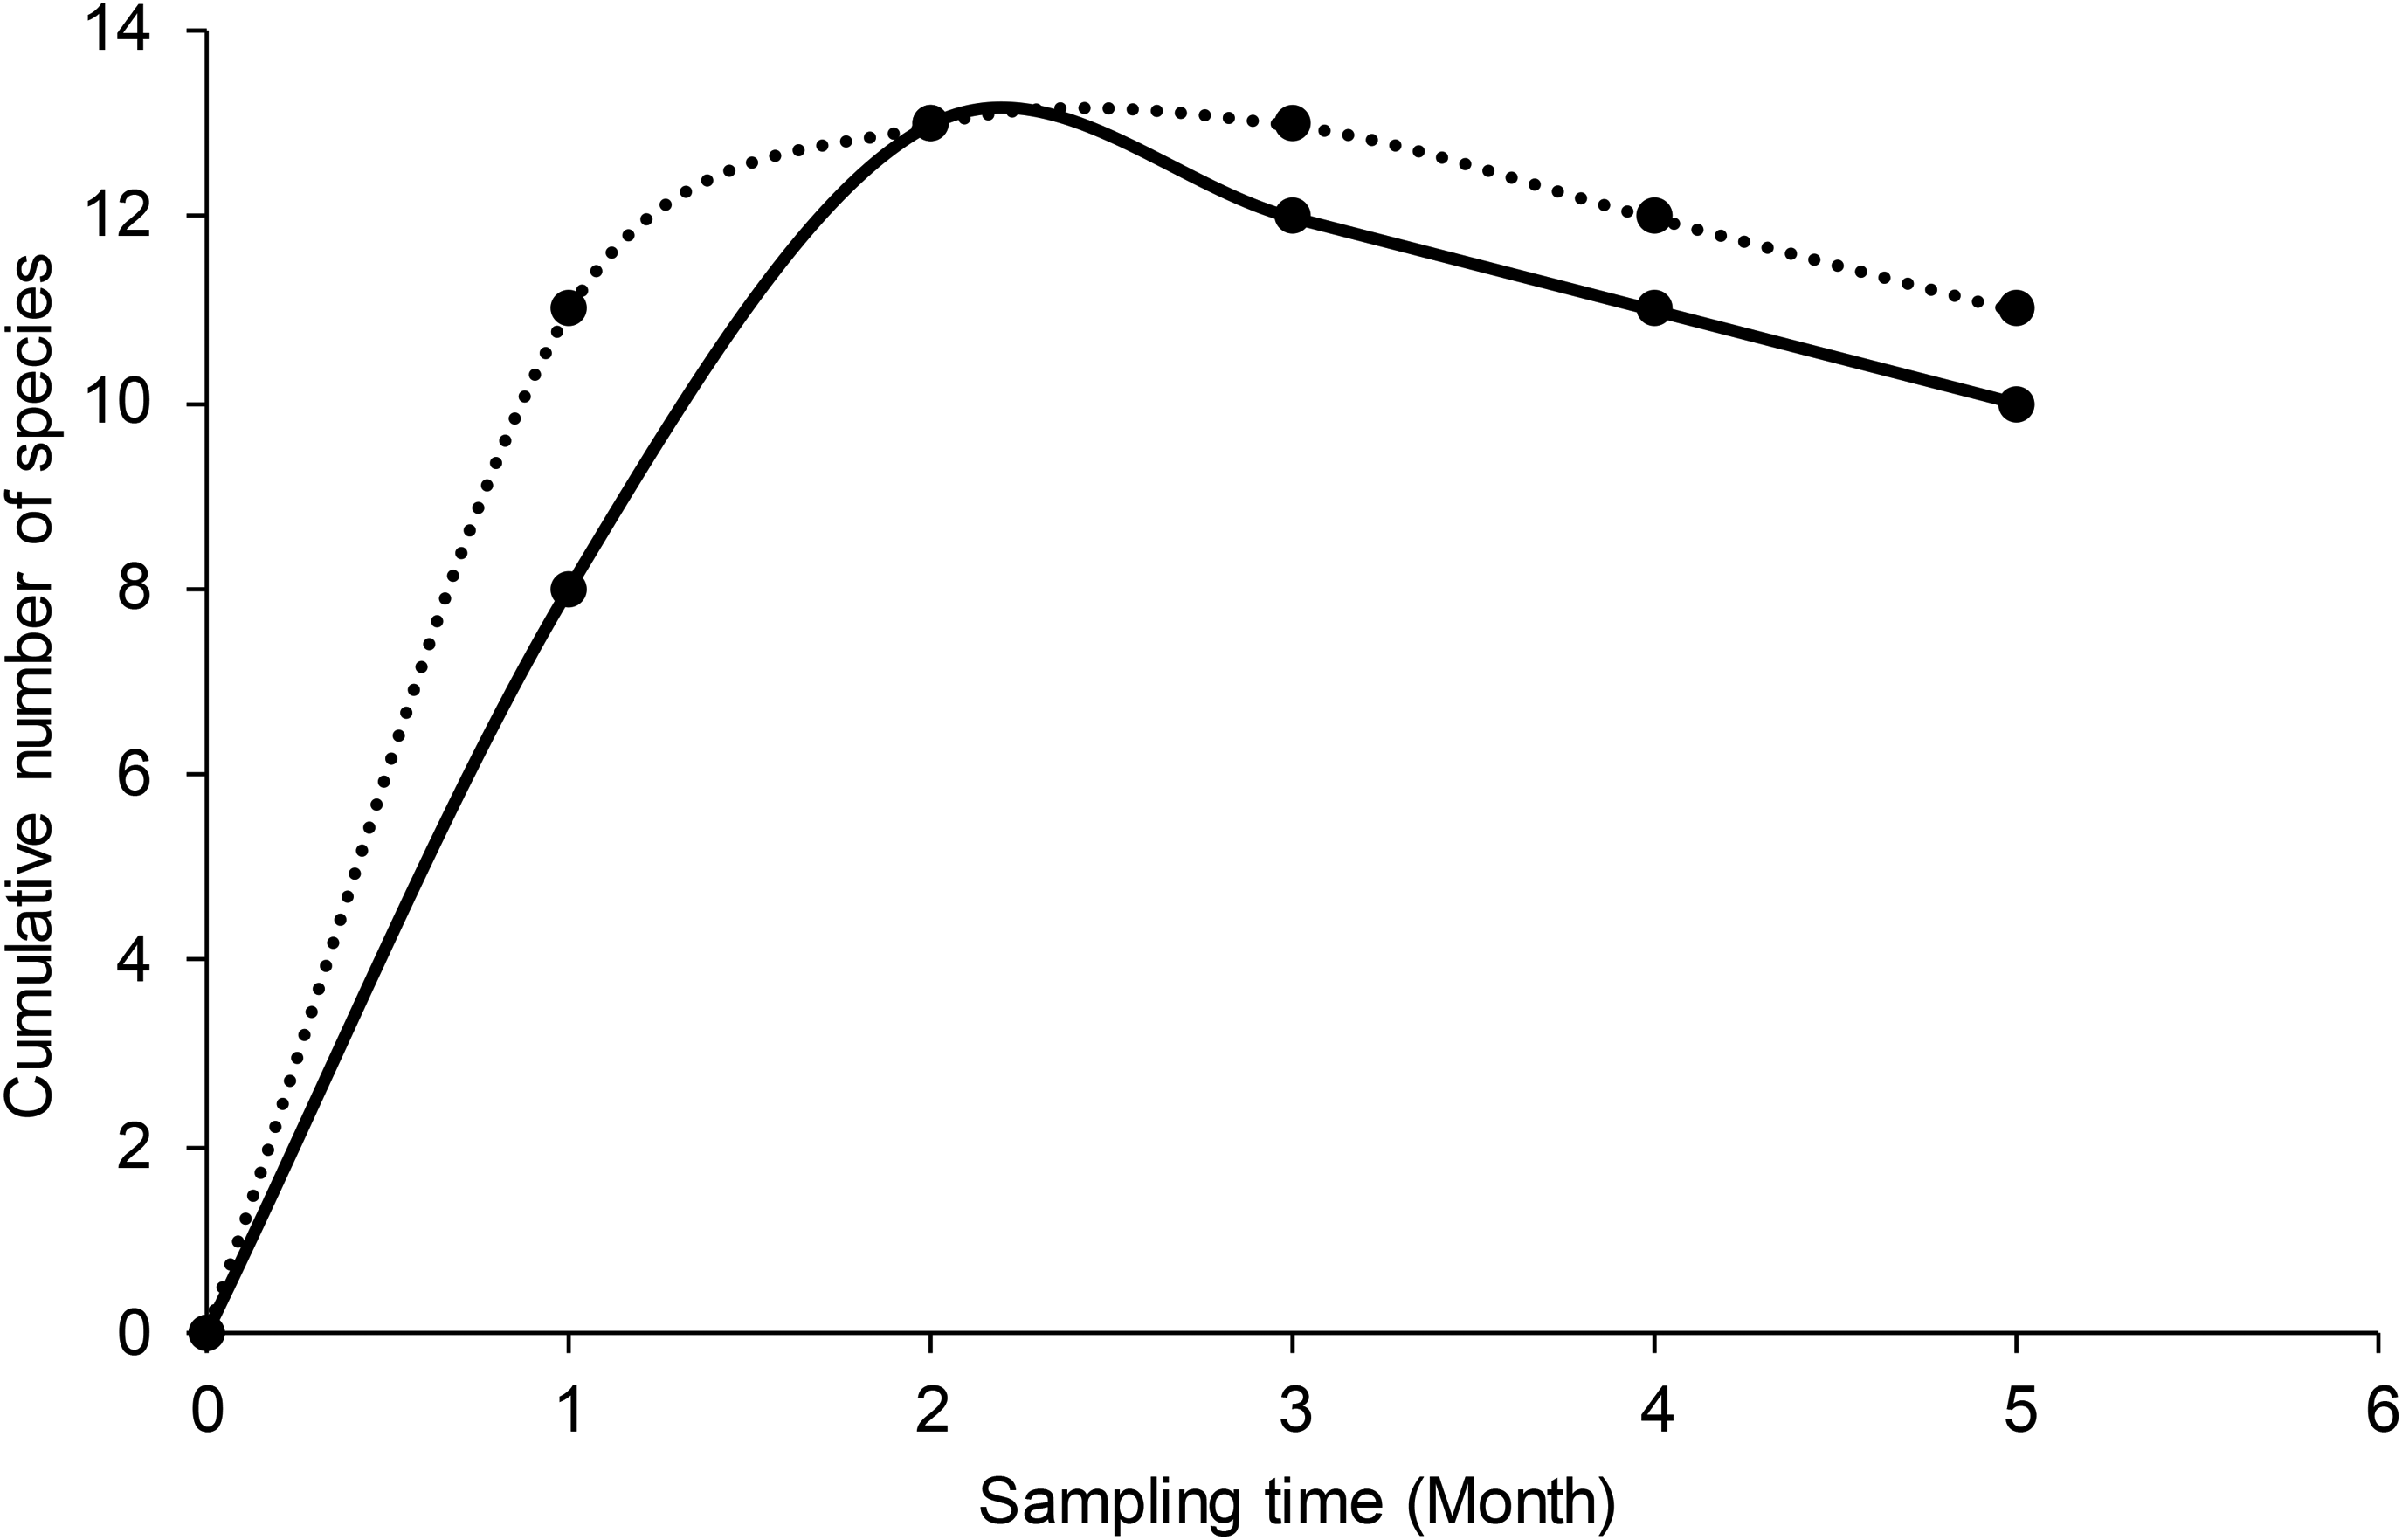
Species accumulation curve showing the cumulative number of species against the sampling time in disturbed (solid line) and semi-natural (dotted line) sites.
Insect-pollinators, order, abundance (N), and relative abundance (%) recorded in disturbed and semi-natural landscape in the Mbeya region during the study period.

The abundance (N), and relative abundance (%) of insect-pollinators in each order in disturbed and semi-natural landscapes in the Mbeya region during the study period.
Diversity indices of insect-pollinators (when A. mellifera is included and excluded in the analysis) in the disturbed and semi-natural areas during the study period.

Plant–pollinator interactions
While 1229 and 1508 interactions between insect-pollinators and flowering plants were recorded in the disturbed and semi-natural areas, respectively, when A. mellifera was excluded from the analysis, 1385 and 1633 interactions were recorded when A. mellifera were included. The bipartite graph (Figure 3i–ii) displays the interactions between plant species and insect-pollinators, whereas the interaction metrics of the study areas are shown in Table 5. Examples of different plant–insect–pollinator interactions are presented in Figure 2. When A. mellifera was included in the analysis (Figure 3(a)), the number of interactions within insect-pollinator order did not differ significantly between disturbed and semi-natural areas, i.e. Hymenoptera (Mann–Whitney: U = 168.5, p = 0.737), Lepidoptera (Mann–Whitney: U = 177.5, p = 0.942), Coleoptera (Mann–Whitney: U = 170, p = 0.769), and Diptera (Mann–Whitney: U = 172.5, p = 0.826). Similarly, when A. mellifera was excluded from the analysis (Figure 3(b)), the number of interactions within the insect-pollin//ator order did not differ significantly between disturbed and semi-natural areas, i.e. Hymenoptera (Mann–Whitney: U = 145, p = 0.302). However, a significant difference (H = 56.64, df = 7, p < 0.0001) was observed when the interactions of different insect-pollinator orders were compared between disturbed and semi-natural study areas. Hymenoptera pollinators interacted with the most flowering plants in both disturbed and semi-natural areas, followed by Diptera and Lepidoptera pollinators (Figure 3(a)). Hymenoptera (n = 511) had twice the total visits of Lepidoptera (n = 281, p = 0.007), and threefold of Coleoptera (n = 137, p < 0.0001), and 55 more visits than diptera (p = 0.766) in disturbed areas (Figure 3). In semi-natural habitats, the total number of visits by Hymenoptera (n = 576) was more than three times that of Coleoptera (n = 154, p < 0.0001). Also, it was more than 237 and 12 visits of Lepidoptera (p = 0.030) and Diptera (p = 0.560), respectively. Furthermore, when A. mellifera was excluded from the analysis (Figure 3(b)), the number of interactions differed significantly between insect orders in both disturbed (H = 24.26, df = 7, p < 0.0001)) and semi natural (H = 20.78, df = 7, p = 0.0001) areas. In addition, Diptera pollinators interacted with the most flowering plants in both disturbed and semi-natural areas, followed by Hymenoptera (Figure 3(b)). The Dipteran (n = 456) had 91 more visits than Hymenoptera (n = 365, p = 0.093), 175 more visits than Lepidoptera (n = 281, p = 0.004), and threefold of Coleoptera (n = 137, p < 0.0001) in disturbed areas. In semi-natural habitats, the total number of visits by Diptera (n = 564) was high by 98 and 225 visits compared to Hymenoptera (n = 466, p = 0.640) and Lepidoptera (n = 339, p = 0.021), respectively. Also, it was three times that of Coleoptera (n = 154, p < 0.0001).
Apis mellifera is included in the interaction network Apis mellifera is excluded from the interaction network

Visitation web showing plant–pollinator interactions when Apis mellifera is (a) included and (b) excluded in the network for disturbed and semi-natural areas in the Mbeya region during the study period. Respectively, blue/yellow and green/black boxes represent insect-pollinators and flowering plants, the width of which indicates the number of visits recorded. Gray links indicate plant–pollinator interactions, and the visitation frequency is represented by the magnitude of interactions (i.e. breadth of the links). Plants species are LK = Lippia kituensis, LG = Leucas grandis, VG = Vernonia galamensis, AP = Aspilia spp., LC = Lantana camara, BP = Bidens pilosa, OG = Ocimum gratissimum, LA, Leucas aspera, LN = Leonotis nepetifolia, CE = Ceratotheca spp., TL = Tagetes lemmonii, CR = Crotalaria spp., SI = Solanum incanum, LV = Lantana viburnoides, TM = Tagetes minuta, EM, = Emilia spp., AC = Ageratum conyzoides, EF = Emilia sonchifolia, CA = Cardopatium spp., PV = Phaseolus vulgaris, SL = Solanum lycopersicum, and HA = Helianthus annuus).
Network metrics in the two study areas when A. mellifera is included and excluded in the analysis.

Furthermore, when A. mellifera was excluded from the analysis, the number of interactions between insect-pollinators and flowering plants was 1229 and 1508 in the disturbed and semi-natural areas, respectively.
The plant–pollinator network unveils a wide range of interactions between insect-pollinators and plant species that were recorded during our study (Figure 3). But not all insect-pollinators seemed to visit flowering plants equally (Figure 3). Plant species, i.e. Phaseolus vulgaris, Bidens pilosa, and Helianthus annuus, appeared to modify insect-pollinators’ interaction patterns in disturbed environments, as they had a higher visitation frequency than other plants (Figure 3). Hymenopterans (i.e. A. mellifera, Coelioxys spp., Xylocopa spp., Colletes spp., P. armata, and Lipotriches spp.), dipterans (Bombyliidae, Chrysomya spp., Eristalis spp., Calliphoridae, Syrphidae, Tachinidae, and Muscidae), and Lepidoptera (Danaus chrysippus, Vanessa virginiensis, Acraea eponina, Acraea encedon, Acraea uvui, and Mylthris spp.) interacted more with these plants than Coleopterans (Figure 3(a)). Plants, i.e. L. kituensis, B. pilosa, and Emilia spp., were visited more frequently in semi-natural areas (Figure 3). Biden pilosa received more visits from all insect-pollinators at all study sites. Hymenopterans (e.g. A. mellifera and X. cafra) were the primary and most frequent flower visitors during our study as they had strong interactions with plant species, i.e. P. vulgaris, Emilia spp., and L. kituensis (Figure 3(a)). Semi-natural study sites had higher levels of connectance, specialization, links per species, and nestedness than disturbed study areas (Table 5). When compared to study areas in semi-natural habitats, the linkage density and generality were considerably higher in disturbed areas regardless of whether A. mellifera was included on excluded in the analysis (Table 5).
Discussion
Our study found that both disturbed and semi-natural areas have the potential to provide insect-pollinators with floral resources and nesting sites. This is due to the fact there were abundant insect-pollinators in both categories of our study areas. However, continuing human disturbances in the environments seem to have a significant negative impact on the composition and population structure of insect-pollinators, as well as their interactions with flowering plant species. For instance, during our study, we found that the insect-pollinators’ species composition, diversity, and abundance were low in disturbed areas. This indicates the likely impact of anthropogenic changes on habitat suitability (i.e. a decline of foraging resources and nesting sites) for insect-pollinators.11,37 Thus, human-induced changes are contributing to the decline of insect-pollinators in the disturbed study areas.11,38–40 This is similar to the findings from other previous studies (e.g. Winfree et al., 2009; 38 Potts et al., 2010; 40 Goverde et al., 2002 41 ; Williams et al., 2011; 42 and Zanette et al., 2005 43 ) which reported that insect-pollinators’ abundance and diversity are negatively affected by human disturbances.
Despite the fact that both our study area categories appeared to offer floral resources (nectar and pollen), semi-natural areas were the most offering these resources due to fewer human disturbances compared to disturbed areas. Hence, in the former category, insect-pollinators were more secure with nesting sites than the latter. Moreover, many flower resources in semi-natural areas attracted insect-pollinators, and thus, more insect-pollinators were recorded in these areas compared to disturbed areas with few and scattered patches of flowers. In general, we observed many insect-pollinators in semi-natural areas because the areas are protected, and hence, there are few human deeds and marginal disturbances.2,43,44 Nevertheless, the majority of these insect-pollinators in both disturbed and semi-natural areas were generalist species, for instance, A. mellifera and Xylocopa spp. This is because generalist insect-pollinators are not selective and therefore forage on various flowering plant species.15,45,46 Being a generalist and over-dominant species, A. mellifera seemed to influence the community structure of the study areas.
Furthermore, we found that insect-pollinators in semi-natural areas interacted with a variety of flowering plant species more frequently compared to plants in disturbed areas. This could be due to relatively fewer flowering plants that were observed in the disturbed study areas, and subsequently fewer interactions between plants and insect-pollinators in these areas.47–49 Further, in disturbed areas, some insect-pollinators such as hymenoptera and diptera appeared to have access to forage resources from remnant cultivated crops i.e. S. lycopersicum, H. annuus and P. vulgaris. These crops attracted and interacted with insect-pollinators more than other non-crop plants and thus could alter plant–insect-pollinator networks. This is because most insect-pollinator taxa particularly Hymenoptera, diptera, and Lepidoptera seemed to alter their visitation patterns in the presence of these crops. Moreover, some plant species (e.g. L. kituensis, B. pilosa, and Emilia spp.) had a high visitation frequency in both disturbed and semi-natural study areas. However, B. pilosa being an invasive plant in the study sites, was abundant and interacted more with most insect-pollinators than other plant species. This means that any human disturbance associated with the spread of invasive plants in natural, and/ or semi-natural areas could potentially affect their plant–insect-pollinator networks.
As a result of human activities in our disturbed study areas, most of plant–insect–pollinator network metrics, e.g. connectance, specialization, links per species, and nestedness were low compared to semi-natural areas. This implies that a plant–insect–pollinator network's robustness is dependent on quality of the environment.28,30,35,44,48,50 Consequently, any change in pollinator diversity due to human disturbance in the environment or ecological systems can negatively affect plant–pollinator interactions. 31 This is supported by the fewer plant–insect–pollinator interactions and lower values of specialization index in our disturbed study areas. The lower values of the interaction metrics in disturbed areas could also be due to lower insect–pollinator diversity.30,41,50–54
Since semi-natural study areas had high nestedness, we show that communities with more plant–insect–pollinator interactions are much more nested.28,31 Also, these areas exhibited more stable interactions as seen by their high connectance as compared to disturbed areas.23,24,53 Essentially, high connectance infers resilience and network stability in semi-natural areas.31,53,54 On the other hand, fewer plant–insect–pollinator interactions in disturbed areas account for decreased network nestedness and connectance.,48,50,51 In general, the difference in network metrics between disturbed and semi-natural areas is largely due to the variations in species richness and abundance, as well as floral abundance, brought on by anthropogenic activities and changes in land use. 52 Despite the fact that disturbed areas had lower insect–pollinator abundance, diversity, and species richness as well as fewer insect–pollinator interactions, our findings suggest that both disturbed and semi-natural areas are potential habitats for insect–pollinators. But, semi-natural areas appear to be more favorable.
Conclusions
The findings of this study represent the first quantitative surveys of insect–pollinators in disturbed and semi-natural areas in Tanzania's Southern Highlands. It contributes significantly to the debate over whether human activity is causing a decline in insect pollinators. Our findings also show that plant–insect–pollinator interactions were more frequent in semi-natural areas, and conservation education should be promoted there to protect these species from anthropogenic alterations. This work, therefore, lends credence to the idea that human disturbances and related changes have a major impact on the structure of the insect–pollinator community and plant–insect–pollinator interactions. The study suggests that if disturbed and semi-natural areas are managed properly, they could protect insect-pollinators and, thus, contribute significantly to food production. Therefore, we recommend that more studies be conducted in disturbed and semi-natural areas across sub-Saharan Africa to unveil their potential for protecting insect-pollinators and how ongoing anthropogenic changes threaten them. Generally, insect-pollinators are threatened by anthropogenic changes globally. These changes could be seen in disturbed and semi-natural areas as they deplete the floral resources and nesting sites needed for insect-pollinators.
Footnotes
Acknowledgements
The authors appreciate the field collection assistance from Leticia Lutambi, Grace Mkala, Thomas Gervas, and Fatuma Rashid. They are grateful to four anonymous co-workers who polished the manuscript and offered insightful criticism. Additionally, they would like to express their gratitude to Kazumari Mkwavila from the Tanzania Forest Service in Rungwe, Mbeya region, for his assistance in identifying plants and to Alain Pauly from the Tanzania Wildlife Research Institute in Arusha, Tanzania, for his assistance in identifying bee specimens.
Declaration of conflicting interests
The author(s) declared no potential conflicts of interest with respect to the research, authorship, and/or publication of this article.
Ethics approval and informed consent
This study did not involve any local people or patient. Thus, the authors did not have ethics approval nor informed consent.
Funding
The author(s) disclosed receipt of the following financial support for the research, authorship, and/or publication of this article: This work was supported by the Mbeya University of Science and Technology through its Internal Call for Research Grant (Grant No. CoSTE/DAS/2021-2022/01).
Author biographies
Fredrick Ojija, PhD, is a Lecturer in biodiversity and ecosystem management. His area of research is biodiversity and ecosystem management, focusing on pollinators and invasive plant management.
Lusekelo Silabi Adam, is a Researcher in biodiversity conservation. His area of research is wildlife, including pollinators.
Regan Nicholaus, PhD, is a Lecturer in biodiversity management. His area of research is biodiversity, focusing on wildlife, including aquaculture.
Eliezer B Mwakalapa, PhD, is a Lecturer in conservation biology. His area of research is biodiversity conservation, focusing on wildlife, including environmental toxicology.