
Abstract
This article carried out a numerical investigation of knock, using the Taguchi method and the grey relational analysis method to determine the importance and the contribution rate of multiple parameters on the peak pressure in the cylinder and the knock tendency under heavy load conditions. Four parameters, namely, compression ratio, spark timing, EGR rate, and inlet temperature, were set at four levels. The simulation was designed using a design of experiment method based on Taguchi's L16 orthogonal array. The simulation results of knock tendency and peak in-cylinder pressure were analyzed by the Taguchi-Grey method. According to the analysis results of the Taguchi-Grey method, the optimal level, the importance rank, and the contribution rate of factors on the knock tendency, peak in-cylinder pressure, and equivalent response were determined. The results demonstrate that the contribution rate of compression ratio, spark timing, EGR rate, and inlet temperature to the knock tendency is 45.9%, 22.98%, 19.46%, and 11.66%, respectively. The compression ratio, spark timing, EGR rate, and inlet temperature contribution to the peak in-cylinder pressure is 40.56%, 31.03%, 24.94 and 3.47%, respectively. The optimal conditions for the minimum knock tendency and the maximum peak in-cylinder pressure are obtained at CR1EGR4IT1ST1 and CR4EGR1IT1ST4, respectively.
Introduction
Due to the energy crisis and the ever-increasing stringent automobile emission regulations, the traditional internal combustion engine industry confronts more severe challenges. Energy saving and emission reduction have become major trends in the development of engines. 1 In improving the thermal combustion efficiency and power performance of internal combustion engines, increasing the compression ratio is one of the most beneficial ways to improve internal combustion engines’ thermal efficiency and power performance. However, the increase in compression ratio will also raise the risk of knock in spark-ignition engines. 2 The engine knock phenomenon is caused by the collision between the normal flame front and the flame front produced by the unburned end gas, which causes the pressure in the cylinder to fluctuate and the internal combustion engine body to resonate. 3 Recently, engine knock has become a significant limitation that restricts the improvement of the economy and power of spark-ignited internal combustion engines. 4 Therefore, many scholars have been attracted to solving spark-ignition engine knock under high load conditions. It has been shown that several operating parameters influence the knocking tendency of an internal combustion engine.5–8 With the development of CFD (Computational Fluid Dynamics) technology, more and more scholars use simulation methods to investigate the knock of spark-ignition engines. Li et al. developed a SAGE model with chemical reaction kinetics to explore the influence of EGR (Exhaust Gas Recirculation) on a high compression ratio engine knock. It was found that EGR can reduce the knock intensity and delay the moment when a knock occurs. 9 Zou et al. propose a two-zone combustion model to explore the influence of inlet temperature and compression ratio on knock. The results show that changes in inlet temperature and compression ratio will promote the occurrence of knock. If the inlet temperature is controlled below 336 K and the compression ratio is less than 15, it will not cause the knock. 10 In one study conducted by Chuahy et al., it was shown that spark timing and compression ratio affect knock, and the degree of ignition time's influence on knock is not as significant as the compression ratio. However, the contribution rate of the two parameters to the specific impact of knock is not given. 11 Based on a predictive knock model, Kumano, Kengo investigated the effect of spark timing and EGR on knock tendency. The results show that the spark timing at the critical knock point can be advanced by 1 CAD (Crankshaft Angle Degree) per 1% of the EGR used. 12 According to Zhen et al., spark timing retarding and EGR technology has outstanding performance in suppressing the knock of high compression ratio internal combustion engines. However, just delaying the spark timing caused a drastic decrease in the in-cylinder pressure, so it is necessary to use EGR technology to suppress knock. 13
Based on the existing literature, previously published research mainly focused on exploring the independent influence of each factor of compression ratio, inlet temperature, spark timing, and EGR rate on knock.5–7 However, few studies highlight the contribution rate and importance ranking of compression ratio, inlet temperature, spark timing, and the EGR rate to knock tendency, which brings difficulties to the control and suppression of spark ignition engine knock. Therefore, this article aims to determine the order of multiple parameters to the influence of knock tendency and peak in-cylinder pressure. After studying the ranking of the impact of multiple parameters on the knock tendency and the peak pressure in the cylinder, it becomes more meaningful to further explore the contribution rate of each parameter to the knock and peak pressure in the cylinder. The quantification of the effect of multiple parameters on knock will also provide a pavement for the synergistic adjustment of multiple parameters to control knock.
The Taguchi method is a mathematical-statistical method proposed by Japanese Genichi Taguchi, 14 which is employed to investigate the impact of multiple design parameters on a single target result. The least orthogonal array experiments can be used to obtain an ideal multi-parameters response analysis effect. 15 This method was often used in product design and development experiment analysis in the past, which could efficiently find the best combination of parameters and determine the influence and contribution rate of each parameter on the response through the signal-to-noise ratio. Although 3D simulation research is more convenient than bench experiments, it is still time-consuming work. Thus, the Taguchi method has gradually been applied to internal combustion engine numerical simulation analysis to solve the time consumption problem.16–18 It performs well for exploring multiple parameters for single-objective optimization. However, the Taguchi method can’t accurately explore the influence of multiple parameters on two or more responses simultaneously. With the purpose of investigating the impact of multiple factors on two or more responses, some methods should be adopted to convert two or more responses into an equivalent response. Therefore, the grey relational analysis approach is introduced to analyze the influence of multiple parameters on multiple responses based on the Taguchi method. 19
This paper aims to fill the gap in quantifying the contribution rate of multi-parameters to knock, and quantify the contribution rates of compression ratio, spark timing, EGR rate, and inlet temperature to the knock tendency and the peak in-cylinder pressure. First, A CFD model is developed and validated to predict the combustion and detonation of a 3-cylinder internal combustion engine. Next, this paper will combine the Taguchi method and gray relational analysis to design an L16 orthogonal test table and use CFD technology to explore the effect of compression ratio, spark timing, EGR rate, and inlet temperature on the knock tendency and the maximum in-cylinder pressure of the engine under a high load operating condition. Finally, each factor's contribution rates and importance ranking to the knock tendency and the peak in-cylinder pressure are quantified and ranked, respectively.
Modeling approach and model validation
Numerical mesh setup
The 3D CFD numerical calculations were performed with the commercial CFD package AVL FIRE.2014v. After verification of grid independence, the computational mesh used for numerical calculation from IVC (Intake Valve Closing, 365CA) to EVO (Exhaust Valve Opening, 856CA) of the cycle is shown in Figure 1. The total number of grids in Figure 1 is 0.7 million, the maximum grid size is 1 mm, and the minimum grid size is 0.01 mm. In addition, the intake valves, the combustion chamber, and the piston had been refined. Based on the original internal combustion engine model with a compression ratio of 10.5, without changing the intake port model, by changing the height of the piston, grid models with compression ratios of 12, 13, and 14 were generated, respectively. Based on these four grid models with varying compression ratios, the impact of the compression ratio, the EGR rate, the inlet temperature, and the spark timing on the knock tendency and maximum pressure are studied.

The computational mesh.
Turbulent modeling and combustion modeling
The z-ε-f model proposed by Hanjalic K is used to simulate the turbulent flow in the cylinder.
20
This four-equation model has high calculation accuracy and good stability, which can better describe the in-cylinder turbulent movement under the premise of good adaptability to mesh uniformity. Researchers widely use the ECFM (Extended Coherent Flame Model) model to simulate and analyze the combustion of spark-ignition internal combustion engines.21–23 In the ECFM model, the combustion in the cylinder is divided into two areas by the flame surface. One is the combustion area, and the other is the unburned area. The flame density is determined by equation (1).

Knock modeling
Currently, many models are used to predict engine knock, and each model weighs the contradiction between model simulation accuracy and simulation calculation complexity. Based on the ECFM combustion model, the AnB knock model is employed in this article. 24 The AnB knock model is based on auto-ignition delay and uses two chemical reaction processes to simulate the knock in the cylinder.
In the first step, the AnB knock model calculates the growth of a hypothetical knock “precursor”. When the “precursor” quality exceeds the set unburned fuel quality threshold, the chemical oxidation reaction of knock begins. In this second stage, the fuel consumption rate can be determined by equation (2).

The AnB knock model determined the crank angle at the start of the auto-ignition delay by equation (3).

During the auto-ignition delay period, the change of the chemical reaction kinetics in the cylinder is far from non-linear. The concentration of the “precursor” showed an approximately exponential change over time. The concentration change of the “precursor” can be described by equation (4).


The parameters of the AnB knock model are presented in Table 1. The Knock Reaction Rate is a dimensionless quantity defining the knock tendency.26,27 The larger the value, the higher the probability of knock.
Anb knock model parameters.

Boundary conditions and initial conditions
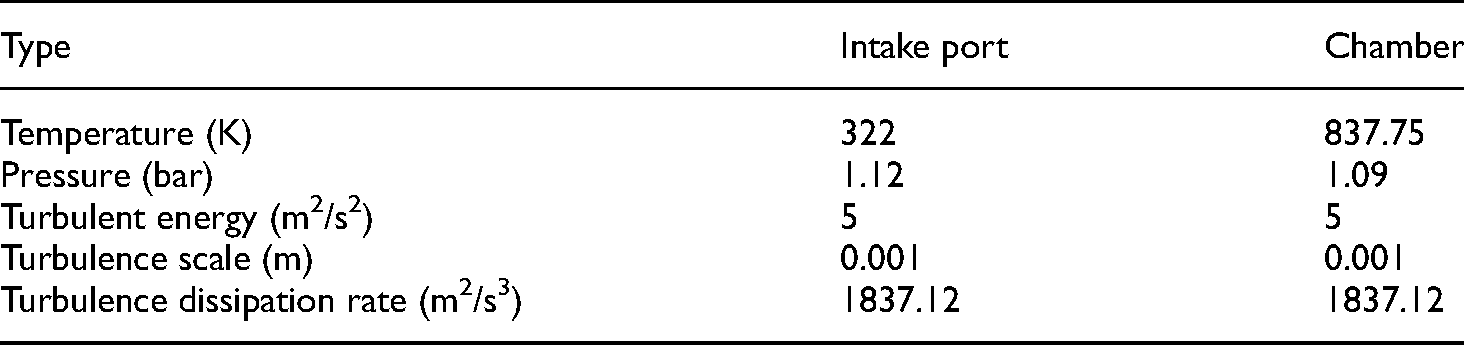
The operation condition of the simulation is set at 3600 rpm, with 90% whole throttle opening. The model's initial conditions are demonstrated in Table 2. Table 3 illustrates the temperature boundary condition setting of the simulation calculation. The thermodynamic boundary conditions and initial flow conditions are determined by the actual operating conditions of the test bench and the GT-power one-dimensional simulation calculation.
Boundary conditions of the simulation model.

Initial conditions of the simulation model.
Model validation
The internal combustion engine to verify the model is a three-cylinder four-stroke water-cooled naturally aspirated gasoline engine with a displacement of 1 L. The main structural parameters of the engine are illustrated in Table 4. The experimental test diagram for the original engine with a compression ratio of 10.5 is shown in Figure 2.

Diagram of the research engine testbed. 1-air cleaner, 2-air flow meter, 3-surge tank, 4-throttle, 5-fuel injectors, 6-fuel flow meter, 7-fuel tank, 8-crank angle encoder, 9-engine, 10-ignition system, 11-in-cylinder pressure sensor, 12-dynamometer, 13-EGR cooler, 14-three-way catalytic, 15-electronic control unit, 16-EGR valve, 17-PC control. 18-combustion analyzer.
Engine specifications and conditions.

To validate the combustion model, the comparison of the measured pressure in the bench test and the simulation in-cylinder pressure of 3600 rpm under a no-knock condition is analyzed, as shown in Figure 3. The comparison in Figure 3 shows that the simulation results agree well with the experimental pressure history. The in-cylinder peak error between the experimental data and the simulation results is within 5%. The combustion simulation model can accurately describe the changes in internal combustion engine pressure. The experimental validation of the knock model often brings irreversible harm to the engines. In addition, many scholars have verified and used the AnB model, which has been proven to have good knock simulation performance.6,24–28

Pressure comparison between experiment and simulation without knock combustion.
Taguchi method
The Taguchi method is a mathematical-statistical approach proposed by Japanese Genichi Taguchi in 1995, which uses experimental design and analysis of experimental data to evaluate the importance of multiple design parameters to the target result. 29 The best experimental results can be obtained with the least number of experiments. Using the Taguchi method orthogonal design table for experimental parameter design can effectively reduce the number of experiments. 30 The sum of the number of experiments with four factors and four levels requires 256 times. However, only 16 times the orthogonal test is needed after using Taguchi orthogonal array design method. The Taguchi method adopts the signal-to-noise(S/N) ratio to obtain the order of influence of each factor on the results. Finally, each parameter's importance and contribution rate to the response can be determined by the difference between the parameters’ maximum and minimum mean S/N ratio. 31 The best combination of design parameters can also be obtained.
Parameters selection and levels selection
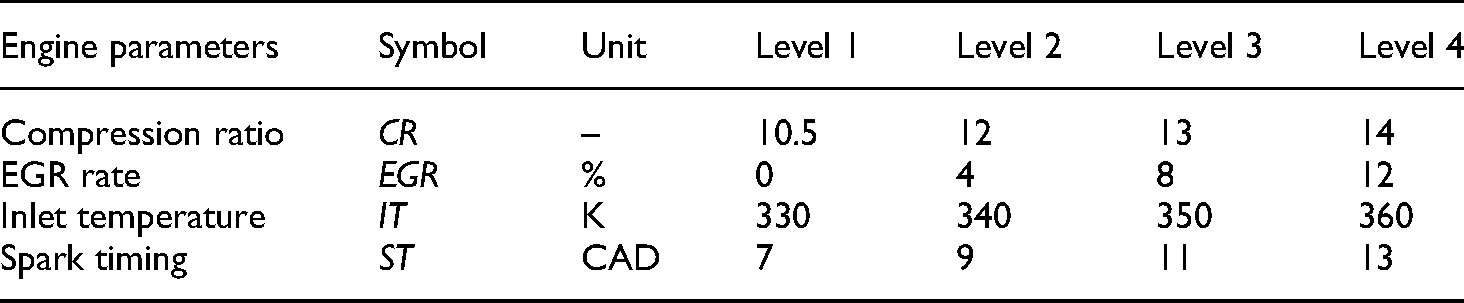
This paper mainly studies the influence of spark timing, EGR rate, inlet temperature, and compression ratio on an internal combustion engine's knock tendency and peak in-cylinder pressure. The spark timing should not be set too small. If it is too small, it will cause the combustion to deviate from the ideal cycle and reduce the combustion heat efficiency. 32 Thus, the spark timing is set to 7 BTDC (original engine spark timing), 9 BTDC, 11 BTDC, and 13 BTDC at four levels. The EGR rate is set to four levels: 0%, 4%, 8% and 12%. Because when the EGR rate exceeds 15%, it will affect the stability of internal combustion engine operation. 33 The inlet temperature is controlled from 313 K to 383 K. 34 Therefore, the inlet temperature in this study is set to four levels: 330 K, 340 K, 350 K, and 360 K. For exploring the impact of different compression ratios on the knock tendency and the highest in-cylinder pressure of the spark-ignition engine, the combustion chambers with compression ratios of 12, 13, and 14 were generated based on the original internal combustion engine with a compression ratio of 10.5. The parameters levels and values of the engine are displayed in Table 5. The L16 orthogonal array for simulation is shown in Table 6.
Parameters levels and their values.
L16 orthogonal array for simulation.

Signal-to-noise ratio
The Taguchi method uses a loss function to express the difference between the simulation results and the ideal value. Then, the loss function is then transformed into Signal-to-Noise (S/N) ratio. 35 The Taguchi method has three kinds of loss functions: the S/N ratio has a characteristic of “smaller is better”, the S/N ratio has a characteristic of “larger is better”, and the S/N ratio has a characteristic of “nominal-the-better”. 36
The S/N ratio has the characteristic of “smaller is better”: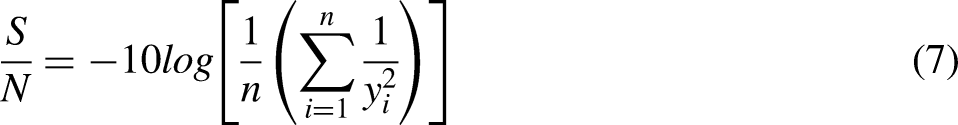


Since the study's main objective is to obtain a higher peak in-cylinder pressure with a minor knock tendency, the S/N ratio with a “smaller is better” characteristic (equation 7) will convert the knock tendency response result into S/N. The S/N ratio with a “larger is better” characteristic (equation 8) will be chosen for the peak in-cylinder pressure.
Grey relational analysis
The S/N ratio of the Taguchi method is often adopted to quantify the effect of multiple parameters on one sole response characteristic. 37 However, the Taguchi method has poor adaptability when applied to optimizing multiple objections with different signal-to-noise ratios. Therefore, to investigate the influence of multiple factors on multiple responses, the gray relation analysis method can be introduced to convert multiple responses into an equivalent response by considering the gray relation between multiple responses.38,39 There are three main steps in the grey correlation analysis method.
Step 1:
Typically, the analyzed responses often have many differences due to their dimensions and units, bringing difficulties to the multi-response conversion in the grey relational analysis methods. Thus, the grey relational analysis method first normalizes the response results Yij as Xij (0 < Xij < 1). to eliminate the above difficulties. There are three different formulas used to normalize the corresponding results. 36
The normalization formula of “the bigger, the better”:

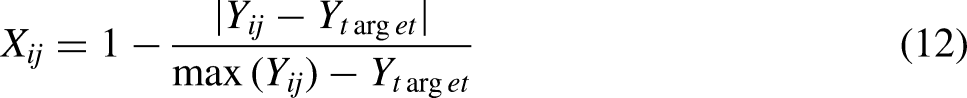
The peak in-cylinder pressure simulation results are normalized by equation (10); meanwhile, the knock tendency is normalized according to equation (11).
Step 2:
The gray correlation coefficient is calculated using equations (13)–(16) to express the connection between the ideal and normalized simulation results. Equations (14)–(16) are adopted to calculate the deviation between the reference and comparability sequences.
31


In this study, the deviation Δ i (j) between the jth normalized response results (comparability sequence) of the ith simulation and the ideal normalized results (reference sequence) of the jth response is calculated by formula 16, where i is from 1 to 16, and j is from 1 to 2.
Step 3:
To convert the two responses (ηi1 and ηi2) into an equivalent response, equation (17) is used to calculate the gray correlation gradient (GCG) of the equivalent response.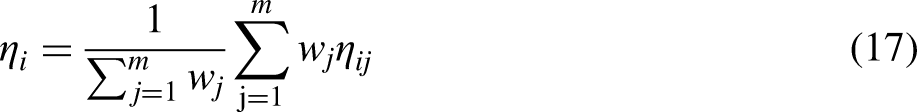
The results of the normalized response, grey relational coefficients, and grey relational grade of the equivalent response calculated based on peak in-cylinder pressure and knock tendency are displayed in Table A1 (in the Appendix).
Results and discussions
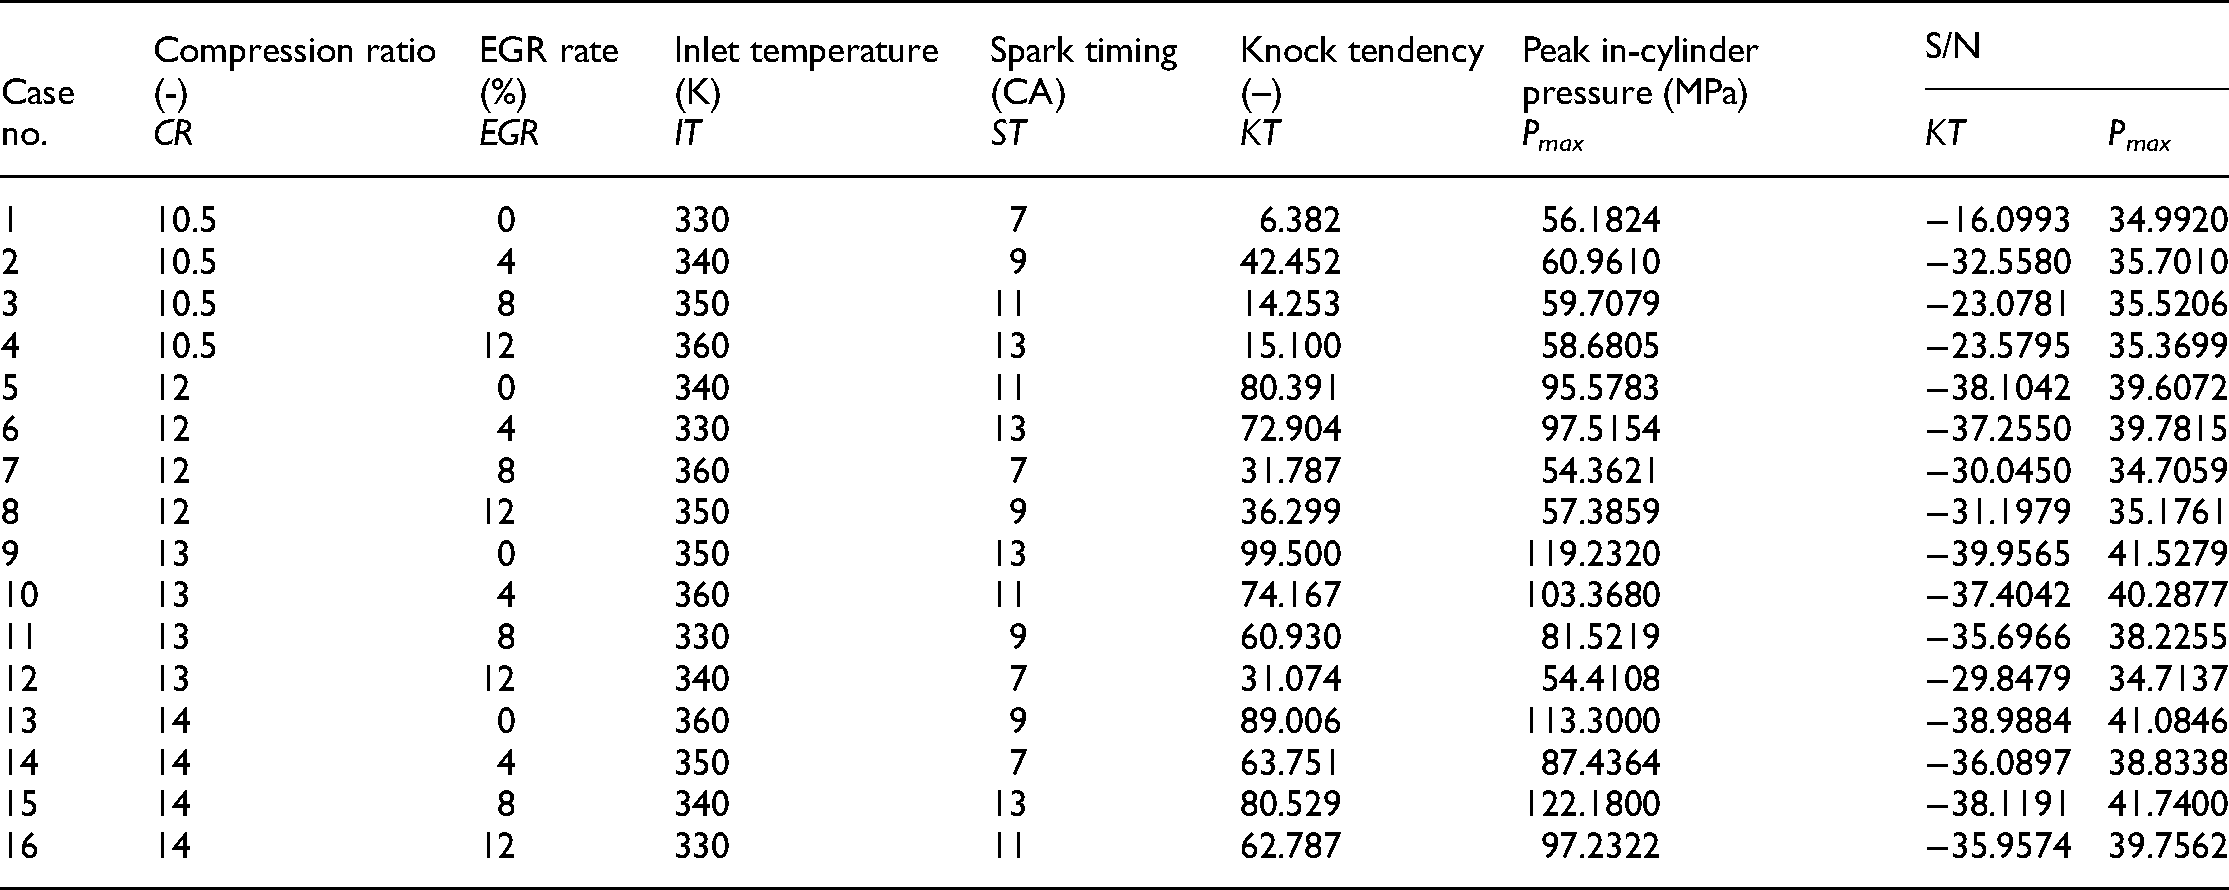
According to the simulation sequence in Table 6, the results of the knock tendency and the in-cylinder pressure for each simulation number are illustrated in Figures 4 and 5, respectively. For obtaining the influence order and contribution rate of four parameters on the knock tendency and the peak in-cylinder pressure, the simulation results will be converted into an S/N ratio for analysis purposes. The S/N ratio for the knock tendency and the peak in-cylinder pressure is tabulated in Table 7.

The results of 16 sets of knock tendency simulation based on Table 6.

The results of in-cylinder pressure simulation based on Table 6.
Simulation plan of L16 for the knock tendency and the peak in-cylinder pressure with their S/N ratio.
Knock tendency response
Based on Table 7, the S/N ratio of each level under each parameter for the knock tendency can be calculated. For example, to calculate the four levels of signal-to-noise ratio CRSN1 (case sequence 1–4), CRSN2 (case sequence 4–8), CRSN3 (case sequence 9–12), and CRSN4 (case sequence 13–16) under the compression ratio of the parameters affecting the knock tendency:

Main effect plots for S/N ratios (response: KT).

The contribution rate of each parameter to KT, Pmax, and equivalent response.
Response table for S/N ratios (KT).

According to Figures 6 and 8, to obtain the slightest knock tendency, the best parameters for knock tendency are selected as the compression ratio at level 1 (CR = 10.5), the EGR rate at level 4 (EGR = 12%), inlet temperature at level 1(IT = 330 K) and the spark timing at level 1 (ST = 7BTDC). According to Table 8 and Figure 8, it is observed that for the knock tendency, the contribution rates of compression ratio, EGR rate, spark timing, and inlet temperature are 45.9%, 19.46%, 22.98%, and 11.66%, respectively. The compression ratio has the most significant influence on knock tendency. The effect of spark timing and EGR rate on knock tendency is similar in importance and lower than the compression ratio. The change of inlet temperature has the slightest impact on knock tendency compared with the other three parameters. Therefore, the order of the most influential factors of knock tendency is compression ratio, spark timing, EGR rate, and inlet temperature. The knock is caused by the spontaneous combustion of the end mixture, which is inseparable from the temperature and pressure of the mixture. According to Figure 6, the minimum knock tendency is obtained at the smallest value of the compression ratio. A smaller compression ratio allows the temperature and pressure of the end mixture to change less drastically than a larger compression ratio, which also reduces the knock tendency. The reason for the reduction in knock tendency with EGR technology is that EGR increases the specific heat capacity of the gas in the cylinder and thus reduces the temperature and pressure in the cylinder. The higher the EGR rate, the more pronounced the knock suppression. When the inlet temperature increases, it causes the mixture temperature in the cylinder to rise after the compression stroke, which increases the propensity for detonation. The earlier the spark timing, the more the mixture burns during the compression stroke, which increases the temperature and pressure to enhance the knock tendency. Therefore, the retardation of spark timing is beneficial to suppress knock.
Peak in-cylinder pressure response
Table 7 shows the main influence diagram of the peak in-cylinder pressure signal-to-noise ratio at different levels under different parameters. After a calculation similar to equation (18), the S/N ratio of each level under each parameter for the peak in-cylinder pressure is presented in Table 9. The contribution rate of each parameter to peak the in-cylinder pressure is also displayed in Figure 8. For the maximum pressure in the cylinder, the compression ratio at level 4 (CR = 14), EGR rate at level 1 (EGR = 0%), inlet temperature at level 1 (IT = 330 K), and spark timing at level 4 (ST = 13BTDC) are selected to get the biggest peak in-cylinder pressure. According to Table 9 and Figure 8, it can be identified that for the maximum in-cylinder pressure, the contribution rates of compression ratio, EGR rate, spark timing, and inlet temperature are 40.56%, 24.94%, 3.47%, and 31.03%, respectively. The change of compression ratio has a significant influence on the knock tendency. The change of spark timing has a degree of effect on knock tendency. The spark timing has a more significant influence than the EGR rate. The change of inlet temperature has no significant influence on knock tendency compared with the other three parameters. Thus, the factors that have the greatest influence on the peak in-cylinder pressure are compression ratio, spark timing, EGR rate, and inlet temperature. By looking at Figure 7, the maximum in-cylinder pressure is obtained at the maximum compression ratio. This is because the compression ratio becomes bigger, and the temperature and pressure of the mixture in the cylinder become larger at the end of the compression stroke, thus making the maximum in-cylinder pressure of the internal combustion engine larger. As the EGR increases the specific heat capacity of the cylinder and slows down the flame propagation in the cylinder, the maximum pressure in the cylinder decreases as the EGR rate increases. The maximum in-cylinder pressure is obtained at the lowest level of the EGR rate. An earlier spark timing allows an earlier flame formation in the cylinder. As the flame spreads and the mixture burns in the cylinder, the pressure in the cylinder increases rapidly. Therefore, the maximum in-cylinder pressure is obtained at the maximum spark timing angle.

Main effect plots for S/N ratios (response: Pmax).
Response table for S/N ratios (Pmax).

Equivalent response
The gray relational analysis method converts the two responses of knock tendency and peak in-cylinder pressure into an equivalent response to analyzing multiple parameters’ effects on the two responses. For applying the grey relational analysis method to analyze the effect of multiple parameters on the knock tendency and the maximum pressure in the cylinder, it is necessary to normalize the S/N of the knock tendency and the peak in-cylinder pressure in Table 7. By using equations (10), (11), (13), and (17), the results of the normalized response, grey relational coefficients, grey relational grade, and ranks are listed in Table A1. The fluctuation of the grey relational grade is presented in Figure 9. The gray relational grade determines the equivalent response characteristics, indicating that a large gray relational grade represents a good characteristic of the equivalent response. The parameters of the 15th simulation can obtain the best equivalent response characteristics in these 16 simulations. Based on the data in Table A1, using the calculation methods in Tables 8 and 9, the average grey relational grade of each level under each factor can be obtained, as listed in Table 10. Figure 10 displays the main influence of different levels under each factor on the gray relational grade of equivalent response characteristics. The contribution rate of each parameter to the equivalent response is also listed in Figure 8.
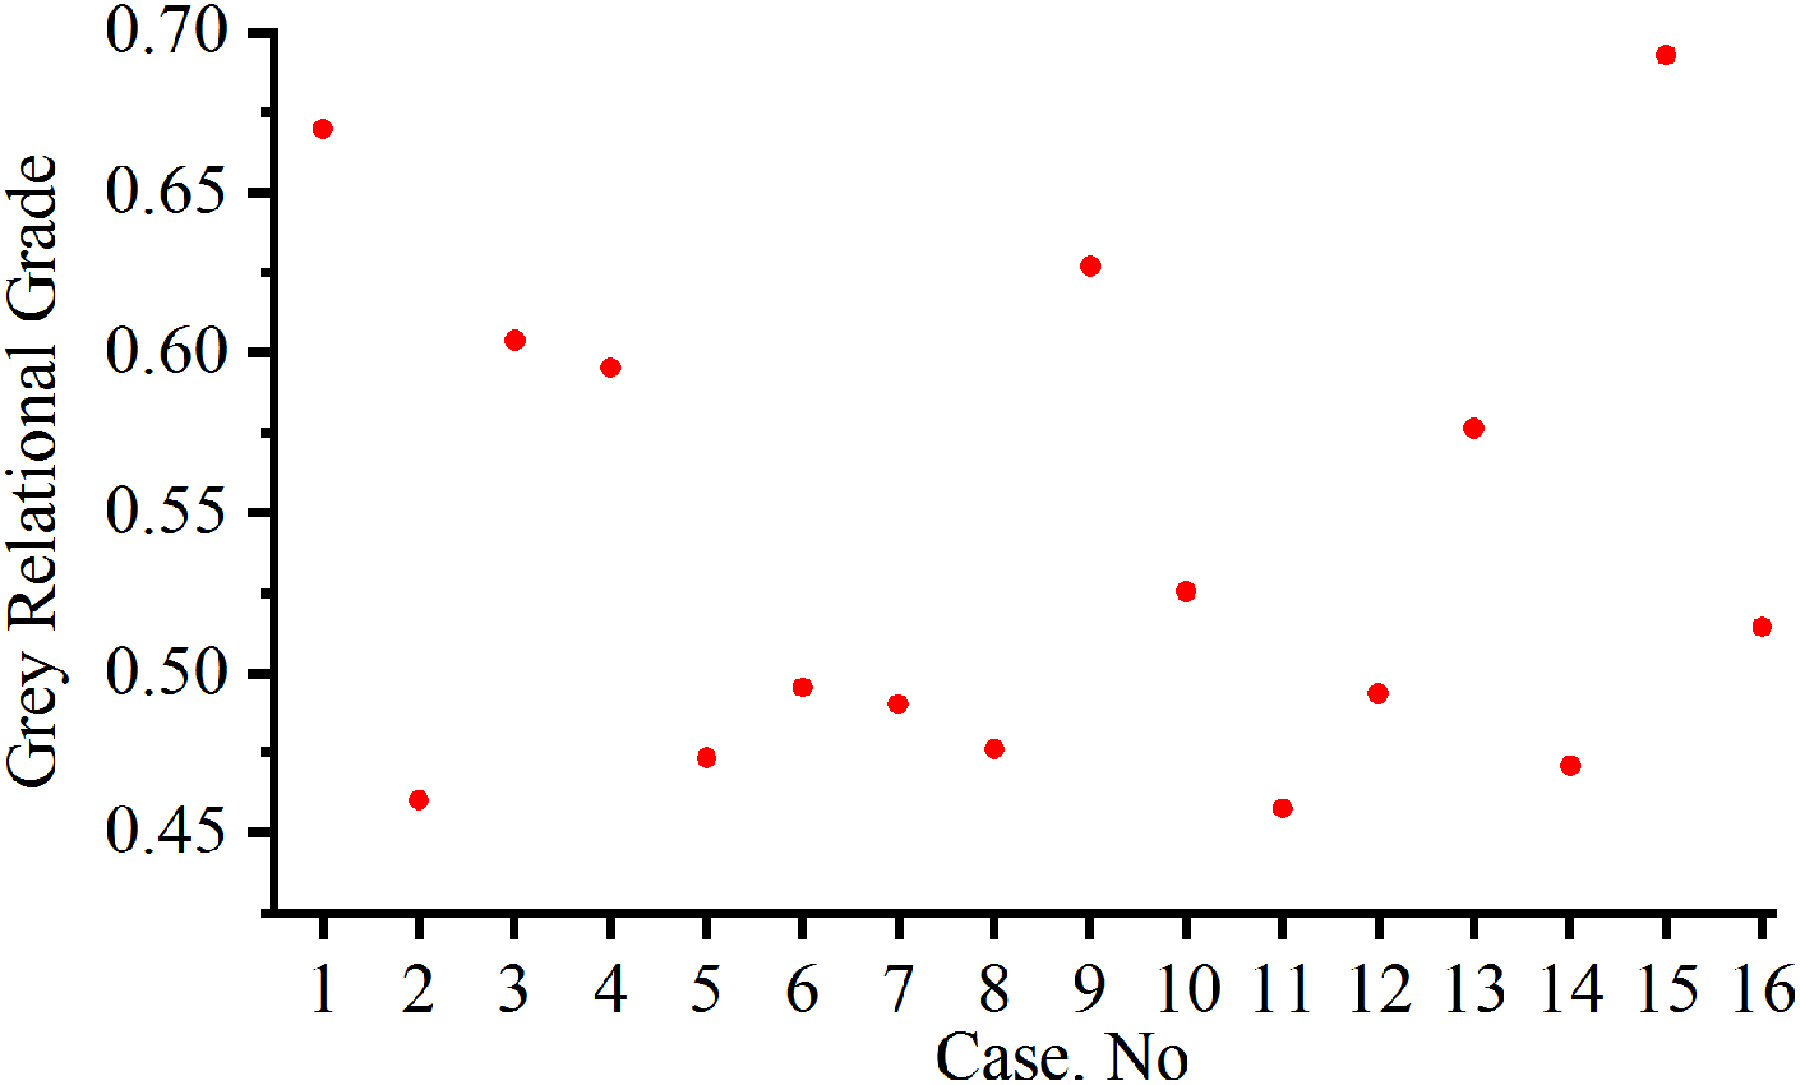
Grey relational grade for the equivalent response.

Main effect plots for the grey relational grade (response: equivalent response).
Mean of grey relational grade (equivalent response).

For the equivalent response, according to Figures 9 and 10, and Table 10, the larger the grey relational grade value of each level under each parameter, it means that the level is the best in the parameter. To obtain the best equivalent response, the compression ratio at level 1 (CR = 10.5), the EGR rate at level 1 (EGR = 0%), the inlet temperature at level 4 (IT = 360 K), and the spark timing at level 4 (ST = 13BTDC) should be selected. According to Figure 8 and Table 10, it is found that for the equivalent response, the contribution rate of the compression ratio is 30.39%, the contribution rate of the EGR rate is 30.45%, the contribution rate of the inlet temperature is 5.19%, and the contribution rate of the spark timing is 33.97%. The spark timing has the most significant influence on the equivalent response compared with the other three parameters. The EGR rate takes a slightly more significant influence on the equivalent response than the compression ratio. The slightest effect on the equivalent response is the inlet temperature. The most influential factors on the equivalent response are spark timing, EGR rate, compression ratio, and inlet temperature. With a combination of in-cylinder burst tendency and maximum in-cylinder pressure, the best equivalent response is obtained at the smallest compression ratio. This is because larger compression ratios have a severe knock tendency. However, the use of larger EGR rates results in significant pressure losses. A smaller EGR and a smaller compression ratio allow the internal combustion engine to use an earlier spark timing to increase the maximum in-cylinder pressure without causing severe knock.
Conclusion
This paper proposes for the first time to quantify the effect of multiple engine parameters on the knock and the peak in-cylinder pressure using the Taguchi-gray method. Firstly, an accurate engine 3D mesh model was created and calibrated based on the bench experiment data. Next, the L16 orthogonal simulation with four parameters and four levels was designed by Taguchi's method. Then, the simulation results of the burst tendency and the maximum pressure in the cylinder were analyzed using Taguchi's gray method. Finally, the following conclusions can be obtained.
Exploring the influence of multiple parameters on the knock tendency separately, The contribution rate of compression ratio, spark timing, EGR rate, and inlet temperature to the knock tendency is 45.9%, 22.98%, 19.46%, and 11.66%, respectively. Therefore, the factors significantly impacting the knock tendency are compression ratio, spark timing, EGR rate, and inlet temperature. The parameter selection: CR = 10.5, EGR = 12%, IT = 330 K, and ST = 7BTDC can obtain the minimum internal combustion engine knock tendency. Exploring the influence of multiple parameters on the average maximum pressure in the cylinder separately, The contribution rate of compression ratio, spark timing, EGR rate, and inlet temperature to the peak in-cylinder pressure is 40.56%, 31.03%, 24.94, and 3.47%, respectively. Thus, the factors that have the most significant influence on the peak in-cylinder pressure are compression ratio, spark timing, EGR rate, and inlet temperature. Parameter selection: CR = 14, EGR = 0%, IT = 330 K and ST = 13BTDC can obtain the maximum in-cylinder pressure. Although the four parameters are ranked in the same order for effect on the knock tendency and the maximum in-cylinder pressure responses, the optimal level of the parameters to obtain the minimum knock tendency and the maximum in-cylinder pressure is different. The contribution rate of each parameter to the knock tendency and the maximum in-cylinder pressure is also different. Compared to the other three parameters, the compression ratio has a dominant influence on the knock tendency and peak in-cylinder pressure responses. Exploring the influence of multiple parameters on the equivalent response, The contribution rate of compression ratio, spark timing, EGR rate, and inlet temperature to the propensity to detonation is 30.39%, 33.97%, 30.45%, and 5.19%, respectively. The most influential factors for equivalent response are spark timing, EGR rate, compression ratio, and inlet temperature. Parameter selection: CR = 10.5, EGR = 0%, IT = 360 K and ST = 13BTDC can obtain the best equivalent response.
The contribution rates of the four parameters to knock are different based on the results. Using the difference in parameter contribution rate provides a new idea for coordinated adjustment of parameters for knock suppression optimization. Because Taguchi's method uses a limited number of simulations to explore the optimal parameters of knock, it is impossible to find the optimal parameter combination in the overall situation. Therefore, future research uses optimization algorithms to analyze the optimal parameter combination that affects knock globally.
Footnotes
Acknowledgements
This research is funded by The National Key R&D Program of China (Grant No.2019YFE0101900). The authors acknowledge “State Key Laboratory of Automotive Simulation and Control, Jilin University.” and “China Automotive Technology and Research Center Co., Ltd” for providing experimental equipment and workshops for this study.
Author contributions
Yalin Kou designed the study and defined intellectual content, literature search, data acquisition, data analysis, and manuscript preparation. Ying Gao provided funding assistance for the study. Yurang Wang and Yuelin You revised the manuscript. Yuelin You carried out grammar modification and manuscript editing.
Declaration of conflicting interests
The author(s) declared no potential conflicts of interest with respect to the research, authorship, and/or publication of this article.
Funding
The author(s) disclosed receipt of the following financial support for the research, authorship, and/or publication of this article: This work was supported by the National Key R&D Program of China (grant number 2019YFE0101900).
Availability of data and material
The authors confirm that the data supporting the findings of this study are available within the article.
Author biographies
Yalin Kou, is a Ph.D candidate at the College of Automotive Engineering for studies in the State Key Laboratory of Automotive Simulation and Control of Jilin university. His research interests are power machinery and engineering and internal combustion engine optimization.
Ying Gao, obtained her PhD in power machinery and engineering from Jilin University. She is a professor at Jilin University and Director of the co-simulation experiment of Jilin University-AVL Company at Jilin University.
Yuelin You, is a master student at the College of Automotive Engineering for studies in the State Key Laboratory of Automotive Simulation and Control of Jilin university.
Yurang Wang, is a master student at the College of Automotive Engineering for studies in the State Key Laboratory of Automotive Simulation and Control of Jilin university.
Appendix
Normalized response, grey relational coefficients, and grey relational grade for the equivalent response.

| Case no | Normalized |
Normalized |
Δ i (j) | grey relational coefficients | ηi | Rank | ||
|---|---|---|---|---|---|---|---|---|
| Reference sequence | 1 | 1 | Δ i (1) | Δ i (2) | KT(ηi1) | Pmax(ηi2) | ||
| 1 | 1.0000 | 0.0268 | 0.0000 | 0.9732 | 1.0000 | 1.0000 | 0.6697 | 2 |
| 2 | 0.6126 | 0.0973 | 0.3874 | 0.9027 | 0.5635 | 0.5635 | 0.4600 | 15 |
| 3 | 0.9155 | 0.0788 | 0.0845 | 0.9212 | 0.8554 | 0.8554 | 0.6036 | 4 |
| 4 | 0.9064 | 0.0637 | 0.0936 | 0.9363 | 0.8423 | 0.8423 | 0.5952 | 5 |
| 5 | 0.2052 | 0.6077 | 0.7948 | 0.3923 | 0.3862 | 0.3862 | 0.4733 | 13 |
| 6 | 0.2856 | 0.6363 | 0.71443 | 0.3637 | 0.4117 | 0.4117 | 0.4953 | 9 |
| 7 | 0.7272 | 0.0000 | 0.2728 | 1.0000 | 0.6470 | 0.6470 | 0.4902 | 11 |
| 8 | 0.6787 | 0.0446 | 0.3213 | 0.9554 | 0.6088 | 0.6088 | 0.4762 | 12 |
| 9 | 0.0000 | 0.9565 | 1.0000 | 0.0435 | 0.3333 | 0.3333 | 0.6267 | 3 |
| 10 | 0.2721 | 0.7226 | 0.7279 | 0.2774 | 0.4072 | 0.4072 | 0.5252 | 7 |
| 11 | 0.4142 | 0.4005 | 0.5858 | 0.5995 | 0.4605 | 0.4605 | 0.4576 | 16 |
| 12 | 0.7348 | 0.0007 | 0.2652 | 0.9993 | 0.6535 | 0.6535 | 0.4935 | 10 |
| 13 | 0.1126 | 0.8691 | 0.8873 | 0.1309 | 0.3604 | 0.3604 | 0.5764 | 6 |
| 14 | 0.3839 | 0.4877 | 0.6161 | 0.5123 | 0.4480 | 0.4480 | 0.4710 | 14 |
| 15 | 0.2037 | 1.0000 | 0.7963 | 0.0000 | 0.3857 | 0.3857 | 0.6929 | 1 |
| 16 | 0.3943 | 0.6321 | 0.6057 | 0.3679 | 0.4522 | 0.4522 | 0.5142 | 8 |